1 increasing use of the capitated model for dual eligibles: cost savings estimates and public policy...
TRANSCRIPT

1
Increasing Use of the Capitated Model for Dual Eligibles: Cost Savings Estimates and Public
Policy Opportunities MEDIA BRIEFING
November 12th, 20082 pm ET
(800) 895-0198Conference ID: ACAP1112

Agenda
Introductions Opening Comments
– Thomas Johnson, Executive Director - Medicaid Health Plans of America
– Mary Kennedy, Director of Medicare - Association for Community Affiliated Plans
Study Design and Findings– Joel Menges, Vice President -
The Lewin Group
Plan Experiences in Serving Duals
– Jill Bell, Vice President Public Affairs - Passport Health Plan (MHPA member)
– Kathy Oestreich, CEO - University Physicians Health Care (ACAP member)
Policy Issues and Summary Questions
2

Increasing Use of the Capitated Model for Dual Eligibles
Estimates nationwide and state-by-state potential savings if dual eligibles were served in a fully integrated capitated setting
– Managed Care Organizations would receive capitation from both Medicaid and Medicare and would be responsible for coordinating all services
This study by the Lewin Group is co-funded by Medicaid Health Plans of America and the Association for Community Affiliated Health Plans
This study is a natural follow on to the 2006 Lewin Group report “Medicaid Capitation Expansion’s Potential Cost Savings”
– The earlier study focused on Medicaid-only subgroups– This new study focuses entirely on dual eligibles
3

Policy Advantages of Using a Fully Integrated Model for Dual Eligibles Are Compelling Large-scale savings are available
– Each percentage point reduction nationwide will yield more than $70 billion in savings across the 15 year timeframe
A well-designed integrated care model should also improve dual eligibles’ clinical outcomes relative to the unmanaged fee-for-service setting
– A recent Wennberg study indicates that nearly 1/3 of spending on chronically ill populations is unnecessary, and that improving care would likely lower costs
4

5
Who are the duals?
Over 7.5 million people who use Medicare and Medicaid to meet their health needs
Most duals receive full Medicaid coverage; 1.3 million receive help only with cost sharing and/or payment of Part B premiums

Health Coverage for Duals Dominant (non)system
Consumer acts a “general contractor” to manage these pieces:– Medicare FFS– Medicare Part D– Medicare Supplement or
payment of cost sharing by states
– Medicaid Acute Care (FFS or in a plan )
– Medicaid LTC or HCBS– Mental Health – Medicaid drugs
Integrated Care Model Care manager acts as the
concierge or navigator within a plan that covers all services across Medicare and Medicaid and acute and long term care
Plan ideally provides:
– Assessment of need and individualized, chronic care plan
– One ID, consolidated notices, appeals and grievances
6

7
Estimated CY2008 Spending On Duals: $239 BillionThis Level Of Spending Is…
40% of the nations’ Medicaid spending 25% of Medicare expenditures
– The total spending for duals is effectively hidden in the budgets of two programs with no clear accountability for spending, access or quality of care
10% of National Health Spending Larger than the annual revenue of all but two U.S.
corporations (Wal-Mart and Exxon Mobil) Three times the Federal budget for the Department of
Education and the Department of Energy combined Approximately 1.6% of GDP
Study Design and Findings
8
Joel Menges, Vice PresidentThe Lewin Group
9
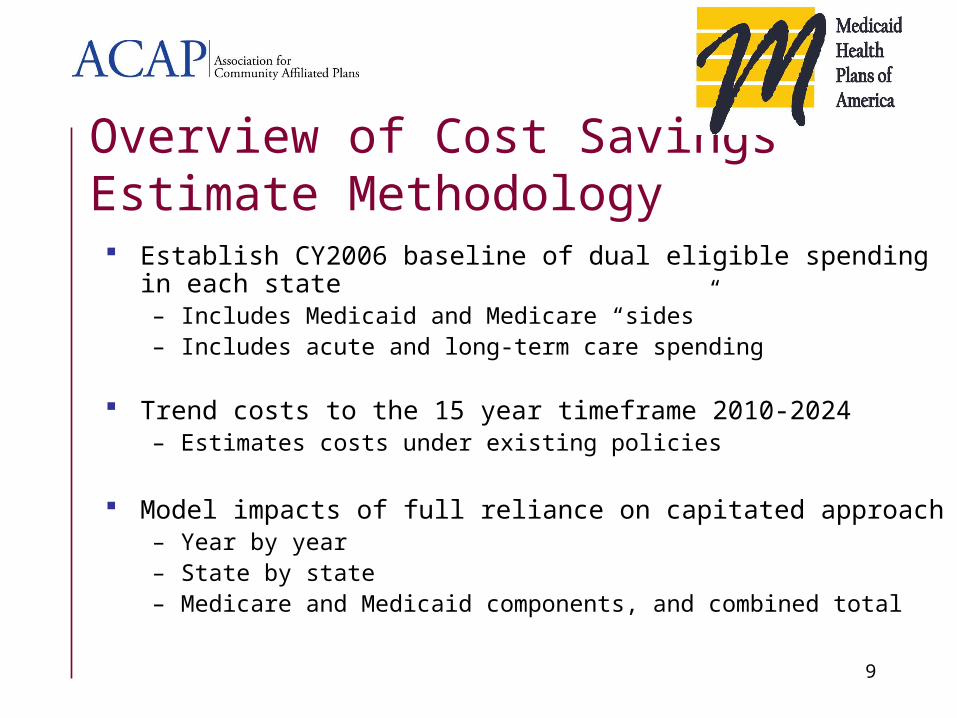
Overview of Cost Savings Estimate Methodology Establish CY2006 baseline of dual eligible spending in each state
– Includes Medicaid and Medicare “sides”– Includes acute and long-term care spending
Trend costs to the 15 year timeframe 2010-2024 – Estimates costs under existing policies
Model impacts of full reliance on capitated approach– Year by year– State by state– Medicare and Medicaid components, and combined total

10
Baseline Costs, 2005
Estimated Actual 2005 Expenditures, Dual Eligibles
Medicaid: $121.7 billion Medicare: $64.5 billion Total: $186.2 billion
Adjusted figures after moving Medicaid pharmacy costs ($23 billion) to Medicare to simulate Part D
Medicaid: $98.7 billion (53% of total) Medicare: $87.5 billion (47% of total) Total: $186.2 billion

11
Cost Trending Under Existing Policies
Dual eligibles costs will increase steadily for two reasons– Increase in number of eligibles – estimated growth is from 7.5 million persons in
2005 to 9.9 million in 2024 (1.5% annual growth)
– Increase in per capita costs – annual trend of 7% assumed for both Medicare and Medicaid
Annual spending is estimated to reach $777 billion in 2024 – more than three times current levels
– Across 15 year period 2010-2024, spending on dual eligibles is estimated to be $7 trillion
– Annual per capita costs estimated to rise from approximately $25,000 in 2005 to nearly $80,000 in 2024
– Study presents these figures state by state, year by year

12
Estimated Medical Cost Impacts of Capitation
– Inpatient per capita costs usually reduced by 20% (efforts were made to leave IGTs, federal maximization programs unaffected)
– “Impactable” nursing home costs reduced by 25%, but little nursing home spending is initially impactable (overall nursing home costs reduced 1.3% in Year 1, growing to 13.5% in Year 15)
• Yearly home health costs assumed to increase by same percentage that nursing home costs decrease
– Year 1 ICF/MR costs reduced by 2%; growing to 7.5% by Year 11
– Other Medicaid costs reduced by 5%, no change assumed for personal support services
– Medicare acute care costs reduced by 15%
– Pharmacy costs reduced by 15%

13
Administrative Cost Allocations
– Administration and profit are collectively assumed to represent 7% of total medical costs
– Approximate estimates are 5% of medical costs for administration, 2% for profit or operating margin
– The relatively low percentage allocation for administration is viable due to large dollar volume of “pass through” nursing home costs and the very large per capita medical cost for other services
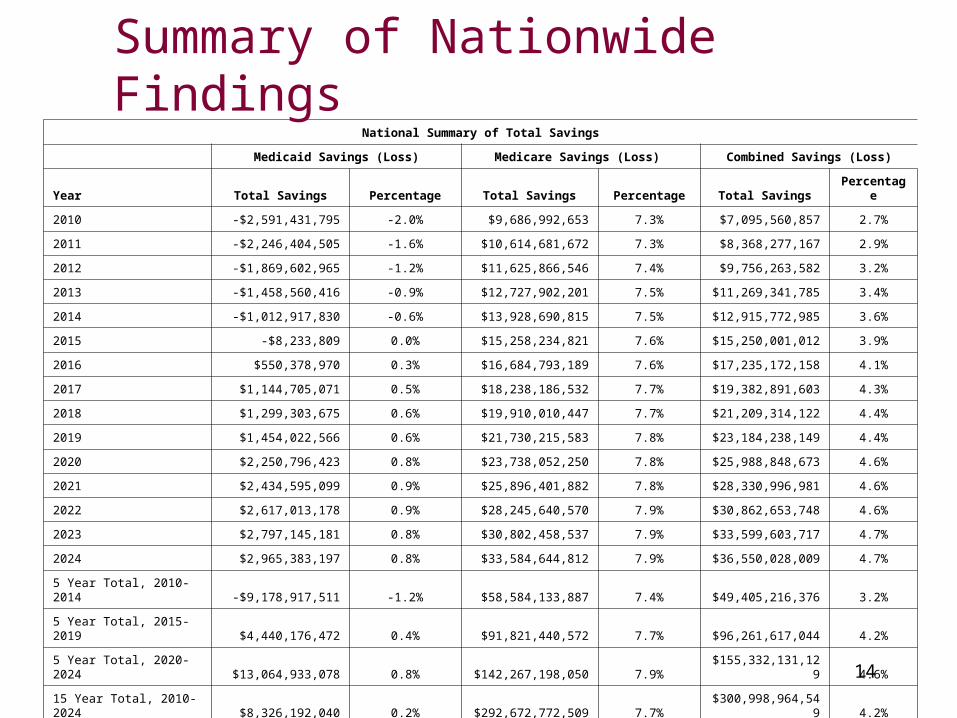
National Summary of Total Savings
Medicaid Savings (Loss) Medicare Savings (Loss) Combined Savings (Loss)
Year Total Savings Percentage Total Savings Percentage Total SavingsPercentag
e
2010 -$2,591,431,795 -2.0% $9,686,992,653 7.3% $7,095,560,857 2.7%
2011 -$2,246,404,505 -1.6% $10,614,681,672 7.3% $8,368,277,167 2.9%
2012 -$1,869,602,965 -1.2% $11,625,866,546 7.4% $9,756,263,582 3.2%
2013 -$1,458,560,416 -0.9% $12,727,902,201 7.5% $11,269,341,785 3.4%
2014 -$1,012,917,830 -0.6% $13,928,690,815 7.5% $12,915,772,985 3.6%
2015 -$8,233,809 0.0% $15,258,234,821 7.6% $15,250,001,012 3.9%
2016 $550,378,970 0.3% $16,684,793,189 7.6% $17,235,172,158 4.1%
2017 $1,144,705,071 0.5% $18,238,186,532 7.7% $19,382,891,603 4.3%
2018 $1,299,303,675 0.6% $19,910,010,447 7.7% $21,209,314,122 4.4%
2019 $1,454,022,566 0.6% $21,730,215,583 7.8% $23,184,238,149 4.4%
2020 $2,250,796,423 0.8% $23,738,052,250 7.8% $25,988,848,673 4.6%
2021 $2,434,595,099 0.9% $25,896,401,882 7.8% $28,330,996,981 4.6%
2022 $2,617,013,178 0.9% $28,245,640,570 7.9% $30,862,653,748 4.6%
2023 $2,797,145,181 0.8% $30,802,458,537 7.9% $33,599,603,717 4.7%
2024 $2,965,383,197 0.8% $33,584,644,812 7.9% $36,550,028,009 4.7%
5 Year Total, 2010-2014 -$9,178,917,511 -1.2% $58,584,133,887 7.4% $49,405,216,376 3.2%
5 Year Total, 2015-2019 $4,440,176,472 0.4% $91,821,440,572 7.7% $96,261,617,044 4.2%
5 Year Total, 2020-2024 $13,064,933,078 0.8% $142,267,198,050 7.9%$155,332,131,12
9 4.6%
15 Year Total, 2010-2024 $8,326,192,040 0.2% $292,672,772,509 7.7%
$300,998,964,549 4.2%
Summary of Nationwide Findings
14

Summary of Nationwide Savings Findings Immediate savings of 2.7% for populations put into integrated
capitation model (across Medicare and Medicaid funds)
Savings entirely occur on Medicare “side” during first five years (creates policy challenges so that states can avoid Medicaid losses during this timeframe)
Savings compound favorably over time, reaching 4.7% of baseline costs by Year 15
15
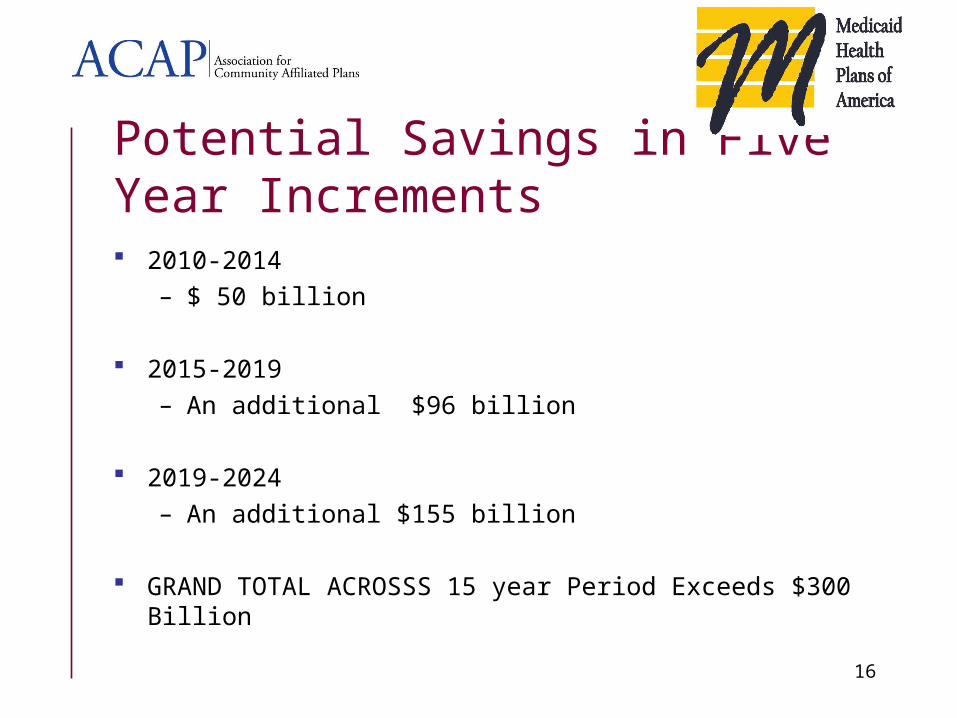
Potential Savings in Five Year Increments 2010-2014
– $ 50 billion
2015-2019– An additional $96 billion
2019-2024– An additional $155 billion
GRAND TOTAL ACROSSS 15 year Period Exceeds $300 Billion
16

Large-Scale Dollar Savings Would Occur At State Level
StateTotal Savings
2010-2014Total Savings
2015-2019Total Savings
2020-2024
Ohio $1,393,584,406 $3,501,752,472 $5,948,592,506
Virginia $961,777,772 $1,847,126,425 $2,944,675,321
South Dakota $80,656,702 $199,531,723 $343,069,940
17
Table below summarizes savings impacts in a large state (Ohio), medium-sized state (Virginia) and a small state (South Dakota)
The smallest cumulative savings across 15 years is $327 million (Wyoming); the largest savings is $34 billion in California
Full report shows Federal and State share of project savings in each state
Figures shown represent total savings across Medicare and Medicaid
Plan Experiences in Serving Duals
Jill Bell, Vice President Public Affairs Passport Health Plan
Louisville, Kentucky
Kathy Oestreich, CEO
University Family Physicians
Tucson, Arizona 18

Policy Implications
19
20.
Several Factors Limit Use of Capitation
Comprehensive benefits in FFS setting for dual eligibles
Absence of clear Medicaid policy on dual integration; voluntary enrollment on primary payer (Medicare) side
Inability for states to share in overall savings– Early year cost savings typically accrue only to Medicare, with
states not earning Medicaid savings until out-years– However, states determine whether capitated programs for
duals are developed and implemented– State staff for planning are diverted to immediate budget crisis
21
Potential Features Of A Successful Program for Duals
Federal program created giving each state the option to create an integrated care program
States implementing this option would select the subgroups to be enrolled (e.g. which counties, whether any duals in these counties will be excluded)
States could deploy mandatory enrollment or opt-out States could conduct procurement for health plans to participate or create
an “application model” Objective process would occur to assist duals in selecting or being
assigned to health plans (e.g. no direct marketing by MCOs) Enabling legislation might include regulations regarding new member
orientation, ongoing care coordination (e.g. individualized care plans), minimum provider network composition, required state oversight, etc.
Capitation rates would encompass all Medicare and Medicaid benefits

Policy Issue: Incentives for States
For states to prioritize pursuing these programs, they need access to the overall savings that occur– States are unlikely to “invest” in capitated model for 5 years
before realizing savings on duals alone– Creative arrangement with CMS (e.g. 50/50 sharing of overall
savings between state and federal government) is likely needed to spur significant growth of capitation
– Grants that cover start up costs to develop rates, contracts, beneficiary education would help
– Another option is for CMS to “block grant” the Medicare portion of dual eligibles’ costs to states, then allow states to implement fully integrated model with combined pool of funds (as suggested in a Galen Institute report)
22
Policy Issue: Achieving Significant Program Scale Model assumes all full dual populations are mandatorily
enrolled for all acute and long term care services across both Medicare and Medicaid services
“Opt-out options” may be more politically feasible than mandatory approaches; have worked well in some states
Phase-in of populations may allow more movement towards integrated care and time to develop appropriate care management models
Phase-in or carve-out of LTC services, especially some specialized home and community-based services, may be appropriate in some states
23
Closing Comments
The savings and care management opportunities are compelling even when scaled back
Questions?
24