nutrition assistance program report series · national‐ and state‐level estimates of wic...
TRANSCRIPT
Nutrition Assistance Program Report Series Office of Research and Analysis
Special Nutrition Programs Report No. WIC‐11‐ELIG
Volume II
Appendices: National and StateLevel Estimates of
Special Supplemental Nutrition Program for Women, Infants, and
Children (WIC) Eligibles and Program Reach, 2000–2009
Final Report
December 2011
Non-Discrimination Policy
The U.S. Department of Agriculture (USDA) prohibits discrimination in all its programs and activities on the basis of race, color, national origin, age, disability, and where applicable, sex, marital status, familial status, parental status, religion, sexual orientation, genetic information, political beliefs, reprisal, or because all or part of an individual’s income is derived from any public assistance program. (Not all prohibited bases apply to all programs.) Persons with disabilities who require alternative means for communication of program information (Braille, large print, audiotape, etc.) should contact USDA’s TARGET Center at (202) 720-2600 (voice and TDD).
To file a complaint of discrimination, write USDA, Director, Office of Civil Rights, 1400 Independence Avenue, SW, Washington, DC 20250-9410 or call (800) 795-3272 (voice) or (202) 720-6382 (TDD). USDA is an equal employment opportunity provider and employer.
December 2011
Special Nutrition Programs
Report No. WIC-11-ELIG
Volume II
Appendices:
National and State-Level Estimates of Special
Supplemental Nutrition Program for Women, Infants, and
Children (WIC) Eligibles and Program Reach, 2000–2009
Final Report Authors: David Betson Michael Martinez-Schiferl Linda Giannarelli Sheila Zedlewski Submitted by: The Urban Institute 2100 M Street, NW Washington, DC 20037 Project Director: Sheila Zedlewski
Submitted to: Office of Research and Analysis Food and Nutrition Service 3101 Park Center Drive Alexandria, VA 22302-1500 Project Officer: Grant Lovellette
The opinions expressed reflect those of the authors and not the Urban Institute. This study was conducted under Contract number AG-3198-B-10-0016 with the Food and Nutrition Service. This report is available on the Food and Nutrition Service website: http://www.fns.usda.gov/ora Suggested Citation:
U.S. Department of Agriculture, Food and Nutrition Service, Office of Research and Analysis. National and State-Level Estimates of Special Supplemental Nutrition Program for Women, Infants, and Children (WIC) Eligibles and Program Reach, 2000–2009, by David Betson, Michael Martinez-Schiferl, Linda Giannarelli, and Sheila Zedlewski. Project Officer: Grant Lovellette, Alexandria, VA: December 2011.

This page was left intentionally blank.

Acknowledgements
The authors would like to recognize excellent research assistance from Erika Huber throughout
this project. Grant Lovellette, the FNS project officer, provided helpful guidance throughout the
project and editorial suggestions on this report.

This page was left intentionally blank.
Contents
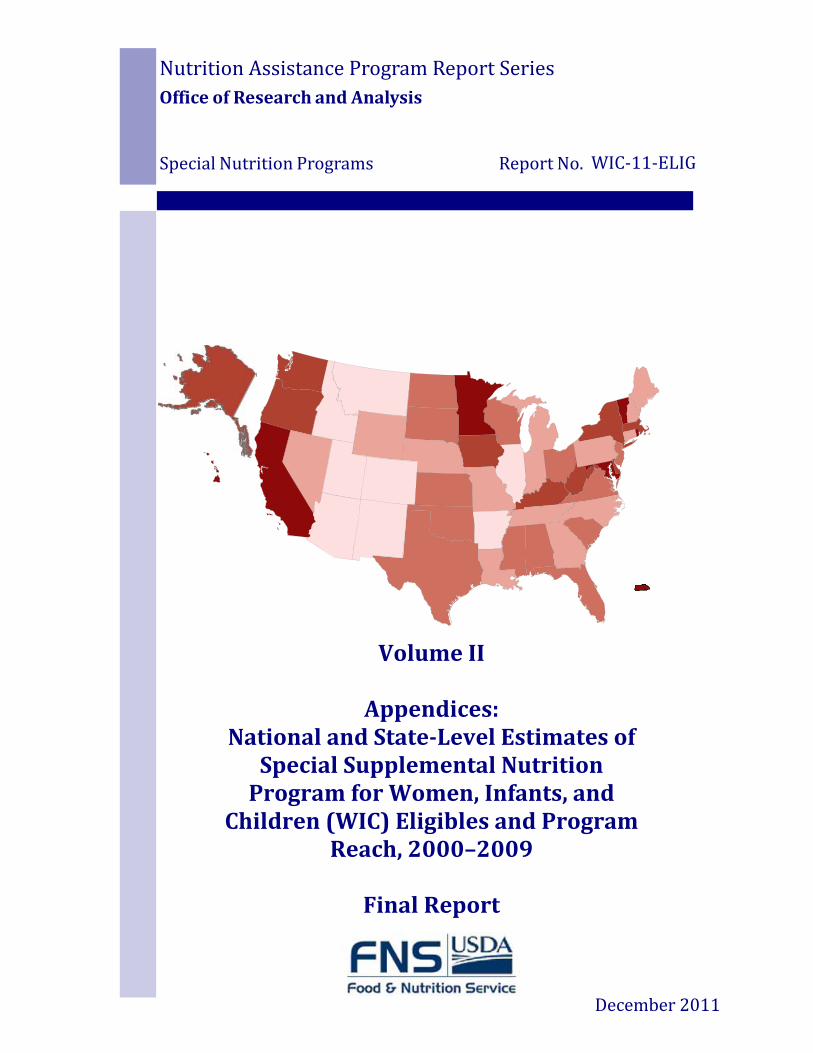
Appendix A. National Estimates: 2008 and 2009 A‐1 Appendix B. Estimating Eligibility in the U.S. Territories B‐1 Appendix C. State Estimates: 2008 and 2009 C‐1 Appendix D. State and Regional Estimates: 2000 through 2007 D‐1 Appendix E. Computing Standard Errors E‐1 Appendix F. Estimating WIC Eligibility among Postpartum Women F‐1 Appendix G. Annual‐to‐Monthly Adjustment Factor G‐1 Appendix H. Coverage Rate Maps H‐1

This page was left intentionally blank.
National‐ and State‐Level Estimates of WIC Eligibles and Program Reach: Appendices Page A‐1
Appendix A
National Estimates: 2008 and 2009
The appendix tables show the detailed estimates of WIC‐eligible individuals by participant group for each calendar year. A brief description of each of these tables is given below. Note that tables A.11a and A.11b provide a comparison of the 2008 national and territory estimates produced in this report with the prior 2008 estimates. These tables document the differences in assumptions and calculations used to produce the estimates. CY 2008 and CY 2009 National Estimates Appendix Tables Tables A.1a and A.1b: Steps and Sources for Update to Estimates of WIC Eligibility for Infants, Young Children, Pregnant Women, and Postpartum Women This table documents the data sources used and summarizes the steps performed in producing national and State eligibility estimates. Table A.2: Estimates of the Average Monthly Number of Individuals Eligible for WIC by Participant Group This table shows the estimated average monthly number of WIC eligibles in the calendar year along with the total number of infants and children. Note that the number of non‐eligible infants and children is calculated as the difference between the total population and the number of eligible infants and children. These figures include infants and children in the U.S. territories. The reader is referred to tables A.6 and C.8 for the steps used in calculating the estimated number of eligible individuals. Table A.3a: Four‐Year Accumulations of Census Estimates and CPS Estimates by Single‐Year Age Groups, Race, and Gender This table shows the four‐year accumulations of census estimates next to the four‐year accumulations of March CPS total weighted populations used to calculate the population factors used to adjust the CPS weights. Table A.3b: Adjustment of March CPS Estimated Population by Race and Gender Using Four‐Year Accumulated Census Estimates to CPS Estimate Ratios This table shows the results of applying the population adjustment factors shown in Table A.3a to the weights on the March CPS.
National‐ and State‐Level Estimates of WIC Eligibles and Program Reach: Appendices Page A‐2
Table A.4: Breastfeeding Adjustment Factor Calculations for WIC‐Eligible Postpartum Women This table shows the calculated national breastfeeding adjustment factors assuming the use of the current NHANES and SIPP adjustments. Table A.5: A Comparison of Estimates of the Average Monthly Number of Individuals Eligible for WIC by Participant Group According to the Year of Breastfeeding Rates Used This table shows the effect of the change in breastfeeding rate from the prior calendar year by applying the breastfeeding rate from the prior calendar year to the current year. The result is the estimated change in the number of eligible postpartum breastfeeding women and postpartum non‐breastfeeding women that can be attributable to the year‐to‐year change in the breastfeeding rate. This table includes infants and children in the U.S. territories. Table A.6: Adjustments for Calculating the Average Monthly Number of Individuals Eligible for WIC by Participant Group This table shows the step‐by‐step adjustments made in calculating the total number of infants, children, and pregnant and postpartum women that are eligible for WIC. Tables A.7a and A.7b: Estimates of the Average Monthly Number of Infants and Children Eligible for WIC by Income and Adjunctive Eligibility in the March 2010 CPS by Demographic Characteristics These two tables show the estimates of WIC‐eligible infants and children (in total and by single year of age) by demographic and income characteristics in the March CPS. Note that these tables do not include infants and children from the territories. Table A.7a shows characteristics of WIC‐eligible infants and children in the March CPS using unadjusted person weights, and Table A.7b shows these characteristics using weights that have been fully adjusted including adjustments for the under/over count in the CPS (population adjustment), monthly income and certification periods (annual‐to‐monthly adjustment), and nutritional risk. The numbers are shown as both total counts and column percentages of eligible individuals by their demographic and income characteristics. A comparison of Table A.7a to Table A.7b shows the impact of the CPS weight adjustments on the national estimates of WIC‐eligible infants and children. Table A.8: Estimates of the Average Monthly Number of Individuals Eligible for WIC by Participant Group: A Comparison of the Change from Year to Year This table shows a comparison of the year‐to‐year change between the overall estimates for the number of WIC‐eligible individuals (including infants and children in the U.S. territories). The percent change for each participant group is calculated.
National‐ and State‐Level Estimates of WIC Eligibles and Program Reach: Appendices Page A‐3
Table A.9: Stepwise Comparison of the Change in Average Monthly Number of Infants and Children Eligible for WIC, as estimated by the March CPS This table shows a step‐by‐step comparison of the difference in estimates from year to year. The percentage change from year‐to‐year is calculated after each adjustment. Table A.10: Standard Error and Coefficient of Variance for National Estimates from the CPS‐ASEC This table presents the standard error of the estimate and coefficient of variance for the national estimates for the total and number eligible for WIC by participant group. Table A.11a and A.11b (CY 2008 estimates only): Estimates of the Average Monthly Number of Individuals Eligible for WIC by Participant Group: A Comparison of the Change from Previous CY2008 Estimates Table A.11a presents an overall comparison of the CY 2008 estimates provided in this report to the CY 2008 estimates provided to FNS by MPR. Shown are the estimates for total and number WIC‐eligible by participant group and the percentage difference between the two estimates. Table A.11b presents a stepwise comparison of the differences in methods used for this report in producing estimates for CY 2008 and the methods used for the prior estimates.
National‐ and State‐Level Estimates of WIC Eligibles and Program Reach: Appendices Page A‐4
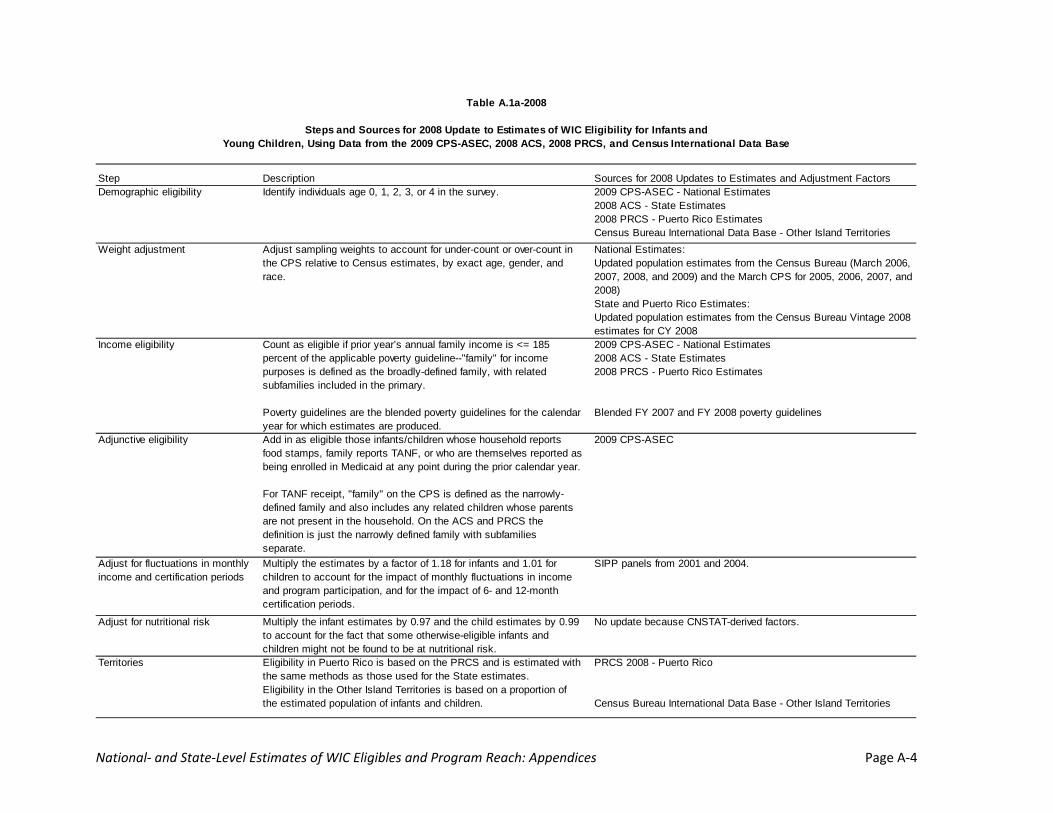
Step Description Sources for 2008 Updates to Estimates and Adjustment Factors Demographic eligibility Identify individuals age 0, 1, 2, 3, or 4 in the survey. 2009 CPS-ASEC - National Estimates
2008 ACS - State Estimates2008 PRCS - Puerto Rico EstimatesCensus Bureau International Data Base - Other Island Territories
Weight adjustment Adjust sampling weights to account for under-count or over-count in the CPS relative to Census estimates, by exact age, gender, and race.
National Estimates:Updated population estimates from the Census Bureau (March 2006, 2007, 2008, and 2009) and the March CPS for 2005, 2006, 2007, and 2008)State and Puerto Rico Estimates:Updated population estimates from the Census Bureau Vintage 2008 estimates for CY 2008
Income eligibility Count as eligible if prior year’s annual family income is <= 185 percent of the applicable poverty guideline--"family" for income purposes is defined as the broadly-defined family, with related subfamilies included in the primary.
Poverty guidelines are the blended poverty guidelines for the calendar year for which estimates are produced.
2009 CPS-ASEC - National Estimates2008 ACS - State Estimates2008 PRCS - Puerto Rico Estimates
Blended FY 2007 and FY 2008 poverty guidelines
Adjunctive eligibility Add in as eligible those infants/children whose household reports food stamps, family reports TANF, or who are themselves reported as being enrolled in Medicaid at any point during the prior calendar year.
For TANF receipt, "family" on the CPS is defined as the narrowly-defined family and also includes any related children whose parents are not present in the household. On the ACS and PRCS the definition is just the narrowly defined family with subfamilies separate.
2009 CPS-ASEC
Adjust for fluctuations in monthly income and certification periods
Multiply the estimates by a factor of 1.18 for infants and 1.01 for children to account for the impact of monthly fluctuations in income and program participation, and for the impact of 6- and 12-month certification periods.
SIPP panels from 2001 and 2004.
Adjust for nutritional risk Multiply the infant estimates by 0.97 and the child estimates by 0.99 to account for the fact that some otherwise-eligible infants and children might not be found to be at nutritional risk.
No update because CNSTAT-derived factors.
Territories Eligibility in Puerto Rico is based on the PRCS and is estimated with the same methods as those used for the State estimates.Eligibility in the Other Island Territories is based on a proportion of the estimated population of infants and children.
PRCS 2008 - Puerto Rico
Census Bureau International Data Base - Other Island Territories
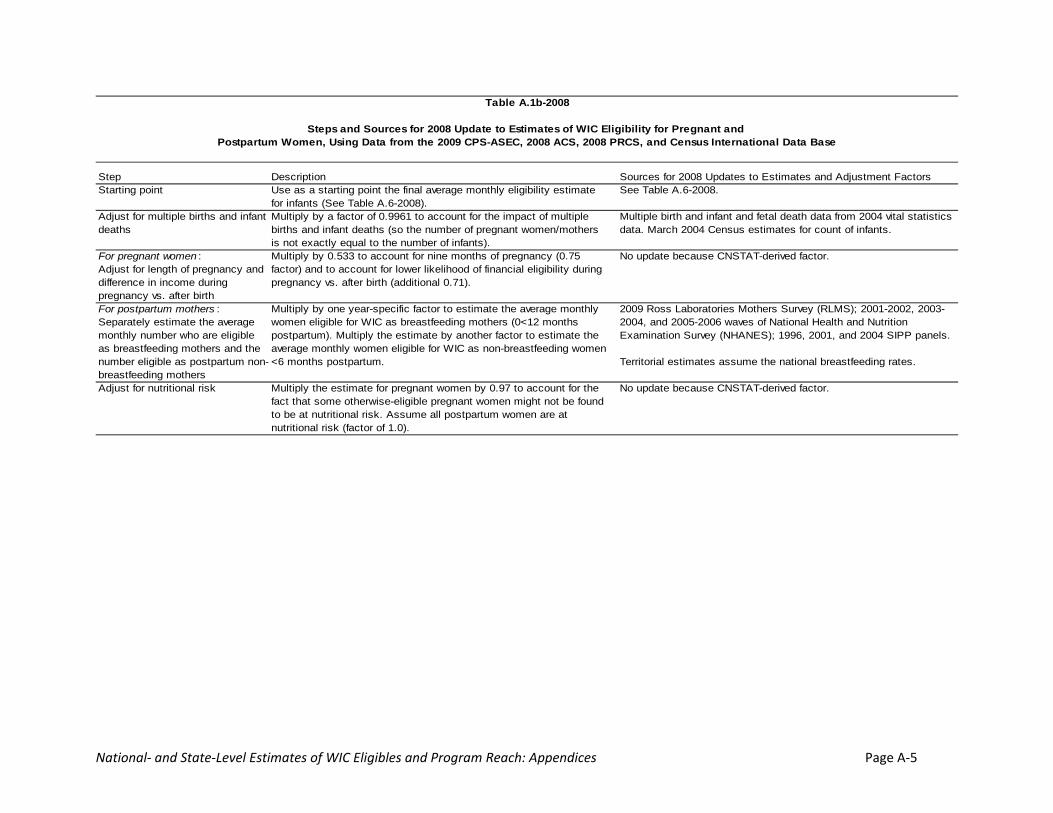
Table A.1a-2008
Steps and Sources for 2008 Update to Estimates of WIC Eligibility for Infants andYoung Children, Using Data from the 2009 CPS-ASEC, 2008 ACS, 2008 PRCS, and Census International Data Base
National‐ and State‐Level Estimates of WIC Eligibles and Program Reach: Appendices Page A‐5
Step Description Sources for 2008 Updates to Estimates and Adjustment Factors Starting point Use as a starting point the final average monthly eligibility estimate
for infants (See Table A.6-2008). See Table A.6-2008.
Adjust for multiple births and infant deaths
Multiply by a factor of 0.9961 to account for the impact of multiple births and infant deaths (so the number of pregnant women/mothers is not exactly equal to the number of infants).
Multiple birth and infant and fetal death data from 2004 vital statistics data. March 2004 Census estimates for count of infants.
For pregnant women : Adjust for length of pregnancy and difference in income during pregnancy vs. after birth
Multiply by 0.533 to account for nine months of pregnancy (0.75 factor) and to account for lower likelihood of financial eligibility during pregnancy vs. after birth (additional 0.71).
No update because CNSTAT-derived factor.
For postpartum mothers : Separately estimate the average monthly number who are eligible as breastfeeding mothers and the number eligible as postpartum non-breastfeeding mothers
Multiply by one year-specific factor to estimate the average monthly women eligible for WIC as breastfeeding mothers (0<12 months postpartum). Multiply the estimate by another factor to estimate the average monthly women eligible for WIC as non-breastfeeding women <6 months postpartum.
2009 Ross Laboratories Mothers Survey (RLMS); 2001-2002, 2003-2004, and 2005-2006 waves of National Health and Nutrition Examination Survey (NHANES); 1996, 2001, and 2004 SIPP panels.
Territorial estimates assume the national breastfeeding rates.
Adjust for nutritional risk Multiply the estimate for pregnant women by 0.97 to account for the fact that some otherwise-eligible pregnant women might not be found to be at nutritional risk. Assume all postpartum women are at nutritional risk (factor of 1.0).
No update because CNSTAT-derived factor.
Steps and Sources for 2008 Update to Estimates of WIC Eligibility for Pregnant and Postpartum Women, Using Data from the 2009 CPS-ASEC, 2008 ACS, 2008 PRCS, and Census International Data Base
Table A.1b-2008

National‐ and State‐Level Estimates of WIC Eligibles and Program Reach: Appendices Page A‐6
Table A.2-2008: Estimates of the Average Monthly Number of Individuals Eligible for WIC by Participant Group in the March 2009 CPS NOTE: This table includes estimates for the territories 2008
Participant Group Eligiblesa Non-Eligiblesb Totalc
Infants 2,633,819 1,811,679 4,445,498
Total Children Age 1 to 4 8,657,117 8,399,639 17,056,75
6Children Age 1 2,292,023 2,054,735 4,346,758Children Age 2 2,143,513 2,176,247 4,319,761Children Age 3 2,117,479 2,113,062 4,230,541Children Age 4 2,104,102 2,055,595 4,159,697
Pregnant Women 1,355,127
Postpartum Breastfeeding Women 639,003
Postpartum Non-Breastfeeding Women 886,312
Total WIC Eligibles 14,171,378 Source: 2009 CPS-ASEC for U.S. estimate, PRCS and Census for territories Notes: aThe eligible estimates represent the average monthly number of individuals eligible for WIC in 2008, taking into account the impact of 6- and 12-month certification periods. The adjustment factors used to account for monthly income and certification periods were derived from an analysis of the 1996, 2001, and 2004 SIPP panels that compared annual estimates of eligibility with monthly estimates that accounted for certification periods. The analysis was conducted for calendar years 1997, 1998, 2002, 2005, and 2006, and the factors are an average of the three years.
See Tables 3a, 3b, and 6 for all of the adjustment factors used to calculate the eligible estimates. bThe non-eligible infants and children represent the difference between the Total estimates of infants and children age 1 to 4 in the total United States and the WIC-eligible infants and children. cThe total numbers of infants and children represent the sum of the March 2009 total number of infants and children adjusted for the under and over count of infants and children in the CPS relative to Census estimates plus the number of infants and children in Puerto Rico and the other island territories based on the 2008 PRCS and annual Census Bureau population estimates.
National‐ and State‐Level Estimates of WIC Eligibles and Program Reach: Appendices Page A‐7
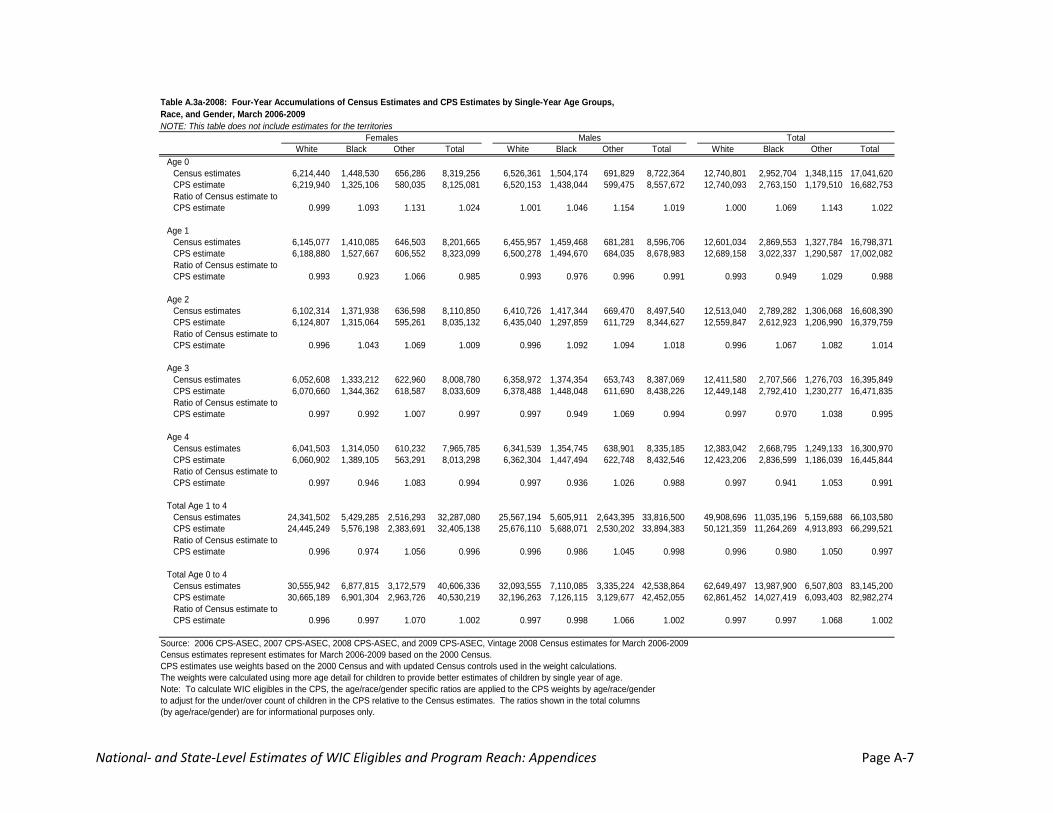
Table A.3a-2008: Four-Year Accumulations of Census Estimates and CPS Estimates by Single-Year Age Groups, Race, and Gender, March 2006-2009NOTE: This table does not include estimates for the territories
White Black Other Total White Black Other Total White Black Other TotalAge 0
Census estimates 6,214,440 1,448,530 656,286 8,319,256 6,526,361 1,504,174 691,829 8,722,364 12,740,801 2,952,704 1,348,115 17,041,620CPS estimate 6,219,940 1,325,106 580,035 8,125,081 6,520,153 1,438,044 599,475 8,557,672 12,740,093 2,763,150 1,179,510 16,682,753Ratio of Census estimate to CPS estimate 0.999 1.093 1.131 1.024 1.001 1.046 1.154 1.019 1.000 1.069 1.143 1.022
Age 1Census estimates 6,145,077 1,410,085 646,503 8,201,665 6,455,957 1,459,468 681,281 8,596,706 12,601,034 2,869,553 1,327,784 16,798,371CPS estimate 6,188,880 1,527,667 606,552 8,323,099 6,500,278 1,494,670 684,035 8,678,983 12,689,158 3,022,337 1,290,587 17,002,082Ratio of Census estimate to CPS estimate 0.993 0.923 1.066 0.985 0.993 0.976 0.996 0.991 0.993 0.949 1.029 0.988
Age 2Census estimates 6,102,314 1,371,938 636,598 8,110,850 6,410,726 1,417,344 669,470 8,497,540 12,513,040 2,789,282 1,306,068 16,608,390CPS estimate 6,124,807 1,315,064 595,261 8,035,132 6,435,040 1,297,859 611,729 8,344,627 12,559,847 2,612,923 1,206,990 16,379,759Ratio of Census estimate to CPS estimate 0.996 1.043 1.069 1.009 0.996 1.092 1.094 1.018 0.996 1.067 1.082 1.014
Age 3Census estimates 6,052,608 1,333,212 622,960 8,008,780 6,358,972 1,374,354 653,743 8,387,069 12,411,580 2,707,566 1,276,703 16,395,849CPS estimate 6,070,660 1,344,362 618,587 8,033,609 6,378,488 1,448,048 611,690 8,438,226 12,449,148 2,792,410 1,230,277 16,471,835Ratio of Census estimate to CPS estimate 0.997 0.992 1.007 0.997 0.997 0.949 1.069 0.994 0.997 0.970 1.038 0.995
Age 4Census estimates 6,041,503 1,314,050 610,232 7,965,785 6,341,539 1,354,745 638,901 8,335,185 12,383,042 2,668,795 1,249,133 16,300,970CPS estimate 6,060,902 1,389,105 563,291 8,013,298 6,362,304 1,447,494 622,748 8,432,546 12,423,206 2,836,599 1,186,039 16,445,844Ratio of Census estimate to CPS estimate 0.997 0.946 1.083 0.994 0.997 0.936 1.026 0.988 0.997 0.941 1.053 0.991
Total Age 1 to 4Census estimates 24,341,502 5,429,285 2,516,293 32,287,080 25,567,194 5,605,911 2,643,395 33,816,500 49,908,696 11,035,196 5,159,688 66,103,580CPS estimate 24,445,249 5,576,198 2,383,691 32,405,138 25,676,110 5,688,071 2,530,202 33,894,383 50,121,359 11,264,269 4,913,893 66,299,521Ratio of Census estimate to CPS estimate 0.996 0.974 1.056 0.996 0.996 0.986 1.045 0.998 0.996 0.980 1.050 0.997
Total Age 0 to 4Census estimates 30,555,942 6,877,815 3,172,579 40,606,336 32,093,555 7,110,085 3,335,224 42,538,864 62,649,497 13,987,900 6,507,803 83,145,200CPS estimate 30,665,189 6,901,304 2,963,726 40,530,219 32,196,263 7,126,115 3,129,677 42,452,055 62,861,452 14,027,419 6,093,403 82,982,274Ratio of Census estimate to CPS estimate 0.996 0.997 1.070 1.002 0.997 0.998 1.066 1.002 0.997 0.997 1.068 1.002
Source: 2006 CPS-ASEC, 2007 CPS-ASEC, 2008 CPS-ASEC, and 2009 CPS-ASEC, Vintage 2008 Census estimates for March 2006-2009Census estimates represent estimates for March 2006-2009 based on the 2000 Census. CPS estimates use weights based on the 2000 Census and with updated Census controls used in the weight calculations.The weights were calculated using more age detail for children to provide better estimates of children by single year of age.Note: To calculate WIC eligibles in the CPS, the age/race/gender specific ratios are applied to the CPS weights by age/race/genderto adjust for the under/over count of children in the CPS relative to the Census estimates. The ratios shown in the total columns (by age/race/gender) are for informational purposes only.
Females Males Total
National‐ and State‐Level Estimates of WIC Eligibles and Program Reach: Appendices Page A‐8
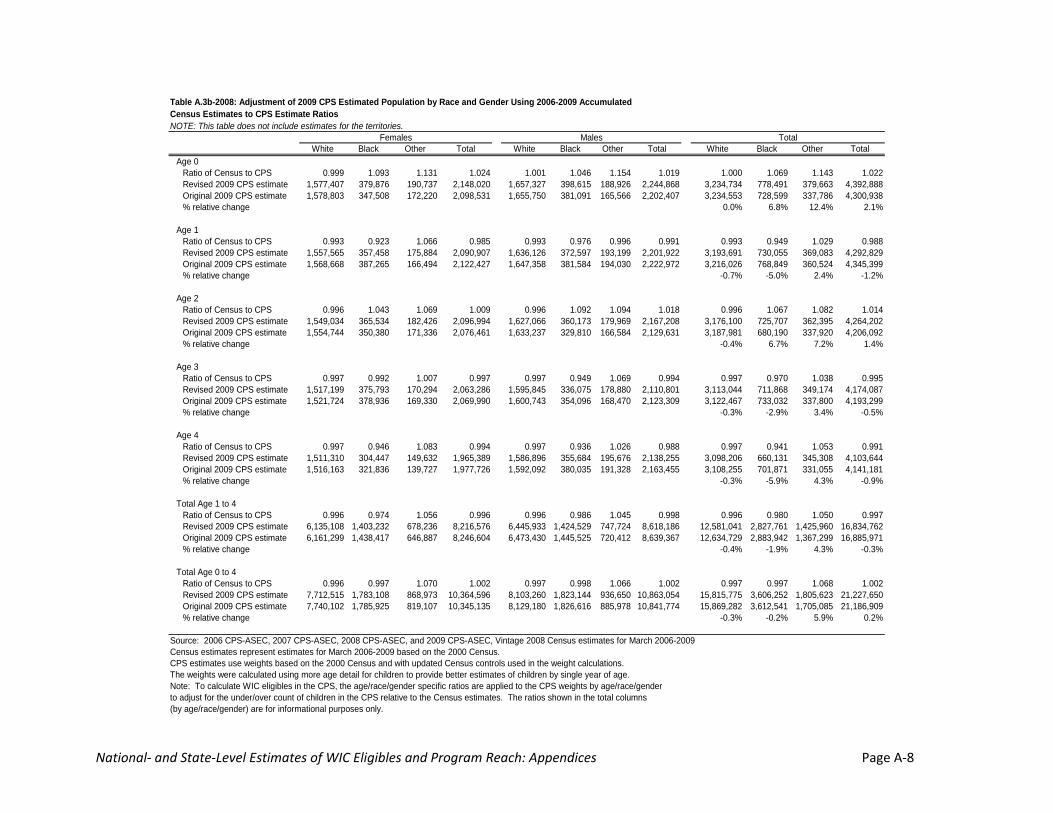
Table A.3b-2008: Adjustment of 2009 CPS Estimated Population by Race and Gender Using 2006-2009 Accumulated Census Estimates to CPS Estimate RatiosNOTE: This table does not include estimates for the territories.
White Black Other Total White Black Other Total White Black Other TotalAge 0
Ratio of Census to CPS 0.999 1.093 1.131 1.024 1.001 1.046 1.154 1.019 1.000 1.069 1.143 1.022Revised 2009 CPS estimate 1,577,407 379,876 190,737 2,148,020 1,657,327 398,615 188,926 2,244,868 3,234,734 778,491 379,663 4,392,888Original 2009 CPS estimate 1,578,803 347,508 172,220 2,098,531 1,655,750 381,091 165,566 2,202,407 3,234,553 728,599 337,786 4,300,938% relative change 0.0% 6.8% 12.4% 2.1%
Age 1Ratio of Census to CPS 0.993 0.923 1.066 0.985 0.993 0.976 0.996 0.991 0.993 0.949 1.029 0.988Revised 2009 CPS estimate 1,557,565 357,458 175,884 2,090,907 1,636,126 372,597 193,199 2,201,922 3,193,691 730,055 369,083 4,292,829Original 2009 CPS estimate 1,568,668 387,265 166,494 2,122,427 1,647,358 381,584 194,030 2,222,972 3,216,026 768,849 360,524 4,345,399% relative change -0.7% -5.0% 2.4% -1.2%
Age 2Ratio of Census to CPS 0.996 1.043 1.069 1.009 0.996 1.092 1.094 1.018 0.996 1.067 1.082 1.014Revised 2009 CPS estimate 1,549,034 365,534 182,426 2,096,994 1,627,066 360,173 179,969 2,167,208 3,176,100 725,707 362,395 4,264,202Original 2009 CPS estimate 1,554,744 350,380 171,336 2,076,461 1,633,237 329,810 166,584 2,129,631 3,187,981 680,190 337,920 4,206,092% relative change -0.4% 6.7% 7.2% 1.4%
Age 3Ratio of Census to CPS 0.997 0.992 1.007 0.997 0.997 0.949 1.069 0.994 0.997 0.970 1.038 0.995Revised 2009 CPS estimate 1,517,199 375,793 170,294 2,063,286 1,595,845 336,075 178,880 2,110,801 3,113,044 711,868 349,174 4,174,087Original 2009 CPS estimate 1,521,724 378,936 169,330 2,069,990 1,600,743 354,096 168,470 2,123,309 3,122,467 733,032 337,800 4,193,299% relative change -0.3% -2.9% 3.4% -0.5%
Age 4Ratio of Census to CPS 0.997 0.946 1.083 0.994 0.997 0.936 1.026 0.988 0.997 0.941 1.053 0.991Revised 2009 CPS estimate 1,511,310 304,447 149,632 1,965,389 1,586,896 355,684 195,676 2,138,255 3,098,206 660,131 345,308 4,103,644Original 2009 CPS estimate 1,516,163 321,836 139,727 1,977,726 1,592,092 380,035 191,328 2,163,455 3,108,255 701,871 331,055 4,141,181% relative change -0.3% -5.9% 4.3% -0.9%
Total Age 1 to 4Ratio of Census to CPS 0.996 0.974 1.056 0.996 0.996 0.986 1.045 0.998 0.996 0.980 1.050 0.997Revised 2009 CPS estimate 6,135,108 1,403,232 678,236 8,216,576 6,445,933 1,424,529 747,724 8,618,186 12,581,041 2,827,761 1,425,960 16,834,762Original 2009 CPS estimate 6,161,299 1,438,417 646,887 8,246,604 6,473,430 1,445,525 720,412 8,639,367 12,634,729 2,883,942 1,367,299 16,885,971% relative change -0.4% -1.9% 4.3% -0.3%
Total Age 0 to 4Ratio of Census to CPS 0.996 0.997 1.070 1.002 0.997 0.998 1.066 1.002 0.997 0.997 1.068 1.002Revised 2009 CPS estimate 7,712,515 1,783,108 868,973 10,364,596 8,103,260 1,823,144 936,650 10,863,054 15,815,775 3,606,252 1,805,623 21,227,650Original 2009 CPS estimate 7,740,102 1,785,925 819,107 10,345,135 8,129,180 1,826,616 885,978 10,841,774 15,869,282 3,612,541 1,705,085 21,186,909% relative change -0.3% -0.2% 5.9% 0.2%
Source: 2006 CPS-ASEC, 2007 CPS-ASEC, 2008 CPS-ASEC, and 2009 CPS-ASEC, Vintage 2008 Census estimates for March 2006-2009Census estimates represent estimates for March 2006-2009 based on the 2000 Census. CPS estimates use weights based on the 2000 Census and with updated Census controls used in the weight calculations.The weights were calculated using more age detail for children to provide better estimates of children by single year of age.Note: To calculate WIC eligibles in the CPS, the age/race/gender specific ratios are applied to the CPS weights by age/race/genderto adjust for the under/over count of children in the CPS relative to the Census estimates. The ratios shown in the total columns (by age/race/gender) are for informational purposes only.
Females Males Total
National‐ and State‐Level Estimates of WIC Eligibles and Program Reach: Appendices Page A‐9
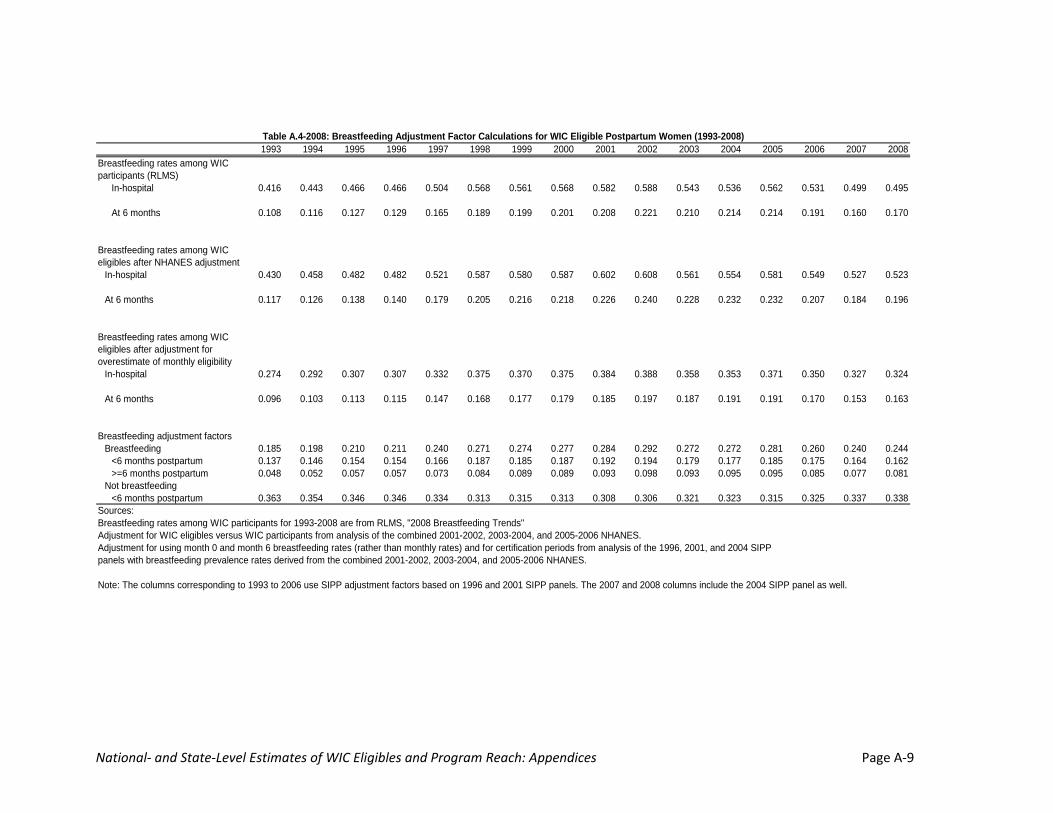
1993 1994 1995 1996 1997 1998 1999 2000 2001 2002 2003 2004 2005 2006 2007 2008Breastfeeding rates among WIC participants (RLMS)
In-hospital 0.416 0.443 0.466 0.466 0.504 0.568 0.561 0.568 0.582 0.588 0.543 0.536 0.562 0.531 0.499 0.495
At 6 months 0.108 0.116 0.127 0.129 0.165 0.189 0.199 0.201 0.208 0.221 0.210 0.214 0.214 0.191 0.160 0.170
Breastfeeding rates among WIC eligibles after NHANES adjustment
In-hospital 0.430 0.458 0.482 0.482 0.521 0.587 0.580 0.587 0.602 0.608 0.561 0.554 0.581 0.549 0.527 0.523
At 6 months 0.117 0.126 0.138 0.140 0.179 0.205 0.216 0.218 0.226 0.240 0.228 0.232 0.232 0.207 0.184 0.196
Breastfeeding rates among WIC eligibles after adjustment for overestimate of monthly eligibility
In-hospital 0.274 0.292 0.307 0.307 0.332 0.375 0.370 0.375 0.384 0.388 0.358 0.353 0.371 0.350 0.327 0.324
At 6 months 0.096 0.103 0.113 0.115 0.147 0.168 0.177 0.179 0.185 0.197 0.187 0.191 0.191 0.170 0.153 0.163
Breastfeeding adjustment factors Breastfeeding 0.185 0.198 0.210 0.211 0.240 0.271 0.274 0.277 0.284 0.292 0.272 0.272 0.281 0.260 0.240 0.244
<6 months postpartum 0.137 0.146 0.154 0.154 0.166 0.187 0.185 0.187 0.192 0.194 0.179 0.177 0.185 0.175 0.164 0.162>=6 months postpartum 0.048 0.052 0.057 0.057 0.073 0.084 0.089 0.089 0.093 0.098 0.093 0.095 0.095 0.085 0.077 0.081
Not breastfeeding <6 months postpartum 0.363 0.354 0.346 0.346 0.334 0.313 0.315 0.313 0.308 0.306 0.321 0.323 0.315 0.325 0.337 0.338
Sources:Breastfeeding rates among WIC participants for 1993-2008 are from RLMS, "2008 Breastfeeding Trends"Adjustment for WIC eligibles versus WIC participants from analysis of the combined 2001-2002, 2003-2004, and 2005-2006 NHANES.Adjustment for using month 0 and month 6 breastfeeding rates (rather than monthly rates) and for certification periods from analysis of the 1996, 2001, and 2004 SIPPpanels with breastfeeding prevalence rates derived from the combined 2001-2002, 2003-2004, and 2005-2006 NHANES.
Note: The columns corresponding to 1993 to 2006 use SIPP adjustment factors based on 1996 and 2001 SIPP panels. The 2007 and 2008 columns include the 2004 SIPP panel as well.
Table A.4-2008: Breastfeeding Adjustment Factor Calculations for WIC Eligible Postpartum Women (1993-2008)
National‐ and State‐Level Estimates of WIC Eligibles and Program Reach: Appendices Page A‐10
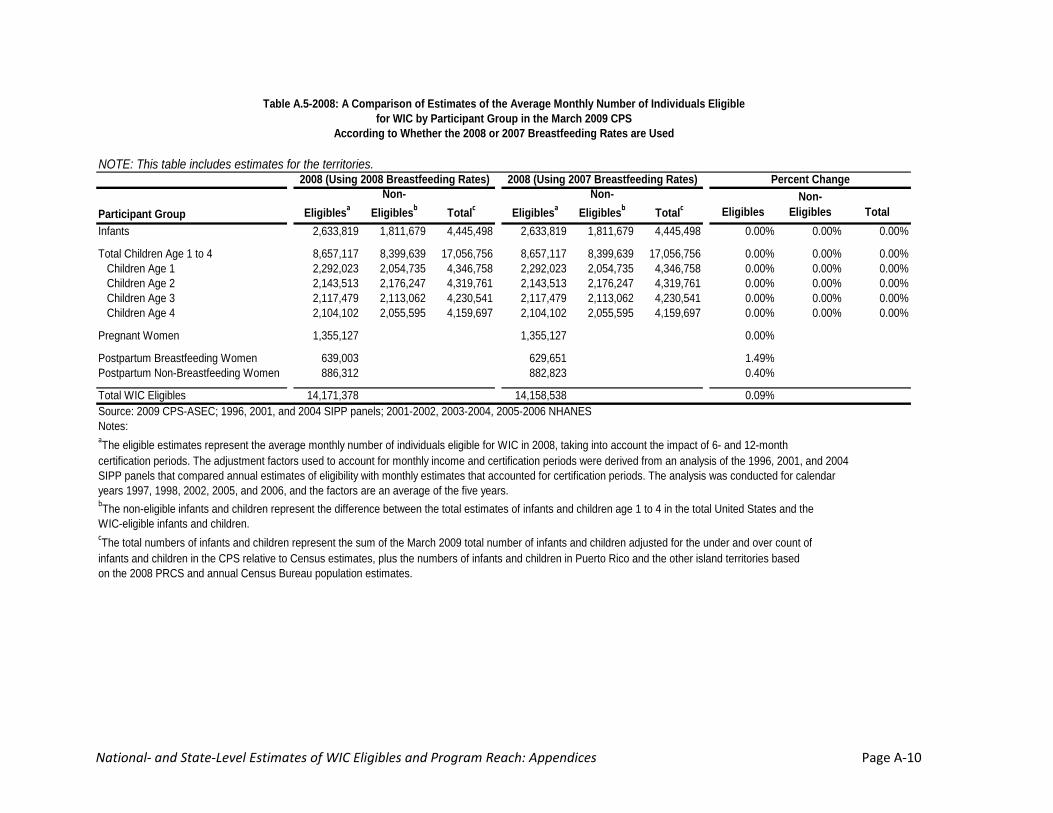
NOTE: This table includes estimates for the territories.
Participant Group Eligiblesa
Non-Eligiblesb Totalc Eligiblesa
Non-Eligiblesb Totalc Eligibles
Non-Eligibles Total
Infants 2,633,819 1,811,679 4,445,498 2,633,819 1,811,679 4,445,498 0.00% 0.00% 0.00%
Total Children Age 1 to 4 8,657,117 8,399,639 17,056,756 8,657,117 8,399,639 17,056,756 0.00% 0.00% 0.00%Children Age 1 2,292,023 2,054,735 4,346,758 2,292,023 2,054,735 4,346,758 0.00% 0.00% 0.00%Children Age 2 2,143,513 2,176,247 4,319,761 2,143,513 2,176,247 4,319,761 0.00% 0.00% 0.00%Children Age 3 2,117,479 2,113,062 4,230,541 2,117,479 2,113,062 4,230,541 0.00% 0.00% 0.00%Children Age 4 2,104,102 2,055,595 4,159,697 2,104,102 2,055,595 4,159,697 0.00% 0.00% 0.00%
Pregnant Women 1,355,127 1,355,127 0.00%
Postpartum Breastfeeding Women 639,003 629,651 1.49%Postpartum Non-Breastfeeding Women 886,312 882,823 0.40%
Total WIC Eligibles 14,171,378 14,158,538 0.09%Source: 2009 CPS-ASEC; 1996, 2001, and 2004 SIPP panels; 2001-2002, 2003-2004, 2005-2006 NHANESNotes:aThe eligible estimates represent the average monthly number of individuals eligible for WIC in 2008, taking into account the impact of 6- and 12-month certification periods. The adjustment factors used to account for monthly income and certification periods were derived from an analysis of the 1996, 2001, and 2004SIPP panels that compared annual estimates of eligibility with monthly estimates that accounted for certification periods. The analysis was conducted for calendaryears 1997, 1998, 2002, 2005, and 2006, and the factors are an average of the five years.
WIC-eligible infants and children.cThe total numbers of infants and children represent the sum of the March 2009 total number of infants and children adjusted for the under and over count of infants and children in the CPS relative to Census estimates, plus the numbers of infants and children in Puerto Rico and the other island territories basedon the 2008 PRCS and annual Census Bureau population estimates.
bThe non-eligible infants and children represent the difference between the total estimates of infants and children age 1 to 4 in the total United States and the
Table A.5-2008: A Comparison of Estimates of the Average Monthly Number of Individuals Eligiblefor WIC by Participant Group in the March 2009 CPS
According to Whether the 2008 or 2007 Breastfeeding Rates are Used
2008 (Using 2008 Breastfeeding Rates) 2008 (Using 2007 Breastfeeding Rates) Percent Change
National‐ and State‐Level Estimates of WIC Eligibles and Program Reach: Appendices Page A‐11
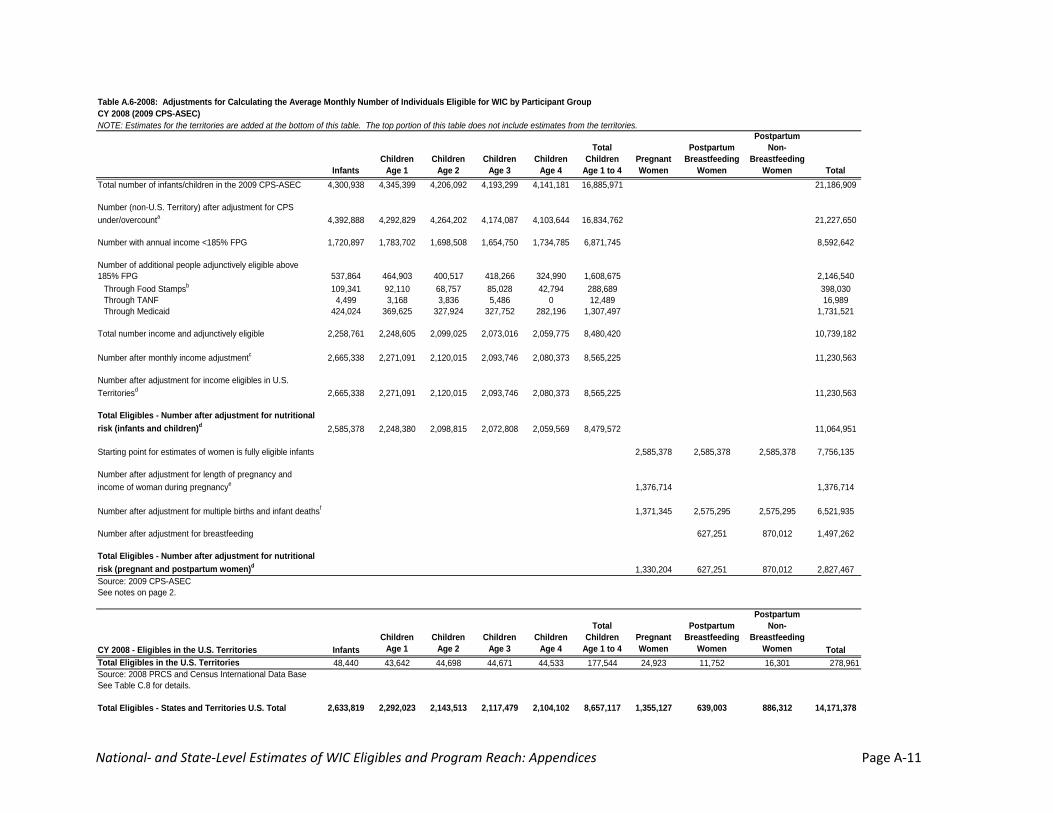
Table A.6-2008: Adjustments for Calculating the Average Monthly Number of Individuals Eligible for WIC by Participant GroupCY 2008 (2009 CPS-ASEC)NOTE: Estimates for the territories are added at the bottom of this table. The top portion of this table does not include estimates from the territories.
InfantsChildren
Age 1Children
Age 2Children
Age 3Children
Age 4
Total Children
Age 1 to 4Pregnant Women
Postpartum Breastfeeding
Women
Postpartum Non-
Breastfeeding Women Total
Total number of infants/children in the 2009 CPS-ASEC 4,300,938 4,345,399 4,206,092 4,193,299 4,141,181 16,885,971 21,186,909
Number (non-U.S. Territory) after adjustment for CPS under/overcounta 4,392,888 4,292,829 4,264,202 4,174,087 4,103,644 16,834,762 21,227,650
Number with annual income <185% FPG 1,720,897 1,783,702 1,698,508 1,654,750 1,734,785 6,871,745 8,592,642
Number of additional people adjunctively eligible above 185% FPG 537,864 464,903 400,517 418,266 324,990 1,608,675 2,146,540
Through Food Stampsb 109,341 92,110 68,757 85,028 42,794 288,689 398,030Through TANF 4,499 3,168 3,836 5,486 0 12,489 16,989Through Medicaid 424,024 369,625 327,924 327,752 282,196 1,307,497 1,731,521
Total number income and adjunctively eligible 2,258,761 2,248,605 2,099,025 2,073,016 2,059,775 8,480,420 10,739,182
Number after monthly income adjustmentc 2,665,338 2,271,091 2,120,015 2,093,746 2,080,373 8,565,225 11,230,563
Number after adjustment for income eligibles in U.S. Territoriesd 2,665,338 2,271,091 2,120,015 2,093,746 2,080,373 8,565,225 11,230,563
Total Eligibles - Number after adjustment for nutritional risk (infants and children)d 2,585,378 2,248,380 2,098,815 2,072,808 2,059,569 8,479,572 11,064,951
Starting point for estimates of women is fully eligible infants 2,585,378 2,585,378 2,585,378 7,756,135
Number after adjustment for length of pregnancy and income of woman during pregnancye 1,376,714 1,376,714
Number after adjustment for multiple births and infant deathsf 1,371,345 2,575,295 2,575,295 6,521,935
Number after adjustment for breastfeeding 627,251 870,012 1,497,262
Total Eligibles - Number after adjustment for nutritional risk (pregnant and postpartum women)d 1,330,204 627,251 870,012 2,827,467Source: 2009 CPS-ASECSee notes on page 2.
CY 2008 - Eligibles in the U.S. Territories InfantsChildren
Age 1Children
Age 2Children
Age 3Children
Age 4
Total Children
Age 1 to 4Pregnant Women
Postpartum Breastfeeding
Women
Postpartum Non-
Breastfeeding Women Total
Total Eligibles in the U.S. Territories 48,440 43,642 44,698 44,671 44,533 177,544 24,923 11,752 16,301 278,961Source: 2008 PRCS and Census International Data BaseSee Table C.8 for details.
Total Eligibles - States and Territories U.S. Total 2,633,819 2,292,023 2,143,513 2,117,479 2,104,102 8,657,117 1,355,127 639,003 886,312 14,171,378
National‐ and State‐Level Estimates of WIC Eligibles and Program Reach: Appendices Page A‐12
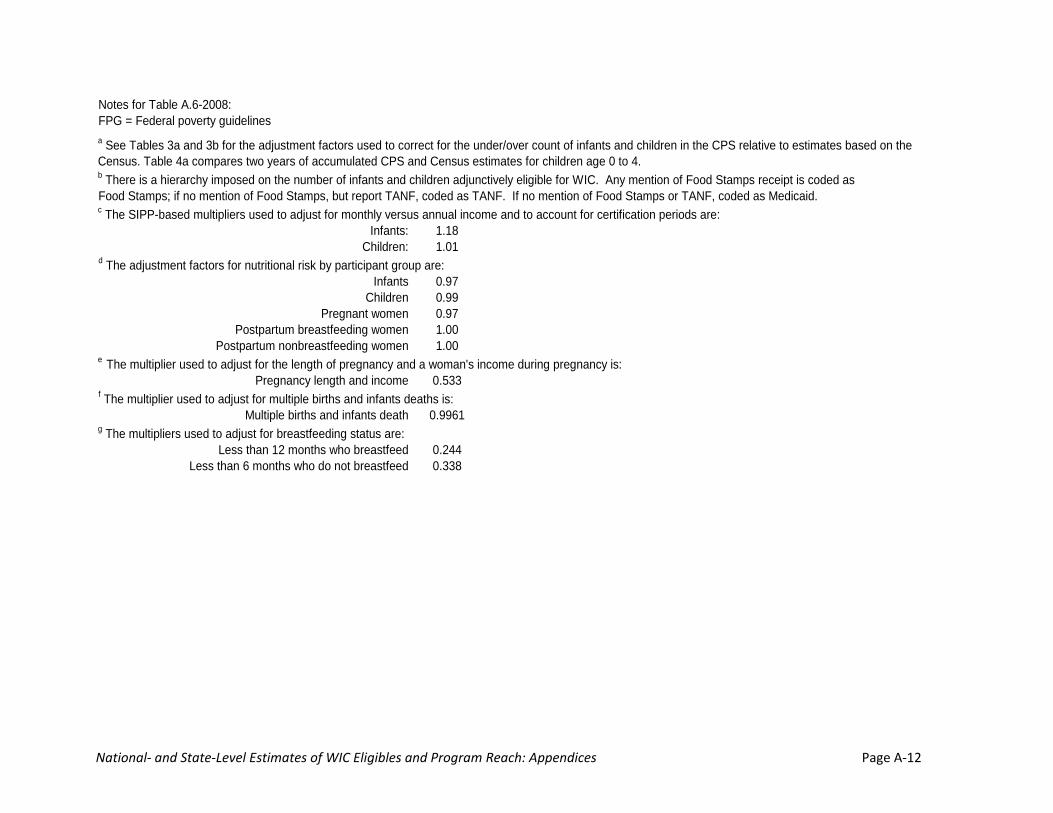
Notes for Table A.6-2008:FPG = Federal poverty guidelines
b There is a hierarchy imposed on the number of infants and children adjunctively eligible for WIC. Any mention of Food Stamps receipt is coded as Food Stamps; if no mention of Food Stamps, but report TANF, coded as TANF. If no mention of Food Stamps or TANF, coded as Medicaid.c The SIPP-based multipliers used to adjust for monthly versus annual income and to account for certification periods are:
Infants: 1.18Children: 1.01
d The adjustment factors for nutritional risk by participant group are:Infants 0.97
Children 0.99Pregnant women 0.97
Postpartum breastfeeding women 1.00Postpartum nonbreastfeeding women 1.00
e The multiplier used to adjust for the length of pregnancy and a woman's income during pregnancy is:Pregnancy length and income 0.533
f The multiplier used to adjust for multiple births and infants deaths is:Multiple births and infants death 0.9961
g The multipliers used to adjust for breastfeeding status are:Less than 12 months who breastfeed 0.244
Less than 6 months who do not breastfeed 0.338
a See Tables 3a and 3b for the adjustment factors used to correct for the under/over count of infants and children in the CPS relative to estimates based on the Census. Table 4a compares two years of accumulated CPS and Census estimates for children age 0 to 4.

National‐ and State‐Level Estimates of WIC Eligibles and Program Reach: Appendices Page A‐13
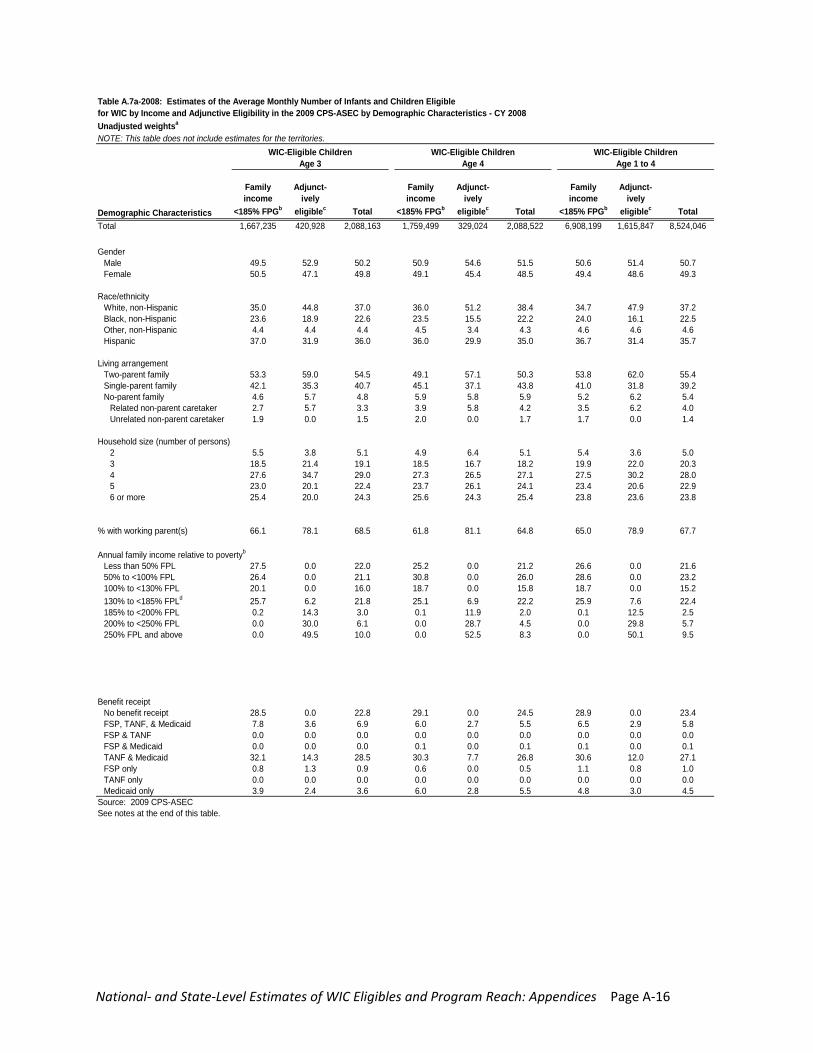
Table A.7a-2008: Estimates of the Average Monthly Number of Infants and Children Eligible for WIC by Income and Adjunctive Eligibility in the 2009 CPS-ASEC by Demographic Characteristics - CY 2008Unadjusted weightsa
NOTE: This table does not include estimates for the territories.
Demographic Characteristics
Family income
<185% FPGb
Adjunct-ively
eligiblec Total
Family income
<185% FPGb
Adjunct-ively
eligiblec Total
Family income
<185% FPGb
Adjunct-ively
eligiblec TotalTotal 1,676,896 528,614 2,205,510 1,814,547 470,900 2,285,447 1,666,918 394,996 2,061,913
GenderMale 875,352 261,763 1,137,115 921,160 223,506 1,144,666 851,919 204,712 1,056,631Female 801,544 266,852 1,068,395 893,387 247,393 1,140,781 814,999 190,283 1,005,282
Race/ethnicityWhite, non-Hispanic 577,237 273,461 850,697 611,610 227,032 838,642 568,473 189,946 758,418Black, non-Hispanic 377,784 83,080 460,864 464,350 71,685 536,036 386,915 58,045 444,960Other, non-Hispanic 71,202 19,800 91,002 86,641 23,126 109,767 80,219 21,963 102,182Hispanic 650,673 152,273 802,947 651,947 149,056 801,003 631,311 125,042 756,353
Living arrangementTwo-parent family 999,935 362,037 1,361,972 1,029,835 304,746 1,334,581 934,820 261,671 1,196,491Single-parent family 613,455 136,258 749,713 689,054 131,748 820,802 647,344 111,322 758,666No-parent family 63,506 30,319 93,825 95,659 34,405 130,064 84,754 22,002 106,756
Related non-parent caretaker 43,235 30,319 73,554 70,615 34,405 105,020 56,441 22,002 78,443Unrelated non-parent caretaker 20,271 0 20,271 25,044 0 25,044 28,313 0 28,313
Household size (number of persons)2 81,978 11,864 93,841 106,106 12,297 118,403 88,488 9,014 97,5023 432,687 144,745 577,432 429,905 130,725 560,630 311,141 79,778 390,9194 455,303 134,886 590,189 471,345 118,551 589,895 487,602 135,995 623,5975 306,401 91,950 398,351 428,269 83,956 512,225 387,583 78,610 466,1936 or more 400,527 145,169 545,696 378,922 125,371 504,294 392,103 91,599 483,702Mean 4.6 4.6 4.6 4.5 4.6 4.5 4.6 4.7 4.7
Number with working parent(s) 971,550 399,519 1,371,070 1,157,138 358,310 1,515,448 1,147,101 321,373 1,468,474
Annual family income relative to povertyb
Less than 50% FPL 552,402 0 552,402 507,493 0 507,493 429,927 0 429,92750% to <100% FPL 445,049 0 445,049 502,715 0 502,715 489,038 0 489,038100% to <130% FPL 306,671 0 306,671 300,436 0 300,436 329,294 0 329,294130% to <185% FPLd 367,269 38,791 406,060 500,617 35,693 536,310 416,143 38,108 454,251185% to <200% FPL 5,071 56,029 61,100 2,844 53,747 56,591 862 48,050 48,913200% to <250% FPL 434 141,251 141,685 442 145,420 145,862 1,653 115,887 117,540250% FPL and above 0 292,543 292,543 0 236,040 236,040 0 192,950 192,950
Annual family incomeMean $18,881 $74,442 $32,198 $20,364 $74,549 $31,528 $20,778 $80,570 $32,232Median $17,500 $60,916 $24,825 $20,000 $60,200 $25,000 $20,000 $60,192 $24,960
Benefit receiptNo benefit receipt 394,590 0 394,590 503,202 0 503,202 506,568 0 506,568FSP, TANF, & Medicaid 136,588 9,028 145,616 133,964 13,620 147,583 83,113 8,970 92,082FSP & TANF 0 0 0 0 0 0 0 0 0FSP & Medicaid 0 0 0 3,223 0 3,223 1,902 0 1,902TANF & Medicaid 495,568 73,183 568,750 551,090 60,246 611,336 492,603 48,529 541,132FSP only 13,365 4,373 17,738 32,223 3,086 35,308 17,286 3,827 21,113TANF only 0 0 0 0 0 0 0 0 0Medicaid only 73,273 25,254 98,527 76,394 19,687 96,081 85,551 9,649 95,200
Source: 2009 CPS-ASECSee notes at the end of this table.
WIC-Eligible InfantsWIC-Eligible Children
Age 1WIC-Eligible Children
Age 2

National‐ and State‐Level Estimates of WIC Eligibles and Program Reach: Appendices Page A‐14
Table A.7a-2008: Estimates of the Average Monthly Number of Infants and Children Eligible for WIC by Income and Adjunctive Eligibility in the 2009 CPS-ASEC by Demographic Characteristics - CY 2008Unadjusted weightsa
NOTE: This table does not include estimates for the territories.
Demographic Characteristics
Family income
<185% FPGb
Adjunct-ively
eligiblec Total
Family income
<185% FPGb
Adjunct-ively
eligiblec Total
Family income
<185% FPGb
Adjunct-ively
eligiblec TotalTotal 1,667,235 420,928 2,088,163 1,759,499 329,024 2,088,522 6,908,199 1,615,847 8,524,046
GenderMale 824,667 222,655 1,047,321 896,170 179,726 1,075,896 3,493,915 830,599 4,324,514Female 842,568 198,274 1,040,842 863,329 149,297 1,012,626 3,414,284 785,248 4,199,531
Race/ethnicityWhite, non-Hispanic 583,481 188,776 772,257 633,269 168,486 801,756 2,396,833 774,240 3,171,073Black, non-Hispanic 393,146 79,371 472,517 413,414 50,967 464,381 1,657,825 260,069 1,917,894Other, non-Hispanic 73,598 18,454 92,052 79,426 11,104 90,530 319,884 74,647 394,530Hispanic 617,010 134,326 751,336 633,389 98,466 731,856 2,533,657 506,891 3,040,548
Living arrangementTwo-parent family 889,205 248,262 1,137,467 863,091 187,849 1,050,940 3,716,950 1,002,528 4,719,479Single-parent family 702,132 148,559 850,691 793,158 122,122 915,280 2,831,688 513,751 3,345,439No-parent family 75,898 24,107 100,005 103,250 19,053 122,303 359,560 99,567 459,128
Related non-parent caretaker 44,298 24,107 68,405 68,113 19,053 87,166 239,467 99,567 339,034Unrelated non-parent caretaker 31,600 0 31,600 35,137 0 35,137 120,094 0 120,094
Household size (number of persons)2 90,927 16,120 107,048 85,762 21,113 106,875 371,284 58,543 429,8273 308,469 90,039 398,508 325,441 55,035 380,476 1,374,956 355,577 1,730,5324 459,363 145,995 605,358 479,710 87,113 566,823 1,898,021 487,653 2,385,6745 384,217 84,572 468,789 417,376 85,843 503,219 1,617,446 332,981 1,950,4276 or more 424,259 84,202 508,460 451,209 79,920 531,129 1,646,493 381,092 2,027,585Mean 4.7 4.5 4.7 4.7 4.7 4.7 4.6 4.6 4.6
Number with working parent(s) 1,101,844 328,568 1,430,411 1,086,613 266,819 1,353,432 4,492,696 1,275,070 5,767,766
Annual family income relative to povertyb
Less than 50% FPL 459,108 0 459,108 443,097 0 443,097 1,839,625 0 1,839,62550% to <100% FPL 440,284 0 440,284 542,581 0 542,581 1,974,618 0 1,974,618100% to <130% FPL 334,968 0 334,968 329,759 0 329,759 1,294,457 0 1,294,457130% to <185% FPLd 429,241 25,931 455,172 441,614 22,699 464,313 1,787,616 122,430 1,910,046185% to <200% FPL 2,932 60,272 63,204 2,168 39,154 41,322 8,806 201,223 210,029200% to <250% FPL 702 126,432 127,134 280 94,472 94,752 3,077 482,212 485,288250% FPL and above 0 208,293 208,293 0 172,698 172,698 0 809,982 809,982
Annual family incomeMean $21,125 $75,639 $32,113 $21,072 $77,465 $29,957 $20,828 $76,899 $31,457Median $20,000 $57,000 $25,000 $20,000 $61,001 $24,000 $20,000 $60,000 $25,000
Benefit receiptNo benefit receipt 475,287 0 475,287 511,337 0 511,337 1,996,394 0 1,996,394FSP, TANF, & Medicaid 129,927 15,121 145,049 105,054 8,770 113,825 452,058 46,481 498,539FSP & TANF 0 0 0 0 0 0 0 0 0FSP & Medicaid 338 0 338 1,979 0 1,979 7,442 0 7,442TANF & Medicaid 534,466 60,316 594,782 533,537 25,452 558,989 2,111,696 194,543 2,306,238FSP only 13,616 5,637 19,253 11,308 0 11,308 74,432 12,549 86,982TANF only 0 0 0 0 0 0 0 0 0Medicaid only 65,253 10,296 75,549 105,016 9,219 114,235 332,214 48,851 381,065
Source: 2009 CPS-ASECSee notes at the end of this table.
WIC-Eligible Children Age 3
WIC-Eligible Children Age 4
WIC-Eligible Children Age 1 to 4

National‐ and State‐Level Estimates of WIC Eligibles and Program Reach: Appendices Page A‐15
Table A.7a-2008: Estimates of the Average Monthly Number of Infants and Children Eligible for WIC by Income and Adjunctive Eligibility in the 2009 CPS-ASEC by Demographic Characteristics - CY 2008Unadjusted weightsa
NOTE: This table does not include estimates for the territories.
Demographic Characteristics
Family income
<185% FPGb
Adjunct-ively
eligiblec Total
Family income
<185% FPGb
Adjunct-ively
eligiblec Total
Family income
<185% FPGb
Adjunct-ively
eligiblec TotalTotal 1,676,896 528,614 2,205,510 1,814,547 470,900 2,285,447 1,666,918 394,996 2,061,913
GenderMale 52.2 49.5 51.6 50.8 47.5 50.1 51.1 51.8 51.2Female 47.8 50.5 48.4 49.2 52.5 49.9 48.9 48.2 48.8
Race/ethnicityWhite, non-Hispanic 34.4 51.7 38.6 33.7 48.2 36.7 34.1 48.1 36.8Black, non-Hispanic 22.5 15.7 20.9 25.6 15.2 23.5 23.2 14.7 21.6Other, non-Hispanic 4.2 3.7 4.1 4.8 4.9 4.8 4.8 5.6 5.0Hispanic 38.8 28.8 36.4 35.9 31.7 35.0 37.9 31.7 36.7
Living arrangementTwo-parent family 59.6 68.5 61.8 56.8 64.7 58.4 56.1 66.2 58.0Single-parent family 36.6 25.8 34.0 38.0 28.0 35.9 38.8 28.2 36.8No-parent family 3.8 5.7 4.3 5.3 7.3 5.7 5.1 5.6 5.2
Related non-parent caretaker 2.6 5.7 3.3 3.9 7.3 4.6 3.4 5.6 3.8Unrelated non-parent caretaker 1.2 0.0 0.9 1.4 0.0 1.1 1.7 0.0 1.4
Household size (number of persons)2 4.9 2.2 4.3 5.8 2.6 5.2 5.3 2.3 4.73 25.8 27.4 26.2 23.7 27.8 24.5 18.7 20.2 19.04 27.2 25.5 26.8 26.0 25.2 25.8 29.3 34.4 30.25 18.3 17.4 18.1 23.6 17.8 22.4 23.3 19.9 22.66 or more 23.9 27.5 24.7 20.9 26.6 22.1 23.5 23.2 23.5
% with working parent(s) 57.9 75.6 62.2 63.8 76.1 66.3 68.8 81.4 71.2
Annual family income relative to povertyb
Less than 50% FPL 32.9 0.0 25.0 28.0 0.0 22.2 25.8 0.0 20.950% to <100% FPL 26.5 0.0 20.2 27.7 0.0 22.0 29.3 0.0 23.7100% to <130% FPL 18.3 0.0 13.9 16.6 0.0 13.1 19.8 0.0 16.0130% to <185% FPLd 21.9 7.3 18.4 27.6 7.6 23.5 25.0 9.6 22.0185% to <200% FPL 0.3 10.6 2.8 0.2 11.4 2.5 0.1 12.2 2.4200% to <250% FPL 0.0 26.7 6.4 0.0 30.9 6.4 0.1 29.3 5.7250% FPL and above 0.0 55.3 13.3 0.0 50.1 10.3 0.0 48.8 9.4
Benefit receiptNo benefit receipt 23.5 0.0 17.9 27.7 0.0 22.0 30.4 0.0 24.6FSP, TANF, & Medicaid 8.1 1.7 6.6 7.4 2.9 6.5 5.0 2.3 4.5FSP & TANF 0.0 0.0 0.0 0.0 0.0 0.0 0.0 0.0 0.0FSP & Medicaid 0.0 0.0 0.0 0.2 0.0 0.1 0.1 0.0 0.1TANF & Medicaid 29.6 13.8 25.8 30.4 12.8 26.7 29.6 12.3 26.2FSP only 0.8 0.8 0.8 1.8 0.7 1.5 1.0 1.0 1.0TANF only 0.0 0.0 0.0 0.0 0.0 0.0 0.0 0.0 0.0Medicaid only 4.4 4.8 4.5 4.2 4.2 4.2 5.1 2.4 4.6
Source: 2009 CPS-ASECSee notes at the end of this table.
WIC-Eligible InfantsWIC-Eligible Children
Age 1WIC-Eligible Children
Age 2
National‐ and State‐Level Estimates of WIC Eligibles and Program Reach: Appendices Page A‐16
Table A.7a-2008: Estimates of the Average Monthly Number of Infants and Children Eligible for WIC by Income and Adjunctive Eligibility in the 2009 CPS-ASEC by Demographic Characteristics - CY 2008Unadjusted weightsa
NOTE: This table does not include estimates for the territories.
Demographic Characteristics
Family income
<185% FPGb
Adjunct-ively
eligiblec Total
Family income
<185% FPGb
Adjunct-ively
eligiblec Total
Family income
<185% FPGb
Adjunct-ively
eligiblec TotalTotal 1,667,235 420,928 2,088,163 1,759,499 329,024 2,088,522 6,908,199 1,615,847 8,524,046
GenderMale 49.5 52.9 50.2 50.9 54.6 51.5 50.6 51.4 50.7Female 50.5 47.1 49.8 49.1 45.4 48.5 49.4 48.6 49.3
Race/ethnicityWhite, non-Hispanic 35.0 44.8 37.0 36.0 51.2 38.4 34.7 47.9 37.2Black, non-Hispanic 23.6 18.9 22.6 23.5 15.5 22.2 24.0 16.1 22.5Other, non-Hispanic 4.4 4.4 4.4 4.5 3.4 4.3 4.6 4.6 4.6Hispanic 37.0 31.9 36.0 36.0 29.9 35.0 36.7 31.4 35.7
Living arrangementTwo-parent family 53.3 59.0 54.5 49.1 57.1 50.3 53.8 62.0 55.4Single-parent family 42.1 35.3 40.7 45.1 37.1 43.8 41.0 31.8 39.2No-parent family 4.6 5.7 4.8 5.9 5.8 5.9 5.2 6.2 5.4
Related non-parent caretaker 2.7 5.7 3.3 3.9 5.8 4.2 3.5 6.2 4.0Unrelated non-parent caretaker 1.9 0.0 1.5 2.0 0.0 1.7 1.7 0.0 1.4
Household size (number of persons)2 5.5 3.8 5.1 4.9 6.4 5.1 5.4 3.6 5.03 18.5 21.4 19.1 18.5 16.7 18.2 19.9 22.0 20.34 27.6 34.7 29.0 27.3 26.5 27.1 27.5 30.2 28.05 23.0 20.1 22.4 23.7 26.1 24.1 23.4 20.6 22.96 or more 25.4 20.0 24.3 25.6 24.3 25.4 23.8 23.6 23.8
% with working parent(s) 66.1 78.1 68.5 61.8 81.1 64.8 65.0 78.9 67.7
Annual family income relative to povertyb
Less than 50% FPL 27.5 0.0 22.0 25.2 0.0 21.2 26.6 0.0 21.650% to <100% FPL 26.4 0.0 21.1 30.8 0.0 26.0 28.6 0.0 23.2100% to <130% FPL 20.1 0.0 16.0 18.7 0.0 15.8 18.7 0.0 15.2130% to <185% FPLd 25.7 6.2 21.8 25.1 6.9 22.2 25.9 7.6 22.4185% to <200% FPL 0.2 14.3 3.0 0.1 11.9 2.0 0.1 12.5 2.5200% to <250% FPL 0.0 30.0 6.1 0.0 28.7 4.5 0.0 29.8 5.7250% FPL and above 0.0 49.5 10.0 0.0 52.5 8.3 0.0 50.1 9.5
Benefit receiptNo benefit receipt 28.5 0.0 22.8 29.1 0.0 24.5 28.9 0.0 23.4FSP, TANF, & Medicaid 7.8 3.6 6.9 6.0 2.7 5.5 6.5 2.9 5.8FSP & TANF 0.0 0.0 0.0 0.0 0.0 0.0 0.0 0.0 0.0FSP & Medicaid 0.0 0.0 0.0 0.1 0.0 0.1 0.1 0.0 0.1TANF & Medicaid 32.1 14.3 28.5 30.3 7.7 26.8 30.6 12.0 27.1FSP only 0.8 1.3 0.9 0.6 0.0 0.5 1.1 0.8 1.0TANF only 0.0 0.0 0.0 0.0 0.0 0.0 0.0 0.0 0.0Medicaid only 3.9 2.4 3.6 6.0 2.8 5.5 4.8 3.0 4.5
Source: 2009 CPS-ASECSee notes at the end of this table.
WIC-Eligible Children Age 3
WIC-Eligible Children Age 4
WIC-Eligible Children Age 1 to 4
National‐ and State‐Level Estimates of WIC Eligibles and Program Reach: Appendices Page A‐17
Notes for Table A.7a-2008:FPG - Federal Poverty GuidelinesFPL - Federal Poverty Levela These estimates are tabulated from the unadjusted person weights on the 2009 CPS-ASEC.They are not adjusted to account for the under or over count of infants and children in the CPS relative to Census estimates, monthly income, or nutritional risk.bThis table uses both the Federal Poverty Guidelines (FPG) and the Federal Poverty Thresholds or "Levels" (FPL). The thresholds are used to calculate the ratio of annual family income to the povertythreshold for their family size. The guidelines are used in determining WIC eligibility. The Federal Poverty Thresholds are updated by the Census Bureau each year and are used mainlyto produce official poverty population estimates. The Federal Poverty Guidelines are issued by theDepartment of Health and Human Services (HHS) and are a simplification of the poverty thresholdsfor use in determining financial eligibility for certain federal programs, including WIC.c Infants and children adjunctively eligible are those whose family income was not below 185% FPG but who reported receipt of Food Stamps, Medicaid, or TANF. Therefore, the two categories are mutuallyexclusive.dThere are infants and children adjunctively eligible for WIC with annual family incomes above 185 percent of the Federal Poverty Guidelines (FPG) who have annual family incomes below 185% of the Federal Poverty Level (FPL). For example, in January 2008 a family of five with three children and an annual family income of $45,125 has an income to FPL ratio of 1.756, but an income to FPG ratio of 1.870 (FPL for a family of 5 = $25,694; FPG for a family of 5 = $24,130).
National‐ and State‐Level Estimates of WIC Eligibles and Program Reach: Appendices Page A‐18
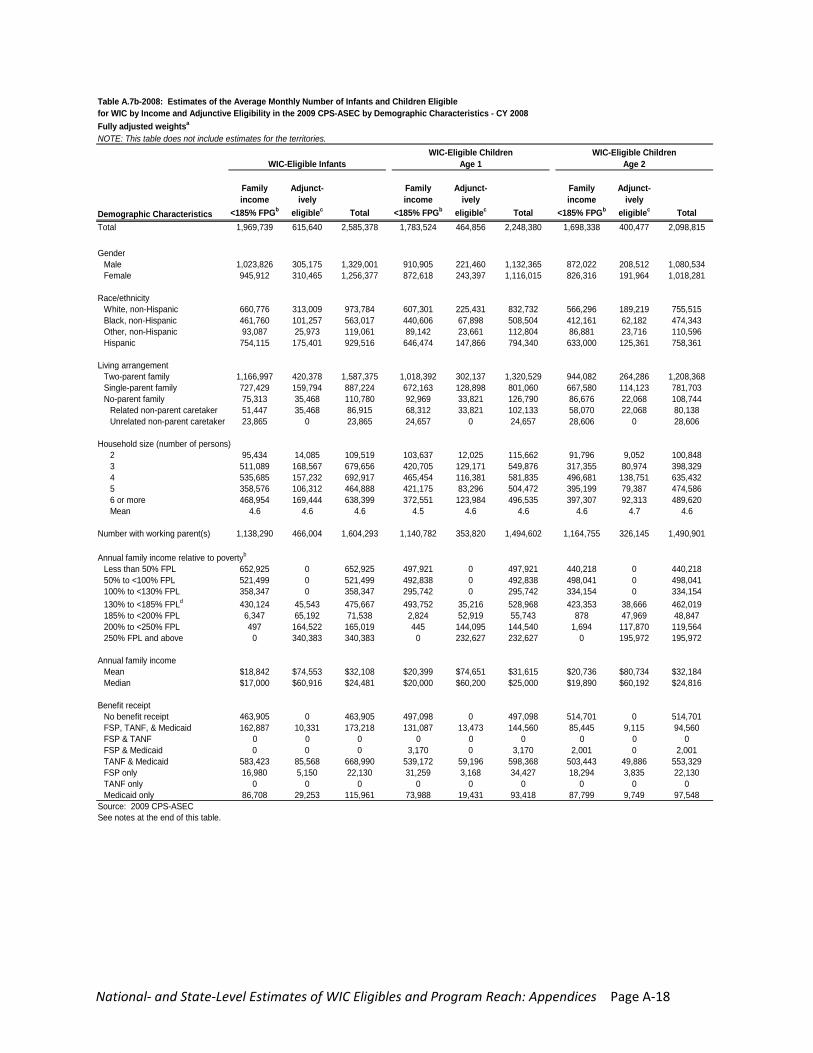
Table A.7b-2008: Estimates of the Average Monthly Number of Infants and Children Eligible for WIC by Income and Adjunctive Eligibility in the 2009 CPS-ASEC by Demographic Characteristics - CY 2008Fully adjusted weightsa
NOTE: This table does not include estimates for the territories.
Demographic Characteristics
Family income
<185% FPGb
Adjunct-ively
eligiblec Total
Family income
<185% FPGb
Adjunct-ively
eligiblec Total
Family income
<185% FPGb
Adjunct-ively
eligiblec TotalTotal 1,969,739 615,640 2,585,378 1,783,524 464,856 2,248,380 1,698,338 400,477 2,098,815
GenderMale 1,023,826 305,175 1,329,001 910,905 221,460 1,132,365 872,022 208,512 1,080,534Female 945,912 310,465 1,256,377 872,618 243,397 1,116,015 826,316 191,964 1,018,281
Race/ethnicityWhite, non-Hispanic 660,776 313,009 973,784 607,301 225,431 832,732 566,296 189,219 755,515Black, non-Hispanic 461,760 101,257 563,017 440,606 67,898 508,504 412,161 62,182 474,343Other, non-Hispanic 93,087 25,973 119,061 89,142 23,661 112,804 86,881 23,716 110,596Hispanic 754,115 175,401 929,516 646,474 147,866 794,340 633,000 125,361 758,361
Living arrangementTwo-parent family 1,166,997 420,378 1,587,375 1,018,392 302,137 1,320,529 944,082 264,286 1,208,368Single-parent family 727,429 159,794 887,224 672,163 128,898 801,060 667,580 114,123 781,703No-parent family 75,313 35,468 110,780 92,969 33,821 126,790 86,676 22,068 108,744
Related non-parent caretaker 51,447 35,468 86,915 68,312 33,821 102,133 58,070 22,068 80,138Unrelated non-parent caretaker 23,865 0 23,865 24,657 0 24,657 28,606 0 28,606
Household size (number of persons)2 95,434 14,085 109,519 103,637 12,025 115,662 91,796 9,052 100,8483 511,089 168,567 679,656 420,705 129,171 549,876 317,355 80,974 398,3294 535,685 157,232 692,917 465,454 116,381 581,835 496,681 138,751 635,4325 358,576 106,312 464,888 421,175 83,296 504,472 395,199 79,387 474,5866 or more 468,954 169,444 638,399 372,551 123,984 496,535 397,307 92,313 489,620Mean 4.6 4.6 4.6 4.5 4.6 4.6 4.6 4.7 4.6
Number with working parent(s) 1,138,290 466,004 1,604,293 1,140,782 353,820 1,494,602 1,164,755 326,145 1,490,901
Annual family income relative to povertyb
Less than 50% FPL 652,925 0 652,925 497,921 0 497,921 440,218 0 440,21850% to <100% FPL 521,499 0 521,499 492,838 0 492,838 498,041 0 498,041100% to <130% FPL 358,347 0 358,347 295,742 0 295,742 334,154 0 334,154130% to <185% FPLd 430,124 45,543 475,667 493,752 35,216 528,968 423,353 38,666 462,019185% to <200% FPL 6,347 65,192 71,538 2,824 52,919 55,743 878 47,969 48,847200% to <250% FPL 497 164,522 165,019 445 144,095 144,540 1,694 117,870 119,564250% FPL and above 0 340,383 340,383 0 232,627 232,627 0 195,972 195,972
Annual family incomeMean $18,842 $74,553 $32,108 $20,399 $74,651 $31,615 $20,736 $80,734 $32,184Median $17,000 $60,916 $24,481 $20,000 $60,200 $25,000 $19,890 $60,192 $24,816
Benefit receiptNo benefit receipt 463,905 0 463,905 497,098 0 497,098 514,701 0 514,701FSP, TANF, & Medicaid 162,887 10,331 173,218 131,087 13,473 144,560 85,445 9,115 94,560FSP & TANF 0 0 0 0 0 0 0 0 0FSP & Medicaid 0 0 0 3,170 0 3,170 2,001 0 2,001TANF & Medicaid 583,423 85,568 668,990 539,172 59,196 598,368 503,443 49,886 553,329FSP only 16,980 5,150 22,130 31,259 3,168 34,427 18,294 3,835 22,130TANF only 0 0 0 0 0 0 0 0 0Medicaid only 86,708 29,253 115,961 73,988 19,431 93,418 87,799 9,749 97,548
Source: 2009 CPS-ASECSee notes at the end of this table.
WIC-Eligible InfantsWIC-Eligible Children
Age 1WIC-Eligible Children
Age 2

National‐ and State‐Level Estimates of WIC Eligibles and Program Reach: Appendices Page A‐19
Table A.7b-2008: Estimates of the Average Monthly Number of Infants and Children Eligible for WIC by Income and Adjunctive Eligibility in the 2009 CPS-ASEC by Demographic Characteristics - CY 2008Fully adjusted weightsa
NOTE: This table does not include estimates for the territories.
Demographic Characteristics
Family income
<185% FPGb
Adjunct-ively
eligiblec Total
Family income
<185% FPGb
Adjunct-ively
eligiblec Total
Family income
<185% FPGb
Adjunct-ively
eligiblec TotalTotal 1,654,585 418,223 2,072,808 1,734,612 324,957 2,059,569 6,871,058 1,608,514 8,479,572
GenderMale 815,281 220,658 1,035,938 879,910 177,125 1,057,036 3,478,118 827,755 4,305,873Female 839,304 197,566 1,036,870 854,701 147,832 1,002,533 3,392,940 780,759 4,173,698
Race/ethnicityWhite, non-Hispanic 581,663 188,187 769,850 631,161 167,925 799,085 2,386,421 770,761 3,157,182Black, non-Hispanic 381,498 76,895 458,392 388,665 47,886 436,551 1,622,929 254,861 1,877,790Other, non-Hispanic 76,289 19,118 95,407 83,539 11,572 95,111 335,851 78,067 413,918Hispanic 615,135 134,024 749,159 631,247 97,575 728,822 2,525,857 504,825 3,030,682
Living arrangementTwo-parent family 885,880 246,952 1,132,832 858,553 185,813 1,044,367 3,706,907 999,189 4,706,096Single-parent family 693,652 147,379 841,031 775,010 120,490 895,500 2,808,405 510,889 3,319,294No-parent family 75,053 23,893 98,945 101,048 18,654 119,702 355,746 98,436 454,182
Related non-parent caretaker 43,784 23,893 67,676 66,711 18,654 85,365 236,877 98,436 335,313Unrelated non-parent caretaker 31,269 0 31,269 34,337 0 34,337 118,869 0 118,869
Household size (number of persons)2 89,942 15,844 105,786 83,523 20,417 103,940 368,898 57,337 426,2353 305,385 89,298 394,683 319,272 54,544 373,816 1,362,718 353,986 1,716,7044 455,832 145,108 600,939 474,335 86,287 560,622 1,892,303 486,526 2,378,8295 381,992 84,437 466,429 411,347 84,692 496,038 1,609,714 331,812 1,941,5256 or more 421,434 83,538 504,971 446,135 79,018 525,152 1,637,426 378,852 2,016,279Mean 4.7 4.5 4.7 4.7 4.7 4.7 4.7 4.6 4.6
Number with working parent(s) 1,095,495 326,542 1,422,037 1,075,226 263,175 1,338,401 4,476,258 1,269,683 5,745,941
Annual family income relative to povertyb
Less than 50% FPL 454,515 0 454,515 435,426 0 435,426 1,828,080 0 1,828,08050% to <100% FPL 436,694 0 436,694 535,289 0 535,289 1,962,863 0 1,962,863100% to <130% FPL 333,030 0 333,030 324,614 0 324,614 1,287,540 0 1,287,540130% to <185% FPLd 426,666 25,750 452,416 436,798 22,284 459,082 1,780,570 121,915 1,902,485185% to <200% FPL 2,944 59,710 62,655 2,197 38,794 40,991 8,844 199,392 208,236200% to <250% FPL 735 125,750 126,485 287 93,236 93,523 3,161 480,951 484,112250% FPL and above 0 207,013 207,013 0 170,644 170,644 0 806,256 806,256
Annual family incomeMean $21,147 $75,534 $32,120 $21,114 $77,465 $30,005 $20,843 $76,963 $31,489Median $20,000 $57,000 $25,000 $20,000 $61,001 $24,000 $20,000 $60,000 $25,000
Benefit receiptNo benefit receipt 472,367 0 472,367 506,885 0 506,885 1,991,049 0 1,991,049FSP, TANF, & Medicaid 128,033 14,929 142,962 102,452 8,569 111,021 447,016 46,087 493,103FSP & TANF 0 0 0 0 0 0 0 0 0FSP & Medicaid 362 0 362 1,924 0 1,924 7,456 0 7,456TANF & Medicaid 529,795 59,916 589,711 524,940 25,160 550,100 2,097,350 194,158 2,291,508FSP only 13,456 5,485 18,941 11,091 0 11,091 74,100 12,488 86,588TANF only 0 0 0 0 0 0 0 0 0Medicaid only 64,849 10,174 75,024 102,505 9,061 111,566 329,140 48,416 377,556
Source: 2009 CPS-ASECSee notes at the end of this table.
WIC-Eligible Children Age 3
WIC-Eligible Children Age 4
WIC-Eligible Children Age 1 to 4

National‐ and State‐Level Estimates of WIC Eligibles and Program Reach: Appendices Page A‐20
Table A.7b-2008: Estimates of the Average Monthly Number of Infants and Children Eligible for WIC by Income and Adjunctive Eligibility in the 2009 CPS-ASEC by Demographic Characteristics - CY 2008Fully adjusted weightsa
NOTE: This table does not include estimates for the territories.
Demographic Characteristics
Family income
<185% FPGb
Adjunct-ively
eligiblec Total
Family income
<185% FPGb
Adjunct-ively
eligiblec Total
Family income
<185% FPGb
Adjunct-ively
eligiblec TotalTotal 1,969,739 615,640 2,585,378 1,783,524 464,856 2,248,380 1,698,338 400,477 2,098,815
GenderMale 52.0 49.6 51.4 51.1 47.6 50.4 51.3 52.1 51.5Female 48.0 50.4 48.6 48.9 52.4 49.6 48.7 47.9 48.5
Race/ethnicityWhite, non-Hispanic 33.5 50.8 37.7 34.1 48.5 37.0 33.3 47.2 36.0Black, non-Hispanic 23.4 16.4 21.8 24.7 14.6 22.6 24.3 15.5 22.6Other, non-Hispanic 4.7 4.2 4.6 5.0 5.1 5.0 5.1 5.9 5.3Hispanic 38.3 28.5 36.0 36.2 31.8 35.3 37.3 31.3 36.1
Living arrangementTwo-parent family 59.2 68.3 61.4 57.1 65.0 58.7 55.6 66.0 57.6Single-parent family 36.9 26.0 34.3 37.7 27.7 35.6 39.3 28.5 37.2No-parent family 3.8 5.8 4.3 5.2 7.3 5.6 5.1 5.5 5.2
Related non-parent caretaker 2.6 5.8 3.4 3.8 7.3 4.5 3.4 5.5 3.8Unrelated non-parent caretaker 1.2 0.0 0.9 1.4 0.0 1.1 1.7 0.0 1.4
Household size (number of persons)2 4.8 2.3 4.2 5.8 2.6 5.1 5.4 2.3 4.83 25.9 27.4 26.3 23.6 27.8 24.5 18.7 20.2 19.04 27.2 25.5 26.8 26.1 25.0 25.9 29.2 34.6 30.35 18.2 17.3 18.0 23.6 17.9 22.4 23.3 19.8 22.66 or more 23.8 27.5 24.7 20.9 26.7 22.1 23.4 23.1 23.3
% with working parent(s) 57.8 75.7 62.1 64.0 76.1 66.5 68.6 81.4 71.0
Annual family income relative to povertyb
Less than 50% FPL 33.1 0.0 25.3 27.9 0.0 22.1 25.9 0.0 21.050% to <100% FPL 26.5 0.0 20.2 27.6 0.0 21.9 29.3 0.0 23.7100% to <130% FPL 18.2 0.0 13.9 16.6 0.0 13.2 19.7 0.0 15.9130% to <185% FPLd 21.8 7.4 18.4 27.7 7.6 23.5 24.9 9.7 22.0185% to <200% FPL 0.3 10.6 2.8 0.2 11.4 2.5 0.1 12.0 2.3200% to <250% FPL 0.0 26.7 6.4 0.0 31.0 6.4 0.1 29.4 5.7250% FPL and above 0.0 55.3 13.2 0.0 50.0 10.3 0.0 48.9 9.3
Benefit receiptNo benefit receipt 23.6 0.0 17.9 27.9 0.0 22.1 30.3 0.0 24.5FSP, TANF, & Medicaid 8.3 1.7 6.7 7.3 2.9 6.4 5.0 2.3 4.5FSP & TANF 0.0 0.0 0.0 0.0 0.0 0.0 0.0 0.0 0.0FSP & Medicaid 0.0 0.0 0.0 0.2 0.0 0.1 0.1 0.0 0.1TANF & Medicaid 29.6 13.9 25.9 30.2 12.7 26.6 29.6 12.5 26.4FSP only 0.9 0.8 0.9 1.8 0.7 1.5 1.1 1.0 1.1TANF only 0.0 0.0 0.0 0.0 0.0 0.0 0.0 0.0 0.0Medicaid only 4.4 4.8 4.5 4.1 4.2 4.2 5.2 2.4 4.6
Source: 2009 CPS-ASECSee notes at the end of this table.
WIC-Eligible InfantsWIC-Eligible Children
Age 1WIC-Eligible Children
Age 2

National‐ and State‐Level Estimates of WIC Eligibles and Program Reach: Appendices Page A‐21
Table A.7b-2008: Estimates of the Average Monthly Number of Infants and Children Eligible for WIC by Income and Adjunctive Eligibility in the 2009 CPS-ASEC by Demographic Characteristics - CY 2008Fully adjusted weightsa
NOTE: This table does not include estimates for the territories.
Demographic Characteristics
Family income
<185% FPGb
Adjunct-ively
eligiblec Total
Family income
<185% FPGb
Adjunct-ively
eligiblec Total
Family income
<185% FPGb
Adjunct-ively
eligiblec TotalTotal 1,654,585 418,223 2,072,808 1,734,612 324,957 2,059,569 6,871,058 1,608,514 8,479,572
GenderMale 49.3 52.8 50.0 50.7 54.5 51.3 50.6 51.5 50.8Female 50.7 47.2 50.0 49.3 45.5 48.7 49.4 48.5 49.2
Race/ethnicityWhite, non-Hispanic 35.2 45.0 37.1 36.4 51.7 38.8 34.7 47.9 37.2Black, non-Hispanic 23.1 18.4 22.1 22.4 14.7 21.2 23.6 15.8 22.1Other, non-Hispanic 4.6 4.6 4.6 4.8 3.6 4.6 4.9 4.9 4.9Hispanic 37.2 32.0 36.1 36.4 30.0 35.4 36.8 31.4 35.7
Living arrangementTwo-parent family 53.5 59.0 54.7 49.5 57.2 50.7 53.9 62.1 55.5Single-parent family 41.9 35.2 40.6 44.7 37.1 43.5 40.9 31.8 39.1No-parent family 4.5 5.7 4.8 5.8 5.7 5.8 5.2 6.1 5.4
Related non-parent caretaker 2.6 5.7 3.3 3.8 5.7 4.1 3.4 6.1 4.0Unrelated non-parent caretaker 1.9 0.0 1.5 2.0 0.0 1.7 1.7 0.0 1.4
Household size (number of persons)2 5.4 3.8 5.1 4.8 6.3 5.0 5.4 3.6 5.03 18.5 21.4 19.0 18.4 16.8 18.2 19.8 22.0 20.24 27.5 34.7 29.0 27.3 26.6 27.2 27.5 30.2 28.15 23.1 20.2 22.5 23.7 26.1 24.1 23.4 20.6 22.96 or more 25.5 20.0 24.4 25.7 24.3 25.5 23.8 23.6 23.8
% with working parent(s) 66.2 78.1 68.6 62.0 81.0 65.0 65.1 78.9 67.8
Annual family income relative to povertyb
Less than 50% FPL 27.5 0.0 21.9 25.1 0.0 21.1 26.6 0.0 21.650% to <100% FPL 26.4 0.0 21.1 30.9 0.0 26.0 28.6 0.0 23.1100% to <130% FPL 20.1 0.0 16.1 18.7 0.0 15.8 18.7 0.0 15.2130% to <185% FPLd 25.8 6.2 21.8 25.2 6.9 22.3 25.9 7.6 22.4185% to <200% FPL 0.2 14.3 3.0 0.1 11.9 2.0 0.1 12.4 2.5200% to <250% FPL 0.0 30.1 6.1 0.0 28.7 4.5 0.0 29.9 5.7250% FPL and above 0.0 49.5 10.0 0.0 52.5 8.3 0.0 50.1 9.5
Benefit receiptNo benefit receipt 28.5 0.0 22.8 29.2 0.0 24.6 29.0 0.0 23.5FSP, TANF, & Medicaid 7.7 3.6 6.9 5.9 2.6 5.4 6.5 2.9 5.8FSP & TANF 0.0 0.0 0.0 0.0 0.0 0.0 0.0 0.0 0.0FSP & Medicaid 0.0 0.0 0.0 0.1 0.0 0.1 0.1 0.0 0.1TANF & Medicaid 32.0 14.3 28.4 30.3 7.7 26.7 30.5 12.1 27.0FSP only 0.8 1.3 0.9 0.6 0.0 0.5 1.1 0.8 1.0TANF only 0.0 0.0 0.0 0.0 0.0 0.0 0.0 0.0 0.0Medicaid only 3.9 2.4 3.6 5.9 2.8 5.4 4.8 3.0 4.5
Source: 2009 CPS-ASECSee notes at the end of this table.
WIC-Eligible Children Age 3
WIC-Eligible Children Age 4
WIC-Eligible Children Age 1 to 4

National‐ and State‐Level Estimates of WIC Eligibles and Program Reach: Appendices Page A‐22
Notes for Table A.7b-2008:FPG - Federal Poverty GuidelinesFPL - Federal Poverty Levela These estimates are tabulated from the fully adjusted person weights on the 2009 CPS-ASEC.They are adjusted to account for the under or over count of infants and children in the CPS relative to Census estimates, monthly income, and nutritional risk.See Tables 3, 4a, and 4b for the adjustment factors.bThis table uses both the Federal Poverty Guidelines (FPG) and the Federal Poverty Thresholds or "Levels" (FPL). The thresholds are used to calculate the ratio of annual family income to the povertythreshold for their family size. The guidelines are used in determining WIC eligibility. The Federal Poverty Thresholds are updated by the Census Bureau each year and are used mainlyto produce official poverty population estimates. The Federal Poverty Guidelines are issued by theDepartment of Health and Human Services (HHS) and are a simplification of the poverty thresholdsfor use in determining financial eligibility for certain federal programs, including WIC.c Infants and children adjunctively eligible are those whose family income was not below 185% FPG but who reported receipt of Food Stamps, Medicaid, or TANF. Therefore, the two categories are mutuallyexclusive.dThere are infants and children adjunctively eligible for WIC with annual family incomes above 185 percent of the Federal Poverty Guidelines (FPG) who have annual family incomes below 185% of the Federal Poverty Level (FPL). For example, in Jan 2008 a family of five with three children and an annual family income of $45,125 has an income to FPL ratio of 1.756, but an income to FPG ratio of 1.870 (FPL for a family of 5 = $25,694; FPG for a family of 5 = $24,130).
National‐ and State‐Level Estimates of WIC Eligibles and Program Reach: Appendices Page A‐23
NOTE: This table includes estimates for the territories.
Participant Group Eligiblesa
Non-Eligiblesb Totalc Eligiblesa
Non-Eligiblesb Totalc Eligibles
Non-Eligibles Total
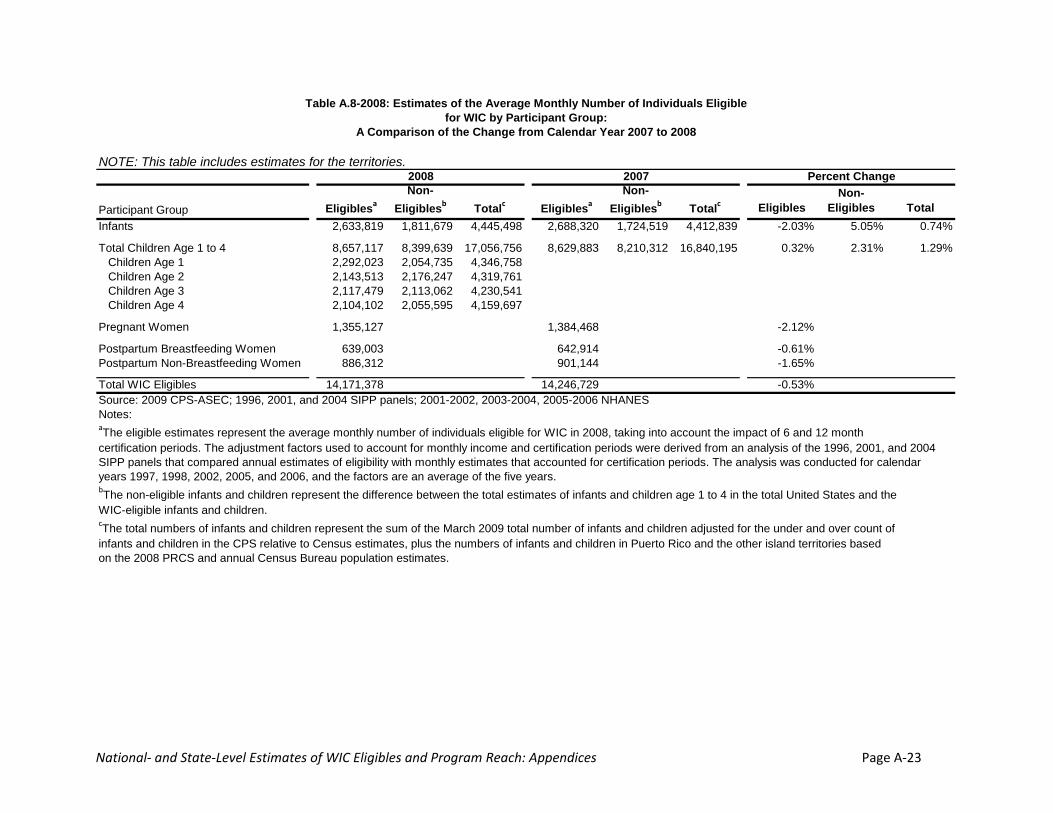
Infants 2,633,819 1,811,679 4,445,498 2,688,320 1,724,519 4,412,839 -2.03% 5.05% 0.74%
Total Children Age 1 to 4 8,657,117 8,399,639 17,056,756 8,629,883 8,210,312 16,840,195 0.32% 2.31% 1.29%Children Age 1 2,292,023 2,054,735 4,346,758Children Age 2 2,143,513 2,176,247 4,319,761Children Age 3 2,117,479 2,113,062 4,230,541Children Age 4 2,104,102 2,055,595 4,159,697
Pregnant Women 1,355,127 1,384,468 -2.12%
Postpartum Breastfeeding Women 639,003 642,914 -0.61%Postpartum Non-Breastfeeding Women 886,312 901,144 -1.65%
Total WIC Eligibles 14,171,378 14,246,729 -0.53%Source: 2009 CPS-ASEC; 1996, 2001, and 2004 SIPP panels; 2001-2002, 2003-2004, 2005-2006 NHANESNotes:aThe eligible estimates represent the average monthly number of individuals eligible for WIC in 2008, taking into account the impact of 6 and 12 month certification periods. The adjustment factors used to account for monthly income and certification periods were derived from an analysis of the 1996, 2001, and 2004SIPP panels that compared annual estimates of eligibility with monthly estimates that accounted for certification periods. The analysis was conducted for calendaryears 1997, 1998, 2002, 2005, and 2006, and the factors are an average of the five years.bThe non-eligible infants and children represent the difference between the total estimates of infants and children age 1 to 4 in the total United States and the WIC-eligible infants and children.cThe total numbers of infants and children represent the sum of the March 2009 total number of infants and children adjusted for the under and over count of infants and children in the CPS relative to Census estimates, plus the numbers of infants and children in Puerto Rico and the other island territories basedon the 2008 PRCS and annual Census Bureau population estimates.
Table A.8-2008: Estimates of the Average Monthly Number of Individuals Eligiblefor WIC by Participant Group:
A Comparison of the Change from Calendar Year 2007 to 2008
2008 2007 Percent Change
National‐ and State‐Level Estimates of WIC Eligibles and Program Reach: Appendices Page A‐24
NOTE: This table does not include estimates for the territories.
InfantsChildren Age 1 to 4 Total Infants
Children Age 1 to 4 Total Infants
Children Age 1 to 4 Total
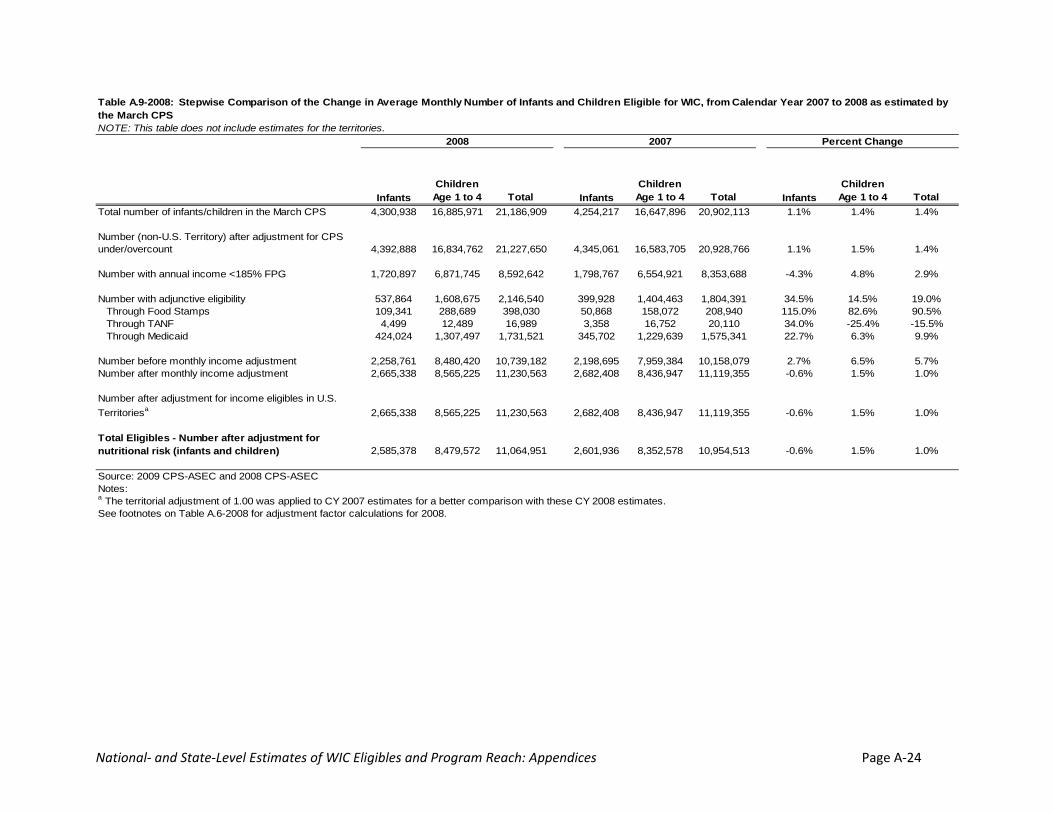
Total number of infants/children in the March CPS 4,300,938 16,885,971 21,186,909 4,254,217 16,647,896 20,902,113 1.1% 1.4% 1.4%
Number (non-U.S. Territory) after adjustment for CPS under/overcount 4,392,888 16,834,762 21,227,650 4,345,061 16,583,705 20,928,766 1.1% 1.5% 1.4%
Number with annual income <185% FPG 1,720,897 6,871,745 8,592,642 1,798,767 6,554,921 8,353,688 -4.3% 4.8% 2.9%
Number with adjunctive eligibility 537,864 1,608,675 2,146,540 399,928 1,404,463 1,804,391 34.5% 14.5% 19.0%Through Food Stamps 109,341 288,689 398,030 50,868 158,072 208,940 115.0% 82.6% 90.5%Through TANF 4,499 12,489 16,989 3,358 16,752 20,110 34.0% -25.4% -15.5%Through Medicaid 424,024 1,307,497 1,731,521 345,702 1,229,639 1,575,341 22.7% 6.3% 9.9%
Number before monthly income adjustment 2,258,761 8,480,420 10,739,182 2,198,695 7,959,384 10,158,079 2.7% 6.5% 5.7%Number after monthly income adjustment 2,665,338 8,565,225 11,230,563 2,682,408 8,436,947 11,119,355 -0.6% 1.5% 1.0%
Number after adjustment for income eligibles in U.S. Territoriesa 2,665,338 8,565,225 11,230,563 2,682,408 8,436,947 11,119,355 -0.6% 1.5% 1.0%
Total Eligibles - Number after adjustment for nutritional risk (infants and children) 2,585,378 8,479,572 11,064,951 2,601,936 8,352,578 10,954,513 -0.6% 1.5% 1.0%
Source: 2009 CPS-ASEC and 2008 CPS-ASECNotes:
See footnotes on Table A.6-2008 for adjustment factor calculations for 2008.
2008 2007 Percent Change
Table A.9-2008: Stepwise Comparison of the Change in Average Monthly Number of Infants and Children Eligible for WIC, from Calendar Year 2007 to 2008 as estimated by the March CPS
a The territorial adjustment of 1.00 was applied to CY 2007 estimates for a better comparison with these CY 2008 estimates.
National‐ and State‐Level Estimates of WIC Eligibles and Program Reach: Appendices Page A‐25
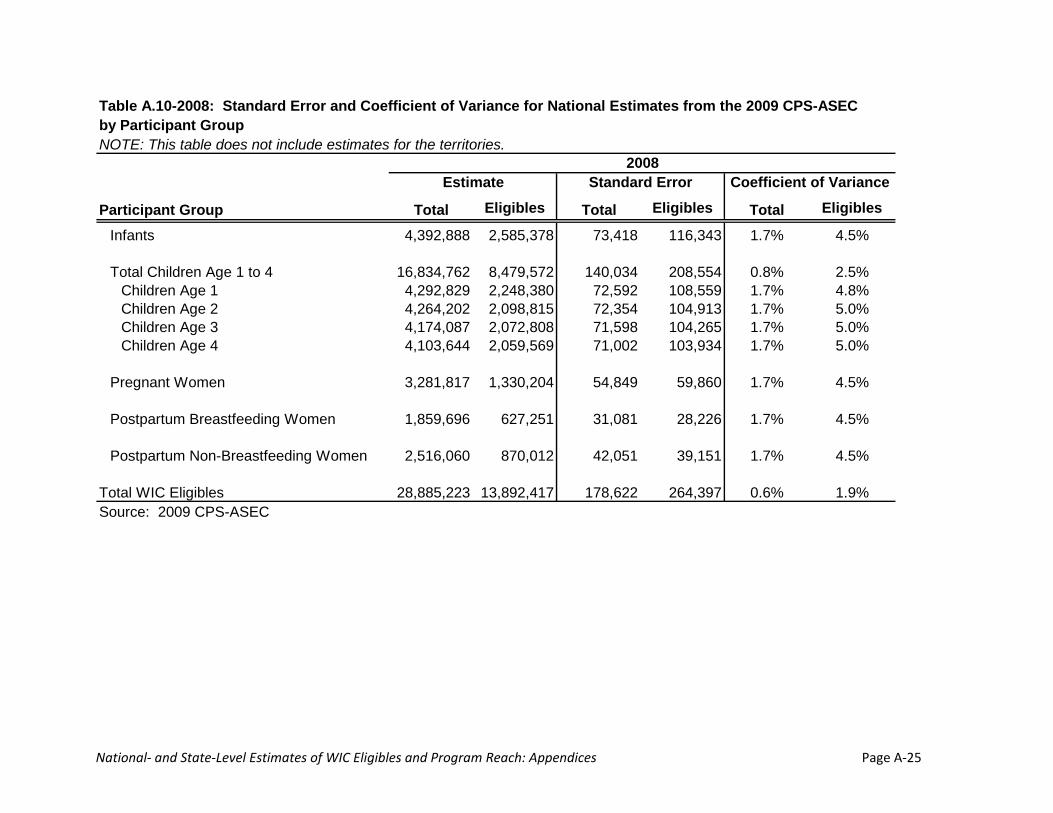
Table A.10-2008: Standard Error and Coefficient of Variance for National Estimates from the 2009 CPS-ASECby Participant GroupNOTE: This table does not include estimates for the territories.
Participant Group Total Eligibles Total Eligibles Total Eligibles
Infants 4,392,888 2,585,378 73,418 116,343 1.7% 4.5%
Total Children Age 1 to 4 16,834,762 8,479,572 140,034 208,554 0.8% 2.5%Children Age 1 4,292,829 2,248,380 72,592 108,559 1.7% 4.8%Children Age 2 4,264,202 2,098,815 72,354 104,913 1.7% 5.0%Children Age 3 4,174,087 2,072,808 71,598 104,265 1.7% 5.0%Children Age 4 4,103,644 2,059,569 71,002 103,934 1.7% 5.0%
Pregnant Women 3,281,817 1,330,204 54,849 59,860 1.7% 4.5%
Postpartum Breastfeeding Women 1,859,696 627,251 31,081 28,226 1.7% 4.5%
Postpartum Non-Breastfeeding Women 2,516,060 870,012 42,051 39,151 1.7% 4.5%
Total WIC Eligibles 28,885,223 13,892,417 178,622 264,397 0.6% 1.9%Source: 2009 CPS-ASEC
Estimate2008
Standard Error Coefficient of Variance
National‐ and State‐Level Estimates of WIC Eligibles and Program Reach: Appendices Page A‐26
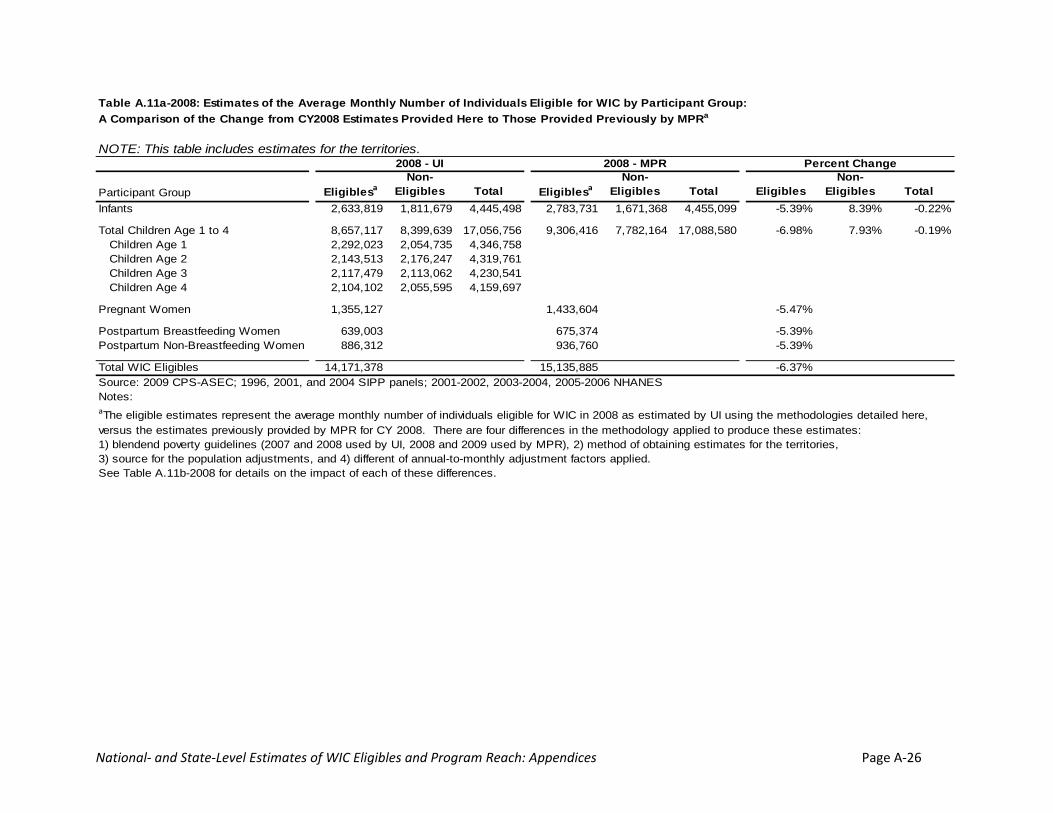
NOTE: This table includes estimates for the territories.
Participant Group EligiblesaNon-
Eligibles Total EligiblesaNon-
Eligibles Total EligiblesNon-
Eligibles TotalInfants 2,633,819 1,811,679 4,445,498 2,783,731 1,671,368 4,455,099 -5.39% 8.39% -0.22%
Total Children Age 1 to 4 8,657,117 8,399,639 17,056,756 9,306,416 7,782,164 17,088,580 -6.98% 7.93% -0.19%Children Age 1 2,292,023 2,054,735 4,346,758Children Age 2 2,143,513 2,176,247 4,319,761Children Age 3 2,117,479 2,113,062 4,230,541Children Age 4 2,104,102 2,055,595 4,159,697
Pregnant Women 1,355,127 1,433,604 -5.47%
Postpartum Breastfeeding Women 639,003 675,374 -5.39%Postpartum Non-Breastfeeding Women 886,312 936,760 -5.39%
Total WIC Eligibles 14,171,378 15,135,885 -6.37%Source: 2009 CPS-ASEC; 1996, 2001, and 2004 SIPP panels; 2001-2002, 2003-2004, 2005-2006 NHANESNotes:aThe eligible estimates represent the average monthly number of individuals eligible for WIC in 2008 as estimated by UI using the methodologies detailed here,versus the estimates previously provided by MPR for CY 2008. There are four differences in the methodology applied to produce these estimates:1) blendend poverty guidelines (2007 and 2008 used by UI, 2008 and 2009 used by MPR), 2) method of obtaining estimates for the territories,3) source for the population adjustments, and 4) different of annual-to-monthly adjustment factors applied. See Table A.11b-2008 for details on the impact of each of these differences.
Table A.11a-2008: Estimates of the Average Monthly Number of Individuals Eligible for WIC by Participant Group:A Comparison of the Change from CY2008 Estimates Provided Here to Those Provided Previously by MPRa
2008 - UI 2008 - MPR Percent Change
National and State‐Level Estimates of WIC Eligibles and Program Reach: Appendices Page A‐27
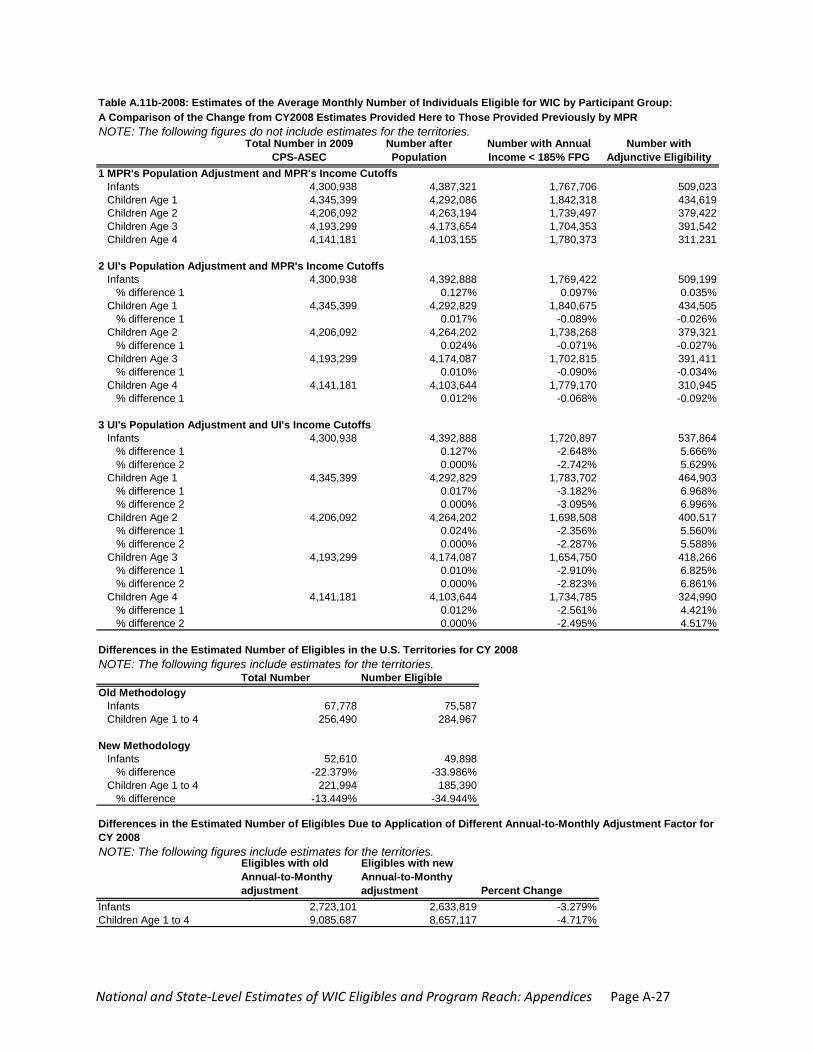
Table A.11b-2008: Estimates of the Average Monthly Number of Individuals Eligible for WIC by Participant Group:A Comparison of the Change from CY2008 Estimates Provided Here to Those Provided Previously by MPRNOTE: The following figures do not include estimates for the territories.
Total Number in 2009 CPS-ASEC
Number after Population
Number with Annual Income < 185% FPG
Number with Adjunctive Eligibility
1 MPR's Population Adjustment and MPR's Income CutoffsInfants 4,300,938 4,387,321 1,767,706 509,023Children Age 1 4,345,399 4,292,086 1,842,318 434,619Children Age 2 4,206,092 4,263,194 1,739,497 379,422Children Age 3 4,193,299 4,173,654 1,704,353 391,542Children Age 4 4,141,181 4,103,155 1,780,373 311,231
2 UI's Population Adjustment and MPR's Income CutoffsInfants 4,300,938 4,392,888 1,769,422 509,199
% difference 1 0.127% 0.097% 0.035%Children Age 1 4,345,399 4,292,829 1,840,675 434,505
% difference 1 0.017% -0.089% -0.026%Children Age 2 4,206,092 4,264,202 1,738,268 379,321
% difference 1 0.024% -0.071% -0.027%Children Age 3 4,193,299 4,174,087 1,702,815 391,411
% difference 1 0.010% -0.090% -0.034%Children Age 4 4,141,181 4,103,644 1,779,170 310,945
% difference 1 0.012% -0.068% -0.092%
3 UI's Population Adjustment and UI's Income CutoffsInfants 4,300,938 4,392,888 1,720,897 537,864
% difference 1 0.127% -2.648% 5.666%% difference 2 0.000% -2.742% 5.629%
Children Age 1 4,345,399 4,292,829 1,783,702 464,903% difference 1 0.017% -3.182% 6.968%% difference 2 0.000% -3.095% 6.996%
Children Age 2 4,206,092 4,264,202 1,698,508 400,517% difference 1 0.024% -2.356% 5.560%% difference 2 0.000% -2.287% 5.588%
Children Age 3 4,193,299 4,174,087 1,654,750 418,266% difference 1 0.010% -2.910% 6.825%% difference 2 0.000% -2.823% 6.861%
Children Age 4 4,141,181 4,103,644 1,734,785 324,990% difference 1 0.012% -2.561% 4.421%% difference 2 0.000% -2.495% 4.517%
Differences in the Estimated Number of Eligibles in the U.S. Territories for CY 2008NOTE: The following figures include estimates for the territories.
Total Number Number EligibleOld Methodology
Infants 67,778 75,587Children Age 1 to 4 256,490 284,967
New MethodologyInfants 52,610 49,898
% difference -22.379% -33.986%Children Age 1 to 4 221,994 185,390
% difference -13.449% -34.944%
NOTE: The following figures include estimates for the territories.Eligibles with old Annual-to-Monthy adjustment
Eligibles with new Annual-to-Monthy adjustment Percent Change
Infants 2,723,101 2,633,819 -3.279%Children Age 1 to 4 9,085,687 8,657,117 -4.717%
Differences in the Estimated Number of Eligibles Due to Application of Different Annual-to-Monthly Adjustment Factor for CY 2008
National‐ and State‐Level Estimates of WIC Eligibles and Program Reach: Appendices Page A‐28
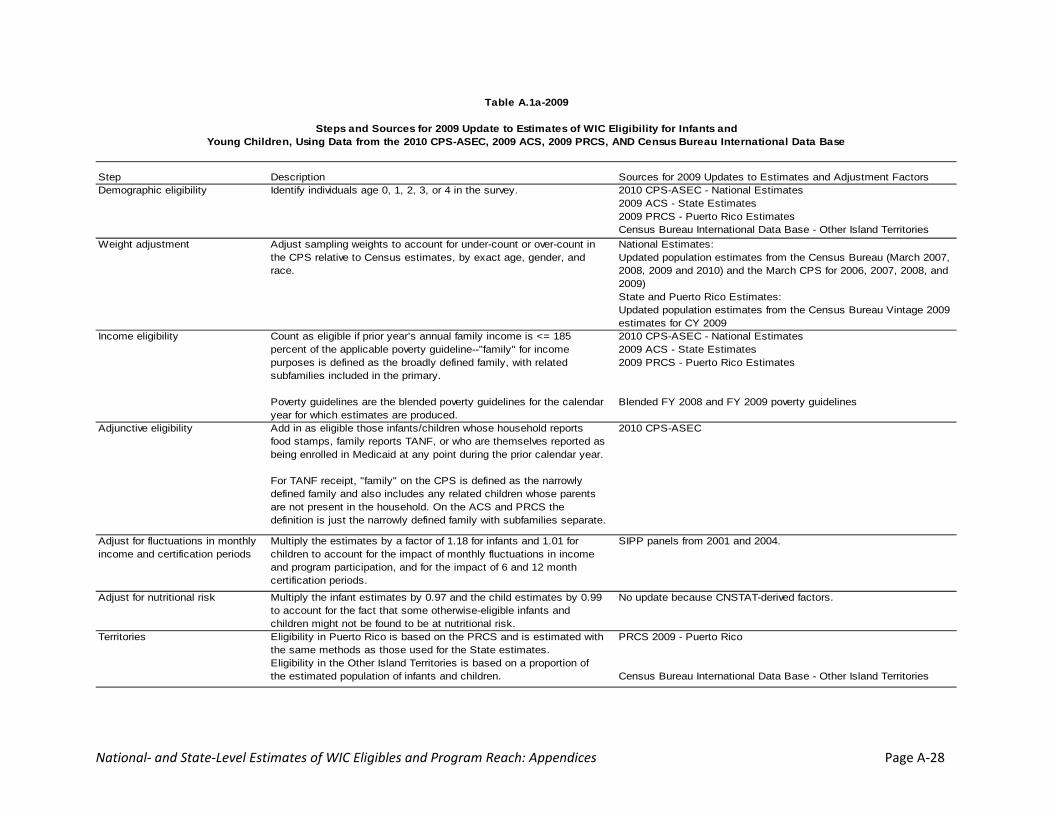
Step Description Sources for 2009 Updates to Estimates and Adjustment Factors Demographic eligibility Identify individuals age 0, 1, 2, 3, or 4 in the survey. 2010 CPS-ASEC - National Estimates
2009 ACS - State Estimates2009 PRCS - Puerto Rico EstimatesCensus Bureau International Data Base - Other Island Territories
Weight adjustment Adjust sampling weights to account for under-count or over-count in the CPS relative to Census estimates, by exact age, gender, and race.
National Estimates:Updated population estimates from the Census Bureau (March 2007, 2008, 2009 and 2010) and the March CPS for 2006, 2007, 2008, and 2009)State and Puerto Rico Estimates:Updated population estimates from the Census Bureau Vintage 2009 estimates for CY 2009
Income eligibility Count as eligible if prior year’s annual family income is <= 185 percent of the applicable poverty guideline--"family" for income purposes is defined as the broadly defined family, with related subfamilies included in the primary.
Poverty guidelines are the blended poverty guidelines for the calendar year for which estimates are produced.
2010 CPS-ASEC - National Estimates2009 ACS - State Estimates2009 PRCS - Puerto Rico Estimates
Blended FY 2008 and FY 2009 poverty guidelines
Adjunctive eligibility Add in as eligible those infants/children whose household reports food stamps, family reports TANF, or who are themselves reported as being enrolled in Medicaid at any point during the prior calendar year.
For TANF receipt, "family" on the CPS is defined as the narrowly defined family and also includes any related children whose parents are not present in the household. On the ACS and PRCS the definition is just the narrowly defined family with subfamilies separate.
2010 CPS-ASEC
Adjust for fluctuations in monthly income and certification periods
Multiply the estimates by a factor of 1.18 for infants and 1.01 for children to account for the impact of monthly fluctuations in income and program participation, and for the impact of 6 and 12 month certification periods.
SIPP panels from 2001 and 2004.
Adjust for nutritional risk Multiply the infant estimates by 0.97 and the child estimates by 0.99 to account for the fact that some otherwise-eligible infants and children might not be found to be at nutritional risk.
No update because CNSTAT-derived factors.
Territories Eligibility in Puerto Rico is based on the PRCS and is estimated with the same methods as those used for the State estimates.Eligibility in the Other Island Territories is based on a proportion of the estimated population of infants and children.
PRCS 2009 - Puerto Rico
Census Bureau International Data Base - Other Island Territories
Table A.1a-2009
Steps and Sources for 2009 Update to Estimates of WIC Eligibility for Infants andYoung Children, Using Data from the 2010 CPS-ASEC, 2009 ACS, 2009 PRCS, AND Census Bureau International Data Base
National‐ and State‐Level Estimates of WIC Eligibles and Program Reach: Appendices Page A‐29
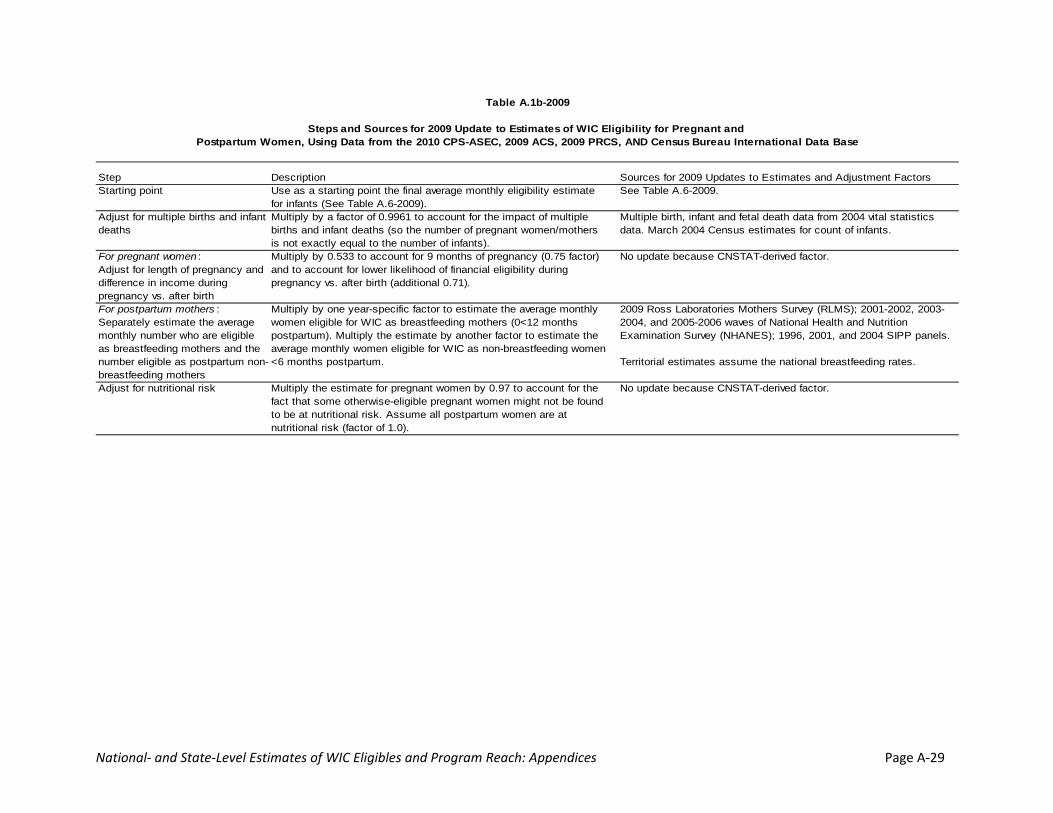
Step Description Sources for 2009 Updates to Estimates and Adjustment Factors Starting point Use as a starting point the final average monthly eligibility estimate
for infants (See Table A.6-2009). See Table A.6-2009.
Adjust for multiple births and infant deaths
Multiply by a factor of 0.9961 to account for the impact of multiple births and infant deaths (so the number of pregnant women/mothers is not exactly equal to the number of infants).
Multiple birth, infant and fetal death data from 2004 vital statistics data. March 2004 Census estimates for count of infants.
For pregnant women : Adjust for length of pregnancy and difference in income during pregnancy vs. after birth
Multiply by 0.533 to account for 9 months of pregnancy (0.75 factor) and to account for lower likelihood of financial eligibility during pregnancy vs. after birth (additional 0.71).
No update because CNSTAT-derived factor.
For postpartum mothers : Separately estimate the average monthly number who are eligible as breastfeeding mothers and the number eligible as postpartum non-breastfeeding mothers
Multiply by one year-specific factor to estimate the average monthly women eligible for WIC as breastfeeding mothers (0<12 months postpartum). Multiply the estimate by another factor to estimate the average monthly women eligible for WIC as non-breastfeeding women <6 months postpartum.
2009 Ross Laboratories Mothers Survey (RLMS); 2001-2002, 2003-2004, and 2005-2006 waves of National Health and Nutrition Examination Survey (NHANES); 1996, 2001, and 2004 SIPP panels.
Territorial estimates assume the national breastfeeding rates.
Adjust for nutritional risk Multiply the estimate for pregnant women by 0.97 to account for the fact that some otherwise-eligible pregnant women might not be found to be at nutritional risk. Assume all postpartum women are at nutritional risk (factor of 1.0).
No update because CNSTAT-derived factor.
Postpartum Women, Using Data from the 2010 CPS-ASEC, 2009 ACS, 2009 PRCS, AND Census Bureau International Data Base
Table A.1b-2009
Steps and Sources for 2009 Update to Estimates of WIC Eligibility for Pregnant and
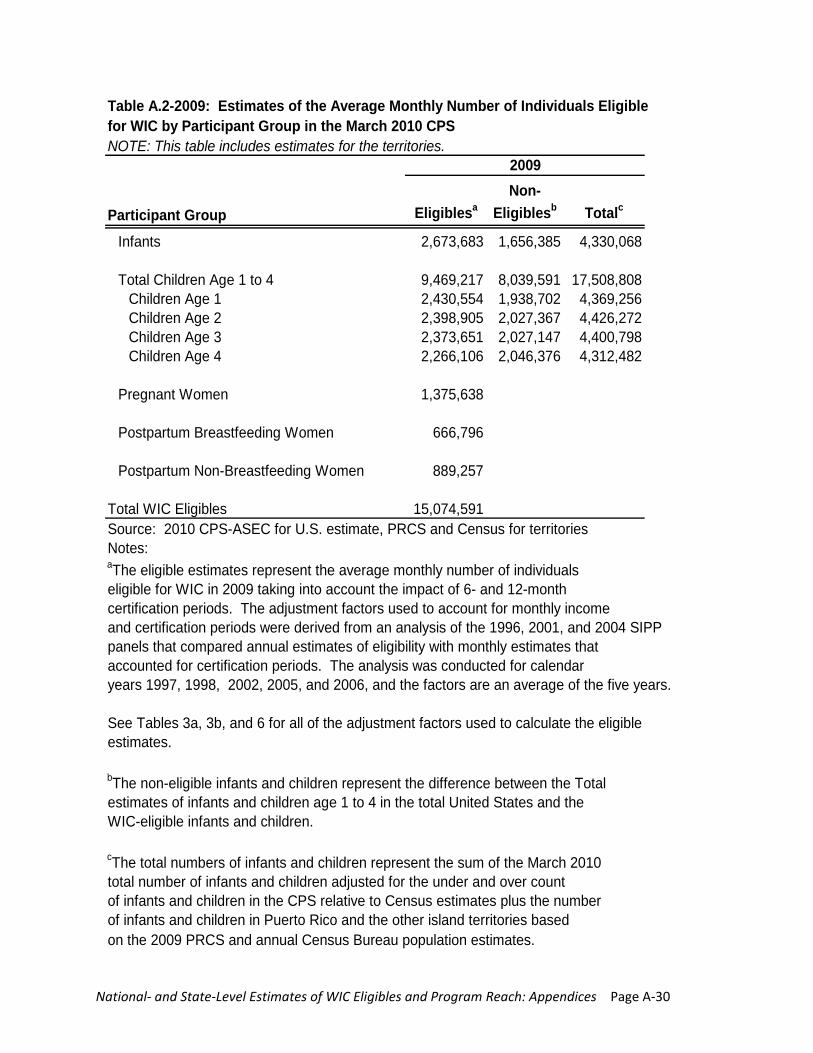
National‐ and State‐Level Estimates of WIC Eligibles and Program Reach: Appendices Page A‐30
Table A.2-2009: Estimates of the Average Monthly Number of Individuals Eligiblefor WIC by Participant Group in the March 2010 CPSNOTE: This table includes estimates for the territories.
Participant Group EligiblesaNon-
Eligiblesb Totalc
Infants 2,673,683 1,656,385 4,330,068
Total Children Age 1 to 4 9,469,217 8,039,591 17,508,808Children Age 1 2,430,554 1,938,702 4,369,256Children Age 2 2,398,905 2,027,367 4,426,272Children Age 3 2,373,651 2,027,147 4,400,798Children Age 4 2,266,106 2,046,376 4,312,482
Pregnant Women 1,375,638
Postpartum Breastfeeding Women 666,796
Postpartum Non-Breastfeeding Women 889,257
Total WIC Eligibles 15,074,591Source: 2010 CPS-ASEC for U.S. estimate, PRCS and Census for territoriesNotes:aThe eligible estimates represent the average monthly number of individuals eligible for WIC in 2009 taking into account the impact of 6- and 12-month certification periods. The adjustment factors used to account for monthly incomeand certification periods were derived from an analysis of the 1996, 2001, and 2004 SIPPpanels that compared annual estimates of eligibility with monthly estimates thataccounted for certification periods. The analysis was conducted for calendaryears 1997, 1998, 2002, 2005, and 2006, and the factors are an average of the five years.
See Tables 3a, 3b, and 6 for all of the adjustment factors used to calculate the eligibleestimates.
bThe non-eligible infants and children represent the difference between the Totalestimates of infants and children age 1 to 4 in the total United States and the WIC-eligible infants and children.
cThe total numbers of infants and children represent the sum of the March 2010total number of infants and children adjusted for the under and over countof infants and children in the CPS relative to Census estimates plus the numberof infants and children in Puerto Rico and the other island territories basedon the 2009 PRCS and annual Census Bureau population estimates.
2009
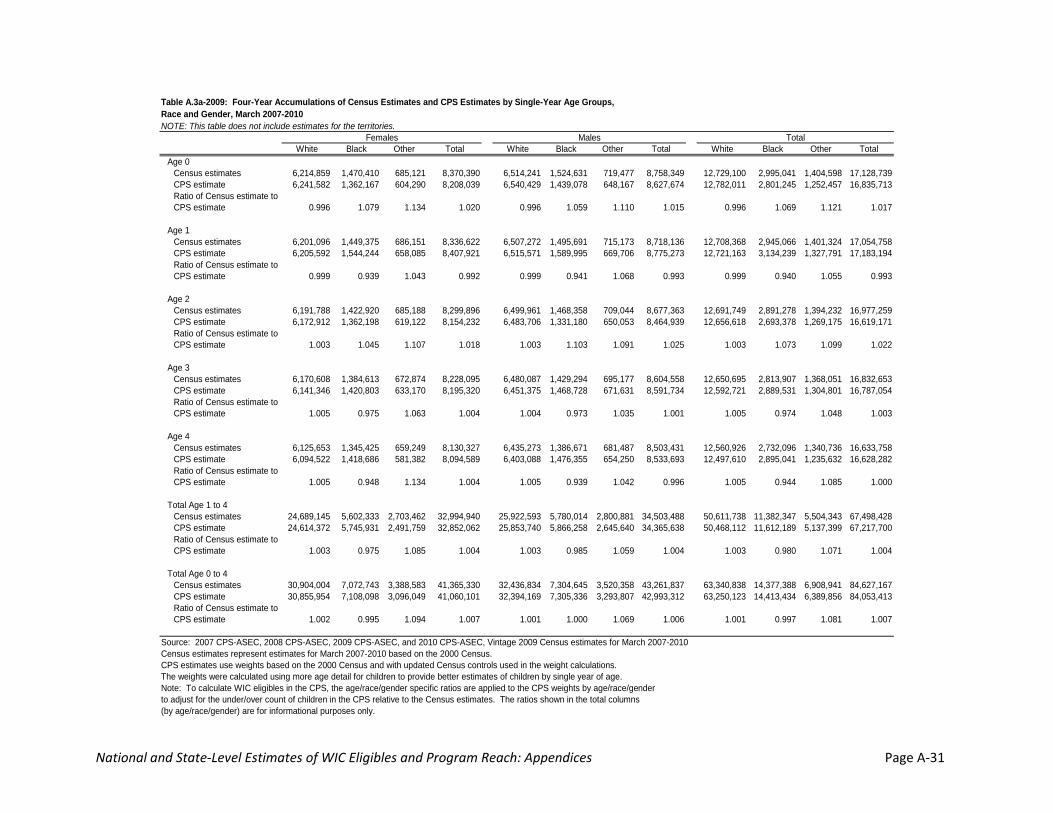
National and State‐Level Estimates of WIC Eligibles and Program Reach: Appendices Page A‐31
Table A.3a-2009: Four-Year Accumulations of Census Estimates and CPS Estimates by Single-Year Age Groups, Race and Gender, March 2007-2010NOTE: This table does not include estimates for the territories.
White Black Other Total White Black Other Total White Black Other TotalAge 0
Census estimates 6,214,859 1,470,410 685,121 8,370,390 6,514,241 1,524,631 719,477 8,758,349 12,729,100 2,995,041 1,404,598 17,128,739CPS estimate 6,241,582 1,362,167 604,290 8,208,039 6,540,429 1,439,078 648,167 8,627,674 12,782,011 2,801,245 1,252,457 16,835,713Ratio of Census estimate to CPS estimate 0.996 1.079 1.134 1.020 0.996 1.059 1.110 1.015 0.996 1.069 1.121 1.017
Age 1Census estimates 6,201,096 1,449,375 686,151 8,336,622 6,507,272 1,495,691 715,173 8,718,136 12,708,368 2,945,066 1,401,324 17,054,758CPS estimate 6,205,592 1,544,244 658,085 8,407,921 6,515,571 1,589,995 669,706 8,775,273 12,721,163 3,134,239 1,327,791 17,183,194Ratio of Census estimate to CPS estimate 0.999 0.939 1.043 0.992 0.999 0.941 1.068 0.993 0.999 0.940 1.055 0.993
Age 2Census estimates 6,191,788 1,422,920 685,188 8,299,896 6,499,961 1,468,358 709,044 8,677,363 12,691,749 2,891,278 1,394,232 16,977,259CPS estimate 6,172,912 1,362,198 619,122 8,154,232 6,483,706 1,331,180 650,053 8,464,939 12,656,618 2,693,378 1,269,175 16,619,171Ratio of Census estimate to CPS estimate 1.003 1.045 1.107 1.018 1.003 1.103 1.091 1.025 1.003 1.073 1.099 1.022
Age 3Census estimates 6,170,608 1,384,613 672,874 8,228,095 6,480,087 1,429,294 695,177 8,604,558 12,650,695 2,813,907 1,368,051 16,832,653CPS estimate 6,141,346 1,420,803 633,170 8,195,320 6,451,375 1,468,728 671,631 8,591,734 12,592,721 2,889,531 1,304,801 16,787,054Ratio of Census estimate to CPS estimate 1.005 0.975 1.063 1.004 1.004 0.973 1.035 1.001 1.005 0.974 1.048 1.003
Age 4Census estimates 6,125,653 1,345,425 659,249 8,130,327 6,435,273 1,386,671 681,487 8,503,431 12,560,926 2,732,096 1,340,736 16,633,758CPS estimate 6,094,522 1,418,686 581,382 8,094,589 6,403,088 1,476,355 654,250 8,533,693 12,497,610 2,895,041 1,235,632 16,628,282Ratio of Census estimate to CPS estimate 1.005 0.948 1.134 1.004 1.005 0.939 1.042 0.996 1.005 0.944 1.085 1.000
Total Age 1 to 4Census estimates 24,689,145 5,602,333 2,703,462 32,994,940 25,922,593 5,780,014 2,800,881 34,503,488 50,611,738 11,382,347 5,504,343 67,498,428CPS estimate 24,614,372 5,745,931 2,491,759 32,852,062 25,853,740 5,866,258 2,645,640 34,365,638 50,468,112 11,612,189 5,137,399 67,217,700Ratio of Census estimate to CPS estimate 1.003 0.975 1.085 1.004 1.003 0.985 1.059 1.004 1.003 0.980 1.071 1.004
Total Age 0 to 4Census estimates 30,904,004 7,072,743 3,388,583 41,365,330 32,436,834 7,304,645 3,520,358 43,261,837 63,340,838 14,377,388 6,908,941 84,627,167CPS estimate 30,855,954 7,108,098 3,096,049 41,060,101 32,394,169 7,305,336 3,293,807 42,993,312 63,250,123 14,413,434 6,389,856 84,053,413Ratio of Census estimate to CPS estimate 1.002 0.995 1.094 1.007 1.001 1.000 1.069 1.006 1.001 0.997 1.081 1.007
Source: 2007 CPS-ASEC, 2008 CPS-ASEC, 2009 CPS-ASEC, and 2010 CPS-ASEC, Vintage 2009 Census estimates for March 2007-2010Census estimates represent estimates for March 2007-2010 based on the 2000 Census. CPS estimates use weights based on the 2000 Census and with updated Census controls used in the weight calculations.The weights were calculated using more age detail for children to provide better estimates of children by single year of age.Note: To calculate WIC eligibles in the CPS, the age/race/gender specific ratios are applied to the CPS weights by age/race/genderto adjust for the under/over count of children in the CPS relative to the Census estimates. The ratios shown in the total columns (by age/race/gender) are for informational purposes only.
Females Males Total
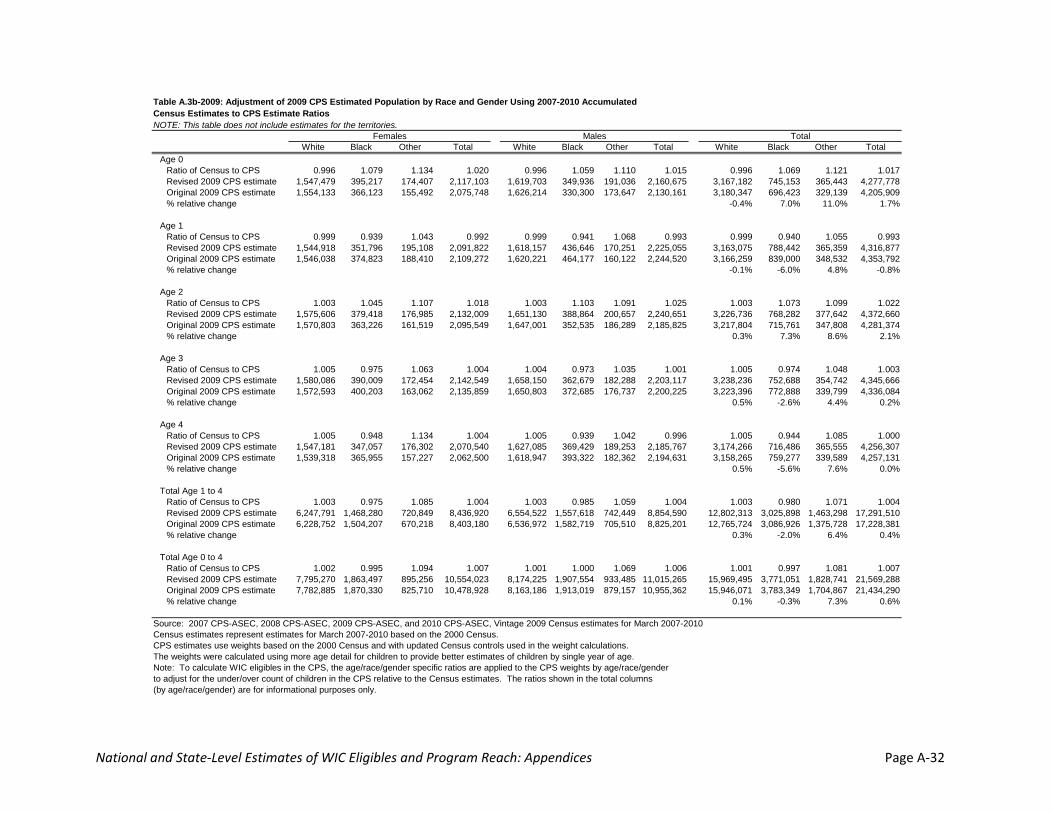
National and State‐Level Estimates of WIC Eligibles and Program Reach: Appendices Page A‐32
Table A.3b-2009: Adjustment of 2009 CPS Estimated Population by Race and Gender Using 2007-2010 Accumulated Census Estimates to CPS Estimate RatiosNOTE: This table does not include estimates for the territories.
White Black Other Total White Black Other Total White Black Other TotalAge 0
Ratio of Census to CPS 0.996 1.079 1.134 1.020 0.996 1.059 1.110 1.015 0.996 1.069 1.121 1.017Revised 2009 CPS estimate 1,547,479 395,217 174,407 2,117,103 1,619,703 349,936 191,036 2,160,675 3,167,182 745,153 365,443 4,277,778Original 2009 CPS estimate 1,554,133 366,123 155,492 2,075,748 1,626,214 330,300 173,647 2,130,161 3,180,347 696,423 329,139 4,205,909% relative change -0.4% 7.0% 11.0% 1.7%
Age 1Ratio of Census to CPS 0.999 0.939 1.043 0.992 0.999 0.941 1.068 0.993 0.999 0.940 1.055 0.993Revised 2009 CPS estimate 1,544,918 351,796 195,108 2,091,822 1,618,157 436,646 170,251 2,225,055 3,163,075 788,442 365,359 4,316,877Original 2009 CPS estimate 1,546,038 374,823 188,410 2,109,272 1,620,221 464,177 160,122 2,244,520 3,166,259 839,000 348,532 4,353,792% relative change -0.1% -6.0% 4.8% -0.8%
Age 2Ratio of Census to CPS 1.003 1.045 1.107 1.018 1.003 1.103 1.091 1.025 1.003 1.073 1.099 1.022Revised 2009 CPS estimate 1,575,606 379,418 176,985 2,132,009 1,651,130 388,864 200,657 2,240,651 3,226,736 768,282 377,642 4,372,660Original 2009 CPS estimate 1,570,803 363,226 161,519 2,095,549 1,647,001 352,535 186,289 2,185,825 3,217,804 715,761 347,808 4,281,374% relative change 0.3% 7.3% 8.6% 2.1%
Age 3Ratio of Census to CPS 1.005 0.975 1.063 1.004 1.004 0.973 1.035 1.001 1.005 0.974 1.048 1.003Revised 2009 CPS estimate 1,580,086 390,009 172,454 2,142,549 1,658,150 362,679 182,288 2,203,117 3,238,236 752,688 354,742 4,345,666Original 2009 CPS estimate 1,572,593 400,203 163,062 2,135,859 1,650,803 372,685 176,737 2,200,225 3,223,396 772,888 339,799 4,336,084% relative change 0.5% -2.6% 4.4% 0.2%
Age 4Ratio of Census to CPS 1.005 0.948 1.134 1.004 1.005 0.939 1.042 0.996 1.005 0.944 1.085 1.000Revised 2009 CPS estimate 1,547,181 347,057 176,302 2,070,540 1,627,085 369,429 189,253 2,185,767 3,174,266 716,486 365,555 4,256,307Original 2009 CPS estimate 1,539,318 365,955 157,227 2,062,500 1,618,947 393,322 182,362 2,194,631 3,158,265 759,277 339,589 4,257,131% relative change 0.5% -5.6% 7.6% 0.0%
Total Age 1 to 4Ratio of Census to CPS 1.003 0.975 1.085 1.004 1.003 0.985 1.059 1.004 1.003 0.980 1.071 1.004Revised 2009 CPS estimate 6,247,791 1,468,280 720,849 8,436,920 6,554,522 1,557,618 742,449 8,854,590 12,802,313 3,025,898 1,463,298 17,291,510Original 2009 CPS estimate 6,228,752 1,504,207 670,218 8,403,180 6,536,972 1,582,719 705,510 8,825,201 12,765,724 3,086,926 1,375,728 17,228,381% relative change 0.3% -2.0% 6.4% 0.4%
Total Age 0 to 4Ratio of Census to CPS 1.002 0.995 1.094 1.007 1.001 1.000 1.069 1.006 1.001 0.997 1.081 1.007Revised 2009 CPS estimate 7,795,270 1,863,497 895,256 10,554,023 8,174,225 1,907,554 933,485 11,015,265 15,969,495 3,771,051 1,828,741 21,569,288Original 2009 CPS estimate 7,782,885 1,870,330 825,710 10,478,928 8,163,186 1,913,019 879,157 10,955,362 15,946,071 3,783,349 1,704,867 21,434,290% relative change 0.1% -0.3% 7.3% 0.6%
Source: 2007 CPS-ASEC, 2008 CPS-ASEC, 2009 CPS-ASEC, and 2010 CPS-ASEC, Vintage 2009 Census estimates for March 2007-2010Census estimates represent estimates for March 2007-2010 based on the 2000 Census. CPS estimates use weights based on the 2000 Census and with updated Census controls used in the weight calculations.The weights were calculated using more age detail for children to provide better estimates of children by single year of age.Note: To calculate WIC eligibles in the CPS, the age/race/gender specific ratios are applied to the CPS weights by age/race/genderto adjust for the under/over count of children in the CPS relative to the Census estimates. The ratios shown in the total columns (by age/race/gender) are for informational purposes only.
Females Males Total
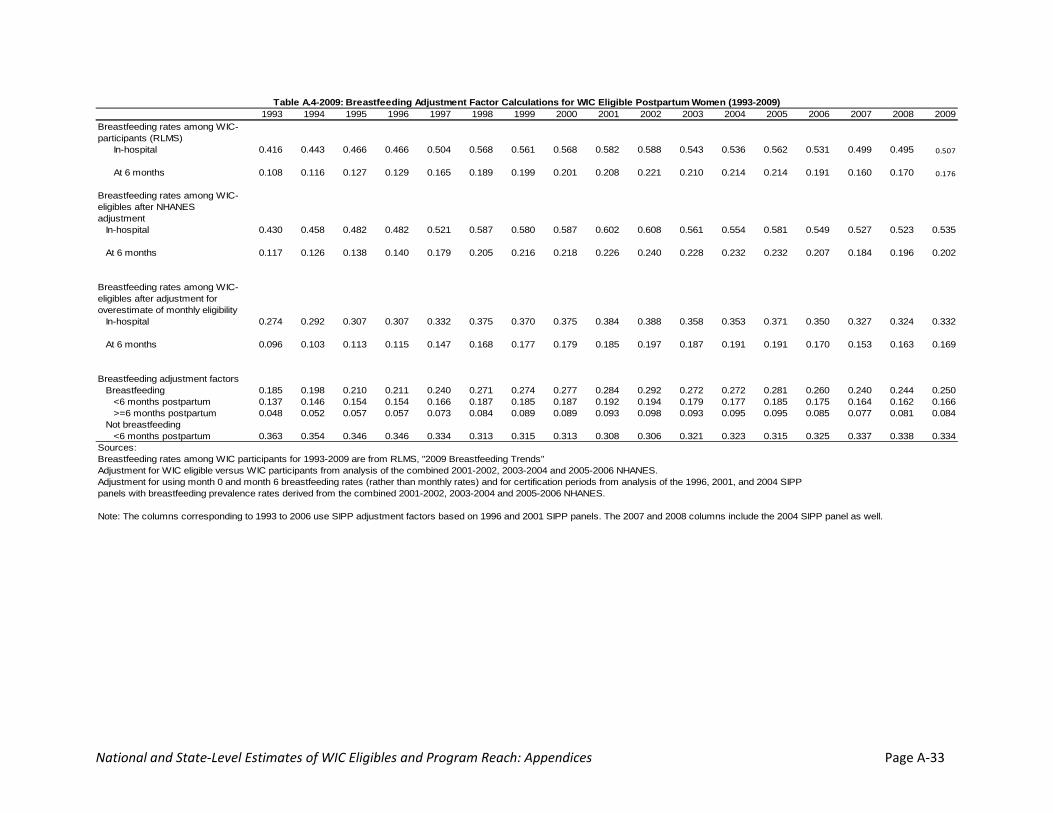
National and State‐Level Estimates of WIC Eligibles and Program Reach: Appendices Page A‐33
1993 1994 1995 1996 1997 1998 1999 2000 2001 2002 2003 2004 2005 2006 2007 2008 2009Breastfeeding rates among WIC-participants (RLMS)
In-hospital 0.416 0.443 0.466 0.466 0.504 0.568 0.561 0.568 0.582 0.588 0.543 0.536 0.562 0.531 0.499 0.495 0.507
At 6 months 0.108 0.116 0.127 0.129 0.165 0.189 0.199 0.201 0.208 0.221 0.210 0.214 0.214 0.191 0.160 0.170 0.176
Breastfeeding rates among WIC-eligibles after NHANES adjustment
In-hospital 0.430 0.458 0.482 0.482 0.521 0.587 0.580 0.587 0.602 0.608 0.561 0.554 0.581 0.549 0.527 0.523 0.535
At 6 months 0.117 0.126 0.138 0.140 0.179 0.205 0.216 0.218 0.226 0.240 0.228 0.232 0.232 0.207 0.184 0.196 0.202
Breastfeeding rates among WIC-eligibles after adjustment for overestimate of monthly eligibility
In-hospital 0.274 0.292 0.307 0.307 0.332 0.375 0.370 0.375 0.384 0.388 0.358 0.353 0.371 0.350 0.327 0.324 0.332
At 6 months 0.096 0.103 0.113 0.115 0.147 0.168 0.177 0.179 0.185 0.197 0.187 0.191 0.191 0.170 0.153 0.163 0.169
Breastfeeding adjustment factors Breastfeeding 0.185 0.198 0.210 0.211 0.240 0.271 0.274 0.277 0.284 0.292 0.272 0.272 0.281 0.260 0.240 0.244 0.250
<6 months postpartum 0.137 0.146 0.154 0.154 0.166 0.187 0.185 0.187 0.192 0.194 0.179 0.177 0.185 0.175 0.164 0.162 0.166>=6 months postpartum 0.048 0.052 0.057 0.057 0.073 0.084 0.089 0.089 0.093 0.098 0.093 0.095 0.095 0.085 0.077 0.081 0.084
Not breastfeeding <6 months postpartum 0.363 0.354 0.346 0.346 0.334 0.313 0.315 0.313 0.308 0.306 0.321 0.323 0.315 0.325 0.337 0.338 0.334
Sources:Breastfeeding rates among WIC participants for 1993-2009 are from RLMS, "2009 Breastfeeding Trends"Adjustment for WIC eligible versus WIC participants from analysis of the combined 2001-2002, 2003-2004 and 2005-2006 NHANES.Adjustment for using month 0 and month 6 breastfeeding rates (rather than monthly rates) and for certification periods from analysis of the 1996, 2001, and 2004 SIPPpanels with breastfeeding prevalence rates derived from the combined 2001-2002, 2003-2004 and 2005-2006 NHANES.
Note: The columns corresponding to 1993 to 2006 use SIPP adjustment factors based on 1996 and 2001 SIPP panels. The 2007 and 2008 columns include the 2004 SIPP panel as well.
Table A.4-2009: Breastfeeding Adjustment Factor Calculations for WIC Eligible Postpartum Women (1993-2009)
National and State‐Level Estimates of WIC Eligibles and Program Reach: Appendices Page A‐34
NOTE: This table includes estimates for the territories.
Participant Group Eligiblesa
Non-Eligiblesb Totalc Eligiblesa
Non-Eligiblesb Totalc Eligibles
Non-Eligibles Total
Infants 2,673,683 1,656,385 4,330,068 2,673,683 1,656,385 4,330,068 0.00% 0.00% 0.00%
Total Children Age 1 to 4 9,469,217 8,039,591 17,508,808 9,469,217 8,039,591 17,508,808 0.00% 0.00% 0.00%Children Age 1 2,430,554 1,938,702 4,369,256 2,430,554 1,938,702 4,369,256 0.00% 0.00% 0.00%Children Age 2 2,398,905 2,027,367 4,426,272 2,398,905 2,027,367 4,426,272 0.00% 0.00% 0.00%Children Age 3 2,373,651 2,027,147 4,400,798 2,373,651 2,027,147 4,400,798 0.00% 0.00% 0.00%Children Age 4 2,266,106 2,046,376 4,312,482 2,266,106 2,046,376 4,312,482 0.00% 0.00% 0.00%
Pregnant Women 1,375,638 1,375,638 0.00%
Postpartum Breastfeeding Women 666,796 648,675 2.79%Postpartum Non-Breastfeeding Women 889,257 899,727 -1.16%
Total WIC Eligibles 15,074,591 15,066,941 0.05%Source: 2010 CPS-ASEC; 1996, 2001, and 2004 SIPP panels; 2001-2002, 2003-2004, 2005-2006 NHANESNotes:aThe eligible estimates represent the average monthly number of individuals eligible for WIC in 2009, taking into account the impact of 6- and 12-month certification periods. The adjustment factors used to account for monthly income and certification periods were derived from an analysis of the 1996, 2001, and 2004SIPP panels that compared annual estimates of eligibility with monthly estimates that accounted for certification periods. The analysis was conducted for calendaryears 1997, 1998, 2002, 2005, and 2006, and the factors are an average of the five years.bThe non-eligible infants and children represent the difference between the total estimates of infants and children age 1 to 4 in the total United States and the WIC eligible-infants and children.cThe total numbers of infants and children represent the sum of the March 2010 total number of infants and children adjusted for the under and over count of infants and children in the CPS relative to Census estimates, plus the numbers of infants and children in Puerto Rico and the other island territories basedon the 2009 PRCS and annual Census Bureau population estimates.
Table A.5-2009: A Comparison of Estimates of the Average Monthly Number of Individuals Eligiblefor WIC by Participant Group in the March 2010 CPS
According to Whether the 2009 or 2008 Breastfeeding Rates are Used
2009 (Using 2009 Breastfeeding Rates) 2009 (Using 2008 Breastfeeding Rates) Percent Change
National and State‐Level Estimates of WIC Eligibles and Program Reach: Appendices Page A‐35
Table A.6-2009: Adjustments for Calculating the Average Monthly Number of Individuals Eligible for WIC by Participant GroupCY 2009 (2010 CPS-ASEC)NOTE: Estimates for the territories are added at the bottom of this table. The top portion of this table does not include estimates from the territories.
InfantsChildren
Age 1Children
Age 2Children
Age 3Children
Age 4Total Children
Age 1 to 4Pregnant Women
Postpartum Breastfeeding
Women
Postpartum Non-
Breastfeeding Women Total
Total number of infants/children in the 2010 CPS-ASEC 4,205,909 4,353,792 4,281,374 4,336,084 4,257,131 17,228,381 21,434,290
Number (non-U.S. Territory) after adjustment for CPS under/overcounta 4,277,778 4,316,877 4,372,660 4,345,666 4,256,307 17,291,510 21,569,288
Number with annual income <185% FPG 1,843,336 1,902,086 1,953,867 1,906,057 1,831,964 7,593,974 9,437,310
Number of additional people adjunctively eligible above 185% FPG 448,617 485,373 402,934 421,534 390,144 1,699,985 2,148,602
Through Food Stampsb 83,160 85,873 80,905 67,880 70,693 305,351 388,511Through TANF 5,206 2,405 4,047 10,070 14,586 31,108 36,314Through Medicaid 360,251 397,095 317,982 343,584 304,865 1,363,526 1,723,777
Total number income and adjunctively eligible 2,291,953 2,387,459 2,356,801 2,327,591 2,222,108 9,293,959 11,585,912
Number after monthly income adjustmentc 2,704,505 2,411,334 2,380,369 2,350,867 2,244,329 9,386,899 12,091,403
Total Eligibles - Number after adjustment for nutritional risk (infants and children)d 2,623,370 2,387,220 2,356,565 2,327,358 2,221,886 9,293,030 11,916,399
Starting point for estimates of women is fully eligible infants 2,623,370 2,623,370 2,623,370 7,870,109
Number after adjustment for length of pregnancy and income of woman during pregnancye 1,396,944 1,396,944
Number after adjustment for multiple births and infant deathsf 1,391,496 2,613,138 2,613,138 6,617,773
Number after adjustment for breastfeeding 654,248 872,523 1,526,771
Total Eligibles - Number after adjustment for nutritional risk (pregnant and postpartum women)d 1,349,751 654,248 872,523 2,876,522Source: March 2010 CPSSee notes on page 2.
CY 2009 - Eligibles in the U.S. Territories InfantsChildren
Age 1Children
Age 2Children
Age 3Children
Age 4Total Children
Age 1 to 4Pregnant Women
Postpartum Breastfeeding
Women
Postpartum Non-
Breastfeeding Women Total
Total Eligibles in the U.S. Territories 50,314 43,334 42,340 46,293 44,221 176,187 25,887 12,548 16,734 281,670Source: 2008 PRCS and Census International Data BaseSee Table C.8 for details.
Total Eligibles - States and Territories U.S. Total 2,673,683 2,430,554 2,398,905 2,373,651 2,266,106 9,469,217 1,375,638 666,796 889,257 15,074,591
National and State‐Level Estimates of WIC Eligibles and Program Reach: Appendices Page A‐36
Notes for Table A.6-2009: FPG = Federal poverty guidelines a See Tables 3a and 3b for the adjustment factors used to correct for the under/over count of infants and children in the CPS relative to estimates based on the Census. Table 4a compares two years of accumulated CPS and Census estimates for children age 0 to 4 by single years of age, gender, and race (white, black, and other) and calculates adjustment factors based on the ratio of the Census estimate to the CPS estimate. Table 4b shows the impact of the adjustment factors on the original March 2010 CPS estimates of children age 0 to 4 by single years of age, gender, and race. b There is a hierarchy imposed on the number of infants and children adjunctively eligible for WIC. Any mention of Food Stamps receipt is coded as Food Stamps; if no mention of Food Stamps, but report TANF, coded as TANF. If no mention of Food Stamps or TANF, coded as Medicaid. c The SIPP-based multipliers used to adjust for monthly versus annual income and to account for certification periods are:
Infants: 1.18 Children: 1.01
d The adjustment factors for nutritional risk by participant group are: Infants 0.97
Children 0.99 Pregnant women 0.97
Postpartum breastfeeding women 1.00 Postpartum non-breastfeeding women 1.00
e The multiplier used to adjust for the length of pregnancy and a woman's income during pregnancy is:
Pregnancy length and income 0.533 f The multiplier used to adjust for multiple births and infants deaths is:
Multiple births and infants death 0.9961 g The multipliers used to adjust for breastfeeding status are:
Less than 12 months who breastfeed 0.250 Less than 6 months who do not breastfeed 0.334
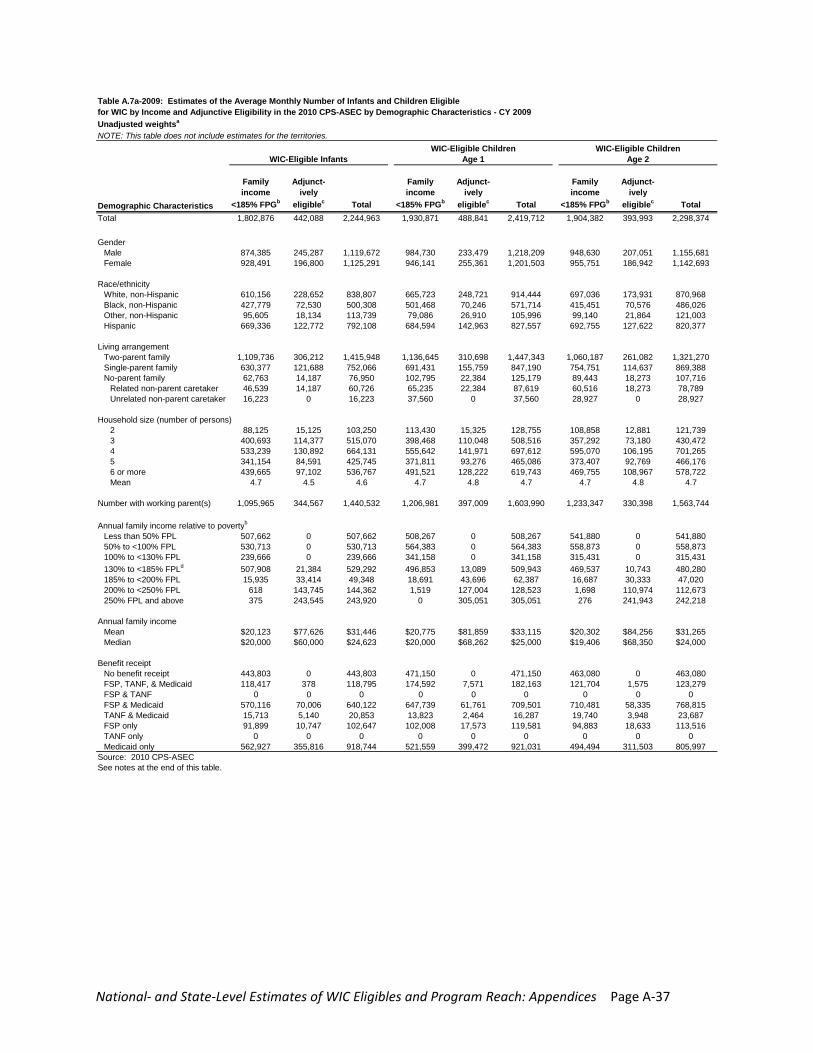
National‐ and State‐Level Estimates of WIC Eligibles and Program Reach: Appendices Page A‐37
Table A.7a-2009: Estimates of the Average Monthly Number of Infants and Children Eligible for WIC by Income and Adjunctive Eligibility in the 2010 CPS-ASEC by Demographic Characteristics - CY 2009Unadjusted weightsa
NOTE: This table does not include estimates for the territories.
Demographic Characteristics
Family income
<185% FPGb
Adjunct-ively
eligiblec Total
Family income
<185% FPGb
Adjunct-ively
eligiblec Total
Family income
<185% FPGb
Adjunct-ively
eligiblec TotalTotal 1,802,876 442,088 2,244,963 1,930,871 488,841 2,419,712 1,904,382 393,993 2,298,374
GenderMale 874,385 245,287 1,119,672 984,730 233,479 1,218,209 948,630 207,051 1,155,681Female 928,491 196,800 1,125,291 946,141 255,361 1,201,503 955,751 186,942 1,142,693
Race/ethnicityWhite, non-Hispanic 610,156 228,652 838,807 665,723 248,721 914,444 697,036 173,931 870,968Black, non-Hispanic 427,779 72,530 500,308 501,468 70,246 571,714 415,451 70,576 486,026Other, non-Hispanic 95,605 18,134 113,739 79,086 26,910 105,996 99,140 21,864 121,003Hispanic 669,336 122,772 792,108 684,594 142,963 827,557 692,755 127,622 820,377
Living arrangementTwo-parent family 1,109,736 306,212 1,415,948 1,136,645 310,698 1,447,343 1,060,187 261,082 1,321,270Single-parent family 630,377 121,688 752,066 691,431 155,759 847,190 754,751 114,637 869,388No-parent family 62,763 14,187 76,950 102,795 22,384 125,179 89,443 18,273 107,716
Related non-parent caretaker 46,539 14,187 60,726 65,235 22,384 87,619 60,516 18,273 78,789Unrelated non-parent caretaker 16,223 0 16,223 37,560 0 37,560 28,927 0 28,927
Household size (number of persons)2 88,125 15,125 103,250 113,430 15,325 128,755 108,858 12,881 121,7393 400,693 114,377 515,070 398,468 110,048 508,516 357,292 73,180 430,4724 533,239 130,892 664,131 555,642 141,971 697,612 595,070 106,195 701,2655 341,154 84,591 425,745 371,811 93,276 465,086 373,407 92,769 466,1766 or more 439,665 97,102 536,767 491,521 128,222 619,743 469,755 108,967 578,722Mean 4.7 4.5 4.6 4.7 4.8 4.7 4.7 4.8 4.7
Number with working parent(s) 1,095,965 344,567 1,440,532 1,206,981 397,009 1,603,990 1,233,347 330,398 1,563,744
Annual family income relative to povertyb
Less than 50% FPL 507,662 0 507,662 508,267 0 508,267 541,880 0 541,88050% to <100% FPL 530,713 0 530,713 564,383 0 564,383 558,873 0 558,873100% to <130% FPL 239,666 0 239,666 341,158 0 341,158 315,431 0 315,431130% to <185% FPLd 507,908 21,384 529,292 496,853 13,089 509,943 469,537 10,743 480,280185% to <200% FPL 15,935 33,414 49,348 18,691 43,696 62,387 16,687 30,333 47,020200% to <250% FPL 618 143,745 144,362 1,519 127,004 128,523 1,698 110,974 112,673250% FPL and above 375 243,545 243,920 0 305,051 305,051 276 241,943 242,218
Annual family incomeMean $20,123 $77,626 $31,446 $20,775 $81,859 $33,115 $20,302 $84,256 $31,265Median $20,000 $60,000 $24,623 $20,000 $68,262 $25,000 $19,406 $68,350 $24,000
Benefit receiptNo benefit receipt 443,803 0 443,803 471,150 0 471,150 463,080 0 463,080FSP, TANF, & Medicaid 118,417 378 118,795 174,592 7,571 182,163 121,704 1,575 123,279FSP & TANF 0 0 0 0 0 0 0 0 0FSP & Medicaid 570,116 70,006 640,122 647,739 61,761 709,501 710,481 58,335 768,815TANF & Medicaid 15,713 5,140 20,853 13,823 2,464 16,287 19,740 3,948 23,687FSP only 91,899 10,747 102,647 102,008 17,573 119,581 94,883 18,633 113,516TANF only 0 0 0 0 0 0 0 0 0Medicaid only 562,927 355,816 918,744 521,559 399,472 921,031 494,494 311,503 805,997
Source: 2010 CPS-ASECSee notes at the end of this table.
WIC-Eligible InfantsWIC-Eligible Children
Age 1WIC-Eligible Children
Age 2
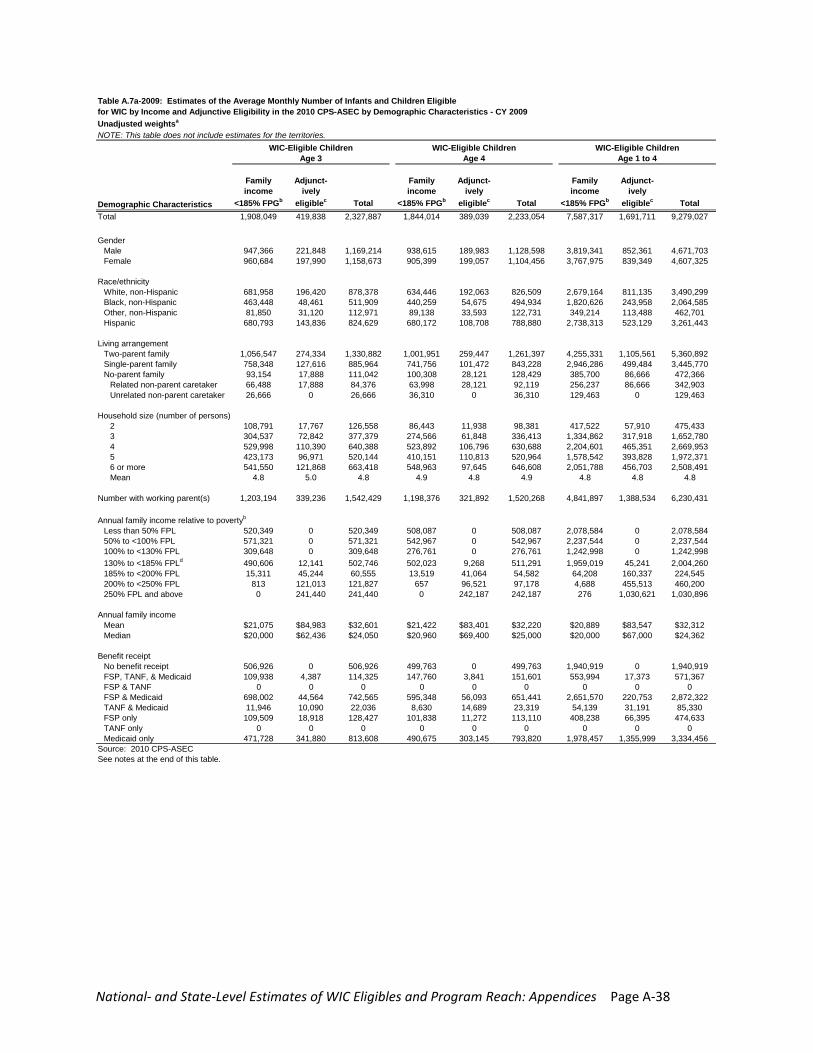
National‐ and State‐Level Estimates of WIC Eligibles and Program Reach: Appendices Page A‐38
Table A.7a-2009: Estimates of the Average Monthly Number of Infants and Children Eligible for WIC by Income and Adjunctive Eligibility in the 2010 CPS-ASEC by Demographic Characteristics - CY 2009Unadjusted weightsa
NOTE: This table does not include estimates for the territories.
Demographic Characteristics
Family income
<185% FPGb
Adjunct-ively
eligiblec Total
Family income
<185% FPGb
Adjunct-ively
eligiblec Total
Family income
<185% FPGb
Adjunct-ively
eligiblec TotalTotal 1,908,049 419,838 2,327,887 1,844,014 389,039 2,233,054 7,587,317 1,691,711 9,279,027
GenderMale 947,366 221,848 1,169,214 938,615 189,983 1,128,598 3,819,341 852,361 4,671,703Female 960,684 197,990 1,158,673 905,399 199,057 1,104,456 3,767,975 839,349 4,607,325
Race/ethnicityWhite, non-Hispanic 681,958 196,420 878,378 634,446 192,063 826,509 2,679,164 811,135 3,490,299Black, non-Hispanic 463,448 48,461 511,909 440,259 54,675 494,934 1,820,626 243,958 2,064,585Other, non-Hispanic 81,850 31,120 112,971 89,138 33,593 122,731 349,214 113,488 462,701Hispanic 680,793 143,836 824,629 680,172 108,708 788,880 2,738,313 523,129 3,261,443
Living arrangementTwo-parent family 1,056,547 274,334 1,330,882 1,001,951 259,447 1,261,397 4,255,331 1,105,561 5,360,892Single-parent family 758,348 127,616 885,964 741,756 101,472 843,228 2,946,286 499,484 3,445,770No-parent family 93,154 17,888 111,042 100,308 28,121 128,429 385,700 86,666 472,366
Related non-parent caretaker 66,488 17,888 84,376 63,998 28,121 92,119 256,237 86,666 342,903Unrelated non-parent caretaker 26,666 0 26,666 36,310 0 36,310 129,463 0 129,463
Household size (number of persons)2 108,791 17,767 126,558 86,443 11,938 98,381 417,522 57,910 475,4333 304,537 72,842 377,379 274,566 61,848 336,413 1,334,862 317,918 1,652,7804 529,998 110,390 640,388 523,892 106,796 630,688 2,204,601 465,351 2,669,9535 423,173 96,971 520,144 410,151 110,813 520,964 1,578,542 393,828 1,972,3716 or more 541,550 121,868 663,418 548,963 97,645 646,608 2,051,788 456,703 2,508,491Mean 4.8 5.0 4.8 4.9 4.8 4.9 4.8 4.8 4.8
Number with working parent(s) 1,203,194 339,236 1,542,429 1,198,376 321,892 1,520,268 4,841,897 1,388,534 6,230,431
Annual family income relative to povertyb
Less than 50% FPL 520,349 0 520,349 508,087 0 508,087 2,078,584 0 2,078,58450% to <100% FPL 571,321 0 571,321 542,967 0 542,967 2,237,544 0 2,237,544100% to <130% FPL 309,648 0 309,648 276,761 0 276,761 1,242,998 0 1,242,998130% to <185% FPLd 490,606 12,141 502,746 502,023 9,268 511,291 1,959,019 45,241 2,004,260185% to <200% FPL 15,311 45,244 60,555 13,519 41,064 54,582 64,208 160,337 224,545200% to <250% FPL 813 121,013 121,827 657 96,521 97,178 4,688 455,513 460,200250% FPL and above 0 241,440 241,440 0 242,187 242,187 276 1,030,621 1,030,896
Annual family incomeMean $21,075 $84,983 $32,601 $21,422 $83,401 $32,220 $20,889 $83,547 $32,312Median $20,000 $62,436 $24,050 $20,960 $69,400 $25,000 $20,000 $67,000 $24,362
Benefit receiptNo benefit receipt 506,926 0 506,926 499,763 0 499,763 1,940,919 0 1,940,919FSP, TANF, & Medicaid 109,938 4,387 114,325 147,760 3,841 151,601 553,994 17,373 571,367FSP & TANF 0 0 0 0 0 0 0 0 0FSP & Medicaid 698,002 44,564 742,565 595,348 56,093 651,441 2,651,570 220,753 2,872,322TANF & Medicaid 11,946 10,090 22,036 8,630 14,689 23,319 54,139 31,191 85,330FSP only 109,509 18,918 128,427 101,838 11,272 113,110 408,238 66,395 474,633TANF only 0 0 0 0 0 0 0 0 0Medicaid only 471,728 341,880 813,608 490,675 303,145 793,820 1,978,457 1,355,999 3,334,456
Source: 2010 CPS-ASECSee notes at the end of this table.
WIC-Eligible Children Age 3
WIC-Eligible Children Age 4
WIC-Eligible Children Age 1 to 4
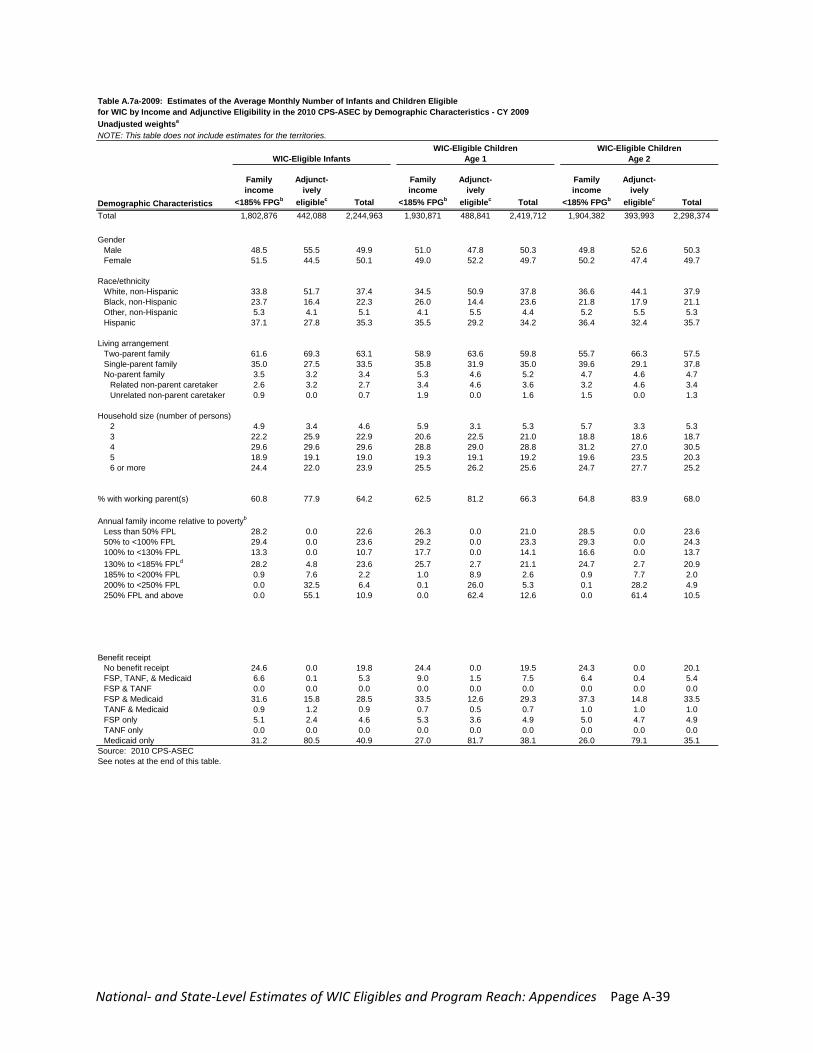
National‐ and State‐Level Estimates of WIC Eligibles and Program Reach: Appendices Page A‐39
Table A.7a-2009: Estimates of the Average Monthly Number of Infants and Children Eligible for WIC by Income and Adjunctive Eligibility in the 2010 CPS-ASEC by Demographic Characteristics - CY 2009Unadjusted weightsa
NOTE: This table does not include estimates for the territories.
Demographic Characteristics
Family income
<185% FPGb
Adjunct-ively
eligiblec Total
Family income
<185% FPGb
Adjunct-ively
eligiblec Total
Family income
<185% FPGb
Adjunct-ively
eligiblec TotalTotal 1,802,876 442,088 2,244,963 1,930,871 488,841 2,419,712 1,904,382 393,993 2,298,374
GenderMale 48.5 55.5 49.9 51.0 47.8 50.3 49.8 52.6 50.3Female 51.5 44.5 50.1 49.0 52.2 49.7 50.2 47.4 49.7
Race/ethnicityWhite, non-Hispanic 33.8 51.7 37.4 34.5 50.9 37.8 36.6 44.1 37.9Black, non-Hispanic 23.7 16.4 22.3 26.0 14.4 23.6 21.8 17.9 21.1Other, non-Hispanic 5.3 4.1 5.1 4.1 5.5 4.4 5.2 5.5 5.3Hispanic 37.1 27.8 35.3 35.5 29.2 34.2 36.4 32.4 35.7
Living arrangementTwo-parent family 61.6 69.3 63.1 58.9 63.6 59.8 55.7 66.3 57.5Single-parent family 35.0 27.5 33.5 35.8 31.9 35.0 39.6 29.1 37.8No-parent family 3.5 3.2 3.4 5.3 4.6 5.2 4.7 4.6 4.7
Related non-parent caretaker 2.6 3.2 2.7 3.4 4.6 3.6 3.2 4.6 3.4Unrelated non-parent caretaker 0.9 0.0 0.7 1.9 0.0 1.6 1.5 0.0 1.3
Household size (number of persons)2 4.9 3.4 4.6 5.9 3.1 5.3 5.7 3.3 5.33 22.2 25.9 22.9 20.6 22.5 21.0 18.8 18.6 18.74 29.6 29.6 29.6 28.8 29.0 28.8 31.2 27.0 30.55 18.9 19.1 19.0 19.3 19.1 19.2 19.6 23.5 20.36 or more 24.4 22.0 23.9 25.5 26.2 25.6 24.7 27.7 25.2
% with working parent(s) 60.8 77.9 64.2 62.5 81.2 66.3 64.8 83.9 68.0
Annual family income relative to povertyb
Less than 50% FPL 28.2 0.0 22.6 26.3 0.0 21.0 28.5 0.0 23.650% to <100% FPL 29.4 0.0 23.6 29.2 0.0 23.3 29.3 0.0 24.3100% to <130% FPL 13.3 0.0 10.7 17.7 0.0 14.1 16.6 0.0 13.7130% to <185% FPLd 28.2 4.8 23.6 25.7 2.7 21.1 24.7 2.7 20.9185% to <200% FPL 0.9 7.6 2.2 1.0 8.9 2.6 0.9 7.7 2.0200% to <250% FPL 0.0 32.5 6.4 0.1 26.0 5.3 0.1 28.2 4.9250% FPL and above 0.0 55.1 10.9 0.0 62.4 12.6 0.0 61.4 10.5
Benefit receiptNo benefit receipt 24.6 0.0 19.8 24.4 0.0 19.5 24.3 0.0 20.1FSP, TANF, & Medicaid 6.6 0.1 5.3 9.0 1.5 7.5 6.4 0.4 5.4FSP & TANF 0.0 0.0 0.0 0.0 0.0 0.0 0.0 0.0 0.0FSP & Medicaid 31.6 15.8 28.5 33.5 12.6 29.3 37.3 14.8 33.5TANF & Medicaid 0.9 1.2 0.9 0.7 0.5 0.7 1.0 1.0 1.0FSP only 5.1 2.4 4.6 5.3 3.6 4.9 5.0 4.7 4.9TANF only 0.0 0.0 0.0 0.0 0.0 0.0 0.0 0.0 0.0Medicaid only 31.2 80.5 40.9 27.0 81.7 38.1 26.0 79.1 35.1
Source: 2010 CPS-ASECSee notes at the end of this table.
WIC-Eligible InfantsWIC-Eligible Children
Age 1WIC-Eligible Children
Age 2

National‐ and State‐Level Estimates of WIC Eligibles and Program Reach: Appendices Page A‐40
Table A.7a-2009: Estimates of the Average Monthly Number of Infants and Children Eligible for WIC by Income and Adjunctive Eligibility in the 2010 CPS-ASEC by Demographic Characteristics - CY 2009Unadjusted weightsa
NOTE: This table does not include estimates for the territories.
Demographic Characteristics
Family income
<185% FPGb
Adjunct-ively
eligiblec Total
Family income
<185% FPGb
Adjunct-ively
eligiblec Total
Family income
<185% FPGb
Adjunct-ively
eligiblec TotalTotal 1,908,049 419,838 2,327,887 1,844,014 389,039 2,233,054 7,587,317 1,691,711 9,279,027
GenderMale 49.7 52.8 50.2 50.9 48.8 50.5 50.3 50.4 50.3Female 50.3 47.2 49.8 49.1 51.2 49.5 49.7 49.6 49.7
Race/ethnicityWhite, non-Hispanic 35.7 46.8 37.7 34.4 49.4 37.0 35.3 47.9 37.6Black, non-Hispanic 24.3 11.5 22.0 23.9 14.1 22.2 24.0 14.4 22.3Other, non-Hispanic 4.3 7.4 4.9 4.8 8.6 5.5 4.6 6.7 5.0Hispanic 35.7 34.3 35.4 36.9 27.9 35.3 36.1 30.9 35.1
Living arrangementTwo-parent family 55.4 65.3 57.2 54.3 66.7 56.5 56.1 65.4 57.8Single-parent family 39.7 30.4 38.1 40.2 26.1 37.8 38.8 29.5 37.1No-parent family 4.9 4.3 4.8 5.4 7.2 5.8 5.1 5.1 5.1
Related non-parent caretaker 3.5 4.3 3.6 3.5 7.2 4.1 3.4 5.1 3.7Unrelated non-parent caretaker 1.4 0.0 1.1 2.0 0.0 1.6 1.7 0.0 1.4
Household size (number of persons)2 5.7 4.2 5.4 4.7 3.1 4.4 5.5 3.4 5.13 16.0 17.4 16.2 14.9 15.9 15.1 17.6 18.8 17.84 27.8 26.3 27.5 28.4 27.5 28.2 29.1 27.5 28.85 22.2 23.1 22.3 22.2 28.5 23.3 20.8 23.3 21.36 or more 28.4 29.0 28.5 29.8 25.1 29.0 27.0 27.0 27.0
% with working parent(s) 63.1 80.8 66.3 65.0 82.7 68.1 63.8 82.1 67.1
Annual family income relative to povertyb
Less than 50% FPL 27.3 0.0 22.4 27.6 0.0 22.8 27.4 0.0 22.450% to <100% FPL 29.9 0.0 24.5 29.4 0.0 24.3 29.5 0.0 24.1100% to <130% FPL 16.2 0.0 13.3 15.0 0.0 12.4 16.4 0.0 13.4130% to <185% FPLd 25.7 2.9 21.6 27.2 2.4 22.9 25.8 2.7 21.6185% to <200% FPL 0.8 10.8 2.6 0.7 10.6 2.4 0.8 9.5 2.4200% to <250% FPL 0.0 28.8 5.2 0.0 24.8 4.4 0.1 26.9 5.0250% FPL and above 0.0 57.5 10.4 0.0 62.3 10.8 0.0 60.9 11.1
Benefit receiptNo benefit receipt 26.6 0.0 21.8 27.1 0.0 22.4 25.6 0.0 20.9FSP, TANF, & Medicaid 5.8 1.0 4.9 8.0 1.0 6.8 7.3 1.0 6.2FSP & TANF 0.0 0.0 0.0 0.0 0.0 0.0 0.0 0.0 0.0FSP & Medicaid 36.6 10.6 31.9 32.3 14.4 29.2 34.9 13.0 31.0TANF & Medicaid 0.6 2.4 0.9 0.5 3.8 1.0 0.7 1.8 0.9FSP only 5.7 4.5 5.5 5.5 2.9 5.1 5.4 3.9 5.1TANF only 0.0 0.0 0.0 0.0 0.0 0.0 0.0 0.0 0.0Medicaid only 24.7 81.4 35.0 26.6 77.9 35.5 26.1 80.2 35.9
Source: 2010 CPS-ASECSee notes at the end of this table.
WIC-Eligible Children Age 3
WIC-Eligible Children Age 4
WIC-Eligible Children Age 1 to 4

National‐ and State‐Level Estimates of WIC Eligibles and Program Reach: Appendices Page A‐41
Notes for Table A.7a-2009:FPG - Federal Poverty GuidelinesFPL - Federal Poverty Levela These estimates are tabulated from the unadjusted person weights on the 2010 CPS-ASEC.They are not adjusted to account for the under or over count of infants and children in the CPS relative to Census estimates, monthly income, or nutritional risk.b This table uses both the Federal Poverty Guidelines (FPG) and the Federal Poverty Thresholds or "Levels" (FPL). The thresholds are used to calculate the ratio of annual family income to the povertythreshold for their family size. The guidelines are used in determining WIC eligibility. The Federal Poverty Thresholds are updated by the Census Bureau each year and are used mainlyto produce official poverty population estimates. The Federal Poverty Guidelines are issued by theDepartment of Health and Human Services (HHS) and are a simplification of the poverty thresholdsfor use in determining financial eligibility for certain federal programs, including WIC.c Infants and children adjunctively eligible are those whose family income was not below 185% FPG but who reported receipt of Food Stamps, Medicaid, or TANF. Therefore, the two categories are mutuallyexclusive.d There are infants and children adjunctively eligible for WIC with annual family incomes above 185 percent of the Federal Poverty Guidelines (FPG) who have annual family incomes below 185% of the Federal Poverty Level (FPL). For example, in Jan 2009 a family of five with three children and an annual family income of $45,125 has an income to FPL ratio of 1.762, but an income to FPG ratio of 1.820 (FPL for a family of 5 = $25,603; FPG for a family of 5 = $24,800).

National‐ and State‐Level Estimates of WIC Eligibles and Program Reach: Appendices Page A‐42
Table A.7b-2009: Estimates of the Average Monthly Number of Infants and Children Eligible for WIC by Income and Adjunctive Eligibility in the 2010 CPS-ASEC by Demographic Characteristics - CY 2009Fully adjusted weightsa
NOTE: This table does not include estimates for the territories.
Demographic Characteristics
Family income
<185% FPGb
Adjunct-ively
eligiblec Total
Family income
<185% FPGb
Adjunct-ively
eligiblec Total
Family income
<185% FPGb
Adjunct-ively
eligiblec TotalTotal 2,109,883 513,488 2,623,370 1,901,896 485,324 2,387,221 1,953,671 402,893 2,356,565
GenderMale 1,019,688 284,120 1,303,808 969,345 231,965 1,201,310 978,578 213,049 1,191,627Female 1,090,194 229,368 1,319,562 932,552 253,359 1,185,911 975,094 189,844 1,164,938
Race/ethnicityWhite, non-Hispanic 695,492 260,631 956,123 665,001 248,452 913,453 698,907 174,394 873,301Black, non-Hispanic 524,025 88,821 612,846 471,216 65,995 537,211 445,876 75,908 521,784Other, non-Hispanic 122,756 23,262 146,018 83,421 28,375 111,796 109,028 23,966 132,993Hispanic 767,610 140,774 908,384 682,259 142,502 824,761 699,861 128,626 828,487
Living arrangementTwo-parent family 1,292,351 353,673 1,646,025 1,128,959 309,826 1,438,784 1,083,430 266,826 1,350,256Single-parent family 744,508 143,424 887,932 673,124 153,076 826,200 778,001 117,257 895,258No-parent family 73,023 16,391 89,414 99,813 22,423 122,236 92,241 18,810 111,051
Related non-parent caretaker 54,384 16,391 70,775 63,073 22,423 85,496 62,539 18,810 81,349Unrelated non-parent caretaker 18,639 0 18,639 36,740 0 36,740 29,701 0 29,701
Household size (number of persons)2 104,882 18,317 123,198 110,520 15,068 125,589 112,130 13,204 125,3343 470,815 132,910 603,725 391,873 109,304 501,178 368,513 75,140 443,6534 623,497 150,532 774,029 546,864 140,929 687,793 611,804 108,419 720,2225 397,488 98,597 496,084 367,494 92,382 459,876 380,898 94,954 475,8526 or more 513,201 113,133 626,334 485,145 127,641 612,786 480,326 111,177 591,503Mean 4.7 4.5 4.6 4.7 4.8 4.7 4.7 4.8 4.7
Number with working parent(s) 1,281,557 399,987 1,681,544 1,193,659 394,837 1,588,496 1,262,535 337,431 1,599,967
Annual family income relative to povertyb
Less than 50% FPL 595,335 0 595,335 498,750 0 498,750 560,643 0 560,64350% to <100% FPL 620,766 0 620,766 554,876 0 554,876 574,013 0 574,013100% to <130% FPL 279,759 0 279,759 335,427 0 335,427 320,986 0 320,986130% to <185% FPLd 593,773 24,593 618,366 492,970 12,872 505,842 478,918 10,772 489,691185% to <200% FPL 19,004 38,986 57,990 18,357 43,440 61,797 17,082 31,080 48,162200% to <250% FPL 759 167,128 167,886 1,518 125,667 127,184 1,728 113,185 114,913250% FPL and above 487 282,782 283,269 0 303,345 303,345 301 247,856 248,157
Annual family incomeMean $20,095 $78,093 $31,447 $20,837 $82,006 $33,273 $20,220 $84,227 $31,163Median $20,000 $60,000 $24,488 $20,000 $68,262 $25,000 $19,200 $68,350 $23,970
Benefit receiptNo benefit receipt 518,352 0 518,352 467,337 0 467,337 473,679 0 473,679FSP, TANF, & Medicaid 139,356 431 139,787 169,103 7,380 176,483 125,857 1,636 127,494FSP & TANF 0 0 0 0 0 0 0 0 0FSP & Medicaid 668,889 81,862 750,751 634,162 61,096 695,258 729,876 59,846 789,722TANF & Medicaid 18,390 5,959 24,349 13,458 2,405 15,862 20,537 4,047 24,583FSP only 108,446 12,892 121,338 100,441 17,389 117,830 97,712 19,414 117,126TANF only 0 0 0 0 0 0 0 0 0Medicaid only 656,450 412,344 1,068,794 517,395 397,055 914,450 506,010 317,950 823,960
Source: 2010 CPS-ASECSee notes at the end of this table.
WIC-Eligible InfantsWIC-Eligible Children
Age 1WIC-Eligible Children
Age 2
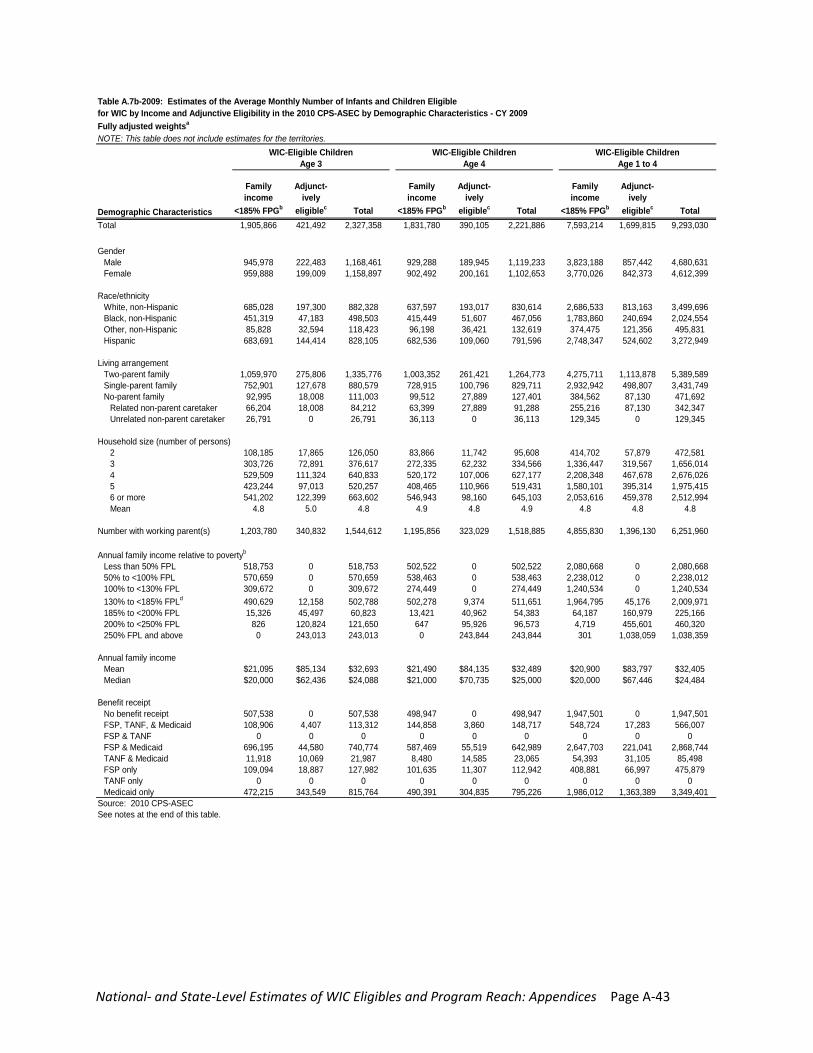
National‐ and State‐Level Estimates of WIC Eligibles and Program Reach: Appendices Page A‐43
Table A.7b-2009: Estimates of the Average Monthly Number of Infants and Children Eligible for WIC by Income and Adjunctive Eligibility in the 2010 CPS-ASEC by Demographic Characteristics - CY 2009Fully adjusted weightsa
NOTE: This table does not include estimates for the territories.
Demographic Characteristics
Family income
<185% FPGb
Adjunct-ively
eligiblec Total
Family income
<185% FPGb
Adjunct-ively
eligiblec Total
Family income
<185% FPGb
Adjunct-ively
eligiblec TotalTotal 1,905,866 421,492 2,327,358 1,831,780 390,105 2,221,886 7,593,214 1,699,815 9,293,030
GenderMale 945,978 222,483 1,168,461 929,288 189,945 1,119,233 3,823,188 857,442 4,680,631Female 959,888 199,009 1,158,897 902,492 200,161 1,102,653 3,770,026 842,373 4,612,399
Race/ethnicityWhite, non-Hispanic 685,028 197,300 882,328 637,597 193,017 830,614 2,686,533 813,163 3,499,696Black, non-Hispanic 451,319 47,183 498,503 415,449 51,607 467,056 1,783,860 240,694 2,024,554Other, non-Hispanic 85,828 32,594 118,423 96,198 36,421 132,619 374,475 121,356 495,831Hispanic 683,691 144,414 828,105 682,536 109,060 791,596 2,748,347 524,602 3,272,949
Living arrangementTwo-parent family 1,059,970 275,806 1,335,776 1,003,352 261,421 1,264,773 4,275,711 1,113,878 5,389,589Single-parent family 752,901 127,678 880,579 728,915 100,796 829,711 2,932,942 498,807 3,431,749No-parent family 92,995 18,008 111,003 99,512 27,889 127,401 384,562 87,130 471,692
Related non-parent caretaker 66,204 18,008 84,212 63,399 27,889 91,288 255,216 87,130 342,347Unrelated non-parent caretaker 26,791 0 26,791 36,113 0 36,113 129,345 0 129,345
Household size (number of persons)2 108,185 17,865 126,050 83,866 11,742 95,608 414,702 57,879 472,5813 303,726 72,891 376,617 272,335 62,232 334,566 1,336,447 319,567 1,656,0144 529,509 111,324 640,833 520,172 107,006 627,177 2,208,348 467,678 2,676,0265 423,244 97,013 520,257 408,465 110,966 519,431 1,580,101 395,314 1,975,4156 or more 541,202 122,399 663,602 546,943 98,160 645,103 2,053,616 459,378 2,512,994Mean 4.8 5.0 4.8 4.9 4.8 4.9 4.8 4.8 4.8
Number with working parent(s) 1,203,780 340,832 1,544,612 1,195,856 323,029 1,518,885 4,855,830 1,396,130 6,251,960
Annual family income relative to povertyb
Less than 50% FPL 518,753 0 518,753 502,522 0 502,522 2,080,668 0 2,080,66850% to <100% FPL 570,659 0 570,659 538,463 0 538,463 2,238,012 0 2,238,012100% to <130% FPL 309,672 0 309,672 274,449 0 274,449 1,240,534 0 1,240,534130% to <185% FPLd 490,629 12,158 502,788 502,278 9,374 511,651 1,964,795 45,176 2,009,971185% to <200% FPL 15,326 45,497 60,823 13,421 40,962 54,383 64,187 160,979 225,166200% to <250% FPL 826 120,824 121,650 647 95,926 96,573 4,719 455,601 460,320250% FPL and above 0 243,013 243,013 0 243,844 243,844 301 1,038,059 1,038,359
Annual family incomeMean $21,095 $85,134 $32,693 $21,490 $84,135 $32,489 $20,900 $83,797 $32,405Median $20,000 $62,436 $24,088 $21,000 $70,735 $25,000 $20,000 $67,446 $24,484
Benefit receiptNo benefit receipt 507,538 0 507,538 498,947 0 498,947 1,947,501 0 1,947,501FSP, TANF, & Medicaid 108,906 4,407 113,312 144,858 3,860 148,717 548,724 17,283 566,007FSP & TANF 0 0 0 0 0 0 0 0 0FSP & Medicaid 696,195 44,580 740,774 587,469 55,519 642,989 2,647,703 221,041 2,868,744TANF & Medicaid 11,918 10,069 21,987 8,480 14,585 23,065 54,393 31,105 85,498FSP only 109,094 18,887 127,982 101,635 11,307 112,942 408,881 66,997 475,879TANF only 0 0 0 0 0 0 0 0 0Medicaid only 472,215 343,549 815,764 490,391 304,835 795,226 1,986,012 1,363,389 3,349,401
Source: 2010 CPS-ASECSee notes at the end of this table.
WIC-Eligible Children Age 3
WIC-Eligible Children Age 4
WIC-Eligible Children Age 1 to 4
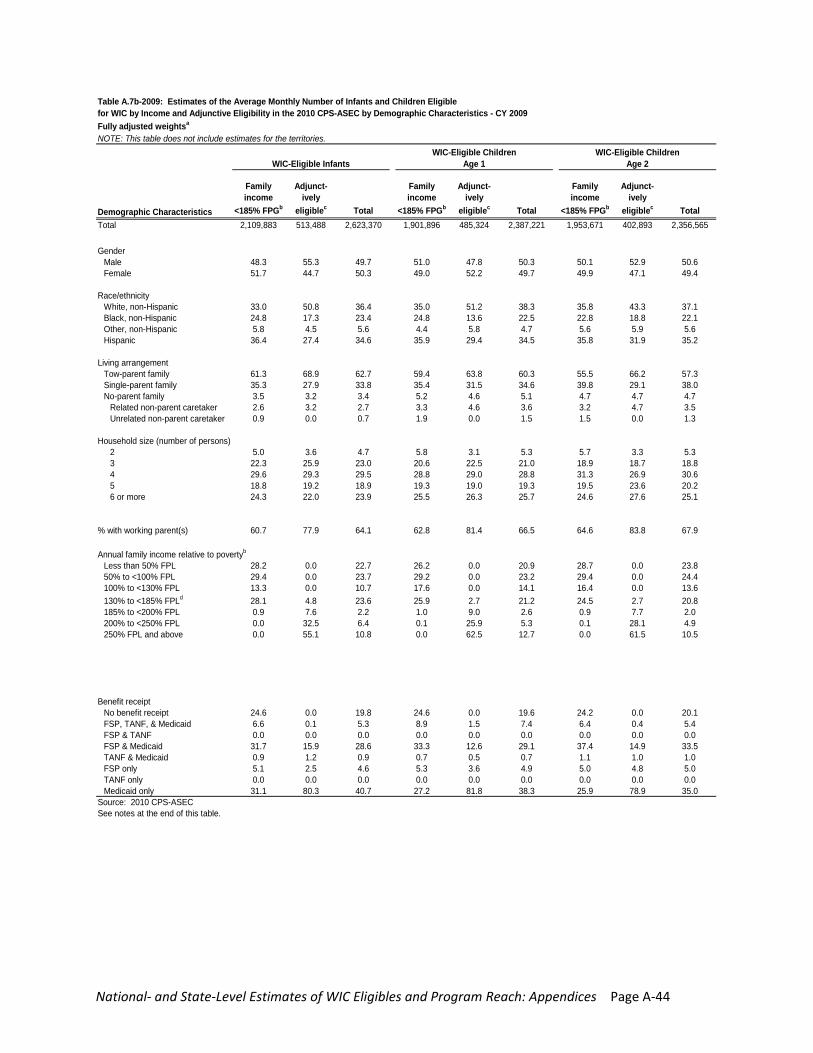
National‐ and State‐Level Estimates of WIC Eligibles and Program Reach: Appendices Page A‐44
Table A.7b-2009: Estimates of the Average Monthly Number of Infants and Children Eligible for WIC by Income and Adjunctive Eligibility in the 2010 CPS-ASEC by Demographic Characteristics - CY 2009Fully adjusted weightsa
NOTE: This table does not include estimates for the territories.
Demographic Characteristics
Family income
<185% FPGb
Adjunct-ively
eligiblec Total
Family income
<185% FPGb
Adjunct-ively
eligiblec Total
Family income
<185% FPGb
Adjunct-ively
eligiblec TotalTotal 2,109,883 513,488 2,623,370 1,901,896 485,324 2,387,221 1,953,671 402,893 2,356,565
GenderMale 48.3 55.3 49.7 51.0 47.8 50.3 50.1 52.9 50.6Female 51.7 44.7 50.3 49.0 52.2 49.7 49.9 47.1 49.4
Race/ethnicityWhite, non-Hispanic 33.0 50.8 36.4 35.0 51.2 38.3 35.8 43.3 37.1Black, non-Hispanic 24.8 17.3 23.4 24.8 13.6 22.5 22.8 18.8 22.1Other, non-Hispanic 5.8 4.5 5.6 4.4 5.8 4.7 5.6 5.9 5.6Hispanic 36.4 27.4 34.6 35.9 29.4 34.5 35.8 31.9 35.2
Living arrangementTow-parent family 61.3 68.9 62.7 59.4 63.8 60.3 55.5 66.2 57.3Single-parent family 35.3 27.9 33.8 35.4 31.5 34.6 39.8 29.1 38.0No-parent family 3.5 3.2 3.4 5.2 4.6 5.1 4.7 4.7 4.7
Related non-parent caretaker 2.6 3.2 2.7 3.3 4.6 3.6 3.2 4.7 3.5Unrelated non-parent caretaker 0.9 0.0 0.7 1.9 0.0 1.5 1.5 0.0 1.3
Household size (number of persons)2 5.0 3.6 4.7 5.8 3.1 5.3 5.7 3.3 5.33 22.3 25.9 23.0 20.6 22.5 21.0 18.9 18.7 18.84 29.6 29.3 29.5 28.8 29.0 28.8 31.3 26.9 30.65 18.8 19.2 18.9 19.3 19.0 19.3 19.5 23.6 20.26 or more 24.3 22.0 23.9 25.5 26.3 25.7 24.6 27.6 25.1
% with working parent(s) 60.7 77.9 64.1 62.8 81.4 66.5 64.6 83.8 67.9
Annual family income relative to povertyb
Less than 50% FPL 28.2 0.0 22.7 26.2 0.0 20.9 28.7 0.0 23.850% to <100% FPL 29.4 0.0 23.7 29.2 0.0 23.2 29.4 0.0 24.4100% to <130% FPL 13.3 0.0 10.7 17.6 0.0 14.1 16.4 0.0 13.6130% to <185% FPLd 28.1 4.8 23.6 25.9 2.7 21.2 24.5 2.7 20.8185% to <200% FPL 0.9 7.6 2.2 1.0 9.0 2.6 0.9 7.7 2.0200% to <250% FPL 0.0 32.5 6.4 0.1 25.9 5.3 0.1 28.1 4.9250% FPL and above 0.0 55.1 10.8 0.0 62.5 12.7 0.0 61.5 10.5
Benefit receiptNo benefit receipt 24.6 0.0 19.8 24.6 0.0 19.6 24.2 0.0 20.1FSP, TANF, & Medicaid 6.6 0.1 5.3 8.9 1.5 7.4 6.4 0.4 5.4FSP & TANF 0.0 0.0 0.0 0.0 0.0 0.0 0.0 0.0 0.0FSP & Medicaid 31.7 15.9 28.6 33.3 12.6 29.1 37.4 14.9 33.5TANF & Medicaid 0.9 1.2 0.9 0.7 0.5 0.7 1.1 1.0 1.0FSP only 5.1 2.5 4.6 5.3 3.6 4.9 5.0 4.8 5.0TANF only 0.0 0.0 0.0 0.0 0.0 0.0 0.0 0.0 0.0Medicaid only 31.1 80.3 40.7 27.2 81.8 38.3 25.9 78.9 35.0
Source: 2010 CPS-ASECSee notes at the end of this table.
WIC-Eligible InfantsWIC-Eligible Children
Age 1WIC-Eligible Children
Age 2

National‐ and State‐Level Estimates of WIC Eligibles and Program Reach: Appendices Page A‐45
Table A.7b-2009: Estimates of the Average Monthly Number of Infants and Children Eligible for WIC by Income and Adjunctive Eligibility in the 2010 CPS-ASEC by Demographic Characteristics - CY 2009Fully adjusted weightsa
NOTE: This table does not include estimates for the territories.
Demographic Characteristics
Family income
<185% FPGb
Adjunct-ively
eligiblec Total
Family income
<185% FPGb
Adjunct-ively
eligiblec Total
Family income
<185% FPGb
Adjunct-ively
eligiblec TotalTotal 1,905,866 421,492 2,327,358 1,831,780 390,105 2,221,886 7,593,214 1,699,815 9,293,030
GenderMale 49.6 52.8 50.2 50.7 48.7 50.4 50.4 50.4 50.4Female 50.4 47.2 49.8 49.3 51.3 49.6 49.6 49.6 49.6
Race/ethnicityWhite, non-Hispanic 35.9 46.8 37.9 34.8 49.5 37.4 35.4 47.8 37.7Black, non-Hispanic 23.7 11.2 21.4 22.7 13.2 21.0 23.5 14.2 21.8Other, non-Hispanic 4.5 7.7 5.1 5.3 9.3 6.0 4.9 7.1 5.3Hispanic 35.9 34.3 35.6 37.3 28.0 35.6 36.2 30.9 35.2
Living arrangementTwo-parent family 55.6 65.4 57.4 54.8 67.0 56.9 56.3 65.5 58.0Single-parent family 39.5 30.3 37.8 39.8 25.8 37.3 38.6 29.3 36.9No-parent family 4.9 4.3 4.8 5.4 7.1 5.7 5.1 5.1 5.1
Related non-parent caretaker 3.5 4.3 3.6 3.5 7.1 4.1 3.4 5.1 3.7Unrelated non-parent caretaker 1.4 0.0 1.2 2.0 0.0 1.6 1.7 0.0 1.4
Household size (number of persons)2 5.7 4.2 5.4 4.6 3.0 4.3 5.5 3.4 5.13 15.9 17.3 16.2 14.9 16.0 15.1 17.6 18.8 17.84 27.8 26.4 27.5 28.4 27.4 28.2 29.1 27.5 28.85 22.2 23.0 22.4 22.3 28.4 23.4 20.8 23.3 21.36 or more 28.4 29.0 28.5 29.9 25.2 29.0 27.0 27.0 27.0
% with working parent(s) 63.2 80.9 66.4 65.3 82.8 68.4 63.9 82.1 67.3
Annual family income relative to povertyb
Less than 50% FPL 27.2 0.0 22.3 27.4 0.0 22.6 27.4 0.0 22.450% to <100% FPL 29.9 0.0 24.5 29.4 0.0 24.2 29.5 0.0 24.1100% to <130% FPL 16.2 0.0 13.3 15.0 0.0 12.4 16.3 0.0 13.3130% to <185% FPLd 25.7 2.9 21.6 27.4 2.4 23.0 25.9 2.7 21.6185% to <200% FPL 0.8 10.8 2.6 0.7 10.5 2.4 0.8 9.5 2.4200% to <250% FPL 0.0 28.7 5.2 0.0 24.6 4.3 0.1 26.8 5.0250% FPL and above 0.0 57.7 10.4 0.0 62.5 11.0 0.0 61.1 11.2
Benefit receiptNo benefit receipt 26.6 0.0 21.8 27.2 0.0 22.5 25.6 0.0 21.0FSP, TANF, & Medicaid 5.7 1.0 4.9 7.9 1.0 6.7 7.2 1.0 6.1FSP & TANF 0.0 0.0 0.0 0.0 0.0 0.0 0.0 0.0 0.0FSP & Medicaid 36.5 10.6 31.8 32.1 14.2 28.9 34.9 13.0 30.9TANF & Medicaid 0.6 2.4 0.9 0.5 3.7 1.0 0.7 1.8 0.9FSP only 5.7 4.5 5.5 5.5 2.9 5.1 5.4 3.9 5.1TANF only 0.0 0.0 0.0 0.0 0.0 0.0 0.0 0.0 0.0Medicaid only 24.8 81.5 35.1 26.8 78.1 35.8 26.2 80.2 36.0
Source: 2010 CPS-ASECSee notes at the end of this table.
WIC-Eligible Children Age 3
WIC-Eligible Children Age 4
WIC-Eligible Children Ages 1-4
National‐ and State‐Level Estimates of WIC Eligibles and Program Reach: Appendices Page A‐46
Notes for Table A.7b-2009:FPG - Federal Poverty GuidelinesFPL - Federal Poverty Levela These estimates are tabulated from the fully adjusted person weights on the 2010 CPS-ASEC.They are adjusted to account for the under or over count of infants and children in the CPS relative to Census estimates, monthly income, and nutritional risk.See Tables 3, 4a, and 4b for the adjustment factors.bThis table uses both the Federal Poverty Guidelines (FPG) and the Federal Poverty Thresholds or "Levels" (FPL). The thresholds are used to calculate the ratio of annual family income to the povertythreshold for their family size. The guidelines are used in determining WIC eligibility. The Federal Poverty Thresholds are updated by the Census Bureau each year and are used mainlyto produce official poverty population estimates. The Federal Poverty Guidelines are issued by theDepartment of Health and Human Services (HHS) and are a simplification of the poverty thresholdsfor use in determining financial eligibility for certain federal programs, including WIC.cInfants and children adjunctively eligible are those whose family income was not below 185% FPG but who reported receipt of Food Stamps, Medicaid, or TANF. Therefore, the two categories are mutuallyexclusive.dThere are infants and children adjunctively eligible for WIC with annual family incomes above 185 percent of the Federal Poverty Guidelines (FPG) who have annual family incomes below 185% of the Federal Poverty Level (FPL). For example, in Jan 2009 a family of five with three children and an annual family income of $45,125 has an income to FPL ratio of 1.762, but an income to FPG ratio of 1.820 (FPL for a family of 5 = $25,603; FPG for a family of 5 = $24,800).

National‐ and State‐Level Estimates of WIC Eligibles and Program Reach: Appendices Page A‐47
NOTE: This table includes estimates for the territories.
Participant Group Eligiblesa
Non-Eligiblesb Totalc Eligiblesa
Non-Eligiblesb Totalc Eligibles
Non-Eligibles Total
Infants 2,673,683 1,656,385 4,330,068 2,633,819 1,811,679 4,445,498 1.51% -8.57% -2.60%
Total Children Age 1 to 4 9,469,217 8,039,591 17,508,808 8,657,117 8,399,639 17,056,756 9.38% -4.29% 2.65%Children Age 1 2,430,554 1,938,702 4,369,256 2,292,023 2,054,735 4,346,758 6.04% -5.65% 0.52%Children Age 2 2,398,905 2,027,367 4,426,272 2,143,513 2,176,247 4,319,761 11.91% -6.84% 2.47%Children Age 3 2,373,651 2,027,147 4,400,798 2,117,479 2,113,062 4,230,541 12.10% -4.07% 4.02%Children Age 4 2,266,106 2,046,376 4,312,482 2,104,102 2,055,595 4,159,697 7.70% -0.45% 3.67%
Pregnant Women 1,375,638 1,355,127 1.51%
Postpartum Breastfeeding Women 666,796 639,003 4.35%Postpartum Non-Breastfeeding Women 889,257 886,312 0.33%
Total WIC Eligibles 15,074,591 14,171,378 6.37%Source: March 2009 CPS; 1996, 2001, and 2004 SIPP panels; 2001-2002, 2003-2004, 2005-2006 NHANESNotes:aThe eligible estimates represent the average monthly number of individuals eligible for WIC in 2009 taking into account the impact of 6- and 12-month certification periods. The adjustment factors used to account for monthly income and certification periods were derived from an analysis of the 1996, 2001, and 2004SIPP panels that compared annual estimates of eligibility with monthly estimates that accounted for certification periods. The analysis was conducted for calendaryears 1997, 1998, 2002, 2005, and 2006, and the factors are an average of the five years.bThe non-eligible infants and children represent the difference between the total estimates of infants and children age 1 to 4 in the total U.S. and the WIC-eligible infants and children.cThe total numbers of infants and children represent the sum of the March 2009 total number of infants and children adjusted for the under and over count of infants and children in the CPS relative to Census estimates, plus the numbers of infants and children in Puerto Rico and the other island territories basedon the 2009 PRCS and annual Census Bureau population estimates.
Table A.8-2009: Estimates of the Average Monthly Number of Individuals Eligiblefor WIC by Participant Group:
A Comparison of the Change from Calendar Year 2008 to 2009
2009 2008 Percent Change

National‐ and State‐Level Estimates of WIC Eligibles and Program Reach: Appendices Page A‐48
NOTE: This table does not include estimates for the territories.
InfantsChildren
Age 1 to 4 Total InfantsChildren
Age 1 to 4 Total InfantsChildren
Age 1 to 4 TotalTotal number of infants/children in the March CPS 4,205,909 17,228,381 21,434,290 4,300,938 16,885,971 21,186,909 -2.2% 2.0% 1.2%
Number (non-U.S. Territory) after adjustment for CPS under/overcount 4,277,778 17,291,510 21,569,288 4,392,888 16,834,762 21,227,650 -2.6% 2.7% 1.6%
Number with annual income <185% FPG 1,843,336 7,593,974 9,437,310 1,720,897 6,871,745 8,592,642 7.1% 10.5% 9.8%
Number with adjunctive eligibility 448,617 1,699,985 2,148,602 537,864 1,608,675 2,146,540 -16.6% 5.7% 0.1%Through Food Stamps 83,160 305,351 388,511 109,341 288,689 398,030 -23.9% 5.8% -2.4%Through TANF 5,206 31,108 36,314 4,499 12,489 16,989 15.7% 149.1% 113.8%Through Medicaid 360,251 1,363,526 1,723,777 424,024 1,307,497 1,731,521 -15.0% 4.3% -0.4%
Number before monthly income adjustment 2,291,953 9,293,959 11,585,912 2,258,761 8,480,420 10,739,182 1.5% 9.6% 7.9%Number after monthly income adjustment 2,704,505 9,386,899 12,091,403 2,755,689 8,989,246 11,744,935 -1.9% 4.4% 2.9%
Number after adjustment for income eligibles in U.S. Territories 2,704,505 9,386,899 12,091,403 2,755,689 8,989,246 11,744,935 -1.9% 4.4% 2.9%
Total Eligibles - Number after adjustment for nutritional risk (infants and children) 2,623,370 9,293,030 11,916,399 2,673,018 8,899,353 11,572,371 -1.9% 4.4% 3.0%
Source: 2010 CPS-ASEC and 2009 CPS-ASECSee footnotes on Table A.6-2009 for adjustment factor calculations for 2009.
2009 2008 Percent Change
Table A.9-2009: Stepwise Comparison of the Change in Average Monthly Number of Infants and Children Eligible for WIC, from Calendar Year 2008 to 2009 as estimated by the March CPS
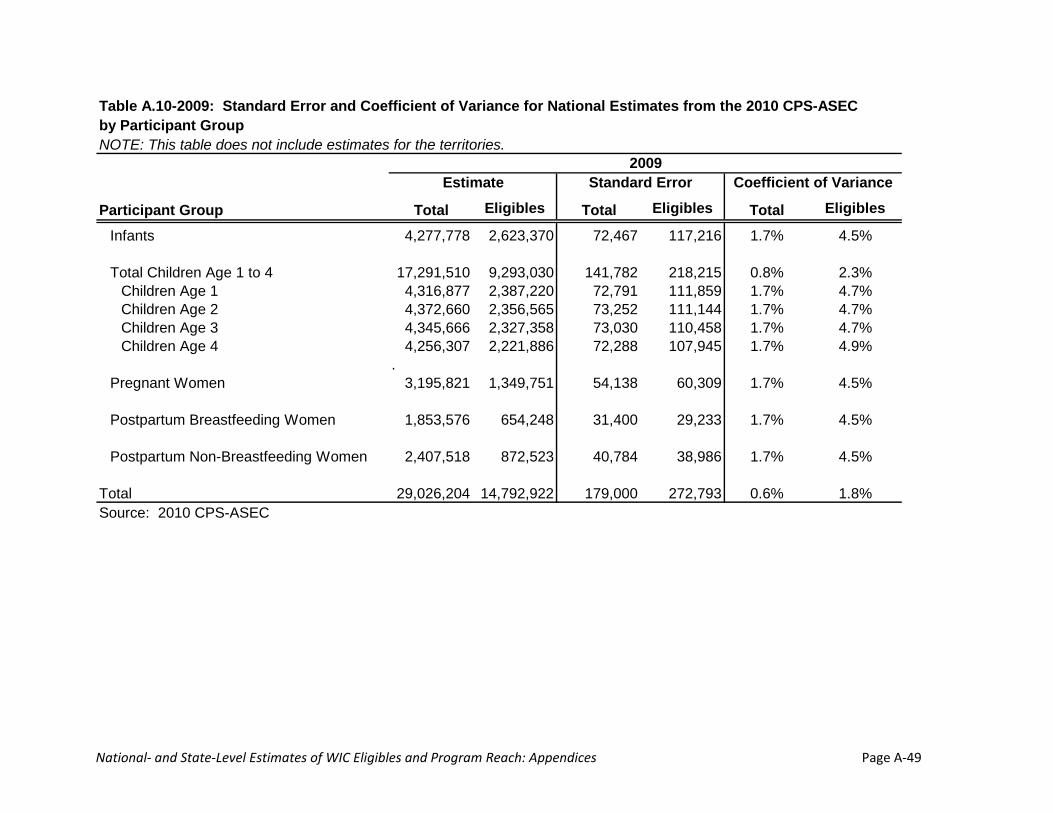
National‐ and State‐Level Estimates of WIC Eligibles and Program Reach: Appendices Page A‐49
Table A.10-2009: Standard Error and Coefficient of Variance for National Estimates from the 2010 CPS-ASECby Participant GroupNOTE: This table does not include estimates for the territories.
Participant Group Total Eligibles Total Eligibles Total Eligibles
Infants 4,277,778 2,623,370 72,467 117,216 1.7% 4.5%
Total Children Age 1 to 4 17,291,510 9,293,030 141,782 218,215 0.8% 2.3%Children Age 1 4,316,877 2,387,220 72,791 111,859 1.7% 4.7%Children Age 2 4,372,660 2,356,565 73,252 111,144 1.7% 4.7%Children Age 3 4,345,666 2,327,358 73,030 110,458 1.7% 4.7%Children Age 4 4,256,307 2,221,886 72,288 107,945 1.7% 4.9%
.Pregnant Women 3,195,821 1,349,751 54,138 60,309 1.7% 4.5%
Postpartum Breastfeeding Women 1,853,576 654,248 31,400 29,233 1.7% 4.5%
Postpartum Non-Breastfeeding Women 2,407,518 872,523 40,784 38,986 1.7% 4.5%
Total 29,026,204 14,792,922 179,000 272,793 0.6% 1.8%Source: 2010 CPS-ASEC
2009Estimate Standard Error Coefficient of Variance

This page was left intentionally blank.
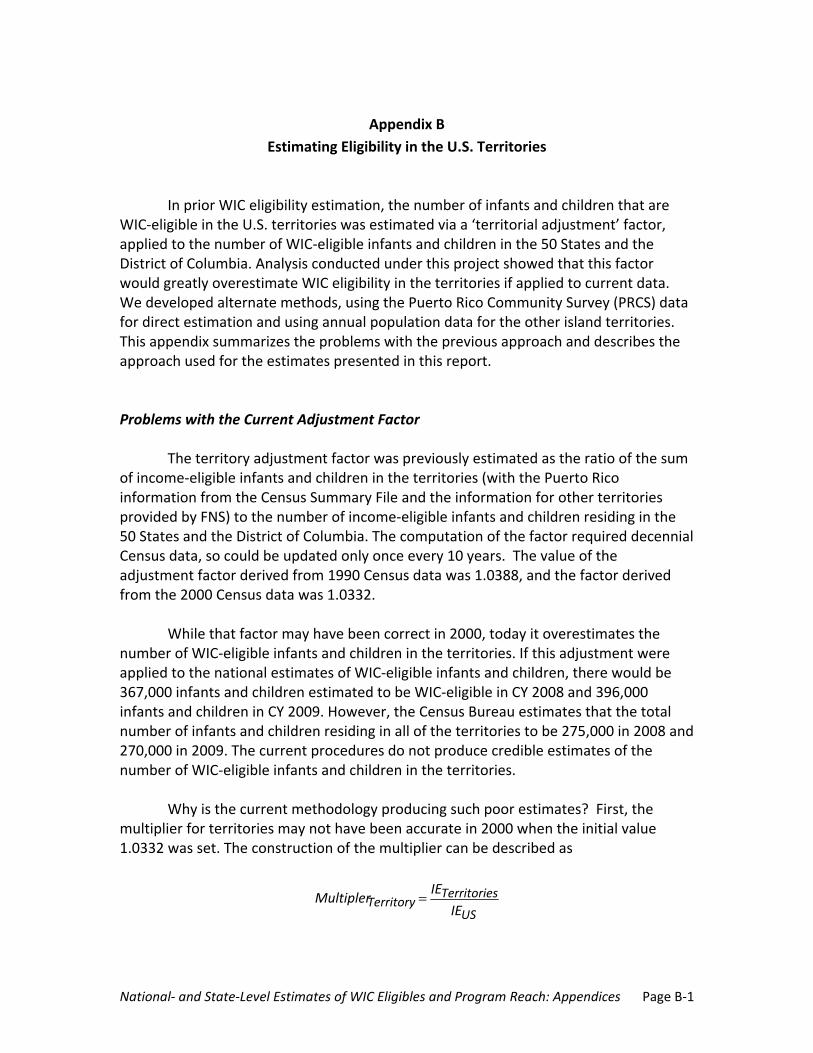
National‐ and State‐Level Estimates of WIC Eligibles and Program Reach: Appendices Page B‐1
Appendix B
Estimating Eligibility in the U.S. Territories
In prior WIC eligibility estimation, the number of infants and children that are WIC‐eligible in the U.S. territories was estimated via a ‘territorial adjustment’ factor, applied to the number of WIC‐eligible infants and children in the 50 States and the District of Columbia. Analysis conducted under this project showed that this factor would greatly overestimate WIC eligibility in the territories if applied to current data. We developed alternate methods, using the Puerto Rico Community Survey (PRCS) data for direct estimation and using annual population data for the other island territories. This appendix summarizes the problems with the previous approach and describes the approach used for the estimates presented in this report. Problems with the Current Adjustment Factor
The territory adjustment factor was previously estimated as the ratio of the sum of income‐eligible infants and children in the territories (with the Puerto Rico information from the Census Summary File and the information for other territories provided by FNS) to the number of income‐eligible infants and children residing in the 50 States and the District of Columbia. The computation of the factor required decennial Census data, so could be updated only once every 10 years. The value of the adjustment factor derived from 1990 Census data was 1.0388, and the factor derived from the 2000 Census data was 1.0332.
While that factor may have been correct in 2000, today it overestimates the number of WIC‐eligible infants and children in the territories. If this adjustment were applied to the national estimates of WIC‐eligible infants and children, there would be 367,000 infants and children estimated to be WIC‐eligible in CY 2008 and 396,000 infants and children in CY 2009. However, the Census Bureau estimates that the total number of infants and children residing in all of the territories to be 275,000 in 2008 and 270,000 in 2009. The current procedures do not produce credible estimates of the number of WIC‐eligible infants and children in the territories.
Why is the current methodology producing such poor estimates? First, the multiplier for territories may not have been accurate in 2000 when the initial value 1.0332 was set. The construction of the multiplier can be described as
MultiplerTerritory
IETerritoriesIEUS

National‐ and State‐Level Estimates of WIC Eligibles and Program Reach: Appendices Page B‐2
where IE denotes total number of income‐eligible infants and children (age 0 to 4) and where the subscript denotes the geography of residing either in the territories or the mainland (50 States plus the District of Columbia). The value of IE for the territories was derived from two sources. The value for Puerto Rico was based upon a summary tabulation of the 2000 Census that represented the number of infants residing in families whose income is less than 185 percent of poverty. The value for IE for the other island territories was provided by FNS, but the source of their estimate cannot be documented at this time.
The estimate of the number of infants and children in the territories who are WIC‐eligible is derived by multiplying the above expression by the total number of WIC‐eligible (income or adjunctively) infants and children (FEUS) in the U.S. mainland and the annual‐to‐monthly adjustment (AM). Prior to the adjustment for nutritional risk, the number of infants and children estimated to be WIC‐eligible (EST) in the territories as proportional to their total number (POP) would be equal to
ESTTerritoriesPOPTerritories
FEUSIEUS
IETerritoriesPOPTerritories
AM
The estimate of the eligibility rate (above ratio) should be less than 1.0. The first term in the expression represents one over the proportion of eligible infants and children that gain their eligibility through income eligibility on the mainland. In 2008 and 2009, the percentage of infants and children who gain eligibility through income is, on average, 80 percent. Consequently the first term will be roughly 1.25. The next term reflects the proportion of the infants in the territories who are income‐eligible for WIC used in the construction of the multiplier. Based upon population estimates for 2000, the percentage of the infant and child population that was income‐eligible for WIC in Puerto Rico was 78.4 percent and 56.8 percent in the other territories. The combined income eligibility rate is 75.8 percent while on the mainland the comparable eligibility rate is 41.8 percent.
This analysis suggests the product of the first two terms would be roughly 0.9475, which is less than 1.0. However, if we apply the values for the annual‐to‐monthly adjustments (the estimates in this report use 1.18 for infants and 1.01 for children), estimated eligibility for infants would exceed the population estimate using this approach.
Why did this overstatement occur in 2000? The first term in the above expression is attempting to correct for only estimating income eligibility in the territories on an annual basis. While income eligibility accounts for roughly 80 percent of those who are eligible on the mainland, the proportion of those infants and children who gain eligibility on the basis of their income is likely to be much higher in the territories and consequently the first term should be much smaller. For example, if in the territories 95 percent of the infants and children are eligible based on their income
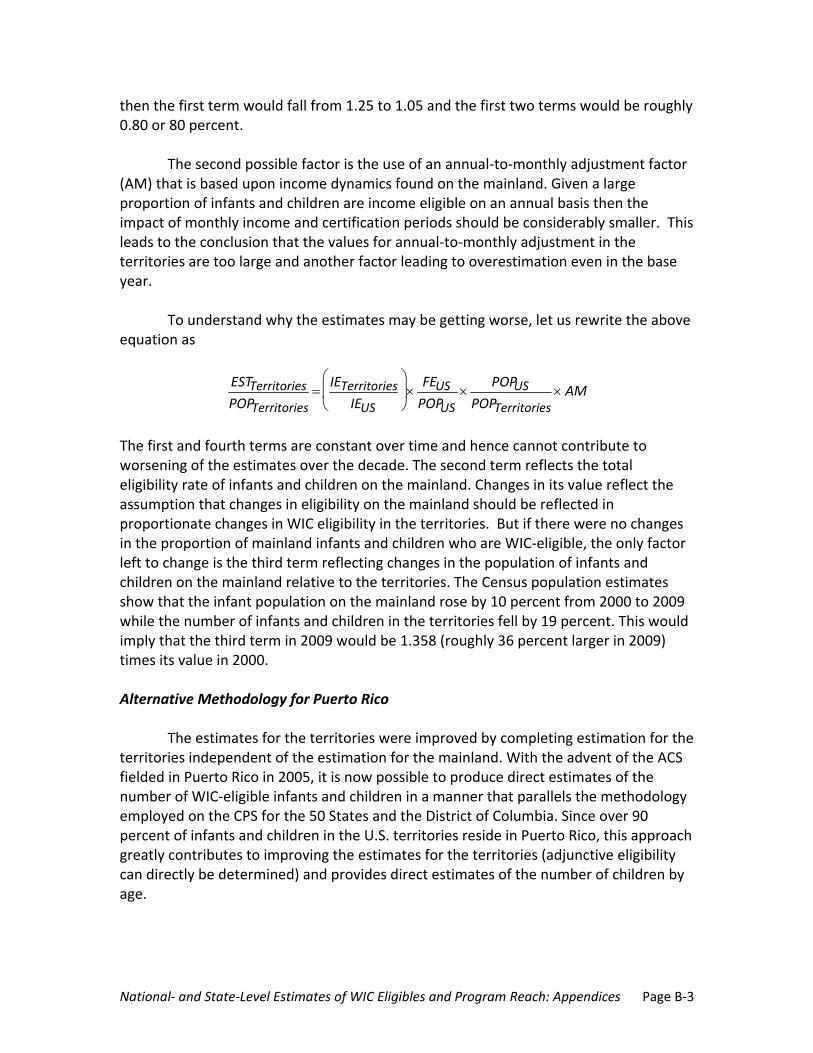
National‐ and State‐Level Estimates of WIC Eligibles and Program Reach: Appendices Page B‐3
then the first term would fall from 1.25 to 1.05 and the first two terms would be roughly 0.80 or 80 percent.
The second possible factor is the use of an annual‐to‐monthly adjustment factor (AM) that is based upon income dynamics found on the mainland. Given a large proportion of infants and children are income eligible on an annual basis then the impact of monthly income and certification periods should be considerably smaller. This leads to the conclusion that the values for annual‐to‐monthly adjustment in the territories are too large and another factor leading to overestimation even in the base year.
To understand why the estimates may be getting worse, let us rewrite the above equation as
ESTTerritoriesPOPTerritories
IETerritoriesIEUS
FEUSPOPUS
POPUSPOPTerritories
AM
The first and fourth terms are constant over time and hence cannot contribute to worsening of the estimates over the decade. The second term reflects the total eligibility rate of infants and children on the mainland. Changes in its value reflect the assumption that changes in eligibility on the mainland should be reflected in proportionate changes in WIC eligibility in the territories. But if there were no changes in the proportion of mainland infants and children who are WIC‐eligible, the only factor left to change is the third term reflecting changes in the population of infants and children on the mainland relative to the territories. The Census population estimates show that the infant population on the mainland rose by 10 percent from 2000 to 2009 while the number of infants and children in the territories fell by 19 percent. This would imply that the third term in 2009 would be 1.358 (roughly 36 percent larger in 2009) times its value in 2000. Alternative Methodology for Puerto Rico
The estimates for the territories were improved by completing estimation for the territories independent of the estimation for the mainland. With the advent of the ACS fielded in Puerto Rico in 2005, it is now possible to produce direct estimates of the number of WIC‐eligible infants and children in a manner that parallels the methodology employed on the CPS for the 50 States and the District of Columbia. Since over 90 percent of infants and children in the U.S. territories reside in Puerto Rico, this approach greatly contributes to improving the estimates for the territories (adjunctive eligibility can directly be determined) and provides direct estimates of the number of children by age.
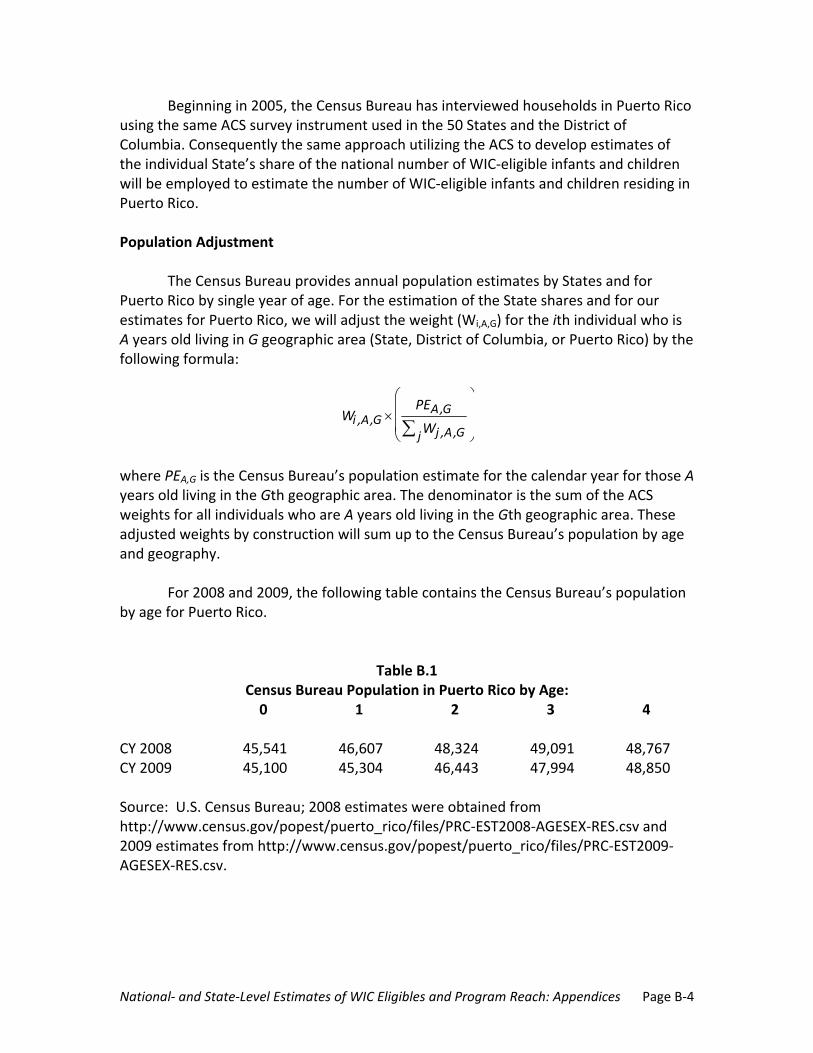
National‐ and State‐Level Estimates of WIC Eligibles and Program Reach: Appendices Page B‐4
Beginning in 2005, the Census Bureau has interviewed households in Puerto Rico using the same ACS survey instrument used in the 50 States and the District of Columbia. Consequently the same approach utilizing the ACS to develop estimates of the individual State’s share of the national number of WIC‐eligible infants and children will be employed to estimate the number of WIC‐eligible infants and children residing in Puerto Rico. Population Adjustment
The Census Bureau provides annual population estimates by States and for Puerto Rico by single year of age. For the estimation of the State shares and for our estimates for Puerto Rico, we will adjust the weight (Wi,A,G) for the ith individual who is A years old living in G geographic area (State, District of Columbia, or Puerto Rico) by the following formula:
Wi ,A,G PEA,G
Wj ,A,Gj
where PEA,G is the Census Bureau’s population estimate for the calendar year for those A years old living in the Gth geographic area. The denominator is the sum of the ACS weights for all individuals who are A years old living in the Gth geographic area. These adjusted weights by construction will sum up to the Census Bureau’s population by age and geography.
For 2008 and 2009, the following table contains the Census Bureau’s population by age for Puerto Rico.
Table B.1 Census Bureau Population in Puerto Rico by Age:
0 1 2 3 4 CY 2008 45,541 46,607 48,324 49,091 48,767 CY 2009 45,100 45,304 46,443 47,994 48,850 Source: U.S. Census Bureau; 2008 estimates were obtained from http://www.census.gov/popest/puerto_rico/files/PRC‐EST2008‐AGESEX‐RES.csv and 2009 estimates from http://www.census.gov/popest/puerto_rico/files/PRC‐EST2009‐AGESEX‐RES.csv.

National‐ and State‐Level Estimates of WIC Eligibles and Program Reach: Appendices Page B‐5
Estimates of the Number of WIC Eligibles in Puerto Rico (2008 and 2009) Following the same methodology, we used the ACS to determine the State’s share of the national total estimates. We computed the number of infants and children (age 1 to 4) residing in Puerto Rico who were income‐eligible (income less than the 185 percent of the poverty guidelines); adjunctively eligible only (not income‐eligible but participated in SNAP, other welfare programs, or Medicaid); total eligibles (income or adjunctively eligible), and the eligibility rate (the percentage of the total population who were WIC‐eligible). The results of these determinations are presented in the following table.
Table B.2
Estimates of WIC‐Eligible Infants and Children by Age in Puerto Rico 0 1 2 3 4 CY 2008: Total 45,541 46,607 48,324 49,081 48,767 Income 35,441 37574 38,582 38,589 38,676 Adjunctive 2,128 1,292 1,397 1,272 1,104 Full 37,568 38,866 39,979 39,862 39,780 Eligibility Rate 97.6% 87.5% 86.8% 85.2% 85.6% CY 2009: Total 45,100 45,304 46,443 47,994 48,850 Income 36,366 35,658 36,453 40,103 37,556 Adjunctive 2,737 3,042 1,190 1,514 1,865 Full 39,103 38,699 37,643 41,617 39,422 Eligibility Rate 102.6% 89.6% 85.1% 91.0% 84.7% Source: Calculations from the 2008 and 2009 Puerto Rico Community Survey (IPUMS) Note: The total population counts in this table exclude infants and children living in group quarters and consequently the total counts do not match the population controls listed above.
These estimates represent eligibility based upon annual income and do not take into account monthly income or certification periods. For estimates on the mainland, we applied the annual‐to‐monthly adjustment factor developed using the SIPP data of 1.18 for infants and 1.01 for children. While the application of the adjustment factor for children leaves the eligibility rate less than 100 percent, the application of the infant’s adjustment factor in CY 2009 raised their eligibility rate over 100 percent. For the estimates presented, we applied these factors to the eligibility estimates in Puerto Rico following procedures used in the past. As noted earlier, the reliability of these adjustment factors for use in the territories is questionable since their construction uses
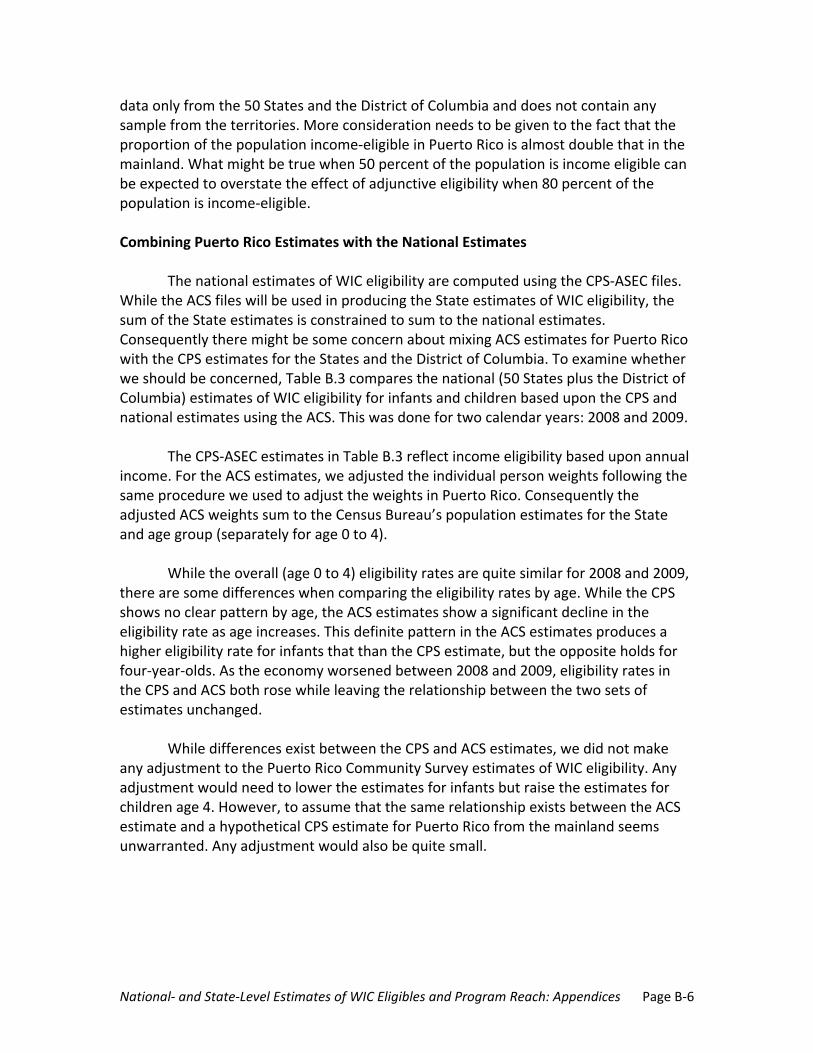
National‐ and State‐Level Estimates of WIC Eligibles and Program Reach: Appendices Page B‐6
data only from the 50 States and the District of Columbia and does not contain any sample from the territories. More consideration needs to be given to the fact that the proportion of the population income‐eligible in Puerto Rico is almost double that in the mainland. What might be true when 50 percent of the population is income eligible can be expected to overstate the effect of adjunctive eligibility when 80 percent of the population is income‐eligible.
Combining Puerto Rico Estimates with the National Estimates
The national estimates of WIC eligibility are computed using the CPS‐ASEC files. While the ACS files will be used in producing the State estimates of WIC eligibility, the sum of the State estimates is constrained to sum to the national estimates. Consequently there might be some concern about mixing ACS estimates for Puerto Rico with the CPS estimates for the States and the District of Columbia. To examine whether we should be concerned, Table B.3 compares the national (50 States plus the District of Columbia) estimates of WIC eligibility for infants and children based upon the CPS and national estimates using the ACS. This was done for two calendar years: 2008 and 2009.
The CPS‐ASEC estimates in Table B.3 reflect income eligibility based upon annual income. For the ACS estimates, we adjusted the individual person weights following the same procedure we used to adjust the weights in Puerto Rico. Consequently the adjusted ACS weights sum to the Census Bureau’s population estimates for the State and age group (separately for age 0 to 4).
While the overall (age 0 to 4) eligibility rates are quite similar for 2008 and 2009, there are some differences when comparing the eligibility rates by age. While the CPS shows no clear pattern by age, the ACS estimates show a significant decline in the eligibility rate as age increases. This definite pattern in the ACS estimates produces a higher eligibility rate for infants that than the CPS estimate, but the opposite holds for four‐year‐olds. As the economy worsened between 2008 and 2009, eligibility rates in the CPS and ACS both rose while leaving the relationship between the two sets of estimates unchanged.
While differences exist between the CPS and ACS estimates, we did not make any adjustment to the Puerto Rico Community Survey estimates of WIC eligibility. Any adjustment would need to lower the estimates for infants but raise the estimates for children age 4. However, to assume that the same relationship exists between the ACS estimate and a hypothetical CPS estimate for Puerto Rico from the mainland seems unwarranted. Any adjustment would also be quite small.
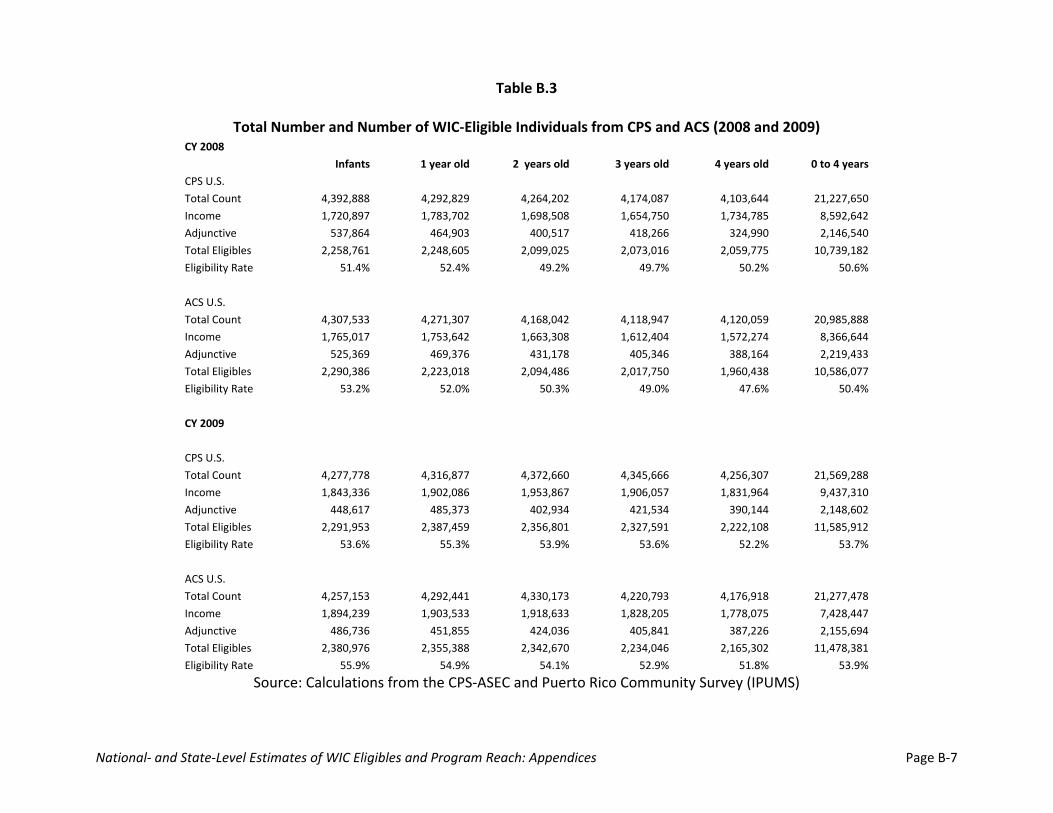
National‐ and State‐Level Estimates of WIC Eligibles and Program Reach: Appendices Page B‐7
Table B.3
Total Number and Number of WIC‐Eligible Individuals from CPS and ACS (2008 and 2009) CY 2008
Infants 1 year old 2 years old 3 years old 4 years old 0 to 4 years
CPS U.S.
Total Count 4,392,888 4,292,829 4,264,202 4,174,087 4,103,644 21,227,650
Income 1,720,897 1,783,702 1,698,508 1,654,750 1,734,785 8,592,642
Adjunctive 537,864 464,903 400,517 418,266 324,990 2,146,540
Total Eligibles 2,258,761 2,248,605 2,099,025 2,073,016 2,059,775 10,739,182
Eligibility Rate 51.4% 52.4% 49.2% 49.7% 50.2% 50.6%
ACS U.S.
Total Count 4,307,533 4,271,307 4,168,042 4,118,947 4,120,059 20,985,888
Income 1,765,017 1,753,642 1,663,308 1,612,404 1,572,274 8,366,644
Adjunctive 525,369 469,376 431,178 405,346 388,164 2,219,433
Total Eligibles 2,290,386 2,223,018 2,094,486 2,017,750 1,960,438 10,586,077
Eligibility Rate 53.2% 52.0% 50.3% 49.0% 47.6% 50.4%
CY 2009
CPS U.S.
Total Count 4,277,778 4,316,877 4,372,660 4,345,666 4,256,307 21,569,288
Income 1,843,336 1,902,086 1,953,867 1,906,057 1,831,964 9,437,310
Adjunctive 448,617 485,373 402,934 421,534 390,144 2,148,602
Total Eligibles 2,291,953 2,387,459 2,356,801 2,327,591 2,222,108 11,585,912
Eligibility Rate 53.6% 55.3% 53.9% 53.6% 52.2% 53.7%
ACS U.S.
Total Count 4,257,153 4,292,441 4,330,173 4,220,793 4,176,918 21,277,478
Income 1,894,239 1,903,533 1,918,633 1,828,205 1,778,075 7,428,447
Adjunctive 486,736 451,855 424,036 405,841 387,226 2,155,694
Total Eligibles 2,380,976 2,355,388 2,342,670 2,234,046 2,165,302 11,478,381
Eligibility Rate 55.9% 54.9% 54.1% 52.9% 51.8% 53.9%
Source: Calculations from the CPS‐ASEC and Puerto Rico Community Survey (IPUMS)
National‐ and State‐Level Estimates of WIC Eligibles and Program Reach: Appendices Page B‐8
Other Island Territories
For infants and children residing in other island territories, the only data available are annual population estimates for the group age 0 to 4 and once‐in‐a‐decade estimates of the number of income‐eligible infants and children from the decennial Census. Since the available data pertain only to the combined age group of 0 to 4 years old, we used CDC birth data to allocate the total estimate to the number of infants and to each of the four years of children (age 1 to 4).
We estimated the number of WIC‐eligible infants and children (combined) residing in the other island territories in year t using the following relationship
IE2000POP2000
POPt
where IE2000 is the number of income‐eligible infants and children in 2000 and POP is the Census Bureau’s population estimate for year 2000 and t. Using the data provided by FNS to compute the original territorial adjustment factor, there were 22,145 infants and children income‐eligible while the population in 2000 was 38,987 infants and children. This would imply that 56.8 percent of the total number of infants and children in the other island territories were income‐eligible for WIC.
This approach assumes that the income eligibility rate remains constant over the decade until a new rate can be estimated using the 2010 Census long forms. While this approach will not capture changes in the economic conditions, it also doesn’t capture any potential eligibility gained by participation in other programs (adjunctive eligibility). As previously noted, income eligibility accounts for 80.1 percent of the total eligible infants and children on the mainland (average of 2008 and 2009). However, when using the ACS (2008 and 2009), 95.5 percent of the fully eligible infants and children in Puerto Rico gain their eligibility through the income test. While we cannot infer adjunctive eligibility for 2000, we make an educated guess about the ratio of full eligibility to income eligibility (equal to one over the proportion of infants and children gaining eligibility through income) by examining the proportion of the population who are income‐eligible. We were guided by the assumption that if a higher proportion of the population is income‐eligible, then there will be fewer infants and children that can gain eligibility through participation in other programs, since they are already eligible based on income. If we assume that there is a proportional relationship between the percentage of the population that is income‐eligible and the proportion of full eligible individuals who are income eligible, then we can estimate the proportion of full eligible individuals who are income eligible using the data for the 50 States plus the District of Columbia and for Puerto Rico, based on the following equation:
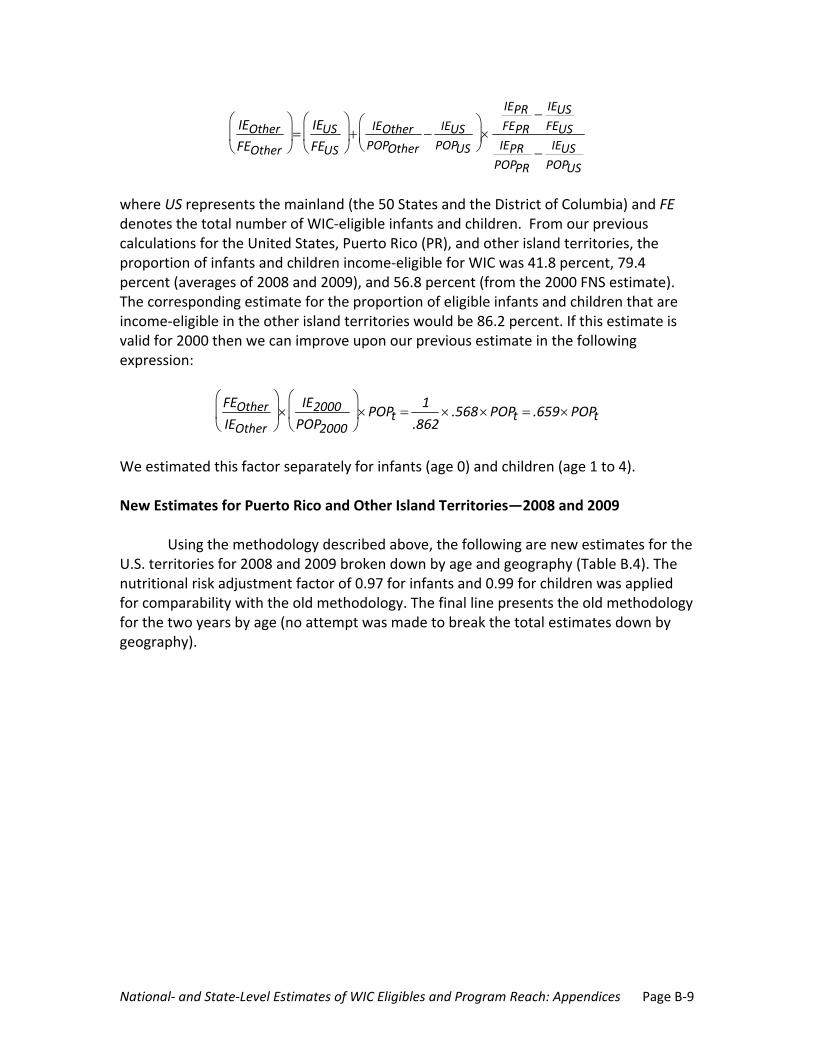
National‐ and State‐Level Estimates of WIC Eligibles and Program Reach: Appendices Page B‐9
IEOtherFEOther
IEUSFEUS
IEOtherPOPOther
IEUSPOPUS
IEPRFEPR
IEUSFEUS
IEPRPOPPR
IEUSPOPUS
where US represents the mainland (the 50 States and the District of Columbia) and FE denotes the total number of WIC‐eligible infants and children. From our previous calculations for the United States, Puerto Rico (PR), and other island territories, the proportion of infants and children income‐eligible for WIC was 41.8 percent, 79.4 percent (averages of 2008 and 2009), and 56.8 percent (from the 2000 FNS estimate). The corresponding estimate for the proportion of eligible infants and children that are income‐eligible in the other island territories would be 86.2 percent. If this estimate is valid for 2000 then we can improve upon our previous estimate in the following expression:
FEOtherIEOther
IE2000POP2000
POPt
1
.862 .568POPt .659POPt
We estimated this factor separately for infants (age 0) and children (age 1 to 4). New Estimates for Puerto Rico and Other Island Territories—2008 and 2009
Using the methodology described above, the following are new estimates for the U.S. territories for 2008 and 2009 broken down by age and geography (Table B.4). The nutritional risk adjustment factor of 0.97 for infants and 0.99 for children was applied for comparability with the old methodology. The final line presents the old methodology for the two years by age (no attempt was made to break the total estimates down by geography).
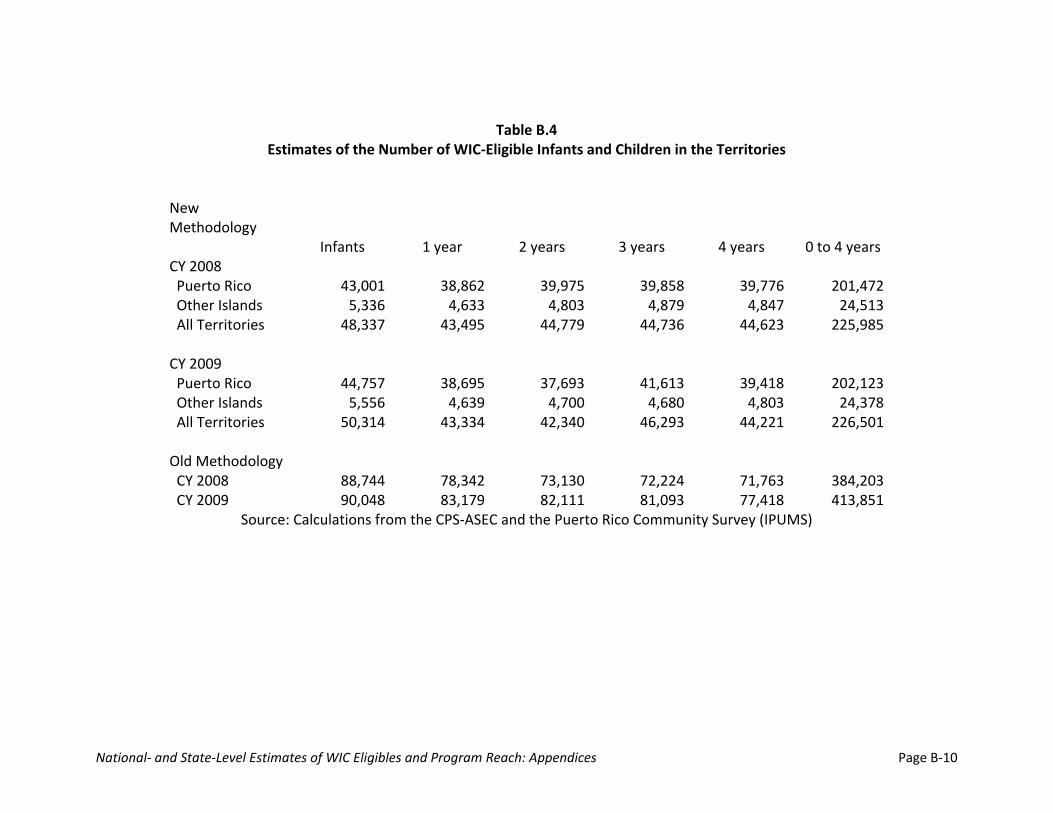
National‐ and State‐Level Estimates of WIC Eligibles and Program Reach: Appendices Page B‐10
Table B.4 Estimates of the Number of WIC‐Eligible Infants and Children in the Territories
New Methodology Infants 1 year 2 years 3 years 4 years 0 to 4 years CY 2008 Puerto Rico 43,001 38,862 39,975 39,858 39,776 201,472 Other Islands 5,336 4,633 4,803 4,879 4,847 24,513 All Territories 48,337 43,495 44,779 44,736 44,623 225,985 CY 2009 Puerto Rico 44,757 38,695 37,693 41,613 39,418 202,123 Other Islands 5,556 4,639 4,700 4,680 4,803 24,378 All Territories 50,314 43,334 42,340 46,293 44,221 226,501 Old Methodology CY 2008 88,744 78,342 73,130 72,224 71,763 384,203 CY 2009 90,048 83,179 82,111 81,093 77,418 413,851
Source: Calculations from the CPS‐ASEC and the Puerto Rico Community Survey (IPUMS)
National‐ and State‐Level Estimates of WIC Eligibles and Program Reach: Appendices Page C‐1
Appendix C
State and Regional Estimates: 2008 and 2009
The appendix tables show the estimates of total WIC‐eligible individuals by State and by participant group and region for calendar years 2008 and 2009 as summarized in Volume I of this report. Note that these estimates refer to the FNS regions as defined below. The estimates rely on the American Community Survey (ACS) that allows for income and adjunctive eligibility by State. Note that adjunctive eligibility reflects individuals that report receipt of SNAP, TANF, or public health coverage on the ACS but are not already income‐eligible for WIC. The ACS does not support a break out of public health coverage through Medicaid or the State’s Children’s Health Insurance Program (CHIP). State and Regional Estimates Appendix Table Definitions Table C.1: WIC Eligibles and Coverage Rates by State and FNS Region This table shows the estimated total number of WIC‐eligible individuals by State (alphabetical) and FNS region. Also shown is the total number of participants and calculated coverage rates by State and FNS region. Totals and coverage rates by FNS region include the territories. Table C.2: WIC Eligibles and Coverage Rates by FNS Region and State This table shows the estimated total number of WIC‐eligible individuals by FNS region with each State listed under its region. Also shown is the total number of participants and calculated coverage rates by FNS region and State. Totals and coverage rates by FNS region include the territories. Table C.3: WIC Eligibles and Coverage Rates by FNS Region and Participant Group This table shows the estimated number of WIC‐eligible individuals by FNS region and participant group. Also shown is the total number of participants and calculated coverage rates by FNS region and participant group. Totals and coverage rates by FNS region and participant group include the territories. Table C.4: WIC Eligibles Standard Errors by State and FNS Region This table shows the estimated total number of WIC‐eligible individuals and the associated standard errors and coefficients of variance by State (alphabetical) and FNS region.

National‐ and State‐Level Estimates of WIC Eligibles and Program Reach: Appendices Page C‐2
Table C.5: WIC Eligibles Standard Errors by FNS Region and State This table shows the estimated total number of WIC‐eligible individuals and the associated standard errors and coefficients of variance by FNS region with each State listed under its region. Table C.6: WIC Eligibles Standard Errors by FNS Region and Participant Group This table shows the estimated number of WIC‐eligible individuals and the associated standard errors and coefficients of variance by FNS region and participant group. Table C.7: State‐Specific Breastfeeding Adjustment Factors This table shows the State‐specific breastfeeding adjustment factors. These factors were determined using the same methodology used to produce the national breastfeeding adjustments but substitute the State‐specific breastfeeding rates as reported by the Ross Laboratories Mothers Survey (RLMS). Estimates for the territories assumed the national breastfeeding rates. Table C.8: Adjustments for Calculating the Average Monthly Number of Individuals Eligible for WIC in Puerto Rico and the Other Island Territories by Participant Group Analogous to Table A.6 of the national estimates, this table shows the step‐by‐step adjustments made from the total number of infants and children to the final numbers of infants, children, and pregnant and postpartum women that are fully eligible for WIC for the territories based on the ACS data and population estimates from the Census Bureau. Table C.9: FNS Region Estimates of the Average Monthly Number of Infants and Children Eligible for WIC in the CPS‐ASEC by Demographic Characteristics This tables shows the estimates of total WIC‐eligible infants and children by demographic and income characteristics in the CPS‐ASEC. Note that these tables do not include infants and children from the territories. This table shows these characteristics using weights that have been fully adjusted, including adjustments for the under/over count in the CPS (population adjustment), monthly income and certification periods (annual‐to‐monthly adjustment), and nutritional risk. The numbers are shown as a single total count and the column percentages of eligible individuals by their demographic and income characteristics.
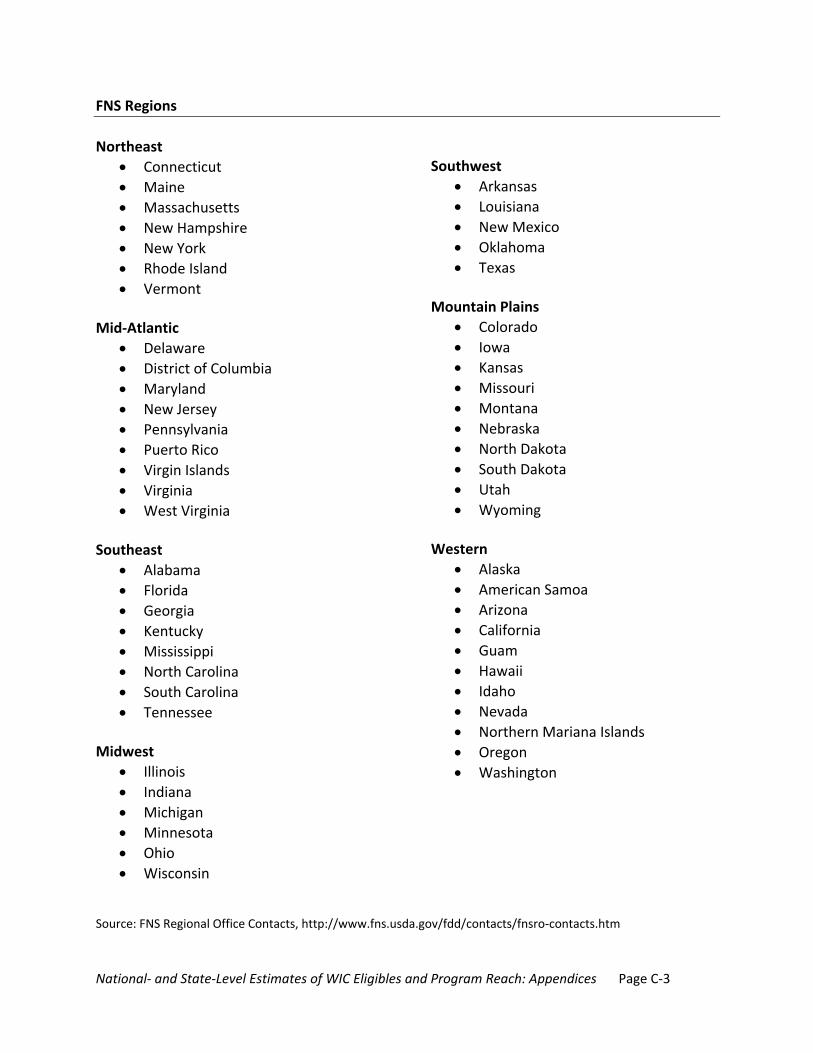
National‐ and State‐Level Estimates of WIC Eligibles and Program Reach: Appendices Page C‐3
FNS Regions
Northeast
Connecticut
Maine
Massachusetts
New Hampshire
New York
Rhode Island
Vermont
Mid‐Atlantic
Delaware
District of Columbia
Maryland
New Jersey
Pennsylvania
Puerto Rico
Virgin Islands
Virginia
West Virginia
Southeast
Alabama
Florida
Georgia
Kentucky
Mississippi
North Carolina
South Carolina
Tennessee
Midwest
Illinois
Indiana
Michigan
Southwest
Arkansas
Louisiana
New Mexico
Oklahoma
Texas Mountain Plains
Colorado
Iowa
Kansas
Missouri
Montana
Nebraska
North Dakota
South Dakota
Utah
Wyoming
Western
Alaska
American Samoa
Arizona
California
Guam
Hawaii
Idaho
Nevada
Northern Mariana Islands
Oregon
Washington
Minnesota
Ohio
Wisconsin Source: FNS Regional Office Contacts, http://www.fns.usda.gov/fdd/contacts/fnsro‐contacts.htm

National‐ and State‐Level Estimates of WIC Eligibles and Program Reach: Appendices Page C‐4
Eligibles Participants Coverage Rate Eligibles Participants Coverage
RateStateAlabama 228,701 136,766 59.8% New York 766,852 503,708 65.7%Alaska 35,332 25,232 71.4% North Carolina 465,366 266,001 57.2%Arizona 385,799 200,710 52.0% North Dakota 24,976 14,888 59.6%Arkansas 173,586 90,981 52.4% Ohio 465,263 295,947 63.6%California 1,850,739 1,417,767 76.6% Oklahoma 205,320 124,421 60.6%Colorado 207,630 101,213 48.7% Oregon 166,021 109,638 66.0%Connecticut 101,592 57,269 56.4% Pennsylvania 445,205 254,131 57.1%Delaware 34,058 22,719 66.7% Puerto Rico 248,499 199,478 80.3%D.C. 23,929 16,798 70.2% Rhode Island 32,172 26,006 80.8%Florida 786,020 475,794 60.5% South Carolina 221,137 130,295 58.9%Georgia 542,517 313,300 57.7% South Dakota 37,162 22,743 61.2%Hawaii 47,300 34,744 73.5% Tennessee 318,208 171,396 53.9%Idaho 85,501 43,120 50.4% Texas 1,545,998 943,421 61.0%Illinois 571,071 299,045 52.4% Utah 147,837 67,697 45.8%Indiana 293,784 159,704 54.4% Vermont 20,972 16,955 80.8%Iowa 112,653 73,094 64.9% Virginia 253,242 153,642 60.7%Kansas 120,500 74,060 61.5% Washington 263,060 180,733 68.7%Kentucky 213,495 137,913 64.6% West Virginia 76,953 52,371 68.1%Louisiana 265,721 143,613 54.0% Wisconsin 200,544 123,140 61.4%Maine 46,949 26,025 55.4% Wyoming 22,168 12,715 57.4%Maryland 185,883 138,685 74.6%Massachusetts 189,030 125,268 66.3% FNS Regiona
Michigan 417,369 238,166 57.1% Northeast 1,191,203 773,239 64.9%Minnesota 175,168 142,534 81.4% Mid-Atlantic 1,550,350 1,005,008 64.8%Mississippi 179,821 110,647 61.5% Southeast 2,955,264 1,742,111 58.9%Missouri 271,487 145,323 53.5% Midwest 2,123,199 1,258,537 59.3%Montana 39,833 20,105 50.5% Southwest 2,322,679 1,371,470 59.0%Nebraska 79,433 44,822 56.4% Mountain Plains 1,063,678 576,659 54.2%Nevada 114,107 63,067 55.3% Western 2,965,005 2,092,107 70.6%New Hampshire 33,635 18,008 53.5%New Jersey 269,266 161,684 60.0% Total 14,171,378 8,819,130 62.2%New Mexico 132,054 69,034 52.3%Source: 2009 CPS-ASEC, 2008 ACS, 2008 PRCS, Census International Data Base, WIC Administrative Data
Notes:a
Table C.1-2008: WIC Eligibles and Coverage Rates by State and FNS Region, CY 2008
Estimates for the other island territories (territories other than Puerto Rico) are included in regional totals but not shown separately due to small sample constraints.

National‐ and State‐Level Estimates of WIC Eligibles and Program Reach: Appendices Page C‐5
Eligibles Participants Coverage Rate Eligibles Participants Coverage
RateNortheast 1,191,203 773,239 64.9% Southwest 2,322,679 1,371,470 59.0%
Connecticut 101,592 57,269 56.4% Arkansas 173,586 90,981 52.4%Maine 46,949 26,025 55.4% Louisiana 265,721 143,613 54.0%Massachusetts 189,030 125,268 66.3% New Mexico 132,054 69,034 52.3%New 33,635 18,008 53.5% Oklahoma 205,320 124,421 60.6%New York 766,852 503,708 65.7% Texas 1,545,998 943,421 61.0%Rhode Island 32,172 26,006 80.8%Vermont 20,972 16,955 80.8% Mountain Plains 1,063,678 576,659 54.2%
Colorado 207,630 101,213 48.7%Mid-Atlantic 1,550,350 1,005,008 64.8% Iowa 112,653 73,094 64.9%
Delaware 34,058 22,719 66.7% Kansas 120,500 74,060 61.5%D.C. 23,929 16,798 70.2% Missouri 271,487 145,323 53.5%Maryland 185,883 138,685 74.6% Montana 39,833 20,105 50.5%New Jersey 269,266 161,684 60.0% Nebraska 79,433 44,822 56.4%Pennsylvania 445,205 254,131 57.1% North Dakota 24,976 14,888 59.6%Puerto Rico 248,499 199,478 80.3% South Dakota 37,162 22,743 61.2%Virginia 253,242 153,642 60.7% Utah 147,837 67,697 45.8%West Virginia 76,953 52,371 68.1% Wyoming 22,168 12,715 57.4%
Southeast 2,955,264 1,742,111 58.9% Western 2,965,005 2,092,107 70.6%Alabama 228,701 136,766 59.8% Alaska 35,332 25,232 71.4%Florida 786,020 475,794 60.5% Arizona 385,799 200,710 52.0%Georgia 542,517 313,300 57.7% California 1,850,739 1,417,767 76.6%Kentucky 213,495 137,913 64.6% Hawaii 47,300 34,744 73.5%Mississippi 179,821 110,647 61.5% Idaho 85,501 43,120 50.4%North Carolina 465,366 266,001 57.2% Nevada 114,107 63,067 55.3%South Carolina 221,137 130,295 58.9% Oregon 166,021 109,638 66.0%Tennessee 318,208 171,396 53.9% Washington 263,060 180,733 68.7%
Midwest 2,123,199 1,258,537 59.3% Total 14,171,378 8,819,130 62.2%Illinois 571,071 299,045 52.4%Indiana 293,784 159,704 54.4%Michigan 417,369 238,166 57.1%Minnesota 175,168 142,534 81.4%Ohio 465,263 295,947 63.6%Wisconsin 200,544 123,140 61.4%
Source: 2009 CPS-ASEC, 2008 ACS, 2008 PRCS, Census International Data Base, WIC Administrative Data
Notes:a
Table C.2-2008: WIC Eligibles and Coverage Rates by FNS Region and State, CY 2008a
Estimates for the other island territories (territories other than Puerto Rico) are included in regional totals but not shown separately due to small sample constraints.

National‐ and State‐Level Estimates of WIC Eligibles and Program Reach: Appendices Page C‐6
InfantsChildren
(age 1 to 4)Pregnant Women
All Postpartum Women Total
EligiblesNortheast 216,092 730,540 111,182 133,389 1,191,203Mid-Atlantic 279,144 972,366 143,623 155,217 1,550,350Southeast 547,598 1,816,805 281,745 309,117 2,955,264Midwest 403,335 1,280,498 207,520 231,846 2,123,199Southwest 433,386 1,422,837 222,982 243,474 2,322,679Mountain Plains 201,425 640,013 103,635 118,605 1,063,678Western 552,839 1,794,057 284,441 333,668 2,965,005Total 2,633,819 8,657,117 1,355,127 1,525,315 14,171,378
ParticipantsNortheast 192,506 388,129 79,760 112,843 773,238Mid-Atlantic 246,883 520,595 101,537 135,992 1,005,008Southeast 465,717 839,725 185,829 250,839 1,742,111Midwest 336,391 621,196 136,656 164,293 1,258,537Southwest 352,223 679,316 150,632 189,299 1,371,470Mountain Plains 146,972 286,582 57,795 85,309 576,659Western 487,366 1,092,945 214,708 297,088 2,092,107Total 2,228,058 4,428,489 926,919 1,235,664 8,819,130
Coverage RatesNortheast 89.1% 53.1% 71.7% 84.6% 64.9%Mid-Atlantic 88.4% 53.5% 70.7% 87.6% 64.8%Southeast 85.0% 46.2% 66.0% 81.1% 58.9%Midwest 83.4% 48.5% 65.9% 70.9% 59.3%Southwest 81.3% 47.7% 67.6% 77.7% 59.0%Mountain Plains 73.0% 44.8% 55.8% 71.9% 54.2%Western 88.2% 60.9% 75.5% 89.0% 70.6%Total 84.6% 51.2% 68.4% 81.0% 62.2%
Source: 2009 CPS-ASEC, 2008 ACS, 2008 PRCS, Census International Data Base, WIC Administrative Data
Table C.3-2008: WIC Eligibles and Coverage Rates by FNS Region and Participant Group, CY 2008
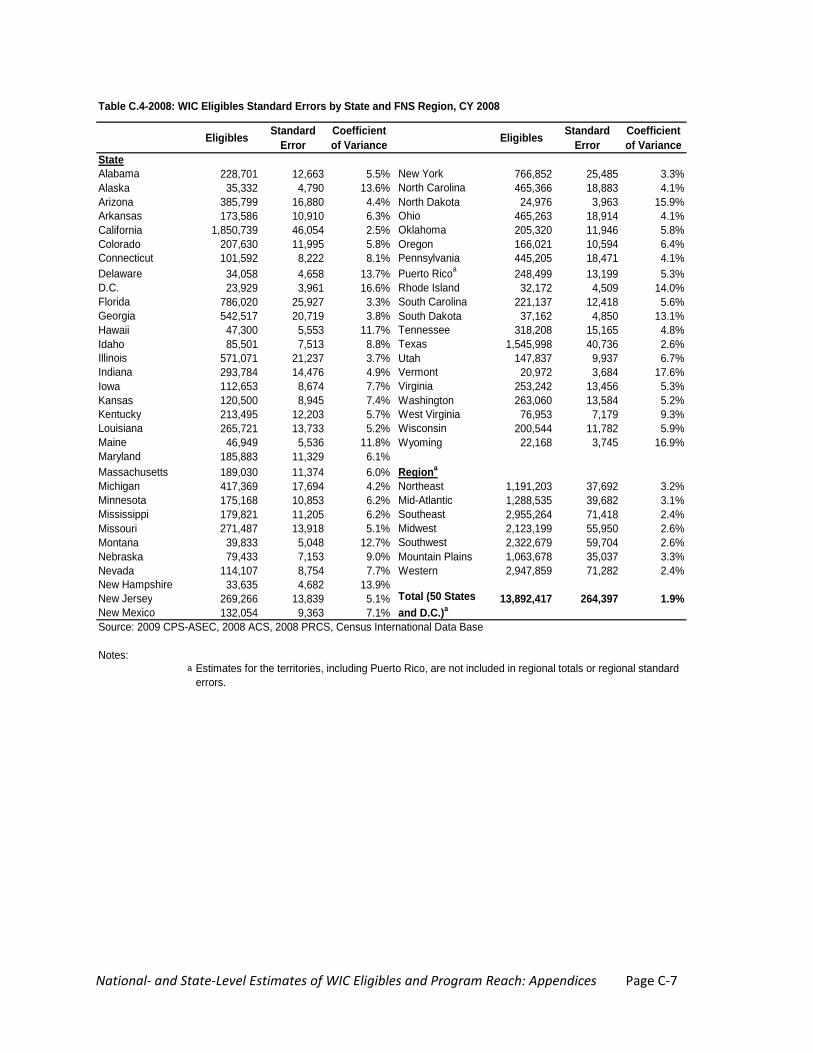
National‐ and State‐Level Estimates of WIC Eligibles and Program Reach: Appendices Page C‐7
Eligibles Standard Error
Coefficient of Variance Eligibles Standard
ErrorCoefficient of Variance
StateAlabama 228,701 12,663 5.5% New York 766,852 25,485 3.3%Alaska 35,332 4,790 13.6% North Carolina 465,366 18,883 4.1%Arizona 385,799 16,880 4.4% North Dakota 24,976 3,963 15.9%Arkansas 173,586 10,910 6.3% Ohio 465,263 18,914 4.1%California 1,850,739 46,054 2.5% Oklahoma 205,320 11,946 5.8%Colorado 207,630 11,995 5.8% Oregon 166,021 10,594 6.4%Connecticut 101,592 8,222 8.1% Pennsylvania 445,205 18,471 4.1%Delaware 34,058 4,658 13.7% Puerto Ricoa 248,499 13,199 5.3%D.C. 23,929 3,961 16.6% Rhode Island 32,172 4,509 14.0%Florida 786,020 25,927 3.3% South Carolina 221,137 12,418 5.6%Georgia 542,517 20,719 3.8% South Dakota 37,162 4,850 13.1%Hawaii 47,300 5,553 11.7% Tennessee 318,208 15,165 4.8%Idaho 85,501 7,513 8.8% Texas 1,545,998 40,736 2.6%Illinois 571,071 21,237 3.7% Utah 147,837 9,937 6.7%Indiana 293,784 14,476 4.9% Vermont 20,972 3,684 17.6%Iowa 112,653 8,674 7.7% Virginia 253,242 13,456 5.3%Kansas 120,500 8,945 7.4% Washington 263,060 13,584 5.2%Kentucky 213,495 12,203 5.7% West Virginia 76,953 7,179 9.3%Louisiana 265,721 13,733 5.2% Wisconsin 200,544 11,782 5.9%Maine 46,949 5,536 11.8% Wyoming 22,168 3,745 16.9%Maryland 185,883 11,329 6.1%Massachusetts 189,030 11,374 6.0% Regiona
Michigan 417,369 17,694 4.2% Northeast 1,191,203 37,692 3.2%Minnesota 175,168 10,853 6.2% Mid-Atlantic 1,288,535 39,682 3.1%Mississippi 179,821 11,205 6.2% Southeast 2,955,264 71,418 2.4%Missouri 271,487 13,918 5.1% Midwest 2,123,199 55,950 2.6%Montana 39,833 5,048 12.7% Southwest 2,322,679 59,704 2.6%Nebraska 79,433 7,153 9.0% Mountain Plains 1,063,678 35,037 3.3%Nevada 114,107 8,754 7.7% Western 2,947,859 71,282 2.4%New Hampshire 33,635 4,682 13.9%New Jersey 269,266 13,839 5.1% 13,892,417 264,397 1.9%New Mexico 132,054 9,363 7.1%Source: 2009 CPS-ASEC, 2008 ACS, 2008 PRCS, Census International Data Base
Notes:a
Table C.4-2008: WIC Eligibles Standard Errors by State and FNS Region, CY 2008
Total (50 States and D.C.)a
Estimates for the territories, including Puerto Rico, are not included in regional totals or regional standard errors.
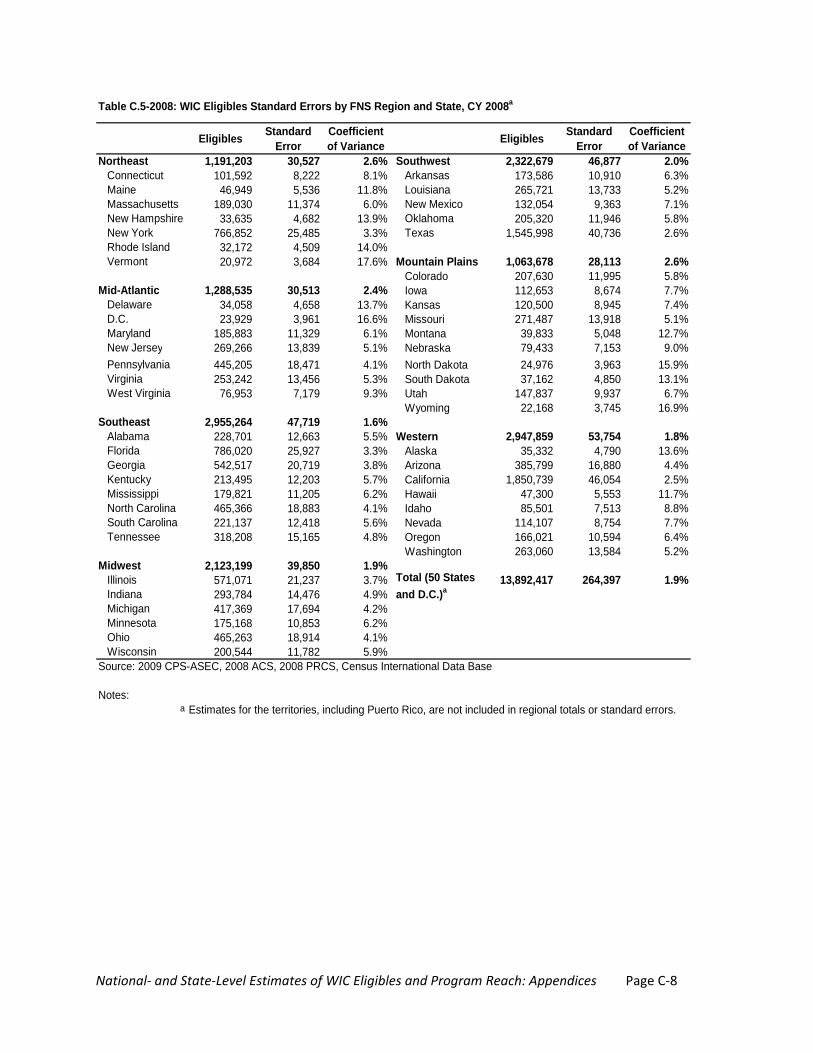
National‐ and State‐Level Estimates of WIC Eligibles and Program Reach: Appendices Page C‐8
Eligibles Standard Error
Coefficient of Variance Eligibles Standard
ErrorCoefficient of Variance
Northeast 1,191,203 30,527 2.6% Southwest 2,322,679 46,877 2.0%Connecticut 101,592 8,222 8.1% Arkansas 173,586 10,910 6.3%Maine 46,949 5,536 11.8% Louisiana 265,721 13,733 5.2%Massachusetts 189,030 11,374 6.0% New Mexico 132,054 9,363 7.1%New Hampshire 33,635 4,682 13.9% Oklahoma 205,320 11,946 5.8%New York 766,852 25,485 3.3% Texas 1,545,998 40,736 2.6%Rhode Island 32,172 4,509 14.0%Vermont 20,972 3,684 17.6% Mountain Plains 1,063,678 28,113 2.6%
Colorado 207,630 11,995 5.8%Mid-Atlantic 1,288,535 30,513 2.4% Iowa 112,653 8,674 7.7%
Delaware 34,058 4,658 13.7% Kansas 120,500 8,945 7.4%D.C. 23,929 3,961 16.6% Missouri 271,487 13,918 5.1%Maryland 185,883 11,329 6.1% Montana 39,833 5,048 12.7%New Jersey 269,266 13,839 5.1% Nebraska 79,433 7,153 9.0%Pennsylvania 445,205 18,471 4.1% North Dakota 24,976 3,963 15.9%Virginia 253,242 13,456 5.3% South Dakota 37,162 4,850 13.1%West Virginia 76,953 7,179 9.3% Utah 147,837 9,937 6.7%
Wyoming 22,168 3,745 16.9%Southeast 2,955,264 47,719 1.6%
Alabama 228,701 12,663 5.5% Western 2,947,859 53,754 1.8%Florida 786,020 25,927 3.3% Alaska 35,332 4,790 13.6%Georgia 542,517 20,719 3.8% Arizona 385,799 16,880 4.4%Kentucky 213,495 12,203 5.7% California 1,850,739 46,054 2.5%Mississippi 179,821 11,205 6.2% Hawaii 47,300 5,553 11.7%North Carolina 465,366 18,883 4.1% Idaho 85,501 7,513 8.8%South Carolina 221,137 12,418 5.6% Nevada 114,107 8,754 7.7%Tennessee 318,208 15,165 4.8% Oregon 166,021 10,594 6.4%
Washington 263,060 13,584 5.2%Midwest 2,123,199 39,850 1.9%
Illinois 571,071 21,237 3.7% 13,892,417 264,397 1.9%Indiana 293,784 14,476 4.9%Michigan 417,369 17,694 4.2%Minnesota 175,168 10,853 6.2%Ohio 465,263 18,914 4.1%Wisconsin 200,544 11,782 5.9%
Source: 2009 CPS-ASEC, 2008 ACS, 2008 PRCS, Census International Data Base
Notes:a
Table C.5-2008: WIC Eligibles Standard Errors by FNS Region and State, CY 2008a
Total (50 States and D.C.)a
Estimates for the territories, including Puerto Rico, are not included in regional totals or standard errors.
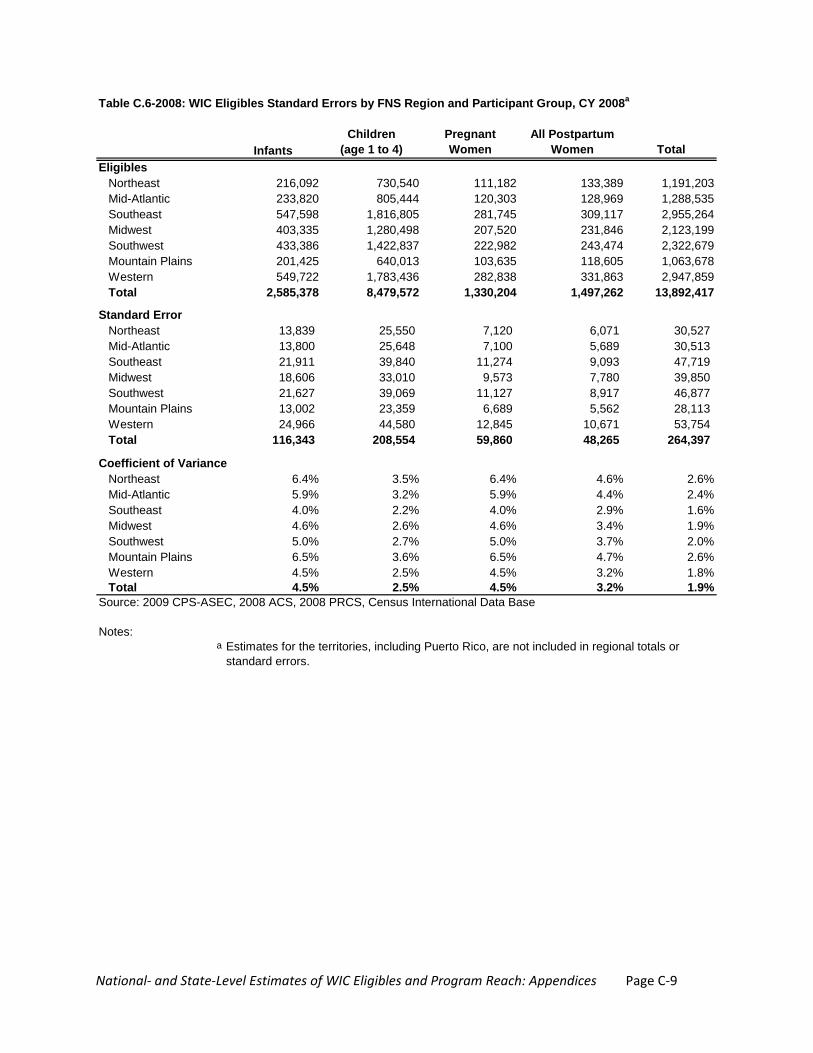
National‐ and State‐Level Estimates of WIC Eligibles and Program Reach: Appendices Page C‐9
InfantsChildren
(age 1 to 4)Pregnant Women
All Postpartum Women Total
EligiblesNortheast 216,092 730,540 111,182 133,389 1,191,203Mid-Atlantic 233,820 805,444 120,303 128,969 1,288,535Southeast 547,598 1,816,805 281,745 309,117 2,955,264Midwest 403,335 1,280,498 207,520 231,846 2,123,199Southwest 433,386 1,422,837 222,982 243,474 2,322,679Mountain Plains 201,425 640,013 103,635 118,605 1,063,678Western 549,722 1,783,436 282,838 331,863 2,947,859Total 2,585,378 8,479,572 1,330,204 1,497,262 13,892,417
Standard ErrorNortheast 13,839 25,550 7,120 6,071 30,527Mid-Atlantic 13,800 25,648 7,100 5,689 30,513Southeast 21,911 39,840 11,274 9,093 47,719Midwest 18,606 33,010 9,573 7,780 39,850Southwest 21,627 39,069 11,127 8,917 46,877Mountain Plains 13,002 23,359 6,689 5,562 28,113Western 24,966 44,580 12,845 10,671 53,754Total 116,343 208,554 59,860 48,265 264,397
Coefficient of VarianceNortheast 6.4% 3.5% 6.4% 4.6% 2.6%Mid-Atlantic 5.9% 3.2% 5.9% 4.4% 2.4%Southeast 4.0% 2.2% 4.0% 2.9% 1.6%Midwest 4.6% 2.6% 4.6% 3.4% 1.9%Southwest 5.0% 2.7% 5.0% 3.7% 2.0%Mountain Plains 6.5% 3.6% 6.5% 4.7% 2.6%Western 4.5% 2.5% 4.5% 3.2% 1.8%Total 4.5% 2.5% 4.5% 3.2% 1.9%
Source: 2009 CPS-ASEC, 2008 ACS, 2008 PRCS, Census International Data Base
Notes:a
Table C.6-2008: WIC Eligibles Standard Errors by FNS Region and Participant Group, CY 2008a
Estimates for the territories, including Puerto Rico, are not included in regional totals or standard errors.
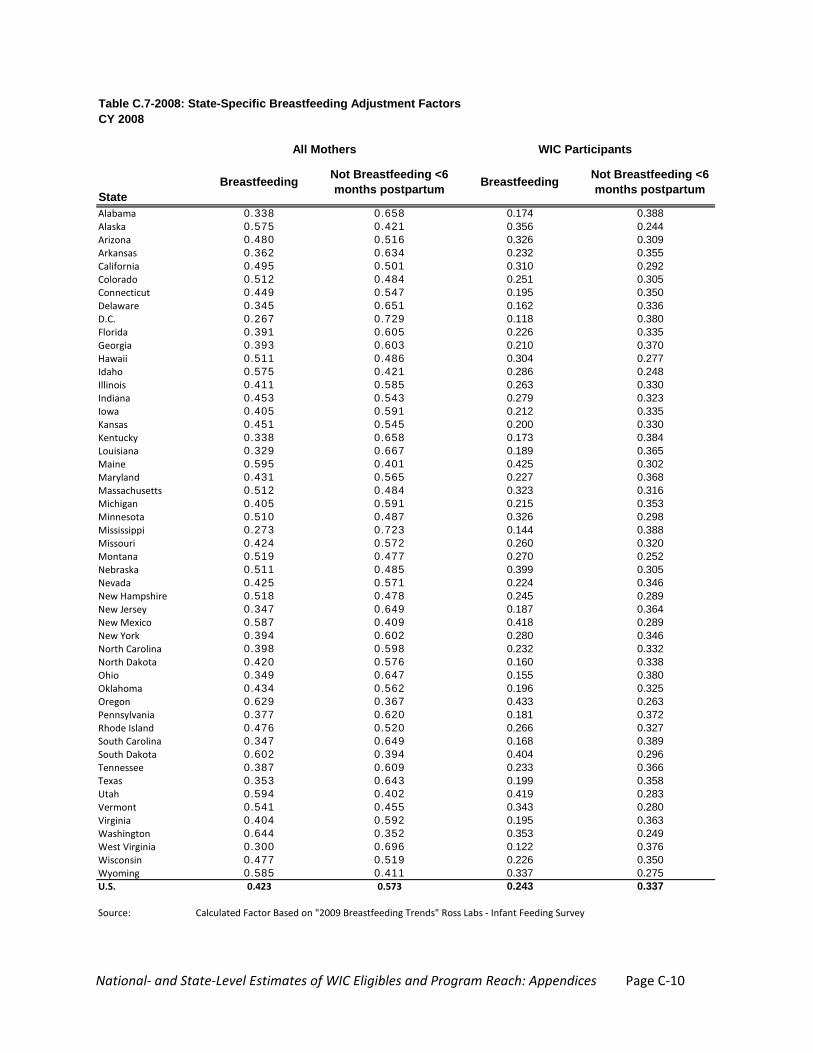
National‐ and State‐Level Estimates of WIC Eligibles and Program Reach: Appendices Page C‐10
Table C.7-2008: State-Specific Breastfeeding Adjustment FactorsCY 2008
StateBreastfeeding Not Breastfeeding <6
months postpartum Breastfeeding Not Breastfeeding <6 months postpartum
Alabama 0.338 0.658 0.174 0.388Alaska 0.575 0.421 0.356 0.244Arizona 0.480 0.516 0.326 0.309Arkansas 0.362 0.634 0.232 0.355California 0.495 0.501 0.310 0.292Colorado 0.512 0.484 0.251 0.305Connecticut 0.449 0.547 0.195 0.350Delaware 0.345 0.651 0.162 0.336D.C. 0.267 0.729 0.118 0.380Florida 0.391 0.605 0.226 0.335Georgia 0.393 0.603 0.210 0.370Hawaii 0.511 0.486 0.304 0.277Idaho 0.575 0.421 0.286 0.248Illinois 0.411 0.585 0.263 0.330Indiana 0.453 0.543 0.279 0.323Iowa 0.405 0.591 0.212 0.335Kansas 0.451 0.545 0.200 0.330Kentucky 0.338 0.658 0.173 0.384Louisiana 0.329 0.667 0.189 0.365Maine 0.595 0.401 0.425 0.302Maryland 0.431 0.565 0.227 0.368Massachusetts 0.512 0.484 0.323 0.316Michigan 0.405 0.591 0.215 0.353Minnesota 0.510 0.487 0.326 0.298Mississippi 0.273 0.723 0.144 0.388Missouri 0.424 0.572 0.260 0.320Montana 0.519 0.477 0.270 0.252Nebraska 0.511 0.485 0.399 0.305Nevada 0.425 0.571 0.224 0.346New Hampshire 0.518 0.478 0.245 0.289New Jersey 0.347 0.649 0.187 0.364New Mexico 0.587 0.409 0.418 0.289New York 0.394 0.602 0.280 0.346North Carolina 0.398 0.598 0.232 0.332North Dakota 0.420 0.576 0.160 0.338Ohio 0.349 0.647 0.155 0.380Oklahoma 0.434 0.562 0.196 0.325Oregon 0.629 0.367 0.433 0.263Pennsylvania 0.377 0.620 0.181 0.372Rhode Island 0.476 0.520 0.266 0.327South Carolina 0.347 0.649 0.168 0.389South Dakota 0.602 0.394 0.404 0.296Tennessee 0.387 0.609 0.233 0.366Texas 0.353 0.643 0.199 0.358Utah 0.594 0.402 0.419 0.283Vermont 0.541 0.455 0.343 0.280Virginia 0.404 0.592 0.195 0.363Washington 0.644 0.352 0.353 0.249West Virginia 0.300 0.696 0.122 0.376Wisconsin 0.477 0.519 0.226 0.350Wyoming 0.585 0.411 0.337 0.275U.S. 0.423 0.573 0.243 0.337
Source: Calculated Factor Based on "2009 Breastfeeding Trends" Ross Labs ‐ Infant Feeding Survey
All Mothers WIC Participants
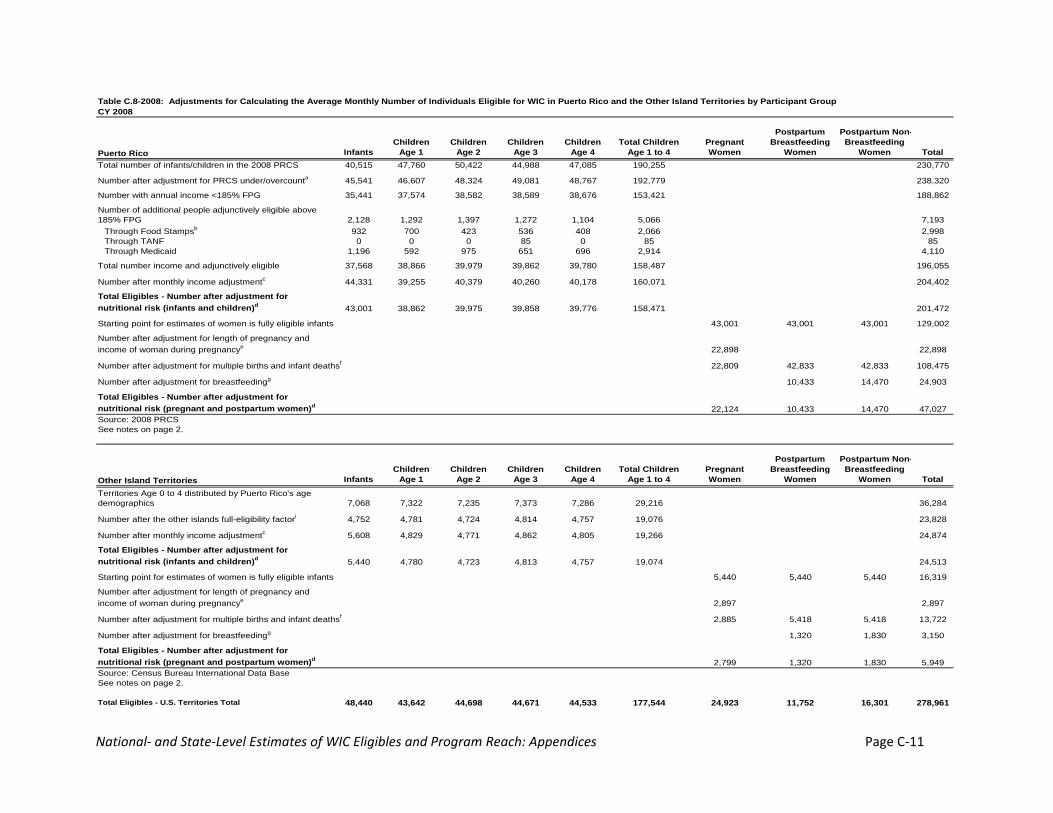
National‐ and State‐Level Estimates of WIC Eligibles and Program Reach: Appendices Page C‐11
Table C.8-2008: Adjustments for Calculating the Average Monthly Number of Individuals Eligible for WIC in Puerto Rico and the Other Island Territories by Participant GroupCY 2008
Puerto Rico InfantsChildren
Age 1Children
Age 2Children
Age 3Children
Age 4Total Children
Age 1 to 4Pregnant Women
Postpartum Breastfeeding
Women
Postpartum Non-Breastfeeding
Women TotalTotal number of infants/children in the 2008 PRCS 40,515 47,760 50,422 44,988 47,085 190,255 230,770
Number after adjustment for PRCS under/overcounta 45,541 46,607 48,324 49,081 48,767 192,779 238,320
Number with annual income <185% FPG 35,441 37,574 38,582 38,589 38,676 153,421 188,862
Number of additional people adjunctively eligible above 185% FPG 2,128 1,292 1,397 1,272 1,104 5,066 7,193
Through Food Stampsb 932 700 423 536 408 2,066 2,998Through TANF 0 0 0 85 0 85 85Through Medicaid 1,196 592 975 651 696 2,914 4,110
Total number income and adjunctively eligible 37,568 38,866 39,979 39,862 39,780 158,487 196,055
Number after monthly income adjustmentc 44,331 39,255 40,379 40,260 40,178 160,071 204,402
Total Eligibles - Number after adjustment for nutritional risk (infants and children)d 43,001 38,862 39,975 39,858 39,776 158,471 201,472
Starting point for estimates of women is fully eligible infants 43,001 43,001 43,001 129,002
Number after adjustment for length of pregnancy and income of woman during pregnancye 22,898 22,898
Number after adjustment for multiple births and infant deathsf 22,809 42,833 42,833 108,475
Number after adjustment for breastfeedingg 10,433 14,470 24,903
Total Eligibles - Number after adjustment for nutritional risk (pregnant and postpartum women)d 22,124 10,433 14,470 47,027Source: 2008 PRCSSee notes on page 2.
Other Island Territories InfantsChildren
Age 1Children
Age 2Children
Age 3Children
Age 4Total Children
Age 1 to 4Pregnant Women
Postpartum Breastfeeding
Women
Postpartum Non-Breastfeeding
Women Total
Territories Age 0 to 4 distributed by Puerto Rico's age demographics 7,068 7,322 7,235 7,373 7,286 29,216 36,284
Number after the other islands full-eligibility factori 4,752 4,781 4,724 4,814 4,757 19,076 23,828
Number after monthly income adjustmentc 5,608 4,829 4,771 4,862 4,805 19,266 24,874
Total Eligibles - Number after adjustment for nutritional risk (infants and children)d 5,440 4,780 4,723 4,813 4,757 19,074 24,513
Starting point for estimates of women is fully eligible infants 5,440 5,440 5,440 16,319
Number after adjustment for length of pregnancy and income of woman during pregnancye 2,897 2,897
Number after adjustment for multiple births and infant deathsf 2,885 5,418 5,418 13,722
Number after adjustment for breastfeedingg 1,320 1,830 3,150
Total Eligibles - Number after adjustment for nutritional risk (pregnant and postpartum women)d 2,799 1,320 1,830 5,949Source: Census Bureau International Data BaseSee notes on page 2.
Total Eligibles - U.S. Territories Total 48,440 43,642 44,698 44,671 44,533 177,544 24,923 11,752 16,301 278,961
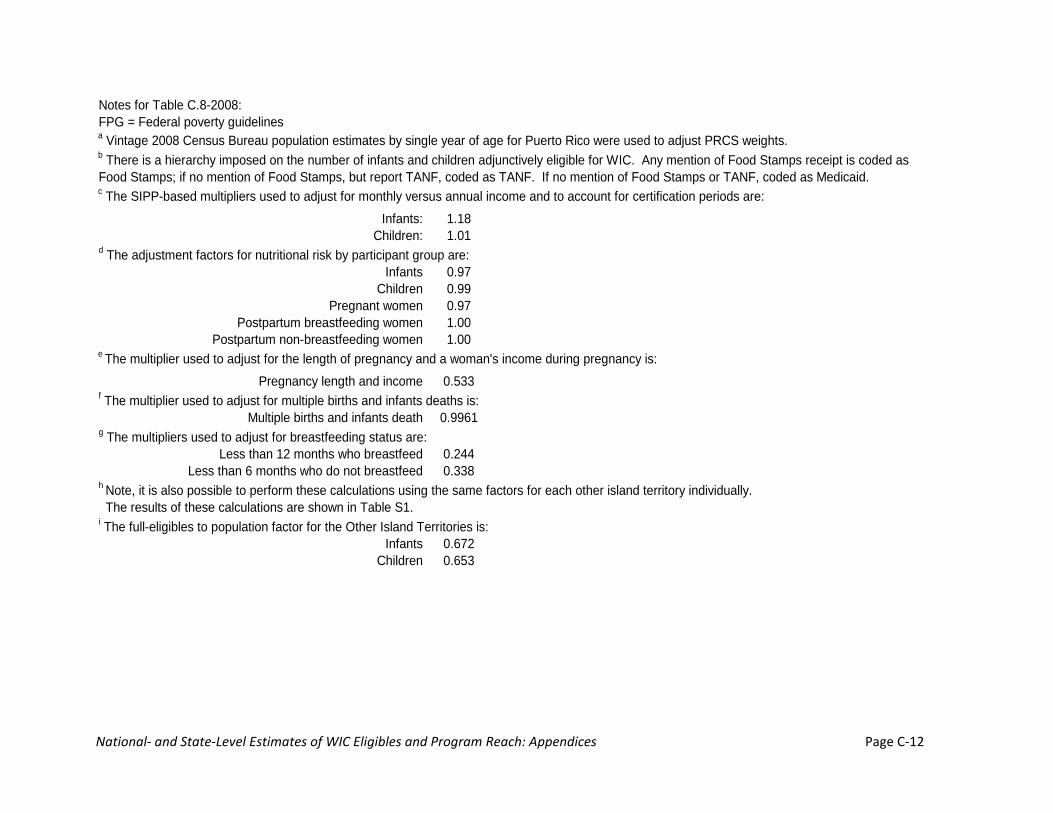
National‐ and State‐Level Estimates of WIC Eligibles and Program Reach: Appendices Page C‐12
Notes for Table C.8-2008:FPG = Federal poverty guidelines
b There is a hierarchy imposed on the number of infants and children adjunctively eligible for WIC. Any mention of Food Stamps receipt is coded as Food Stamps; if no mention of Food Stamps, but report TANF, coded as TANF. If no mention of Food Stamps or TANF, coded as Medicaid.c The SIPP-based multipliers used to adjust for monthly versus annual income and to account for certification periods are:
Infants: 1.18Children: 1.01
d The adjustment factors for nutritional risk by participant group are:Infants 0.97
Children 0.99Pregnant women 0.97
Postpartum breastfeeding women 1.00Postpartum non-breastfeeding women 1.00
e The multiplier used to adjust for the length of pregnancy and a woman's income during pregnancy is:Pregnancy length and income 0.533
f The multiplier used to adjust for multiple births and infants deaths is:Multiple births and infants death 0.9961
g The multipliers used to adjust for breastfeeding status are:Less than 12 months who breastfeed 0.244
Less than 6 months who do not breastfeed 0.338h Note, it is also possible to perform these calculations using the same factors for each other island territory individually. The results of these calculations are shown in Table S1.i The full-eligibles to population factor for the Other Island Territories is:
Infants 0.672Children 0.653
a Vintage 2008 Census Bureau population estimates by single year of age for Puerto Rico were used to adjust PRCS weights.

National‐ and State‐Level Estimates of WIC Eligibles and Program Reach: Appendices Page C‐13
Table C.9-2008: FNS Region Estimates of the Average Monthly Number of Infants and Children Eligible for WIC in the CPS-ASEC by Demographic Characteristics
CY 2008Fully adjusted weightsa
FNS Region
Demographic CharacteristicsWIC-Eligible
Infants
WIC-Eligible Children Age 1
to 4
WIC-Eligible Infants and
ChildrenWIC-Eligible
Infants
WIC-Eligible Children Age 1
to 4
WIC-Eligible Infants and
ChildrenWIC-Eligible
Infants
WIC-Eligible Children Age 1
to 4
WIC-Eligible Infants and
ChildrenWIC-Eligible
Infants
WIC-Eligible Children Age 1
to 4
WIC-Eligible Infants and
ChildrenTotal 216,092 730,540 946,632 233,820 805,444 1,039,264 547,598 1,816,805 2,364,403 403,335 1,280,498 1,683,833
GenderMale 53.4 45.6 47.2 51.6 48.9 49.5 55.1 51.8 52.6 52.0 52.7 52.6Female 46.6 54.4 52.8 48.4 51.1 50.5 44.9 48.2 47.4 48.0 47.3 47.4
Race/ethnicityWhite, non-Hispanic 37.5 39.6 39.1 43.9 44.8 44.6 39.8 39.1 39.2 51.3 49.7 50.1Black, non-Hispanic 18.0 18.4 18.3 29.9 32.7 32.1 40.5 36.7 37.6 25.9 30.5 29.4Other, non-Hispanic 10.4 5.3 6.4 0.0 2.9 2.2 1.4 3.4 3.0 4.1 3.3 3.4Hispanic 34.1 36.7 36.2 26.3 19.6 21.1 18.4 20.8 20.2 18.7 16.5 17.0
Living arrangementTwo-parent family 62.9 52.2 54.4 61.2 51.3 53.5 46.8 44.6 45.1 59.7 56.1 57.0Single-parent family 33.0 41.6 39.8 30.5 42.6 39.9 49.3 48.5 48.7 36.3 39.4 38.7No-parent family 4.1 6.2 5.8 8.3 6.1 6.6 3.9 6.9 6.2 4.0 4.5 4.3
Related non-parent caretaker 2.9 4.3 4.0 4.4 5.3 5.1 3.4 5.3 4.8 3.4 3.6 3.5Unrelated non-parent caretaker 1.2 2.0 1.8 3.9 0.8 1.5 0.5 1.6 1.4 0.6 0.9 0.8
Household size (number of persons)2 5.6 8.9 8.2 0.9 6.6 5.3 4.2 5.4 5.1 6.8 5.8 6.03 29.9 21.4 23.2 32.1 21.3 23.7 25.1 23.3 23.7 29.3 22.6 24.24 28.6 28.4 28.5 18.0 27.2 25.1 34.7 29.6 30.8 24.2 26.8 26.25 20.0 22.3 21.8 19.9 22.5 21.9 18.6 21.7 21.0 17.2 23.9 22.36 or more 15.9 19.0 18.3 29.1 22.4 23.9 17.5 20.0 19.4 22.5 20.9 21.3
% with working parent(s) 60.0 64.9 63.9 52.3 63.5 61.0 57.0 63.6 62.1 64.9 65.0 65.0
Annual family income relative to povertyb
Less than 50% FPL 34.1 23.0 25.3 27.6 23.7 24.6 31.2 23.3 25.1 20.4 23.7 22.950% to <100% FPL 13.8 21.4 19.8 16.0 16.5 16.4 19.1 26.3 24.7 20.5 23.6 22.9100% to <130% FPL 9.6 13.8 12.9 8.7 15.1 13.7 9.9 14.3 13.3 19.2 11.7 13.5130% to <185% FPLc 18.4 18.6 18.5 26.2 23.5 24.1 18.2 21.2 20.5 14.8 24.3 22.1185% to <200% FPL 0.4 2.2 1.8 0.0 3.5 2.7 3.6 2.6 2.9 1.6 2.1 2.0200% to <250% FPL 4.7 6.1 5.8 6.4 6.9 6.8 6.3 5.2 5.4 5.6 4.9 5.1250% FPL and above 19.2 14.9 15.8 15.1 10.7 11.7 11.7 7.1 8.2 17.8 9.7 11.7
Benefit receiptNo benefit receipt 13.4 14.8 14.5 22.0 24.5 24.0 15.0 23.5 21.5 15.0 21.2 19.7FSP, TANF, & Medicaid 5.5 8.1 7.6 4.7 8.2 7.4 5.9 5.2 5.4 12.3 6.5 7.9FSP & TANF 0.0 0.0 0.0 0.0 0.0 0.0 0.0 0.0 0.0 0.0 0.0 0.0FSP & Medicaid 27.9 29.1 28.8 0.0 0.2 0.1 32.5 31.6 31.8 0.0 0.3 0.2TANF & Medicaid 0.0 0.4 0.3 29.9 21.9 23.7 0.5 1.1 1.0 29.1 33.0 32.1FSP only 2.7 2.8 2.8 0.6 2.6 2.2 4.7 6.4 6.0 1.3 0.8 0.9TANF only 0.0 0.0 0.0 0.0 0.0 0.0 0.0 0.0 0.0 0.0 0.0 0.0Medicaid only 50.5 44.8 46.0 6.7 4.6 5.1 41.3 32.2 34.3 3.5 4.6 4.3
Source: 2009 CPS-ASEC, 2008 ACS
Northeast Mid-Atlantic Southeast Midwest
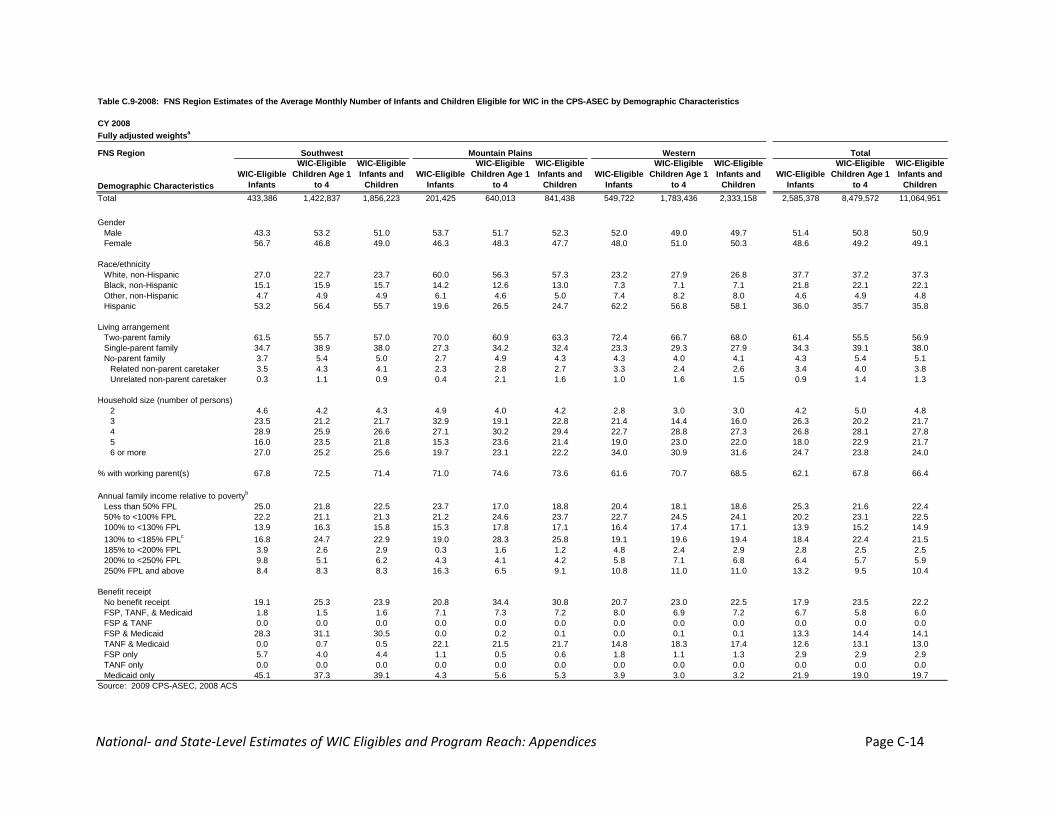
National‐ and State‐Level Estimates of WIC Eligibles and Program Reach: Appendices Page C‐14
Table C.9-2008: FNS Region Estimates of the Average Monthly Number of Infants and Children Eligible for WIC in the CPS-ASEC by Demographic Characteristics
CY 2008Fully adjusted weightsa
FNS Region
Demographic CharacteristicsWIC-Eligible
Infants
WIC-Eligible Children Age 1
to 4
WIC-Eligible Infants and
ChildrenWIC-Eligible
Infants
WIC-Eligible Children Age 1
to 4
WIC-Eligible Infants and
ChildrenWIC-Eligible
Infants
WIC-Eligible Children Age 1
to 4
WIC-Eligible Infants and
ChildrenWIC-Eligible
Infants
WIC-Eligible Children Age 1
to 4
WIC-Eligible Infants and
ChildrenTotal 433,386 1,422,837 1,856,223 201,425 640,013 841,438 549,722 1,783,436 2,333,158 2,585,378 8,479,572 11,064,951
GenderMale 43.3 53.2 51.0 53.7 51.7 52.3 52.0 49.0 49.7 51.4 50.8 50.9Female 56.7 46.8 49.0 46.3 48.3 47.7 48.0 51.0 50.3 48.6 49.2 49.1
Race/ethnicityWhite, non-Hispanic 27.0 22.7 23.7 60.0 56.3 57.3 23.2 27.9 26.8 37.7 37.2 37.3Black, non-Hispanic 15.1 15.9 15.7 14.2 12.6 13.0 7.3 7.1 7.1 21.8 22.1 22.1Other, non-Hispanic 4.7 4.9 4.9 6.1 4.6 5.0 7.4 8.2 8.0 4.6 4.9 4.8Hispanic 53.2 56.4 55.7 19.6 26.5 24.7 62.2 56.8 58.1 36.0 35.7 35.8
Living arrangementTwo-parent family 61.5 55.7 57.0 70.0 60.9 63.3 72.4 66.7 68.0 61.4 55.5 56.9Single-parent family 34.7 38.9 38.0 27.3 34.2 32.4 23.3 29.3 27.9 34.3 39.1 38.0No-parent family 3.7 5.4 5.0 2.7 4.9 4.3 4.3 4.0 4.1 4.3 5.4 5.1
Related non-parent caretaker 3.5 4.3 4.1 2.3 2.8 2.7 3.3 2.4 2.6 3.4 4.0 3.8Unrelated non-parent caretaker 0.3 1.1 0.9 0.4 2.1 1.6 1.0 1.6 1.5 0.9 1.4 1.3
Household size (number of persons)2 4.6 4.2 4.3 4.9 4.0 4.2 2.8 3.0 3.0 4.2 5.0 4.83 23.5 21.2 21.7 32.9 19.1 22.8 21.4 14.4 16.0 26.3 20.2 21.74 28.9 25.9 26.6 27.1 30.2 29.4 22.7 28.8 27.3 26.8 28.1 27.85 16.0 23.5 21.8 15.3 23.6 21.4 19.0 23.0 22.0 18.0 22.9 21.76 or more 27.0 25.2 25.6 19.7 23.1 22.2 34.0 30.9 31.6 24.7 23.8 24.0
% with working parent(s) 67.8 72.5 71.4 71.0 74.6 73.6 61.6 70.7 68.5 62.1 67.8 66.4
Annual family income relative to povertyb
Less than 50% FPL 25.0 21.8 22.5 23.7 17.0 18.8 20.4 18.1 18.6 25.3 21.6 22.450% to <100% FPL 22.2 21.1 21.3 21.2 24.6 23.7 22.7 24.5 24.1 20.2 23.1 22.5100% to <130% FPL 13.9 16.3 15.8 15.3 17.8 17.1 16.4 17.4 17.1 13.9 15.2 14.9130% to <185% FPLc 16.8 24.7 22.9 19.0 28.3 25.8 19.1 19.6 19.4 18.4 22.4 21.5185% to <200% FPL 3.9 2.6 2.9 0.3 1.6 1.2 4.8 2.4 2.9 2.8 2.5 2.5200% to <250% FPL 9.8 5.1 6.2 4.3 4.1 4.2 5.8 7.1 6.8 6.4 5.7 5.9250% FPL and above 8.4 8.3 8.3 16.3 6.5 9.1 10.8 11.0 11.0 13.2 9.5 10.4
Benefit receiptNo benefit receipt 19.1 25.3 23.9 20.8 34.4 30.8 20.7 23.0 22.5 17.9 23.5 22.2FSP, TANF, & Medicaid 1.8 1.5 1.6 7.1 7.3 7.2 8.0 6.9 7.2 6.7 5.8 6.0FSP & TANF 0.0 0.0 0.0 0.0 0.0 0.0 0.0 0.0 0.0 0.0 0.0 0.0FSP & Medicaid 28.3 31.1 30.5 0.0 0.2 0.1 0.0 0.1 0.1 13.3 14.4 14.1TANF & Medicaid 0.0 0.7 0.5 22.1 21.5 21.7 14.8 18.3 17.4 12.6 13.1 13.0FSP only 5.7 4.0 4.4 1.1 0.5 0.6 1.8 1.1 1.3 2.9 2.9 2.9TANF only 0.0 0.0 0.0 0.0 0.0 0.0 0.0 0.0 0.0 0.0 0.0 0.0Medicaid only 45.1 37.3 39.1 4.3 5.6 5.3 3.9 3.0 3.2 21.9 19.0 19.7
Source: 2009 CPS-ASEC, 2008 ACS
Southwest Mountain Plains Western Total
National‐ and State‐Level Estimates of WIC Eligibles and Program Reach: Appendices Page C‐15
Notes for Table C.9-2008:FPG - Federal Poverty GuidelinesFPL - Federal Poverty Level
c There are infants and children adjunctively eligible for WIC with annual family incomes above 185 percent of the Federal Poverty Guidelines (FPG) who have annual family incomes below 185% of the Federal Poverty Level (FPL).
a These estimates are tabulated from the fully adjusted person weights on the March 2009 CPS. They are adjusted to account for the under or over count of infants and children in the CPS relative to Census estimates, monthly income, or nutritional risk.b This table uses both the Federal Poverty Guidelines (FPG) and the Federal Poverty Thresholds or "Levels" (FPL). The thresholds are used to calculate the ratio of annual family income to the poverty threshold for their family size. The guidelines are used in determining WIC eligibility.
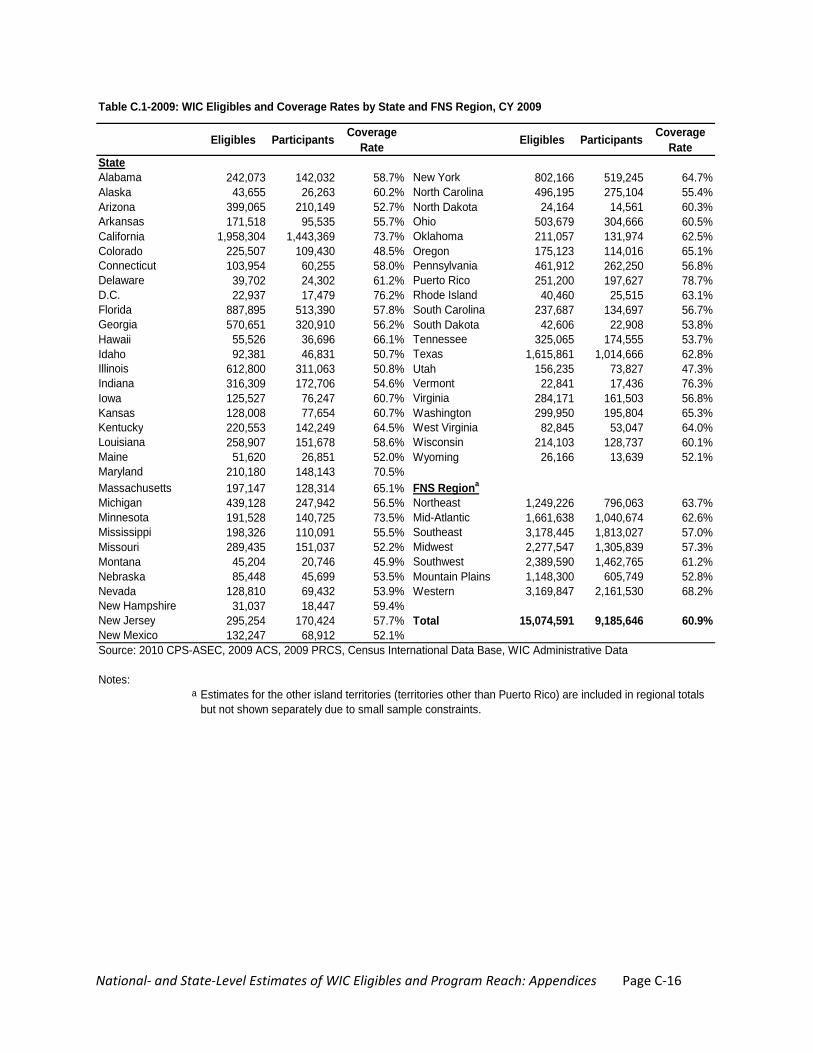
National‐ and State‐Level Estimates of WIC Eligibles and Program Reach: Appendices Page C‐16
Eligibles Participants Coverage Rate Eligibles Participants Coverage
RateStateAlabama 242,073 142,032 58.7% New York 802,166 519,245 64.7%Alaska 43,655 26,263 60.2% North Carolina 496,195 275,104 55.4%Arizona 399,065 210,149 52.7% North Dakota 24,164 14,561 60.3%Arkansas 171,518 95,535 55.7% Ohio 503,679 304,666 60.5%California 1,958,304 1,443,369 73.7% Oklahoma 211,057 131,974 62.5%Colorado 225,507 109,430 48.5% Oregon 175,123 114,016 65.1%Connecticut 103,954 60,255 58.0% Pennsylvania 461,912 262,250 56.8%Delaware 39,702 24,302 61.2% Puerto Rico 251,200 197,627 78.7%D.C. 22,937 17,479 76.2% Rhode Island 40,460 25,515 63.1%Florida 887,895 513,390 57.8% South Carolina 237,687 134,697 56.7%Georgia 570,651 320,910 56.2% South Dakota 42,606 22,908 53.8%Hawaii 55,526 36,696 66.1% Tennessee 325,065 174,555 53.7%Idaho 92,381 46,831 50.7% Texas 1,615,861 1,014,666 62.8%Illinois 612,800 311,063 50.8% Utah 156,235 73,827 47.3%Indiana 316,309 172,706 54.6% Vermont 22,841 17,436 76.3%Iowa 125,527 76,247 60.7% Virginia 284,171 161,503 56.8%Kansas 128,008 77,654 60.7% Washington 299,950 195,804 65.3%Kentucky 220,553 142,249 64.5% West Virginia 82,845 53,047 64.0%Louisiana 258,907 151,678 58.6% Wisconsin 214,103 128,737 60.1%Maine 51,620 26,851 52.0% Wyoming 26,166 13,639 52.1%Maryland 210,180 148,143 70.5%Massachusetts 197,147 128,314 65.1% FNS Regiona
Michigan 439,128 247,942 56.5% Northeast 1,249,226 796,063 63.7%Minnesota 191,528 140,725 73.5% Mid-Atlantic 1,661,638 1,040,674 62.6%Mississippi 198,326 110,091 55.5% Southeast 3,178,445 1,813,027 57.0%Missouri 289,435 151,037 52.2% Midwest 2,277,547 1,305,839 57.3%Montana 45,204 20,746 45.9% Southwest 2,389,590 1,462,765 61.2%Nebraska 85,448 45,699 53.5% Mountain Plains 1,148,300 605,749 52.8%Nevada 128,810 69,432 53.9% Western 3,169,847 2,161,530 68.2%New Hampshire 31,037 18,447 59.4%New Jersey 295,254 170,424 57.7% Total 15,074,591 9,185,646 60.9%New Mexico 132,247 68,912 52.1%Source: 2010 CPS-ASEC, 2009 ACS, 2009 PRCS, Census International Data Base, WIC Administrative Data
Notes:a
Table C.1-2009: WIC Eligibles and Coverage Rates by State and FNS Region, CY 2009
Estimates for the other island territories (territories other than Puerto Rico) are included in regional totals but not shown separately due to small sample constraints.

National‐ and State‐Level Estimates of WIC Eligibles and Program Reach: Appendices Page C‐17
Eligibles Participants Coverage Rate Eligibles Participants Coverage
RateNortheast 1,249,226 796,063 63.7% Southwest 2,389,590 1,462,765 61.2%
Connecticut 103,954 60,255 58.0% Arkansas 171,518 95,535 55.7%Maine 51,620 26,851 52.0% Louisiana 258,907 151,678 58.6%Massachusetts 197,147 128,314 65.1% New Mexico 132,247 68,912 52.1%New Hampshire 31,037 18,447 59.4% Oklahoma 211,057 131,974 62.5%New York 802,166 519,245 64.7% Texas 1,615,861 1,014,666 62.8%Rhode Island 40,460 25,515 63.1%Vermont 22,841 17,436 76.3% Mountain Plains 1,148,300 605,749 52.8%
Colorado 225,507 109,430 48.5%Mid-Atlantic 1,661,638 1,040,674 62.6% Iowa 125,527 76,247 60.7%
Delaware 39,702 24,302 61.2% Kansas 128,008 77,654 60.7%D.C. 22,937 17,479 76.2% Missouri 289,435 151,037 52.2%Maryland 210,180 148,143 70.5% Montana 45,204 20,746 45.9%New Jersey 295,254 170,424 57.7% Nebraska 85,448 45,699 53.5%Pennsylvania 461,912 262,250 56.8% North Dakota 24,164 14,561 60.3%Puerto Rico 251,200 197,627 78.7% South Dakota 42,606 22,908 53.8%Virginia 284,171 161,503 56.8% Utah 156,235 73,827 47.3%West Virginia 82,845 53,047 64.0% Wyoming 26,166 13,639 52.1%
Southeast 3,178,445 1,813,027 57.0% Western 3,169,847 2,161,530 68.2%Alabama 242,073 142,032 58.7% Alaska 43,655 26,263 60.2%Florida 887,895 513,390 57.8% Arizona 399,065 210,149 52.7%Georgia 570,651 320,910 56.2% California 1,958,304 1,443,369 73.7%Kentucky 220,553 142,249 64.5% Hawaii 55,526 36,696 66.1%Mississippi 198,326 110,091 55.5% Idaho 92,381 46,831 50.7%North Carolina 496,195 275,104 55.4% Nevada 128,810 69,432 53.9%South Carolina 237,687 134,697 56.7% Oregon 175,123 114,016 65.1%Tennessee 325,065 174,555 53.7% Washington 299,950 195,804 65.3%
Midwest 2,277,547 1,305,839 57.3% Total 15,074,591 9,185,646 60.9%Illinois 612,800 311,063 50.8%Indiana 316,309 172,706 54.6%Michigan 439,128 247,942 56.5%Minnesota 191,528 140,725 73.5%Ohio 503,679 304,666 60.5%Wisconsin 214,103 128,737 60.1%
Source: 2010 CPS-ASEC, 2009 ACS, 2009 PRCS, Census International Data Base, WIC Administrative Data
Notes:a
Table C.2-2009: WIC Eligibles and Coverage Rates by FNS Region and State, CY 2009a
Estimates for the other island territories (territories other than Puerto Rico) are included in regional totals but not shown separately due to small sample constraints.
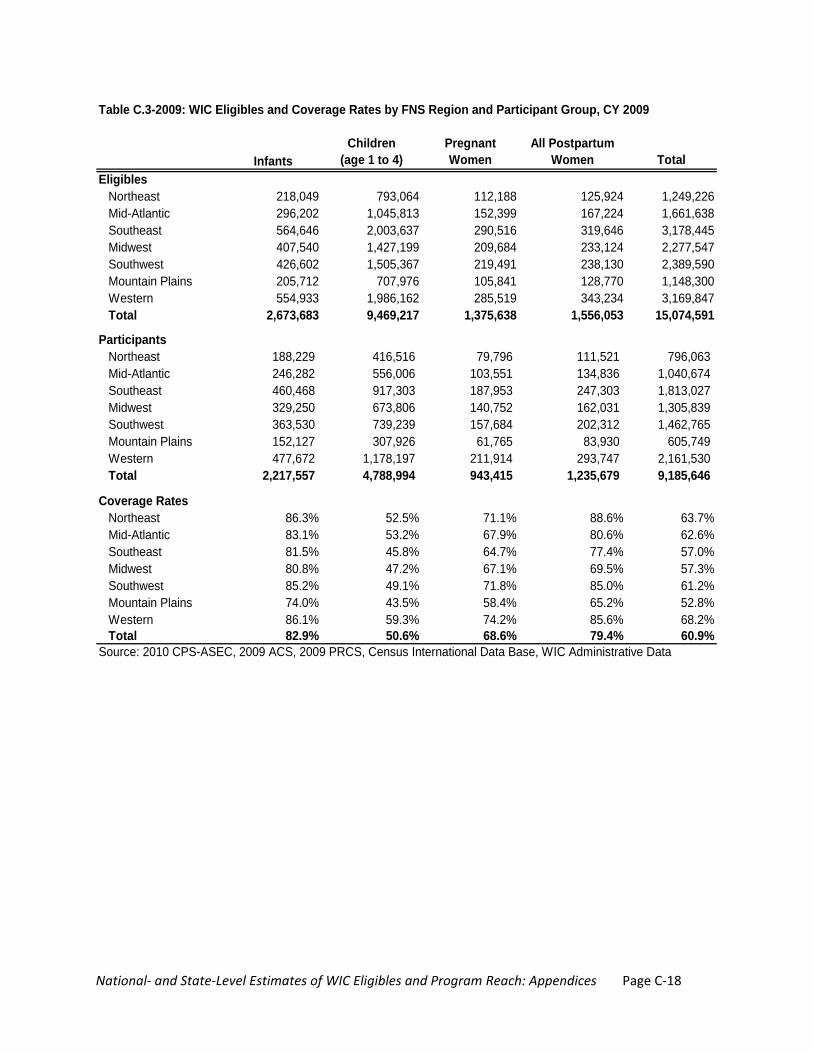
National‐ and State‐Level Estimates of WIC Eligibles and Program Reach: Appendices Page C‐18
InfantsChildren
(age 1 to 4)Pregnant Women
All Postpartum Women Total
EligiblesNortheast 218,049 793,064 112,188 125,924 1,249,226Mid-Atlantic 296,202 1,045,813 152,399 167,224 1,661,638Southeast 564,646 2,003,637 290,516 319,646 3,178,445Midwest 407,540 1,427,199 209,684 233,124 2,277,547Southwest 426,602 1,505,367 219,491 238,130 2,389,590Mountain Plains 205,712 707,976 105,841 128,770 1,148,300Western 554,933 1,986,162 285,519 343,234 3,169,847Total 2,673,683 9,469,217 1,375,638 1,556,053 15,074,591
ParticipantsNortheast 188,229 416,516 79,796 111,521 796,063Mid-Atlantic 246,282 556,006 103,551 134,836 1,040,674Southeast 460,468 917,303 187,953 247,303 1,813,027Midwest 329,250 673,806 140,752 162,031 1,305,839Southwest 363,530 739,239 157,684 202,312 1,462,765Mountain Plains 152,127 307,926 61,765 83,930 605,749Western 477,672 1,178,197 211,914 293,747 2,161,530Total 2,217,557 4,788,994 943,415 1,235,679 9,185,646
Coverage RatesNortheast 86.3% 52.5% 71.1% 88.6% 63.7%Mid-Atlantic 83.1% 53.2% 67.9% 80.6% 62.6%Southeast 81.5% 45.8% 64.7% 77.4% 57.0%Midwest 80.8% 47.2% 67.1% 69.5% 57.3%Southwest 85.2% 49.1% 71.8% 85.0% 61.2%Mountain Plains 74.0% 43.5% 58.4% 65.2% 52.8%Western 86.1% 59.3% 74.2% 85.6% 68.2%Total 82.9% 50.6% 68.6% 79.4% 60.9%
Source: 2010 CPS-ASEC, 2009 ACS, 2009 PRCS, Census International Data Base, WIC Administrative Data
Table C.3-2009: WIC Eligibles and Coverage Rates by FNS Region and Participant Group, CY 2009

National‐ and State‐Level Estimates of WIC Eligibles and Program Reach: Appendices Page C‐19
Eligibles Standard Error
Coefficient of Variance Eligibles Standard
ErrorCoefficient of Variance
StateAlabama 242,073 13,106 5.4% New York 802,166 26,145 3.3%Alaska 43,655 5,275 12.1% North Carolina 496,195 19,581 3.9%Arizona 399,065 17,241 4.3% North Dakota 24,164 3,953 16.4%Arkansas 171,518 10,848 6.3% Ohio 503,679 19,722 3.9%California 1,958,304 47,491 2.4% Oklahoma 211,057 12,066 5.7%Colorado 225,507 12,488 5.5% Oregon 175,123 10,931 6.2%Connecticut 103,954 8,336 8.0% Pennsylvania 461,912 18,826 4.1%Delaware 39,702 5,091 12.8% Puerto Ricoa 251,200 13,274 5.3%D.C. 22,937 3,899 17.0% Rhode Island 40,460 5,112 12.6%Florida 887,895 27,815 3.1% South Carolina 237,687 12,949 5.4%Georgia 570,651 21,265 3.7% South Dakota 42,606 5,210 12.2%Hawaii 55,526 6,021 10.8% Tennessee 325,065 15,374 4.7%Idaho 92,381 7,812 8.5% Texas 1,615,861 41,594 2.6%Illinois 612,800 22,086 3.6% Utah 156,235 10,264 6.6%Indiana 316,309 15,103 4.8% Vermont 22,841 3,838 16.8%Iowa 125,527 9,176 7.3% Virginia 284,171 14,196 5.0%Kansas 128,008 9,271 7.2% Washington 299,950 14,629 4.9%Kentucky 220,553 12,406 5.6% West Virginia 82,845 7,425 9.0%Louisiana 258,907 13,570 5.2% Wisconsin 214,103 12,154 5.7%Maine 51,620 5,795 11.2% Wyoming 26,166 4,113 15.7%Maryland 210,180 12,106 5.8%Massachusetts 197,147 11,678 5.9% Regiona
Michigan 439,128 18,292 4.2% Northeast 1,249,226 38,509 3.1%Minnesota 191,528 11,453 6.0% Mid-Atlantic 1,397,001 41,436 3.0%Mississippi 198,326 11,699 5.9% Southeast 3,178,445 74,251 2.3%Missouri 289,435 14,382 5.0% Midwest 2,277,547 58,037 2.5%Montana 45,204 5,406 12.0% Southwest 2,389,590 60,083 2.5%Nebraska 85,448 7,462 8.7% Mountain Plains 1,148,300 36,473 3.2%Nevada 128,810 9,307 7.2% Western 3,152,814 73,796 2.3%New Hampshire 31,037 4,533 14.6%New Jersey 295,254 14,524 4.9% 14,792,922 272,793 1.8%New Mexico 132,247 9,433 7.1%Source: 2010 CPS-ASEC, 2009 ACS, 2009 PRCS, Census International Data Base
Notes:a
Table C.4-2009: WIC Eligibles Standard Errors by State and FNS Region, CY 2009
Total (50 States and D.C.)a
Estimates for the territories, including Puerto Rico, are not included in regional totals or regional standard errors.
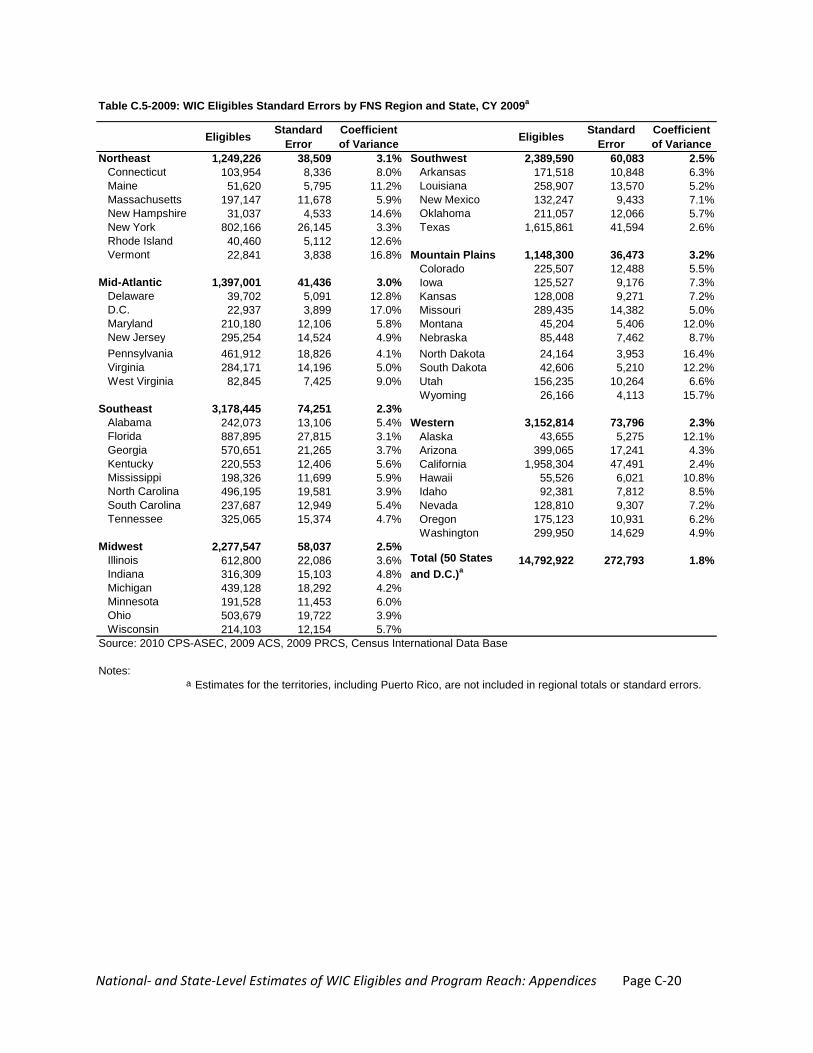
National‐ and State‐Level Estimates of WIC Eligibles and Program Reach: Appendices Page C‐20
Eligibles Standard Error
Coefficient of Variance Eligibles Standard
ErrorCoefficient of Variance
Northeast 1,249,226 38,509 3.1% Southwest 2,389,590 60,083 2.5%Connecticut 103,954 8,336 8.0% Arkansas 171,518 10,848 6.3%Maine 51,620 5,795 11.2% Louisiana 258,907 13,570 5.2%Massachusetts 197,147 11,678 5.9% New Mexico 132,247 9,433 7.1%New Hampshire 31,037 4,533 14.6% Oklahoma 211,057 12,066 5.7%New York 802,166 26,145 3.3% Texas 1,615,861 41,594 2.6%Rhode Island 40,460 5,112 12.6%Vermont 22,841 3,838 16.8% Mountain Plains 1,148,300 36,473 3.2%
Colorado 225,507 12,488 5.5%Mid-Atlantic 1,397,001 41,436 3.0% Iowa 125,527 9,176 7.3%
Delaware 39,702 5,091 12.8% Kansas 128,008 9,271 7.2%D.C. 22,937 3,899 17.0% Missouri 289,435 14,382 5.0%Maryland 210,180 12,106 5.8% Montana 45,204 5,406 12.0%New Jersey 295,254 14,524 4.9% Nebraska 85,448 7,462 8.7%Pennsylvania 461,912 18,826 4.1% North Dakota 24,164 3,953 16.4%Virginia 284,171 14,196 5.0% South Dakota 42,606 5,210 12.2%West Virginia 82,845 7,425 9.0% Utah 156,235 10,264 6.6%
Wyoming 26,166 4,113 15.7%Southeast 3,178,445 74,251 2.3%
Alabama 242,073 13,106 5.4% Western 3,152,814 73,796 2.3%Florida 887,895 27,815 3.1% Alaska 43,655 5,275 12.1%Georgia 570,651 21,265 3.7% Arizona 399,065 17,241 4.3%Kentucky 220,553 12,406 5.6% California 1,958,304 47,491 2.4%Mississippi 198,326 11,699 5.9% Hawaii 55,526 6,021 10.8%North Carolina 496,195 19,581 3.9% Idaho 92,381 7,812 8.5%South Carolina 237,687 12,949 5.4% Nevada 128,810 9,307 7.2%Tennessee 325,065 15,374 4.7% Oregon 175,123 10,931 6.2%
Washington 299,950 14,629 4.9%Midwest 2,277,547 58,037 2.5%
Illinois 612,800 22,086 3.6% 14,792,922 272,793 1.8%Indiana 316,309 15,103 4.8%Michigan 439,128 18,292 4.2%Minnesota 191,528 11,453 6.0%Ohio 503,679 19,722 3.9%Wisconsin 214,103 12,154 5.7%
Source: 2010 CPS-ASEC, 2009 ACS, 2009 PRCS, Census International Data Base
Notes:a
Table C.5-2009: WIC Eligibles Standard Errors by FNS Region and State, CY 2009a
Total (50 States and D.C.)a
Estimates for the territories, including Puerto Rico, are not included in regional totals or standard errors.
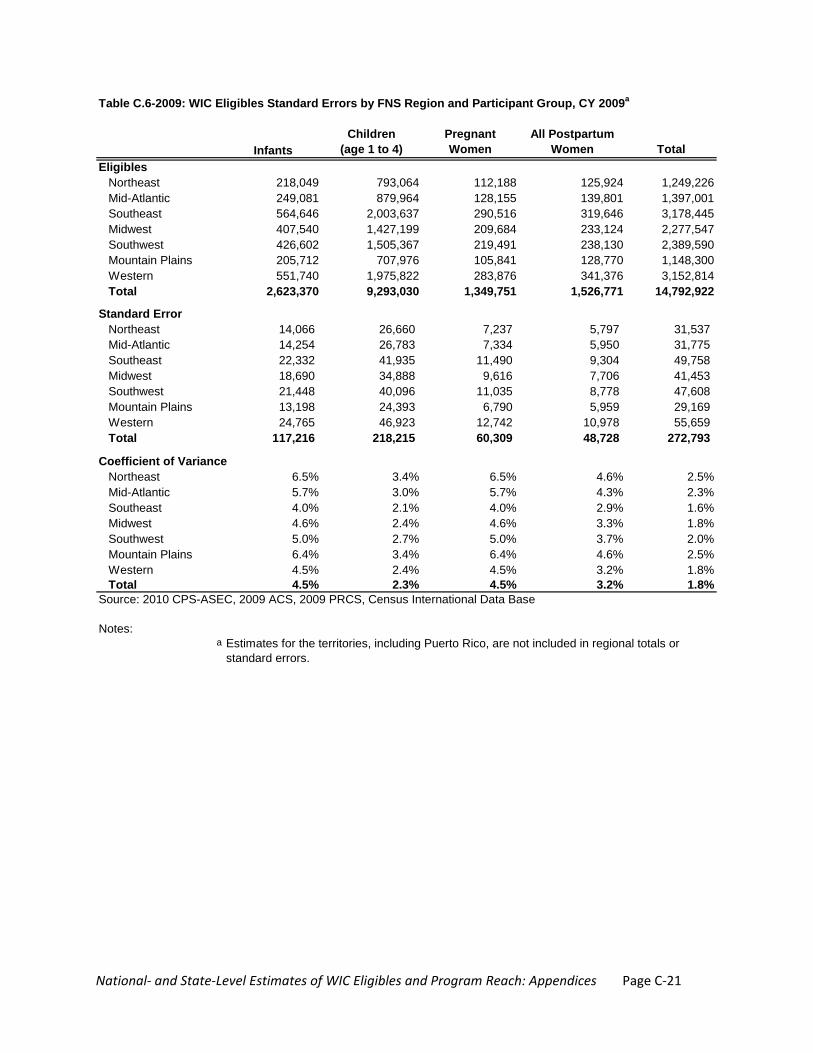
National‐ and State‐Level Estimates of WIC Eligibles and Program Reach: Appendices Page C‐21
InfantsChildren
(age 1 to 4)Pregnant Women
All Postpartum Women Total
EligiblesNortheast 218,049 793,064 112,188 125,924 1,249,226Mid-Atlantic 249,081 879,964 128,155 139,801 1,397,001Southeast 564,646 2,003,637 290,516 319,646 3,178,445Midwest 407,540 1,427,199 209,684 233,124 2,277,547Southwest 426,602 1,505,367 219,491 238,130 2,389,590Mountain Plains 205,712 707,976 105,841 128,770 1,148,300Western 551,740 1,975,822 283,876 341,376 3,152,814Total 2,623,370 9,293,030 1,349,751 1,526,771 14,792,922
Standard ErrorNortheast 14,066 26,660 7,237 5,797 31,537Mid-Atlantic 14,254 26,783 7,334 5,950 31,775Southeast 22,332 41,935 11,490 9,304 49,758Midwest 18,690 34,888 9,616 7,706 41,453Southwest 21,448 40,096 11,035 8,778 47,608Mountain Plains 13,198 24,393 6,790 5,959 29,169Western 24,765 46,923 12,742 10,978 55,659Total 117,216 218,215 60,309 48,728 272,793
Coefficient of VarianceNortheast 6.5% 3.4% 6.5% 4.6% 2.5%Mid-Atlantic 5.7% 3.0% 5.7% 4.3% 2.3%Southeast 4.0% 2.1% 4.0% 2.9% 1.6%Midwest 4.6% 2.4% 4.6% 3.3% 1.8%Southwest 5.0% 2.7% 5.0% 3.7% 2.0%Mountain Plains 6.4% 3.4% 6.4% 4.6% 2.5%Western 4.5% 2.4% 4.5% 3.2% 1.8%Total 4.5% 2.3% 4.5% 3.2% 1.8%
Source: 2010 CPS-ASEC, 2009 ACS, 2009 PRCS, Census International Data Base
Notes:a
Table C.6-2009: WIC Eligibles Standard Errors by FNS Region and Participant Group, CY 2009a
Estimates for the territories, including Puerto Rico, are not included in regional totals or standard errors.

National‐ and State‐Level Estimates of WIC Eligibles and Program Reach: Appendices Page C‐22
Table C.7-2009: State-Specific Breastfeeding Adjustment FactorsCY 2009
StateBreastfeeding Not Breastfeeding <6
months postpartum Breastfeeding Not Breastfeeding <6 months postpartum
Alabama 0.350 0.646 0.176 0.388Alaska 0.795 0.201 0.585 0.251Arizona 0.415 0.581 0.221 0.335Arkansas 0.343 0.653 0.219 0.348California 0.523 0.473 0.346 0.284Colorado 0.569 0.427 0.343 0.266Connecticut 0.436 0.560 0.273 0.330Delaware 0.436 0.560 0.121 0.377D.C. 0.282 0.714 0.116 0.382Florida 0.417 0.579 0.250 0.340Georgia 0.340 0.656 0.157 0.380Hawaii 0.474 0.522 0.285 0.308Idaho 0.601 0.395 0.389 0.271Illinois 0.458 0.538 0.279 0.329Indiana 0.423 0.573 0.220 0.322Iowa 0.450 0.546 0.239 0.344Kansas 0.414 0.582 0.231 0.321Kentucky 0.374 0.623 0.167 0.372Louisiana 0.320 0.676 0.161 0.363Maine 0.525 0.471 0.289 0.329Maryland 0.400 0.596 0.161 0.365Massachusetts 0.452 0.544 0.240 0.327Michigan 0.394 0.602 0.192 0.326Minnesota 0.529 0.467 0.295 0.304Mississippi 0.373 0.623 0.249 0.364Missouri 0.461 0.535 0.272 0.310Montana 0.693 0.303 0.434 0.265Nebraska 0.489 0.507 0.293 0.326Nevada 0.380 0.616 0.228 0.346New Hampshire 0.496 0.501 0.331 0.269New Jersey 0.382 0.614 0.197 0.386New Mexico 0.530 0.466 0.352 0.282New York 0.391 0.605 0.234 0.336North Carolina 0.417 0.579 0.239 0.330North Dakota 0.656 0.340 0.675 0.300Ohio 0.391 0.605 0.206 0.360Oklahoma 0.409 0.587 0.267 0.309Oregon 0.612 0.384 0.366 0.260Pennsylvania 0.403 0.593 0.203 0.360Rhode Island 0.418 0.578 0.300 0.330South Carolina 0.351 0.645 0.200 0.372South Dakota 0.559 0.437 0.307 0.296Tennessee 0.363 0.633 0.179 0.367Texas 0.355 0.641 0.198 0.357Utah 0.671 0.325 0.509 0.267Vermont 0.595 0.401 0.404 0.267Virginia 0.448 0.548 0.226 0.365Washington 0.555 0.441 0.352 0.270West Virginia 0.290 0.706 0.147 0.367Wisconsin 0.482 0.514 0.307 0.314Wyoming 0.629 0.367 0.377 0.309U.S. 0.433 0.563 0.249 0.333
Source: Calculated Factor Based on "2009 Breastfeeding Trends" Ross Labs ‐ Infant Feeding Survey
All Mothers WIC Participants
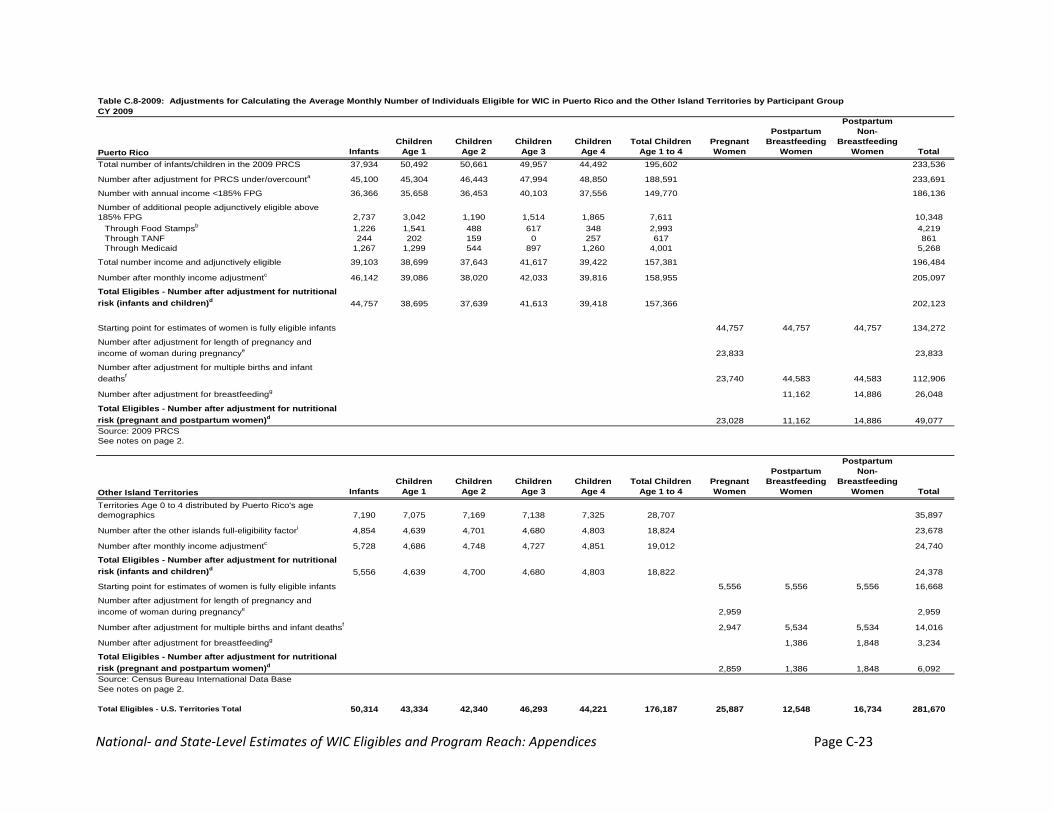
National‐ and State‐Level Estimates of WIC Eligibles and Program Reach: Appendices Page C‐23
Table C.8-2009: Adjustments for Calculating the Average Monthly Number of Individuals Eligible for WIC in Puerto Rico and the Other Island Territories by Participant GroupCY 2009
Puerto Rico InfantsChildren
Age 1Children
Age 2Children
Age 3Children
Age 4Total Children
Age 1 to 4Pregnant Women
Postpartum Breastfeeding
Women
Postpartum Non-
Breastfeeding Women Total
Total number of infants/children in the 2009 PRCS 37,934 50,492 50,661 49,957 44,492 195,602 233,536
Number after adjustment for PRCS under/overcounta 45,100 45,304 46,443 47,994 48,850 188,591 233,691
Number with annual income <185% FPG 36,366 35,658 36,453 40,103 37,556 149,770 186,136
Number of additional people adjunctively eligible above 185% FPG 2,737 3,042 1,190 1,514 1,865 7,611 10,348
Through Food Stampsb 1,226 1,541 488 617 348 2,993 4,219Through TANF 244 202 159 0 257 617 861Through Medicaid 1,267 1,299 544 897 1,260 4,001 5,268
Total number income and adjunctively eligible 39,103 38,699 37,643 41,617 39,422 157,381 196,484
Number after monthly income adjustmentc 46,142 39,086 38,020 42,033 39,816 158,955 205,097
Total Eligibles - Number after adjustment for nutritional risk (infants and children)d 44,757 38,695 37,639 41,613 39,418 157,366 202,123
Starting point for estimates of women is fully eligible infants 44,757 44,757 44,757 134,272
Number after adjustment for length of pregnancy and income of woman during pregnancye 23,833 23,833
Number after adjustment for multiple births and infant deathsf 23,740 44,583 44,583 112,906
Number after adjustment for breastfeedingg 11,162 14,886 26,048
Total Eligibles - Number after adjustment for nutritional risk (pregnant and postpartum women)d 23,028 11,162 14,886 49,077Source: 2009 PRCSSee notes on page 2.
Other Island Territories InfantsChildren
Age 1Children
Age 2Children
Age 3Children
Age 4Total Children
Age 1 to 4Pregnant Women
Postpartum Breastfeeding
Women
Postpartum Non-
Breastfeeding Women Total
Territories Age 0 to 4 distributed by Puerto Rico's age demographics 7,190 7,075 7,169 7,138 7,325 28,707 35,897
Number after the other islands full-eligibility factori 4,854 4,639 4,701 4,680 4,803 18,824 23,678
Number after monthly income adjustmentc 5,728 4,686 4,748 4,727 4,851 19,012 24,740
Total Eligibles - Number after adjustment for nutritional risk (infants and children)d 5,556 4,639 4,700 4,680 4,803 18,822 24,378
Starting point for estimates of women is fully eligible infants 5,556 5,556 5,556 16,668
Number after adjustment for length of pregnancy and income of woman during pregnancye 2,959 2,959
Number after adjustment for multiple births and infant deathsf 2,947 5,534 5,534 14,016
Number after adjustment for breastfeedingg 1,386 1,848 3,234
Total Eligibles - Number after adjustment for nutritional risk (pregnant and postpartum women)d 2,859 1,386 1,848 6,092Source: Census Bureau International Data BaseSee notes on page 2.
Total Eligibles - U.S. Territories Total 50,314 43,334 42,340 46,293 44,221 176,187 25,887 12,548 16,734 281,670
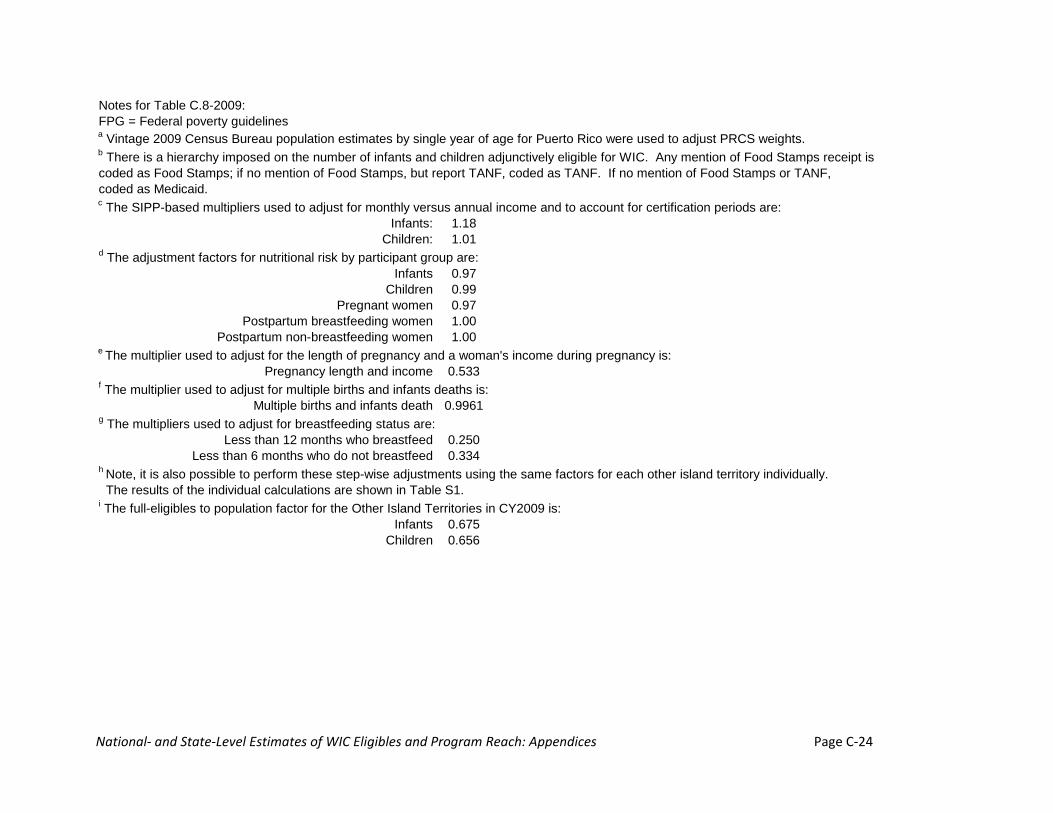
National‐ and State‐Level Estimates of WIC Eligibles and Program Reach: Appendices Page C‐24
Notes for Table C.8-2009:FPG = Federal poverty guidelinesa Vintage 2009 Census Bureau population estimates by single year of age for Puerto Rico were used to adjust PRCS weights.b There is a hierarchy imposed on the number of infants and children adjunctively eligible for WIC. Any mention of Food Stamps receipt is coded as Food Stamps; if no mention of Food Stamps, but report TANF, coded as TANF. If no mention of Food Stamps or TANF, coded as Medicaid.c The SIPP-based multipliers used to adjust for monthly versus annual income and to account for certification periods are:
Infants: 1.18Children: 1.01
d The adjustment factors for nutritional risk by participant group are:Infants 0.97
Children 0.99Pregnant women 0.97
Postpartum breastfeeding women 1.00Postpartum non-breastfeeding women 1.00
e The multiplier used to adjust for the length of pregnancy and a woman's income during pregnancy is:Pregnancy length and income 0.533
f The multiplier used to adjust for multiple births and infants deaths is:Multiple births and infants death 0.9961
g The multipliers used to adjust for breastfeeding status are:Less than 12 months who breastfeed 0.250
Less than 6 months who do not breastfeed 0.334h Note, it is also possible to perform these step-wise adjustments using the same factors for each other island territory individually. The results of the individual calculations are shown in Table S1.i The full-eligibles to population factor for the Other Island Territories in CY2009 is:
Infants 0.675Children 0.656
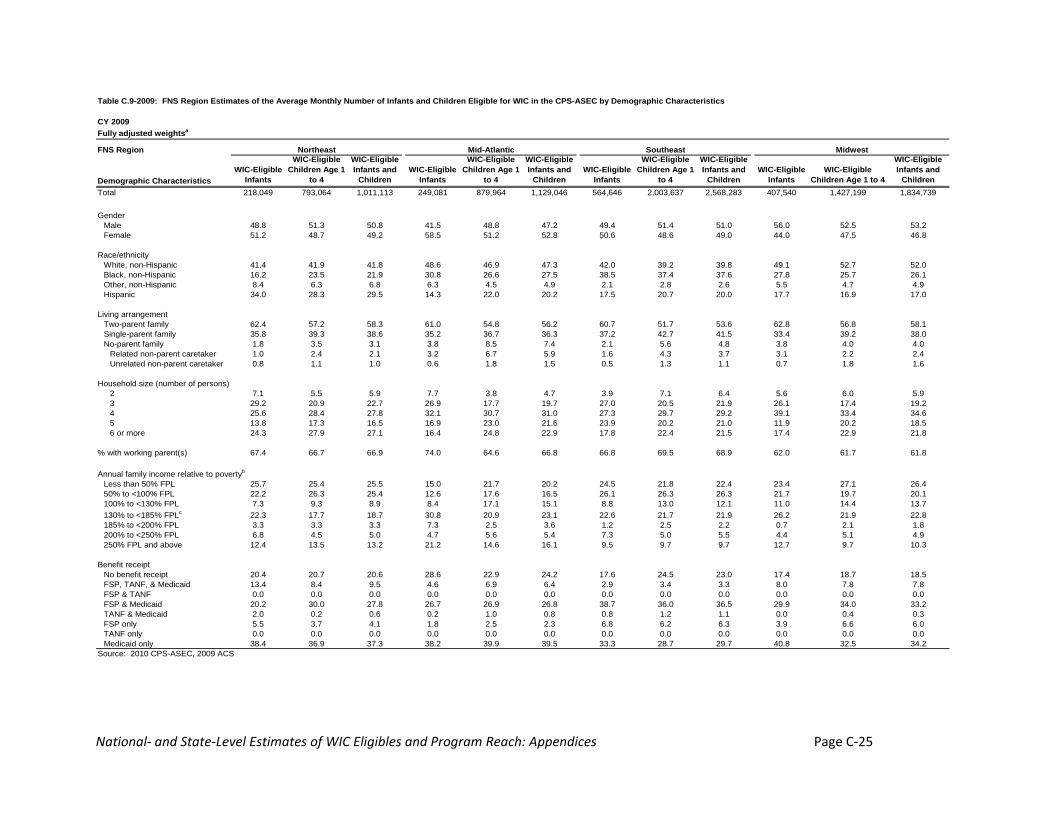
National‐ and State‐Level Estimates of WIC Eligibles and Program Reach: Appendices Page C‐25
Table C.9-2009: FNS Region Estimates of the Average Monthly Number of Infants and Children Eligible for WIC in the CPS-ASEC by Demographic Characteristics
CY 2009Fully adjusted weightsa
FNS Region
Demographic CharacteristicsWIC-Eligible
Infants
WIC-Eligible Children Age 1
to 4
WIC-Eligible Infants and
ChildrenWIC-Eligible
Infants
WIC-Eligible Children Age 1
to 4
WIC-Eligible Infants and
ChildrenWIC-Eligible
Infants
WIC-Eligible Children Age 1
to 4
WIC-Eligible Infants and
ChildrenWIC-Eligible
InfantsWIC-Eligible
Children Age 1 to 4
WIC-Eligible Infants and
ChildrenTotal 218,049 793,064 1,011,113 249,081 879,964 1,129,046 564,646 2,003,637 2,568,283 407,540 1,427,199 1,834,739
GenderMale 48.8 51.3 50.8 41.5 48.8 47.2 49.4 51.4 51.0 56.0 52.5 53.2Female 51.2 48.7 49.2 58.5 51.2 52.8 50.6 48.6 49.0 44.0 47.5 46.8
Race/ethnicityWhite, non-Hispanic 41.4 41.9 41.8 48.6 46.9 47.3 42.0 39.2 39.8 49.1 52.7 52.0Black, non-Hispanic 16.2 23.5 21.9 30.8 26.6 27.5 38.5 37.4 37.6 27.8 25.7 26.1Other, non-Hispanic 8.4 6.3 6.8 6.3 4.5 4.9 2.1 2.8 2.6 5.5 4.7 4.9Hispanic 34.0 28.3 29.5 14.3 22.0 20.2 17.5 20.7 20.0 17.7 16.9 17.0
Living arrangementTwo-parent family 62.4 57.2 58.3 61.0 54.8 56.2 60.7 51.7 53.6 62.8 56.8 58.1Single-parent family 35.8 39.3 38.6 35.2 36.7 36.3 37.2 42.7 41.5 33.4 39.2 38.0No-parent family 1.8 3.5 3.1 3.8 8.5 7.4 2.1 5.6 4.8 3.8 4.0 4.0
Related non-parent caretaker 1.0 2.4 2.1 3.2 6.7 5.9 1.6 4.3 3.7 3.1 2.2 2.4Unrelated non-parent caretaker 0.8 1.1 1.0 0.6 1.8 1.5 0.5 1.3 1.1 0.7 1.8 1.6
Household size (number of persons)2 7.1 5.5 5.9 7.7 3.8 4.7 3.9 7.1 6.4 5.6 6.0 5.93 29.2 20.9 22.7 26.9 17.7 19.7 27.0 20.5 21.9 26.1 17.4 19.24 25.6 28.4 27.8 32.1 30.7 31.0 27.3 29.7 29.2 39.1 33.4 34.65 13.8 17.3 16.5 16.9 23.0 21.6 23.9 20.2 21.0 11.9 20.2 18.56 or more 24.3 27.9 27.1 16.4 24.8 22.9 17.8 22.4 21.5 17.4 22.9 21.8
% with working parent(s) 67.4 66.7 66.9 74.0 64.6 66.8 66.8 69.5 68.9 62.0 61.7 61.8
Annual family income relative to povertyb
Less than 50% FPL 25.7 25.4 25.5 15.0 21.7 20.2 24.5 21.8 22.4 23.4 27.1 26.450% to <100% FPL 22.2 26.3 25.4 12.6 17.6 16.5 26.1 26.3 26.3 21.7 19.7 20.1100% to <130% FPL 7.3 9.3 8.9 8.4 17.1 15.1 8.8 13.0 12.1 11.0 14.4 13.7130% to <185% FPLc 22.3 17.7 18.7 30.8 20.9 23.1 22.6 21.7 21.9 26.2 21.9 22.8185% to <200% FPL 3.3 3.3 3.3 7.3 2.5 3.6 1.2 2.5 2.2 0.7 2.1 1.8200% to <250% FPL 6.8 4.5 5.0 4.7 5.6 5.4 7.3 5.0 5.5 4.4 5.1 4.9250% FPL and above 12.4 13.5 13.2 21.2 14.6 16.1 9.5 9.7 9.7 12.7 9.7 10.3
Benefit receiptNo benefit receipt 20.4 20.7 20.6 28.6 22.9 24.2 17.6 24.5 23.0 17.4 18.7 18.5FSP, TANF, & Medicaid 13.4 8.4 9.5 4.6 6.9 6.4 2.9 3.4 3.3 8.0 7.8 7.8FSP & TANF 0.0 0.0 0.0 0.0 0.0 0.0 0.0 0.0 0.0 0.0 0.0 0.0FSP & Medicaid 20.2 30.0 27.8 26.7 26.9 26.8 38.7 36.0 36.5 29.9 34.0 33.2TANF & Medicaid 2.0 0.2 0.6 0.2 1.0 0.8 0.8 1.2 1.1 0.0 0.4 0.3FSP only 5.5 3.7 4.1 1.8 2.5 2.3 6.8 6.2 6.3 3.9 6.6 6.0TANF only 0.0 0.0 0.0 0.0 0.0 0.0 0.0 0.0 0.0 0.0 0.0 0.0Medicaid only 38.4 36.9 37.3 38.2 39.9 39.5 33.3 28.7 29.7 40.8 32.5 34.2
Source: 2010 CPS-ASEC, 2009 ACS
Northeast Mid-Atlantic Southeast Midwest
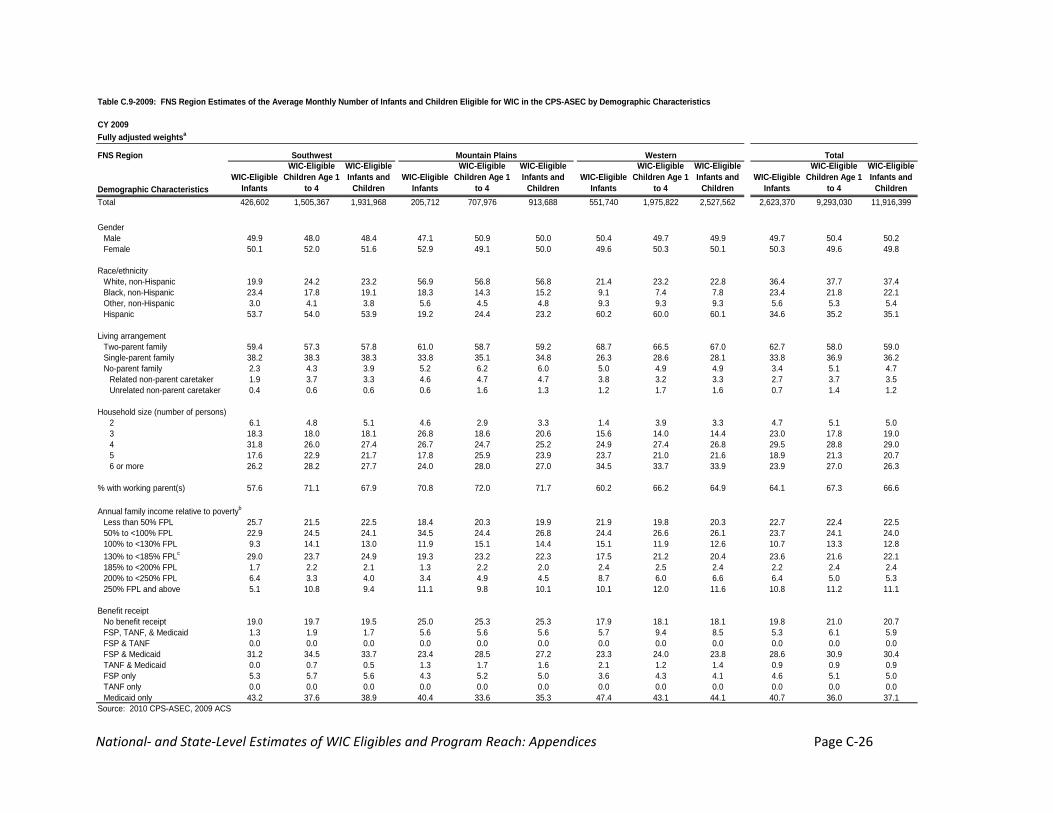
National‐ and State‐Level Estimates of WIC Eligibles and Program Reach: Appendices Page C‐26
Table C.9-2009: FNS Region Estimates of the Average Monthly Number of Infants and Children Eligible for WIC in the CPS-ASEC by Demographic Characteristics
CY 2009Fully adjusted weightsa
FNS Region
Demographic CharacteristicsWIC-Eligible
Infants
WIC-Eligible Children Age 1
to 4
WIC-Eligible Infants and
ChildrenWIC-Eligible
Infants
WIC-Eligible Children Age 1
to 4
WIC-Eligible Infants and
ChildrenWIC-Eligible
Infants
WIC-Eligible Children Age 1
to 4
WIC-Eligible Infants and
ChildrenWIC-Eligible
Infants
WIC-Eligible Children Age 1
to 4
WIC-Eligible Infants and
ChildrenTotal 426,602 1,505,367 1,931,968 205,712 707,976 913,688 551,740 1,975,822 2,527,562 2,623,370 9,293,030 11,916,399
GenderMale 49.9 48.0 48.4 47.1 50.9 50.0 50.4 49.7 49.9 49.7 50.4 50.2Female 50.1 52.0 51.6 52.9 49.1 50.0 49.6 50.3 50.1 50.3 49.6 49.8
Race/ethnicityWhite, non-Hispanic 19.9 24.2 23.2 56.9 56.8 56.8 21.4 23.2 22.8 36.4 37.7 37.4Black, non-Hispanic 23.4 17.8 19.1 18.3 14.3 15.2 9.1 7.4 7.8 23.4 21.8 22.1Other, non-Hispanic 3.0 4.1 3.8 5.6 4.5 4.8 9.3 9.3 9.3 5.6 5.3 5.4Hispanic 53.7 54.0 53.9 19.2 24.4 23.2 60.2 60.0 60.1 34.6 35.2 35.1
Living arrangementTwo-parent family 59.4 57.3 57.8 61.0 58.7 59.2 68.7 66.5 67.0 62.7 58.0 59.0Single-parent family 38.2 38.3 38.3 33.8 35.1 34.8 26.3 28.6 28.1 33.8 36.9 36.2No-parent family 2.3 4.3 3.9 5.2 6.2 6.0 5.0 4.9 4.9 3.4 5.1 4.7
Related non-parent caretaker 1.9 3.7 3.3 4.6 4.7 4.7 3.8 3.2 3.3 2.7 3.7 3.5Unrelated non-parent caretaker 0.4 0.6 0.6 0.6 1.6 1.3 1.2 1.7 1.6 0.7 1.4 1.2
Household size (number of persons)2 6.1 4.8 5.1 4.6 2.9 3.3 1.4 3.9 3.3 4.7 5.1 5.03 18.3 18.0 18.1 26.8 18.6 20.6 15.6 14.0 14.4 23.0 17.8 19.04 31.8 26.0 27.4 26.7 24.7 25.2 24.9 27.4 26.8 29.5 28.8 29.05 17.6 22.9 21.7 17.8 25.9 23.9 23.7 21.0 21.6 18.9 21.3 20.76 or more 26.2 28.2 27.7 24.0 28.0 27.0 34.5 33.7 33.9 23.9 27.0 26.3
% with working parent(s) 57.6 71.1 67.9 70.8 72.0 71.7 60.2 66.2 64.9 64.1 67.3 66.6
Annual family income relative to povertyb
Less than 50% FPL 25.7 21.5 22.5 18.4 20.3 19.9 21.9 19.8 20.3 22.7 22.4 22.550% to <100% FPL 22.9 24.5 24.1 34.5 24.4 26.8 24.4 26.6 26.1 23.7 24.1 24.0100% to <130% FPL 9.3 14.1 13.0 11.9 15.1 14.4 15.1 11.9 12.6 10.7 13.3 12.8130% to <185% FPLc 29.0 23.7 24.9 19.3 23.2 22.3 17.5 21.2 20.4 23.6 21.6 22.1185% to <200% FPL 1.7 2.2 2.1 1.3 2.2 2.0 2.4 2.5 2.4 2.2 2.4 2.4200% to <250% FPL 6.4 3.3 4.0 3.4 4.9 4.5 8.7 6.0 6.6 6.4 5.0 5.3250% FPL and above 5.1 10.8 9.4 11.1 9.8 10.1 10.1 12.0 11.6 10.8 11.2 11.1
Benefit receiptNo benefit receipt 19.0 19.7 19.5 25.0 25.3 25.3 17.9 18.1 18.1 19.8 21.0 20.7FSP, TANF, & Medicaid 1.3 1.9 1.7 5.6 5.6 5.6 5.7 9.4 8.5 5.3 6.1 5.9FSP & TANF 0.0 0.0 0.0 0.0 0.0 0.0 0.0 0.0 0.0 0.0 0.0 0.0FSP & Medicaid 31.2 34.5 33.7 23.4 28.5 27.2 23.3 24.0 23.8 28.6 30.9 30.4TANF & Medicaid 0.0 0.7 0.5 1.3 1.7 1.6 2.1 1.2 1.4 0.9 0.9 0.9FSP only 5.3 5.7 5.6 4.3 5.2 5.0 3.6 4.3 4.1 4.6 5.1 5.0TANF only 0.0 0.0 0.0 0.0 0.0 0.0 0.0 0.0 0.0 0.0 0.0 0.0Medicaid only 43.2 37.6 38.9 40.4 33.6 35.3 47.4 43.1 44.1 40.7 36.0 37.1
Source: 2010 CPS-ASEC, 2009 ACS
Southwest Mountain Plains Western Total
National‐ and State‐Level Estimates of WIC Eligibles and Program Reach: Appendices Page C‐27
Notes for Table C.9-2009:FPG - Federal Poverty GuidelinesFPL - Federal Poverty Levela These estimates are tabulated from the fully adjusted person weights on the March 2010 CPS. They are adjusted to account for the under or over count of infants and children in the CPS relative to Census estimates, monthly income, or nutritional risk.b This table uses both the Federal Poverty Guidelines (FPG) and the Federal Poverty Thresholds or "Levels" (FPL). The thresholds are used to calculate the ratio of annual family income to the poverty threshold for their family size. The guidelines are used in determining WIC eligibility. c There are infants and children adjunctively eligible for WIC with annual family incomes above 185 percent of the Federal Poverty Guidelines (FPG) who have annual family incomes below 185% of the Federal Poverty Level (FPL).

This page was left intentionally blank.
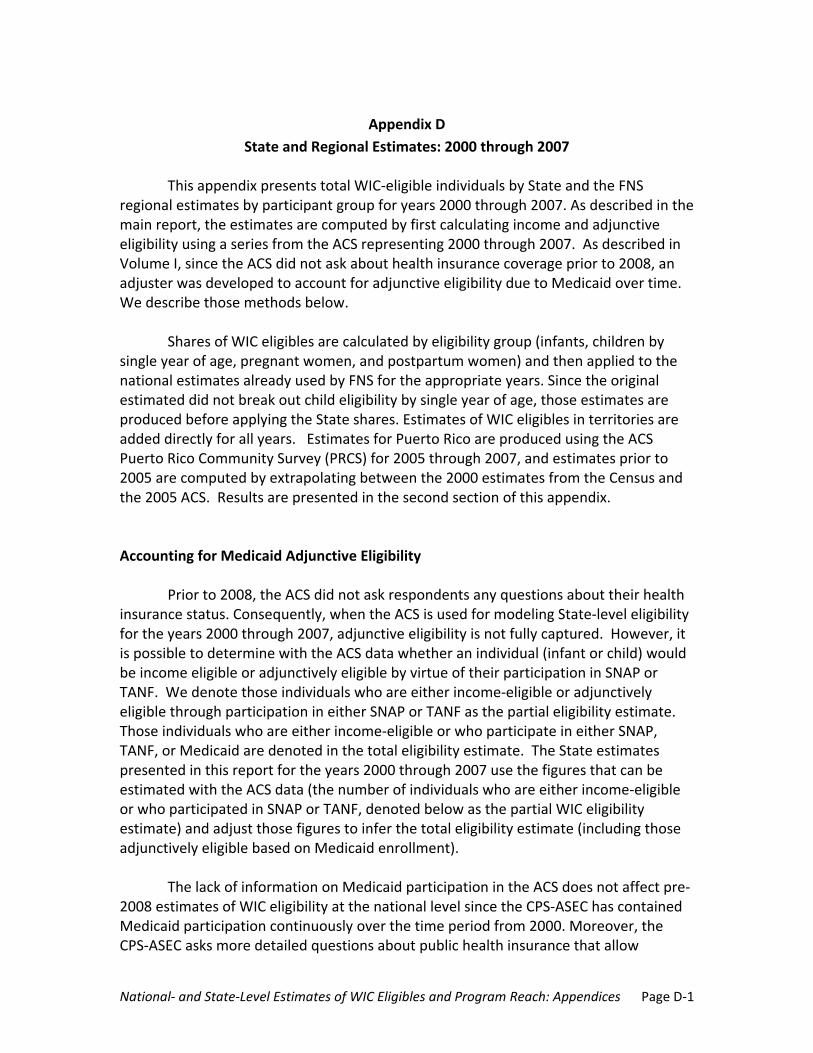
National‐ and State‐Level Estimates of WIC Eligibles and Program Reach: Appendices Page D‐1
Appendix D
State and Regional Estimates: 2000 through 2007 This appendix presents total WIC‐eligible individuals by State and the FNS
regional estimates by participant group for years 2000 through 2007. As described in the main report, the estimates are computed by first calculating income and adjunctive eligibility using a series from the ACS representing 2000 through 2007. As described in Volume I, since the ACS did not ask about health insurance coverage prior to 2008, an adjuster was developed to account for adjunctive eligibility due to Medicaid over time. We describe those methods below.
Shares of WIC eligibles are calculated by eligibility group (infants, children by
single year of age, pregnant women, and postpartum women) and then applied to the national estimates already used by FNS for the appropriate years. Since the original estimated did not break out child eligibility by single year of age, those estimates are produced before applying the State shares. Estimates of WIC eligibles in territories are added directly for all years. Estimates for Puerto Rico are produced using the ACS Puerto Rico Community Survey (PRCS) for 2005 through 2007, and estimates prior to 2005 are computed by extrapolating between the 2000 estimates from the Census and the 2005 ACS. Results are presented in the second section of this appendix. Accounting for Medicaid Adjunctive Eligibility
Prior to 2008, the ACS did not ask respondents any questions about their health insurance status. Consequently, when the ACS is used for modeling State‐level eligibility for the years 2000 through 2007, adjunctive eligibility is not fully captured. However, it is possible to determine with the ACS data whether an individual (infant or child) would be income eligible or adjunctively eligible by virtue of their participation in SNAP or TANF. We denote those individuals who are either income‐eligible or adjunctively eligible through participation in either SNAP or TANF as the partial eligibility estimate. Those individuals who are either income‐eligible or who participate in either SNAP, TANF, or Medicaid are denoted in the total eligibility estimate. The State estimates presented in this report for the years 2000 through 2007 use the figures that can be estimated with the ACS data (the number of individuals who are either income‐eligible or who participated in SNAP or TANF, denoted below as the partial WIC eligibility estimate) and adjust those figures to infer the total eligibility estimate (including those adjunctively eligible based on Medicaid enrollment).
The lack of information on Medicaid participation in the ACS does not affect pre‐2008 estimates of WIC eligibility at the national level since the CPS‐ASEC has contained Medicaid participation continuously over the time period from 2000. Moreover, the CPS‐ASEC asks more detailed questions about public health insurance that allow
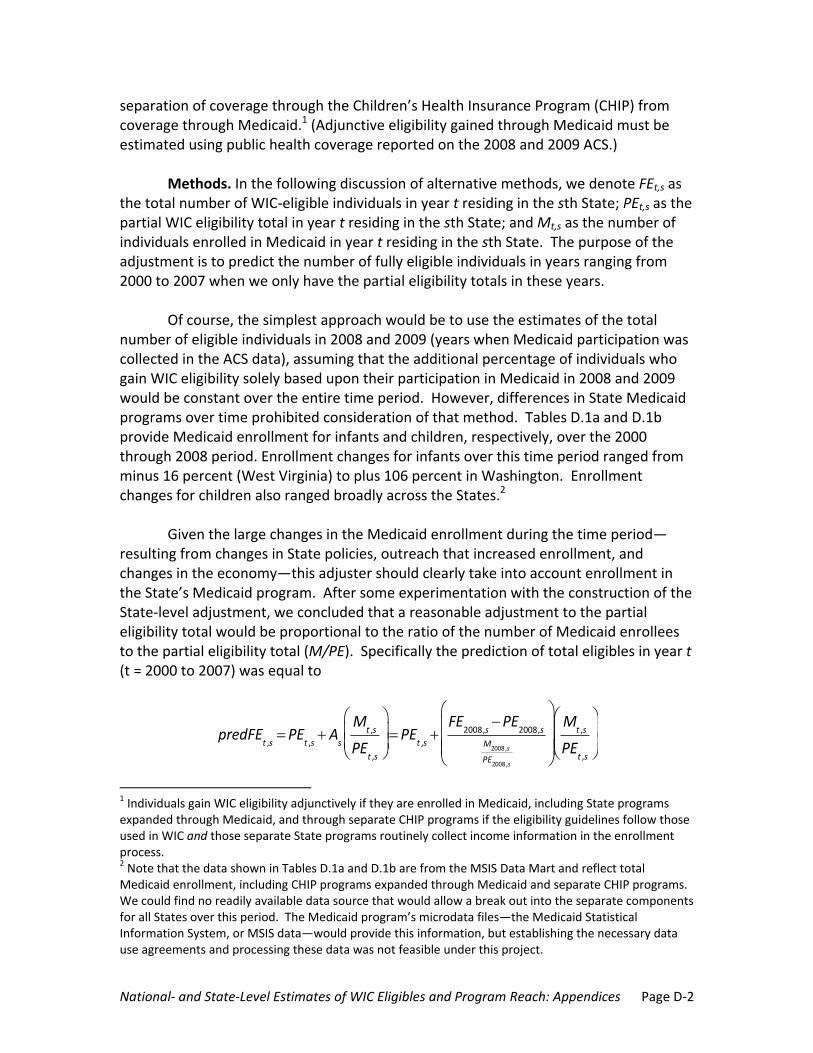
National‐ and State‐Level Estimates of WIC Eligibles and Program Reach: Appendices Page D‐2
separation of coverage through the Children’s Health Insurance Program (CHIP) from coverage through Medicaid.1 (Adjunctive eligibility gained through Medicaid must be estimated using public health coverage reported on the 2008 and 2009 ACS.)
Methods. In the following discussion of alternative methods, we denote FEt,s as the total number of WIC‐eligible individuals in year t residing in the sth State; PEt,s as the partial WIC eligibility total in year t residing in the sth State; and Mt,s as the number of individuals enrolled in Medicaid in year t residing in the sth State. The purpose of the adjustment is to predict the number of fully eligible individuals in years ranging from 2000 to 2007 when we only have the partial eligibility totals in these years.
Of course, the simplest approach would be to use the estimates of the total number of eligible individuals in 2008 and 2009 (years when Medicaid participation was collected in the ACS data), assuming that the additional percentage of individuals who gain WIC eligibility solely based upon their participation in Medicaid in 2008 and 2009 would be constant over the entire time period. However, differences in State Medicaid programs over time prohibited consideration of that method. Tables D.1a and D.1b provide Medicaid enrollment for infants and children, respectively, over the 2000 through 2008 period. Enrollment changes for infants over this time period ranged from minus 16 percent (West Virginia) to plus 106 percent in Washington. Enrollment changes for children also ranged broadly across the States.2
Given the large changes in the Medicaid enrollment during the time period—resulting from changes in State policies, outreach that increased enrollment, and changes in the economy—this adjuster should clearly take into account enrollment in the State’s Medicaid program. After some experimentation with the construction of the State‐level adjustment, we concluded that a reasonable adjustment to the partial eligibility total would be proportional to the ratio of the number of Medicaid enrollees to the partial eligibility total (M/PE). Specifically the prediction of total eligibles in year t (t = 2000 to 2007) was equal to
predFEt ,sPE
t ,sA
s
Mt ,s
PEt ,s
PEt ,s
FE2008,s
PE2008,s
M2008 ,s
PE2008 ,s
Mt ,s
PEt ,s
1 Individuals gain WIC eligibility adjunctively if they are enrolled in Medicaid, including State programs expanded through Medicaid, and through separate CHIP programs if the eligibility guidelines follow those used in WIC and those separate State programs routinely collect income information in the enrollment process. 2 Note that the data shown in Tables D.1a and D.1b are from the MSIS Data Mart and reflect total Medicaid enrollment, including CHIP programs expanded through Medicaid and separate CHIP programs. We could find no readily available data source that would allow a break out into the separate components for all States over this period. The Medicaid program’s microdata files—the Medicaid Statistical Information System, or MSIS data—would provide this information, but establishing the necessary data use agreements and processing these data was not feasible under this project.
National‐ and State‐Level Estimates of WIC Eligibles and Program Reach: Appendices Page D‐3
where As is a constant for each State.
In this specification, the State‐specific constant uses data solely from 2008 because of data limitations. Administrative data on Medicaid enrollment by State are currently available only through 2008. Once Medicaid data for 2009 become available a more precise estimate of the constant As could be obtained by aggregating data from both 2008 and 2009.
While it would be desirable to have separate constants not only by State but also for each year of age, the readily available Medicaid administrative data are available only for infants and for the aggregated group of children age 1 to 6 (including 5‐year‐olds). While As is constructed using data from 2008 on the total and partial numbers of WIC‐eligible children by age in the State, it also uses the Medicaid enrollment data for children age 1 to 6 for M in 2008. This should not create a bias (remember this constant is multiplied by the Medicaid enrollment for the same group but in an earlier year relative to the partially eligible totals of a given age in that earlier year) unless the pattern of enrollment of 5‐year‐olds is different from children age 1 to 4.
Assessment of Method. While not a hard test (only predicting one year out), comparing the prediction of total eligibles in 2009 to administrative data provides some evidence about the accuracy of the method. We report our ability to predict at the State level the number of fully eligible infants in 2009 based upon adjustment factors using only 2008 data and the partial total of eligible infants in 2009. As a substitute for 2009 Medicaid enrollment, we computed the weighted counts of infants reporting participating in Medicaid by State for 2008 and 2009 and used these estimates for values of Mt,s.
Using this method, there are three States where the approach seriously underestimates total eligibility (the District of Columbia, North Dakota, and Massachusetts). The mean error overall is 1.5 percent, the median error 2.3 percent, and the standard deviation 5.2 percent.
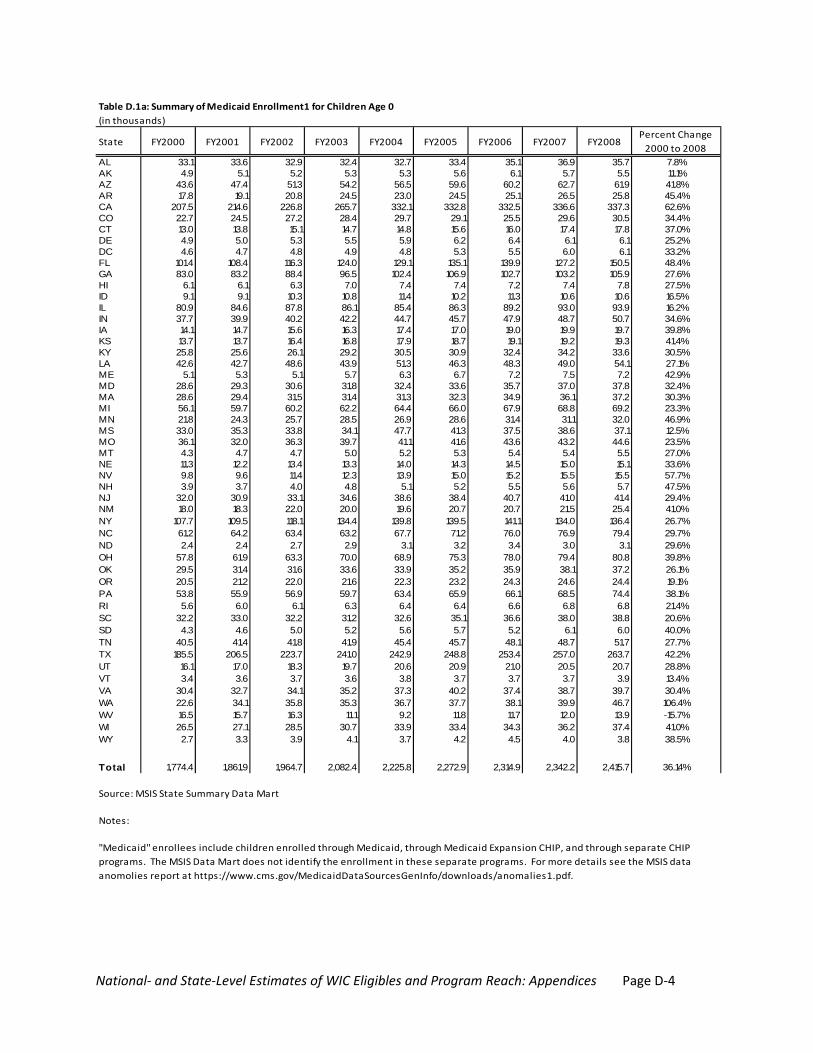
National‐ and State‐Level Estimates of WIC Eligibles and Program Reach: Appendices Page D‐4
Table D.1a: Summary of Medicaid Enrollment1 for Children Age 0
(in thousands)
State FY2000 FY2001 FY2002 FY2003 FY2004 FY2005 FY2006 FY2007 FY2008Percent Change
2000 to 2008
AL 33.1 33.6 32.9 32.4 32.7 33.4 35.1 36.9 35.7 7.8%AK 4.9 5.1 5.2 5.3 5.3 5.6 6.1 5.7 5.5 11.1%AZ 43.6 47.4 51.3 54.2 56.5 59.6 60.2 62.7 61.9 41.8%AR 17.8 19.1 20.8 24.5 23.0 24.5 25.1 26.5 25.8 45.4%CA 207.5 214.6 226.8 265.7 332.1 332.8 332.5 336.6 337.3 62.6%CO 22.7 24.5 27.2 28.4 29.7 29.1 25.5 29.6 30.5 34.4%CT 13.0 13.8 15.1 14.7 14.8 15.6 16.0 17.4 17.8 37.0%DE 4.9 5.0 5.3 5.5 5.9 6.2 6.4 6.1 6.1 25.2%DC 4.6 4.7 4.8 4.9 4.8 5.3 5.5 6.0 6.1 33.2%FL 101.4 108.4 116.3 124.0 129.1 135.1 139.9 127.2 150.5 48.4%GA 83.0 83.2 88.4 96.5 102.4 106.9 102.7 103.2 105.9 27.6%HI 6.1 6.1 6.3 7.0 7.4 7.4 7.2 7.4 7.8 27.5%ID 9.1 9.1 10.3 10.8 11.4 10.2 11.3 10.6 10.6 16.5%IL 80.9 84.6 87.8 86.1 85.4 86.3 89.2 93.0 93.9 16.2%IN 37.7 39.9 40.2 42.2 44.7 45.7 47.9 48.7 50.7 34.6%IA 14.1 14.7 15.6 16.3 17.4 17.0 19.0 19.9 19.7 39.8%KS 13.7 13.7 16.4 16.8 17.9 18.7 19.1 19.2 19.3 41.4%KY 25.8 25.6 26.1 29.2 30.5 30.9 32.4 34.2 33.6 30.5%LA 42.6 42.7 48.6 43.9 51.3 46.3 48.3 49.0 54.1 27.1%ME 5.1 5.3 5.1 5.7 6.3 6.7 7.2 7.5 7.2 42.9%MD 28.6 29.3 30.6 31.8 32.4 33.6 35.7 37.0 37.8 32.4%MA 28.6 29.4 31.5 31.4 31.3 32.3 34.9 36.1 37.2 30.3%MI 56.1 59.7 60.2 62.2 64.4 66.0 67.9 68.8 69.2 23.3%MN 21.8 24.3 25.7 28.5 26.9 28.6 31.4 31.1 32.0 46.9%MS 33.0 35.3 33.8 34.1 47.7 41.3 37.5 38.6 37.1 12.5%MO 36.1 32.0 36.3 39.7 41.1 41.6 43.6 43.2 44.6 23.5%MT 4.3 4.7 4.7 5.0 5.2 5.3 5.4 5.4 5.5 27.0%NE 11.3 12.2 13.4 13.3 14.0 14.3 14.5 15.0 15.1 33.6%NV 9.8 9.6 11.4 12.3 13.9 15.0 15.2 15.5 15.5 57.7%NH 3.9 3.7 4.0 4.8 5.1 5.2 5.5 5.6 5.7 47.5%NJ 32.0 30.9 33.1 34.6 38.6 38.4 40.7 41.0 41.4 29.4%NM 18.0 18.3 22.0 20.0 19.6 20.7 20.7 21.5 25.4 41.0%NY 107.7 109.5 118.1 134.4 139.8 139.5 141.1 134.0 136.4 26.7%NC 61.2 64.2 63.4 63.2 67.7 71.2 76.0 76.9 79.4 29.7%ND 2.4 2.4 2.7 2.9 3.1 3.2 3.4 3.0 3.1 29.6%OH 57.8 61.9 63.3 70.0 68.9 75.3 78.0 79.4 80.8 39.8%OK 29.5 31.4 31.6 33.6 33.9 35.2 35.9 38.1 37.2 26.1%OR 20.5 21.2 22.0 21.6 22.3 23.2 24.3 24.6 24.4 19.1%PA 53.8 55.9 56.9 59.7 63.4 65.9 66.1 68.5 74.4 38.1%RI 5.6 6.0 6.1 6.3 6.4 6.4 6.6 6.8 6.8 21.4%SC 32.2 33.0 32.2 31.2 32.6 35.1 36.6 38.0 38.8 20.6%SD 4.3 4.6 5.0 5.2 5.6 5.7 5.2 6.1 6.0 40.0%TN 40.5 41.4 41.8 41.9 45.4 45.7 48.1 48.7 51.7 27.7%TX 185.5 206.5 223.7 241.0 242.9 248.8 253.4 257.0 263.7 42.2%UT 16.1 17.0 18.3 19.7 20.6 20.9 21.0 20.5 20.7 28.8%VT 3.4 3.6 3.7 3.6 3.8 3.7 3.7 3.7 3.9 13.4%VA 30.4 32.7 34.1 35.2 37.3 40.2 37.4 38.7 39.7 30.4%WA 22.6 34.1 35.8 35.3 36.7 37.7 38.1 39.9 46.7 106.4%WV 16.5 15.7 16.3 11.1 9.2 11.8 11.7 12.0 13.9 -15.7%WI 26.5 27.1 28.5 30.7 33.9 33.4 34.3 36.2 37.4 41.0%WY 2.7 3.3 3.9 4.1 3.7 4.2 4.5 4.0 3.8 38.5%
Total 1,774.4 1,861.9 1,964.7 2,082.4 2,225.8 2,272.9 2,314.9 2,342.2 2,415.7 36.14%
Source: MSIS State Summary Data Mart
Notes:
"Medicaid" enrollees include children enrolled through Medicaid, through Medicaid Expansion CHIP, and through separate CHIP
programs. The MSIS Data Mart does not identify the enrollment in these separate programs. For more details see the MSIS data
anomolies report at https://www.cms.gov/MedicaidDataSourcesGenInfo/downloads/anomalies1.pdf.
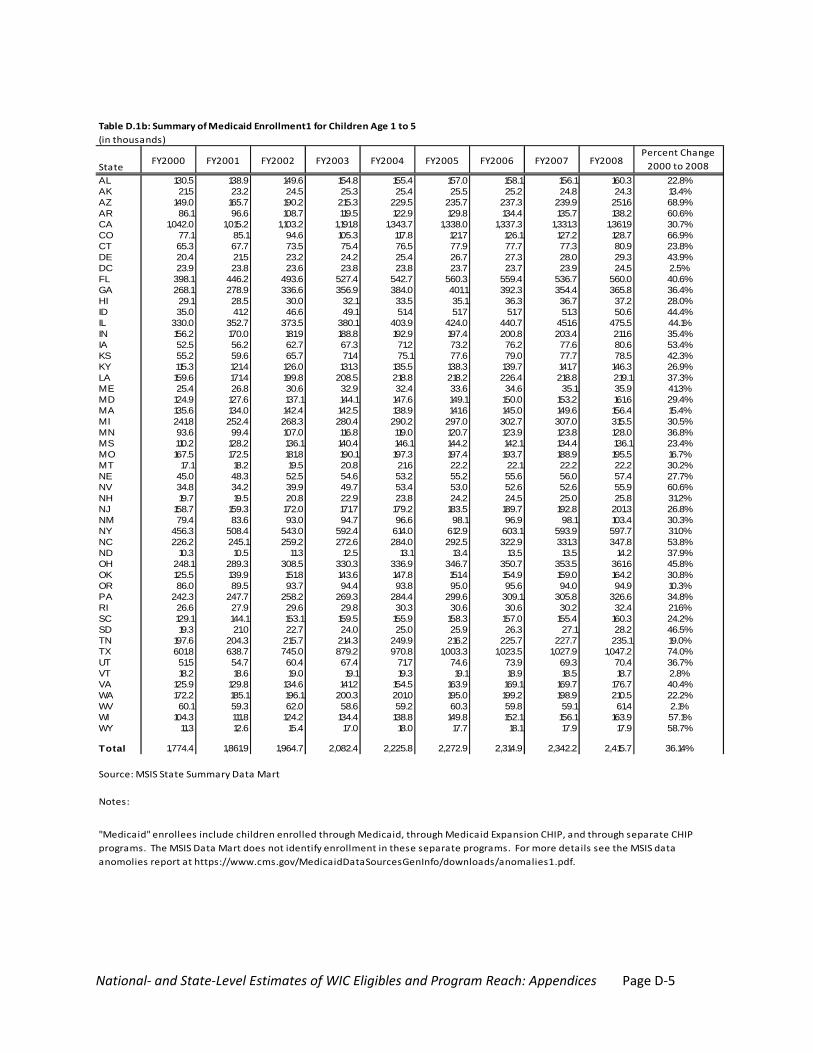
National‐ and State‐Level Estimates of WIC Eligibles and Program Reach: Appendices Page D‐5
(in thousands)
StateFY2000 FY2001 FY2002 FY2003 FY2004 FY2005 FY2006 FY2007 FY2008
Percent Change
2000 to 2008
AL 130.5 138.9 149.6 154.8 155.4 157.0 158.1 156.1 160.3 22.8%AK 21.5 23.2 24.5 25.3 25.4 25.5 25.2 24.8 24.3 13.4%AZ 149.0 165.7 190.2 215.3 229.5 235.7 237.3 239.9 251.6 68.9%AR 86.1 96.6 108.7 119.5 122.9 129.8 134.4 135.7 138.2 60.6%CA 1,042.0 1,015.2 1,103.2 1,191.8 1,343.7 1,338.0 1,337.3 1,331.3 1,361.9 30.7%CO 77.1 85.1 94.6 105.3 117.8 121.7 126.1 127.2 128.7 66.9%CT 65.3 67.7 73.5 75.4 76.5 77.9 77.7 77.3 80.9 23.8%DE 20.4 21.5 23.2 24.2 25.4 26.7 27.3 28.0 29.3 43.9%DC 23.9 23.8 23.6 23.8 23.8 23.7 23.7 23.9 24.5 2.5%FL 398.1 446.2 493.6 527.4 542.7 560.3 559.4 536.7 560.0 40.6%GA 268.1 278.9 336.6 356.9 384.0 401.1 392.3 354.4 365.8 36.4%HI 29.1 28.5 30.0 32.1 33.5 35.1 36.3 36.7 37.2 28.0%ID 35.0 41.2 46.6 49.1 51.4 51.7 51.7 51.3 50.6 44.4%IL 330.0 352.7 373.5 380.1 403.9 424.0 440.7 451.6 475.5 44.1%IN 156.2 170.0 181.9 188.8 192.9 197.4 200.8 203.4 211.6 35.4%IA 52.5 56.2 62.7 67.3 71.2 73.2 76.2 77.6 80.6 53.4%KS 55.2 59.6 65.7 71.4 75.1 77.6 79.0 77.7 78.5 42.3%KY 115.3 121.4 126.0 131.3 135.5 138.3 139.7 141.7 146.3 26.9%LA 159.6 171.4 199.8 208.5 218.8 218.2 226.4 218.8 219.1 37.3%ME 25.4 26.8 30.6 32.9 32.4 33.6 34.6 35.1 35.9 41.3%MD 124.9 127.6 137.1 144.1 147.6 149.1 150.0 153.2 161.6 29.4%MA 135.6 134.0 142.4 142.5 138.9 141.6 145.0 149.6 156.4 15.4%MI 241.8 252.4 268.3 280.4 290.2 297.0 302.7 307.0 315.5 30.5%MN 93.6 99.4 107.0 116.8 119.0 120.7 123.9 123.8 128.0 36.8%MS 110.2 128.2 136.1 140.4 146.1 144.2 142.1 134.4 136.1 23.4%MO 167.5 172.5 181.8 190.1 197.3 197.4 193.7 188.9 195.5 16.7%MT 17.1 18.2 19.5 20.8 21.6 22.2 22.1 22.2 22.2 30.2%NE 45.0 48.3 52.5 54.6 53.2 55.2 55.6 56.0 57.4 27.7%NV 34.8 34.2 39.9 49.7 53.4 53.0 52.6 52.6 55.9 60.6%NH 19.7 19.5 20.8 22.9 23.8 24.2 24.5 25.0 25.8 31.2%NJ 158.7 159.3 172.0 171.7 179.2 183.5 189.7 192.8 201.3 26.8%NM 79.4 83.6 93.0 94.7 96.6 98.1 96.9 98.1 103.4 30.3%NY 456.3 508.4 543.0 592.4 614.0 612.9 603.1 593.9 597.7 31.0%NC 226.2 245.1 259.2 272.6 284.0 292.5 322.9 331.3 347.8 53.8%ND 10.3 10.5 11.3 12.5 13.1 13.4 13.5 13.5 14.2 37.9%OH 248.1 289.3 308.5 330.3 336.9 346.7 350.7 353.5 361.6 45.8%OK 125.5 139.9 151.8 143.6 147.8 151.4 154.9 159.0 164.2 30.8%OR 86.0 89.5 93.7 94.4 93.8 95.0 95.6 94.0 94.9 10.3%PA 242.3 247.7 258.2 269.3 284.4 299.6 309.1 305.8 326.6 34.8%RI 26.6 27.9 29.6 29.8 30.3 30.6 30.6 30.2 32.4 21.6%SC 129.1 144.1 153.1 159.5 155.9 158.3 157.0 155.4 160.3 24.2%SD 19.3 21.0 22.7 24.0 25.0 25.9 26.3 27.1 28.2 46.5%TN 197.6 204.3 215.7 214.3 249.9 216.2 225.7 227.7 235.1 19.0%TX 601.8 638.7 745.0 879.2 970.8 1,003.3 1,023.5 1,027.9 1,047.2 74.0%UT 51.5 54.7 60.4 67.4 71.7 74.6 73.9 69.3 70.4 36.7%VT 18.2 18.6 19.0 19.1 19.3 19.1 18.9 18.5 18.7 2.8%VA 125.9 129.8 134.6 141.2 154.5 163.9 169.1 169.7 176.7 40.4%WA 172.2 185.1 196.1 200.3 201.0 195.0 199.2 198.9 210.5 22.2%WV 60.1 59.3 62.0 58.6 59.2 60.3 59.8 59.1 61.4 2.1%WI 104.3 111.8 124.2 134.4 138.8 149.8 152.1 156.1 163.9 57.1%WY 11.3 12.6 15.4 17.0 18.0 17.7 18.1 17.9 17.9 58.7%
Total 1,774.4 1,861.9 1,964.7 2,082.4 2,225.8 2,272.9 2,314.9 2,342.2 2,415.7 36.14%
Source: MSIS State Summary Data Mart
Notes:
Table D.1b: Summary of Medicaid Enrollment1 for Children Age 1 to 5
"Medicaid" enrollees include children enrolled through Medicaid, through Medicaid Expansion CHIP, and through separate CHIP
programs. The MSIS Data Mart does not identify enrollment in these separate programs. For more details see the MSIS data
anomolies report at https://www.cms.gov/MedicaidDataSourcesGenInfo/downloads/anomalies1.pdf.

National‐ and State‐Level Estimates of WIC Eligibles and Program Reach: Appendices Page D‐6
State and Regional Estimates
The following set of tables presents the estimates by State and FNS region for 2000
through 2007 incorporating the method for estimating adjunctive eligibility through Medicaid outlined above. Table D.1c: National Estimates by Participant Group with Children by Single Year of Age This table shows the previously tabulated national estimates based on the March CPS. For calendar years 2000 through 2007, this table distributes the total number of children age 1 to 4 by single year of age based on ACS tabulations. (Original national estimates based on the CPS‐ASEC did not provide break outs for single year of age.) For these years, this table also removes the previously applied territorial adjustment and adds the estimated number of eligible individuals as calculated in Table D.7. Table D.2: WIC Eligibles and Coverage Rates by State and FNS Region This table shows the estimated total number of WIC‐eligible individuals by State (alphabetical) and FNS region. Also shown is the total number of participants and calculated coverage rates by State and FNS region. Totals and coverage rates by FNS region include the territories. Table D.3: WIC Eligibles and Coverage Rates by FNS Region and State This table shows the estimated total number of WIC eligibles by FNS region with each State listed under its region. Also shown is the total number of participants and calculated coverage rates by FNS region and State. Totals and coverage rates by FNS region include the territories. Table D.4: WIC Eligibles and Coverage Rates by FNS Region and Participant Group This table shows the estimated number of WIC eligibles by FNS region and participant group. Also shown is the total number of participants and calculated coverage rates by FNS region and participant group. Totals and coverage rates by FNS region and participant group include the territories.
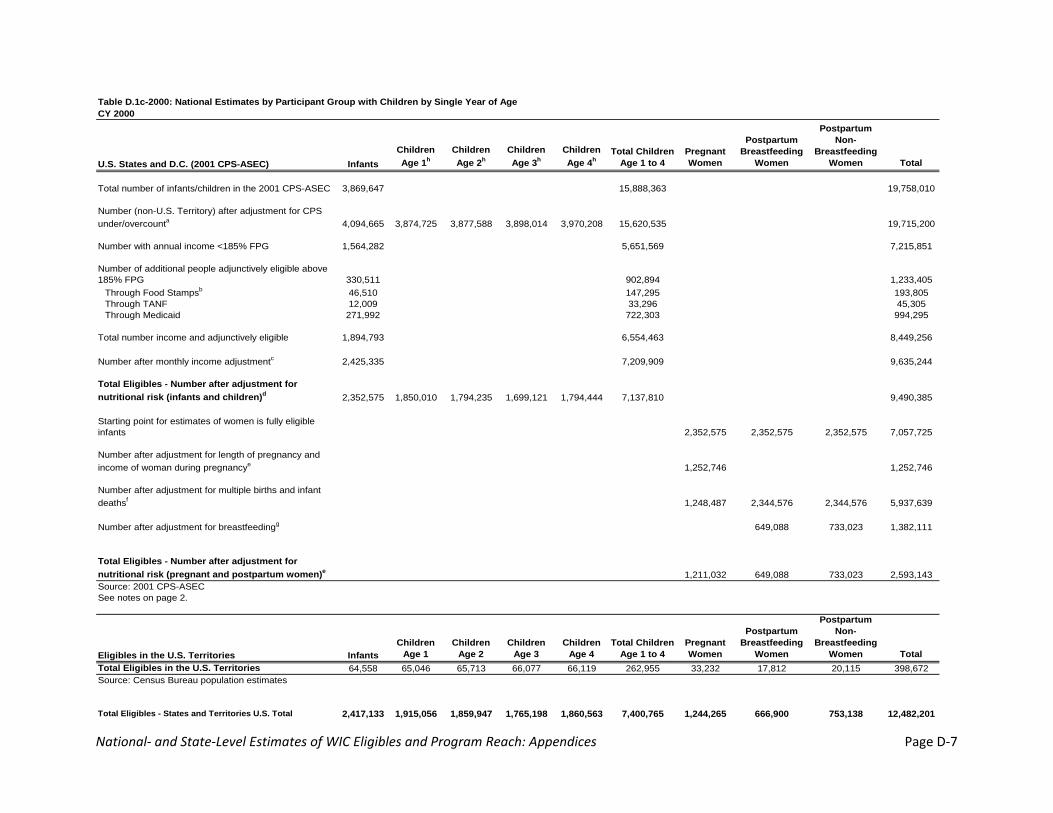
National‐ and State‐Level Estimates of WIC Eligibles and Program Reach: Appendices Page D‐7
Table D.1c-2000: National Estimates by Participant Group with Children by Single Year of AgeCY 2000
U.S. States and D.C. (2001 CPS-ASEC) InfantsChildren Age 1h
Children Age 2h
Children Age 3h
Children Age 4h
Total Children Age 1 to 4
Pregnant Women
Postpartum Breastfeeding
Women
Postpartum Non-
Breastfeeding Women Total
Total number of infants/children in the 2001 CPS-ASEC 3,869,647 15,888,363 19,758,010
Number (non-U.S. Territory) after adjustment for CPS under/overcounta 4,094,665 3,874,725 3,877,588 3,898,014 3,970,208 15,620,535 19,715,200
Number with annual income <185% FPG 1,564,282 5,651,569 7,215,851
Number of additional people adjunctively eligible above 185% FPG 330,511 902,894 1,233,405
Through Food Stampsb 46,510 147,295 193,805Through TANF 12,009 33,296 45,305Through Medicaid 271,992 722,303 994,295
Total number income and adjunctively eligible 1,894,793 6,554,463 8,449,256
Number after monthly income adjustmentc 2,425,335 7,209,909 9,635,244
Total Eligibles - Number after adjustment for nutritional risk (infants and children)d 2,352,575 1,850,010 1,794,235 1,699,121 1,794,444 7,137,810 9,490,385
Starting point for estimates of women is fully eligible infants 2,352,575 2,352,575 2,352,575 7,057,725
Number after adjustment for length of pregnancy and income of woman during pregnancye 1,252,746 1,252,746
Number after adjustment for multiple births and infant deathsf 1,248,487 2,344,576 2,344,576 5,937,639
Number after adjustment for breastfeedingg 649,088 733,023 1,382,111
Total Eligibles - Number after adjustment for nutritional risk (pregnant and postpartum women)e 1,211,032 649,088 733,023 2,593,143Source: 2001 CPS-ASECSee notes on page 2.
Eligibles in the U.S. Territories InfantsChildren
Age 1Children
Age 2Children
Age 3Children
Age 4Total Children
Age 1 to 4Pregnant Women
Postpartum Breastfeeding
Women
Postpartum Non-
Breastfeeding Women Total
Total Eligibles in the U.S. Territories 64,558 65,046 65,713 66,077 66,119 262,955 33,232 17,812 20,115 398,672Source: Census Bureau population estimates
Total Eligibles - States and Territories U.S. Total 2,417,133 1,915,056 1,859,947 1,765,198 1,860,563 7,400,765 1,244,265 666,900 753,138 12,482,201
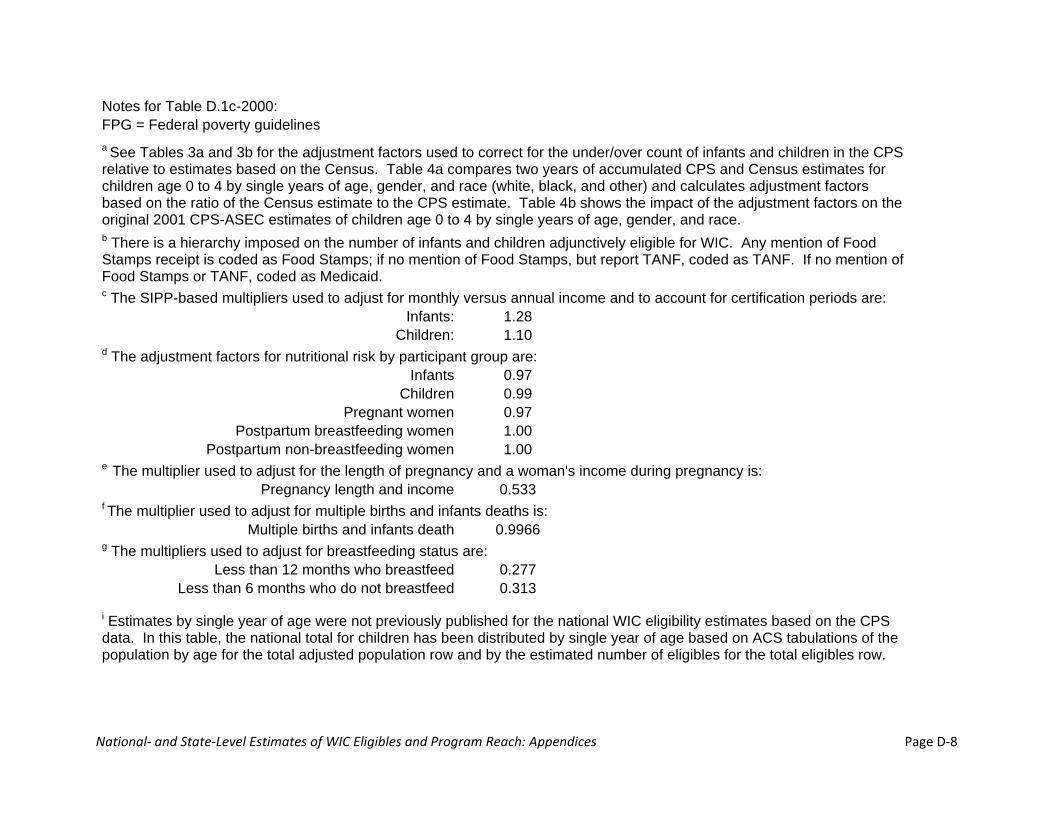
National‐ and State‐Level Estimates of WIC Eligibles and Program Reach: Appendices Page D‐8
Notes for Table D.1c-2000: FPG = Federal poverty guidelines a See Tables 3a and 3b for the adjustment factors used to correct for the under/over count of infants and children in the CPS relative to estimates based on the Census. Table 4a compares two years of accumulated CPS and Census estimates for children age 0 to 4 by single years of age, gender, and race (white, black, and other) and calculates adjustment factors based on the ratio of the Census estimate to the CPS estimate. Table 4b shows the impact of the adjustment factors on the original 2001 CPS-ASEC estimates of children age 0 to 4 by single years of age, gender, and race. b There is a hierarchy imposed on the number of infants and children adjunctively eligible for WIC. Any mention of Food Stamps receipt is coded as Food Stamps; if no mention of Food Stamps, but report TANF, coded as TANF. If no mention of Food Stamps or TANF, coded as Medicaid. c The SIPP-based multipliers used to adjust for monthly versus annual income and to account for certification periods are:
Infants: 1.28 Children: 1.10
d The adjustment factors for nutritional risk by participant group are: Infants 0.97
Children 0.99 Pregnant women 0.97
Postpartum breastfeeding women 1.00 Postpartum non-breastfeeding women 1.00
e The multiplier used to adjust for the length of pregnancy and a woman's income during pregnancy is: Pregnancy length and income 0.533
f The multiplier used to adjust for multiple births and infants deaths is: Multiple births and infants death 0.9966
g The multipliers used to adjust for breastfeeding status are: Less than 12 months who breastfeed 0.277
Less than 6 months who do not breastfeed 0.313
i Estimates by single year of age were not previously published for the national WIC eligibility estimates based on the CPS data. In this table, the national total for children has been distributed by single year of age based on ACS tabulations of the population by age for the total adjusted population row and by the estimated number of eligibles for the total eligibles row.
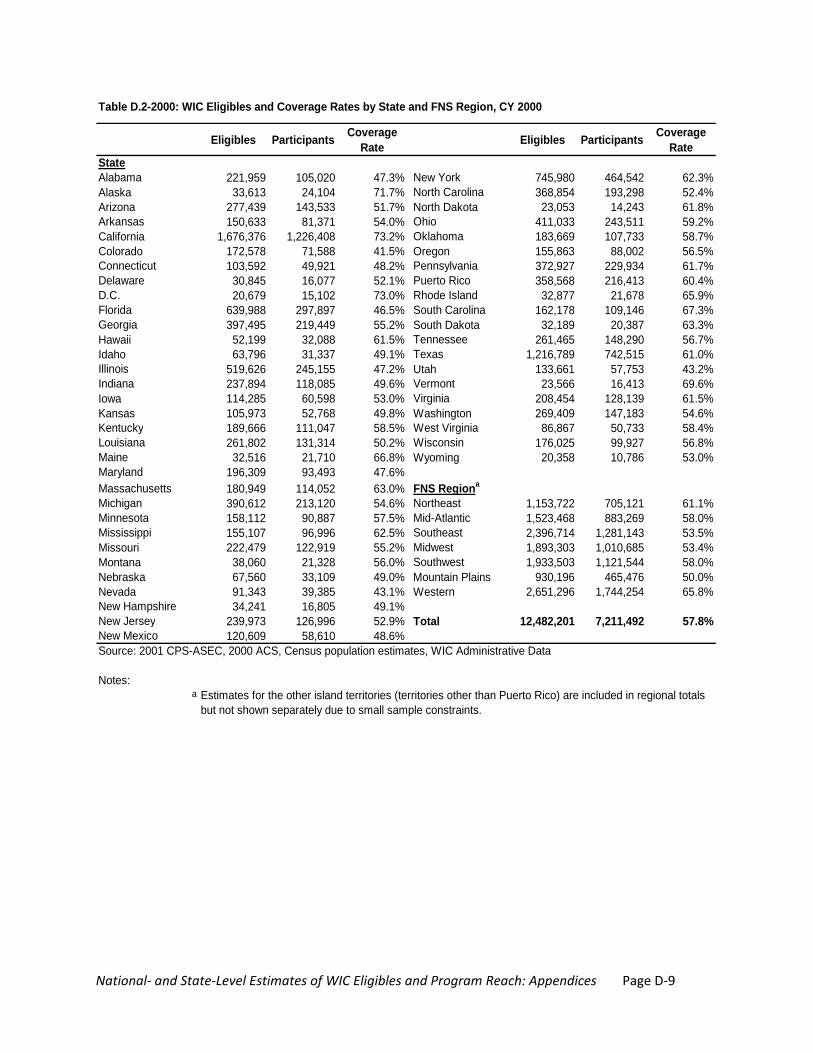
National‐ and State‐Level Estimates of WIC Eligibles and Program Reach: Appendices Page D‐9
Eligibles Participants Coverage Rate Eligibles Participants Coverage
RateStateAlabama 221,959 105,020 47.3% New York 745,980 464,542 62.3%Alaska 33,613 24,104 71.7% North Carolina 368,854 193,298 52.4%Arizona 277,439 143,533 51.7% North Dakota 23,053 14,243 61.8%Arkansas 150,633 81,371 54.0% Ohio 411,033 243,511 59.2%California 1,676,376 1,226,408 73.2% Oklahoma 183,669 107,733 58.7%Colorado 172,578 71,588 41.5% Oregon 155,863 88,002 56.5%Connecticut 103,592 49,921 48.2% Pennsylvania 372,927 229,934 61.7%Delaware 30,845 16,077 52.1% Puerto Rico 358,568 216,413 60.4%D.C. 20,679 15,102 73.0% Rhode Island 32,877 21,678 65.9%Florida 639,988 297,897 46.5% South Carolina 162,178 109,146 67.3%Georgia 397,495 219,449 55.2% South Dakota 32,189 20,387 63.3%Hawaii 52,199 32,088 61.5% Tennessee 261,465 148,290 56.7%Idaho 63,796 31,337 49.1% Texas 1,216,789 742,515 61.0%Illinois 519,626 245,155 47.2% Utah 133,661 57,753 43.2%Indiana 237,894 118,085 49.6% Vermont 23,566 16,413 69.6%Iowa 114,285 60,598 53.0% Virginia 208,454 128,139 61.5%Kansas 105,973 52,768 49.8% Washington 269,409 147,183 54.6%Kentucky 189,666 111,047 58.5% West Virginia 86,867 50,733 58.4%Louisiana 261,802 131,314 50.2% Wisconsin 176,025 99,927 56.8%Maine 32,516 21,710 66.8% Wyoming 20,358 10,786 53.0%Maryland 196,309 93,493 47.6%Massachusetts 180,949 114,052 63.0% FNS Regiona
Michigan 390,612 213,120 54.6% Northeast 1,153,722 705,121 61.1%Minnesota 158,112 90,887 57.5% Mid-Atlantic 1,523,468 883,269 58.0%Mississippi 155,107 96,996 62.5% Southeast 2,396,714 1,281,143 53.5%Missouri 222,479 122,919 55.2% Midwest 1,893,303 1,010,685 53.4%Montana 38,060 21,328 56.0% Southwest 1,933,503 1,121,544 58.0%Nebraska 67,560 33,109 49.0% Mountain Plains 930,196 465,476 50.0%Nevada 91,343 39,385 43.1% Western 2,651,296 1,744,254 65.8%New Hampshire 34,241 16,805 49.1%New Jersey 239,973 126,996 52.9% Total 12,482,201 7,211,492 57.8%New Mexico 120,609 58,610 48.6%Source: 2001 CPS-ASEC, 2000 ACS, Census population estimates, WIC Administrative Data
Notes:a
Table D.2-2000: WIC Eligibles and Coverage Rates by State and FNS Region, CY 2000
Estimates for the other island territories (territories other than Puerto Rico) are included in regional totals but not shown separately due to small sample constraints.

National‐ and State‐Level Estimates of WIC Eligibles and Program Reach: Appendices Page D‐10
Eligibles Participants Coverage Rate Eligibles Participants Coverage
RateNortheast 1,153,722 705,121 61.1% Southwest 1,933,503 1,121,544 58.0%
Connecticut 103,592 49,921 48.2% Arkansas 150,633 81,371 54.0%Maine 32,516 21,710 66.8% Louisiana 261,802 131,314 50.2%Massachusetts 180,949 114,052 63.0% New Mexico 120,609 58,610 48.6%New Hampshire 34,241 16,805 49.1% Oklahoma 183,669 107,733 58.7%New York 745,980 464,542 62.3% Texas 1,216,789 742,515 61.0%Rhode Island 32,877 21,678 65.9%Vermont 23,566 16,413 69.6% Mountain Plains 930,196 465,476 50.0%
Colorado 172,578 71,588 41.5%Mid-Atlantic 1,523,468 883,269 58.0% Iowa 114,285 60,598 53.0%
Delaware 30,845 16,077 52.1% Kansas 105,973 52,768 49.8%D.C. 20,679 15,102 73.0% Missouri 222,479 122,919 55.2%Maryland 196,309 93,493 47.6% Montana 38,060 21,328 56.0%New Jersey 239,973 126,996 52.9% Nebraska 67,560 33,109 49.0%Pennsylvania 372,927 229,934 61.7% North Dakota 23,053 14,243 61.8%Puerto Rico 358,568 216,413 60.4% South Dakota 32,189 20,387 63.3%Virginia 208,454 128,139 61.5% Utah 133,661 57,753 43.2%West Virginia 86,867 50,733 58.4% Wyoming 20,358 10,786 53.0%
Southeast 2,396,714 1,281,143 53.5% Western 2,651,296 1,744,254 65.8%Alabama 221,959 105,020 47.3% Alaska 33,613 24,104 71.7%Florida 639,988 297,897 46.5% Arizona 277,439 143,533 51.7%Georgia 397,495 219,449 55.2% California 1,676,376 1,226,408 73.2%Kentucky 189,666 111,047 58.5% Hawaii 52,199 32,088 61.5%Mississippi 155,107 96,996 62.5% Idaho 63,796 31,337 49.1%North Carolina 368,854 193,298 52.4% Nevada 91,343 39,385 43.1%South Carolina 162,178 109,146 67.3% Oregon 155,863 88,002 56.5%Tennessee 261,465 148,290 56.7% Washington 269,409 147,183 54.6%
Midwest 1,893,303 1,010,685 53.4% Total 12,482,201 7,211,492 57.8%Illinois 519,626 245,155 47.2%Indiana 237,894 118,085 49.6%Michigan 390,612 213,120 54.6%Minnesota 158,112 90,887 57.5%Ohio 411,033 243,511 59.2%Wisconsin 176,025 99,927 56.8%
Source: 2001 CPS-ASEC, 2000 ACS, Census population estimates, WIC Administrative Data
Notes:a
Table D.3-2000: WIC Eligibles and Coverage Rates by FNS Region and State, CY 2000a
Estimates for the other island territories (territories other than Puerto Rico) are included in regional totals but not shown separately due to small sample constraints.
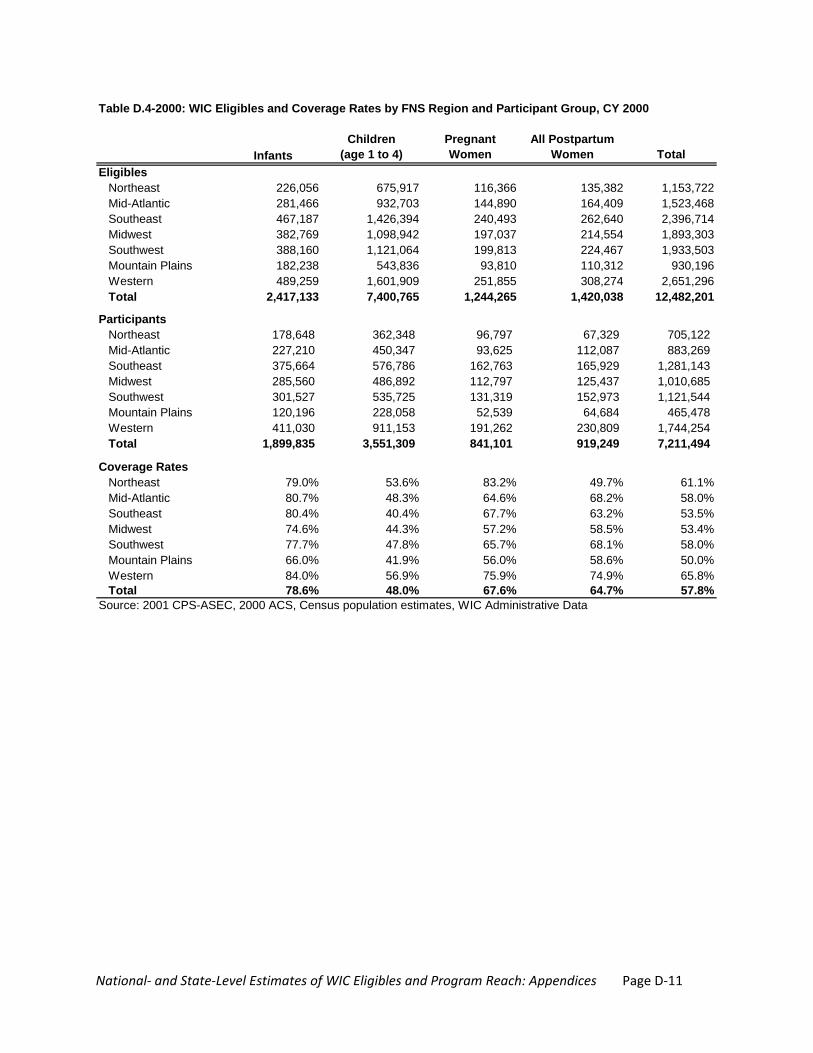
National‐ and State‐Level Estimates of WIC Eligibles and Program Reach: Appendices Page D‐11
InfantsChildren
(age 1 to 4)Pregnant Women
All Postpartum Women Total
EligiblesNortheast 226,056 675,917 116,366 135,382 1,153,722Mid-Atlantic 281,466 932,703 144,890 164,409 1,523,468Southeast 467,187 1,426,394 240,493 262,640 2,396,714Midwest 382,769 1,098,942 197,037 214,554 1,893,303Southwest 388,160 1,121,064 199,813 224,467 1,933,503Mountain Plains 182,238 543,836 93,810 110,312 930,196Western 489,259 1,601,909 251,855 308,274 2,651,296Total 2,417,133 7,400,765 1,244,265 1,420,038 12,482,201
ParticipantsNortheast 178,648 362,348 96,797 67,329 705,122Mid-Atlantic 227,210 450,347 93,625 112,087 883,269Southeast 375,664 576,786 162,763 165,929 1,281,143Midwest 285,560 486,892 112,797 125,437 1,010,685Southwest 301,527 535,725 131,319 152,973 1,121,544Mountain Plains 120,196 228,058 52,539 64,684 465,478Western 411,030 911,153 191,262 230,809 1,744,254Total 1,899,835 3,551,309 841,101 919,249 7,211,494
Coverage RatesNortheast 79.0% 53.6% 83.2% 49.7% 61.1%Mid-Atlantic 80.7% 48.3% 64.6% 68.2% 58.0%Southeast 80.4% 40.4% 67.7% 63.2% 53.5%Midwest 74.6% 44.3% 57.2% 58.5% 53.4%Southwest 77.7% 47.8% 65.7% 68.1% 58.0%Mountain Plains 66.0% 41.9% 56.0% 58.6% 50.0%Western 84.0% 56.9% 75.9% 74.9% 65.8%Total 78.6% 48.0% 67.6% 64.7% 57.8%
Source: 2001 CPS-ASEC, 2000 ACS, Census population estimates, WIC Administrative Data
Table D.4-2000: WIC Eligibles and Coverage Rates by FNS Region and Participant Group, CY 2000
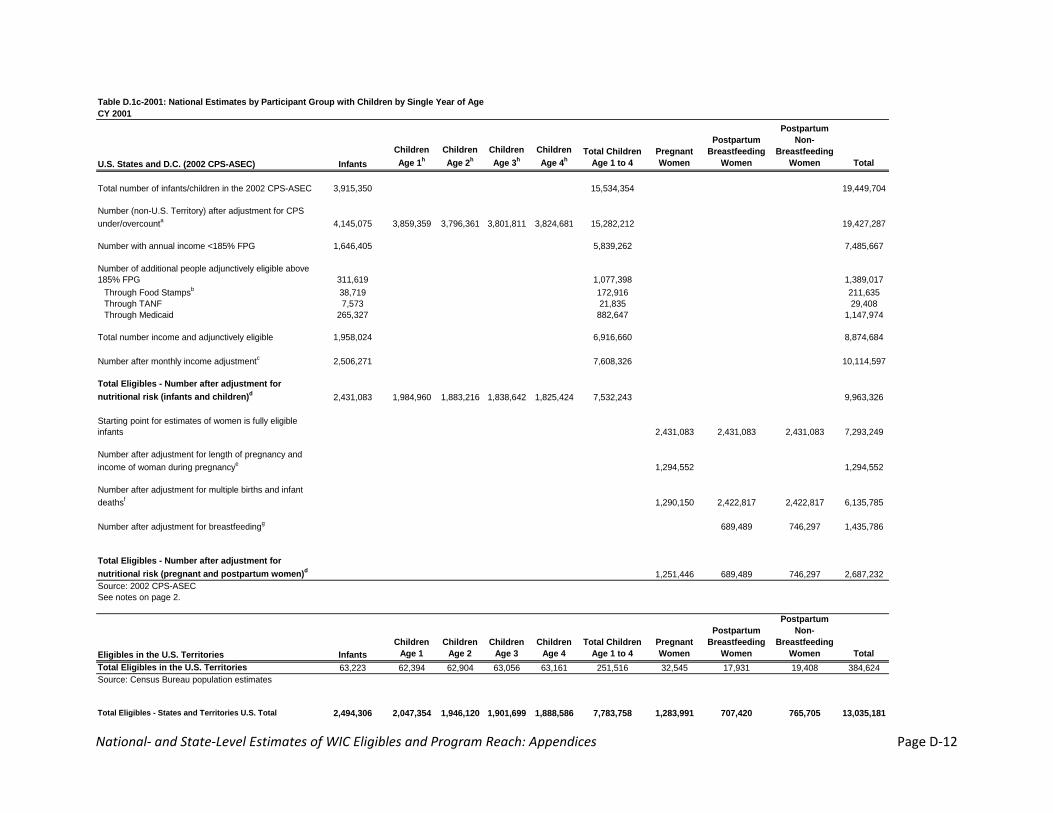
National‐ and State‐Level Estimates of WIC Eligibles and Program Reach: Appendices Page D‐12
Table D.1c-2001: National Estimates by Participant Group with Children by Single Year of AgeCY 2001
U.S. States and D.C. (2002 CPS-ASEC) InfantsChildren Age 1h
Children Age 2h
Children Age 3h
Children Age 4h
Total Children Age 1 to 4
Pregnant Women
Postpartum Breastfeeding
Women
Postpartum Non-
Breastfeeding Women Total
Total number of infants/children in the 2002 CPS-ASEC 3,915,350 15,534,354 19,449,704
Number (non-U.S. Territory) after adjustment for CPS under/overcounta 4,145,075 3,859,359 3,796,361 3,801,811 3,824,681 15,282,212 19,427,287
Number with annual income <185% FPG 1,646,405 5,839,262 7,485,667
Number of additional people adjunctively eligible above 185% FPG 311,619 1,077,398 1,389,017
Through Food Stampsb 38,719 172,916 211,635Through TANF 7,573 21,835 29,408Through Medicaid 265,327 882,647 1,147,974
Total number income and adjunctively eligible 1,958,024 6,916,660 8,874,684
Number after monthly income adjustmentc 2,506,271 7,608,326 10,114,597
Total Eligibles - Number after adjustment for nutritional risk (infants and children)d 2,431,083 1,984,960 1,883,216 1,838,642 1,825,424 7,532,243 9,963,326
Starting point for estimates of women is fully eligible infants 2,431,083 2,431,083 2,431,083 7,293,249
Number after adjustment for length of pregnancy and income of woman during pregnancye 1,294,552 1,294,552
Number after adjustment for multiple births and infant deathsf 1,290,150 2,422,817 2,422,817 6,135,785
Number after adjustment for breastfeedingg 689,489 746,297 1,435,786
Total Eligibles - Number after adjustment for nutritional risk (pregnant and postpartum women)d 1,251,446 689,489 746,297 2,687,232Source: 2002 CPS-ASECSee notes on page 2.
Eligibles in the U.S. Territories InfantsChildren
Age 1Children
Age 2Children
Age 3Children
Age 4Total Children
Age 1 to 4Pregnant Women
Postpartum Breastfeeding
Women
Postpartum Non-
Breastfeeding Women Total
Total Eligibles in the U.S. Territories 63,223 62,394 62,904 63,056 63,161 251,516 32,545 17,931 19,408 384,624Source: Census Bureau population estimates
Total Eligibles - States and Territories U.S. Total 2,494,306 2,047,354 1,946,120 1,901,699 1,888,586 7,783,758 1,283,991 707,420 765,705 13,035,181

National‐ and State‐Level Estimates of WIC Eligibles and Program Reach: Appendices Page D‐13
Notes for Table D.1c-2001: FPG = Federal poverty guidelines a See Tables 3a and 3b for the adjustment factors used to correct for the under/over count of infants and children in the CPS relative to estimates based on the Census. Table 4a compares two years of accumulated CPS and Census estimates for children age 0 to 4 by single years of age, gender, and race (white, black, and other) and calculates adjustment factors based on the ratio of the Census estimate to the CPS estimate. Table 4b shows the impact of the adjustment factors on the original 2002 CPS-ASEC estimates of children age 0 to 4 by single years of age, gender, and race. b There is a hierarchy imposed on the number of infants and children adjunctively eligible for WIC. Any mention of Food Stamps receipt is coded as Food Stamps; if no mention of Food Stamps, but report TANF, coded as TANF. If no mention of Food Stamps or TANF, coded as Medicaid. c The SIPP-based multipliers used to adjust for monthly versus annual income and to account for certification periods are:
Infants: 1.28 Children: 1.10
d The adjustment factors for nutritional risk by participant group are: Infants 0.97
Children 0.99 Pregnant women 0.97
Postpartum breastfeeding women 1.00 Postpartum non-breastfeeding women 1.00
e The multiplier used to adjust for the length of pregnancy and a woman's income during pregnancy is: Pregnancy length and income 0.533
f The multiplier used to adjust for multiple births and infants deaths is: Multiple births and infants death 0.9966
g The multipliers used to adjust for breastfeeding status are: Less than 12 months who breastfeed 0.285
Less than 6 months who do not breastfeed 0.308
h Estimates by single year of age were not previously published for the national WIC eligibility estimates based on the CPS data. In this table, the national total for children has been distributed by single year of age based on ACS tabulations of the population by age for the total adjusted population row and by the estimated number of eligibles for the total eligibles row.
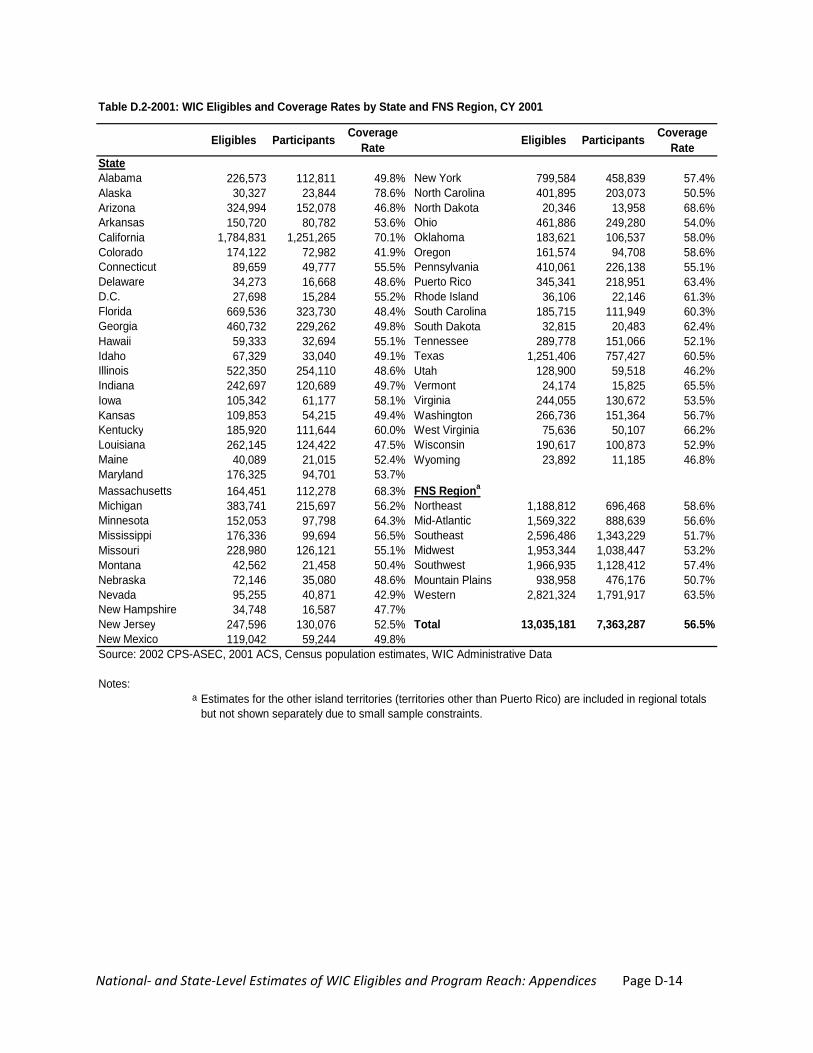
National‐ and State‐Level Estimates of WIC Eligibles and Program Reach: Appendices Page D‐14
Eligibles Participants Coverage Rate Eligibles Participants Coverage
RateStateAlabama 226,573 112,811 49.8% New York 799,584 458,839 57.4%Alaska 30,327 23,844 78.6% North Carolina 401,895 203,073 50.5%Arizona 324,994 152,078 46.8% North Dakota 20,346 13,958 68.6%Arkansas 150,720 80,782 53.6% Ohio 461,886 249,280 54.0%California 1,784,831 1,251,265 70.1% Oklahoma 183,621 106,537 58.0%Colorado 174,122 72,982 41.9% Oregon 161,574 94,708 58.6%Connecticut 89,659 49,777 55.5% Pennsylvania 410,061 226,138 55.1%Delaware 34,273 16,668 48.6% Puerto Rico 345,341 218,951 63.4%D.C. 27,698 15,284 55.2% Rhode Island 36,106 22,146 61.3%Florida 669,536 323,730 48.4% South Carolina 185,715 111,949 60.3%Georgia 460,732 229,262 49.8% South Dakota 32,815 20,483 62.4%Hawaii 59,333 32,694 55.1% Tennessee 289,778 151,066 52.1%Idaho 67,329 33,040 49.1% Texas 1,251,406 757,427 60.5%Illinois 522,350 254,110 48.6% Utah 128,900 59,518 46.2%Indiana 242,697 120,689 49.7% Vermont 24,174 15,825 65.5%Iowa 105,342 61,177 58.1% Virginia 244,055 130,672 53.5%Kansas 109,853 54,215 49.4% Washington 266,736 151,364 56.7%Kentucky 185,920 111,644 60.0% West Virginia 75,636 50,107 66.2%Louisiana 262,145 124,422 47.5% Wisconsin 190,617 100,873 52.9%Maine 40,089 21,015 52.4% Wyoming 23,892 11,185 46.8%Maryland 176,325 94,701 53.7%Massachusetts 164,451 112,278 68.3% FNS Regiona
Michigan 383,741 215,697 56.2% Northeast 1,188,812 696,468 58.6%Minnesota 152,053 97,798 64.3% Mid-Atlantic 1,569,322 888,639 56.6%Mississippi 176,336 99,694 56.5% Southeast 2,596,486 1,343,229 51.7%Missouri 228,980 126,121 55.1% Midwest 1,953,344 1,038,447 53.2%Montana 42,562 21,458 50.4% Southwest 1,966,935 1,128,412 57.4%Nebraska 72,146 35,080 48.6% Mountain Plains 938,958 476,176 50.7%Nevada 95,255 40,871 42.9% Western 2,821,324 1,791,917 63.5%New Hampshire 34,748 16,587 47.7%New Jersey 247,596 130,076 52.5% Total 13,035,181 7,363,287 56.5%New Mexico 119,042 59,244 49.8%Source: 2002 CPS-ASEC, 2001 ACS, Census population estimates, WIC Administrative Data
Notes:a
Table D.2-2001: WIC Eligibles and Coverage Rates by State and FNS Region, CY 2001
Estimates for the other island territories (territories other than Puerto Rico) are included in regional totals but not shown separately due to small sample constraints.
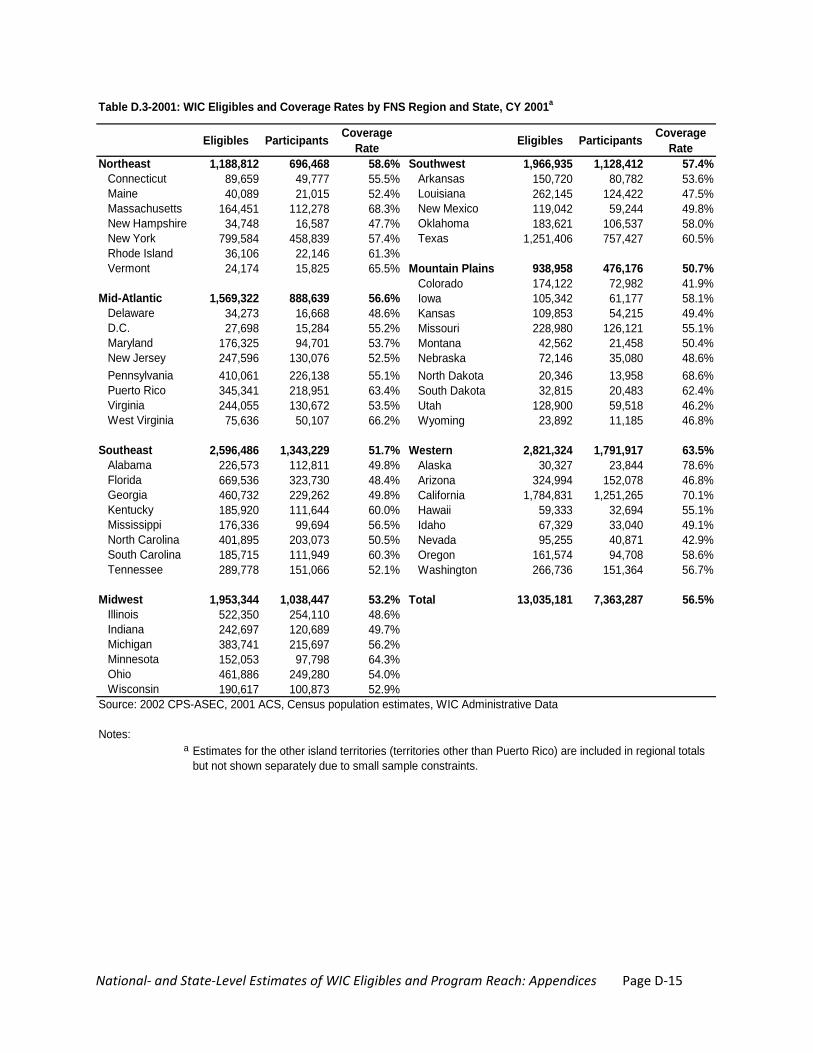
National‐ and State‐Level Estimates of WIC Eligibles and Program Reach: Appendices Page D‐15
Eligibles Participants Coverage Rate Eligibles Participants Coverage
RateNortheast 1,188,812 696,468 58.6% Southwest 1,966,935 1,128,412 57.4%
Connecticut 89,659 49,777 55.5% Arkansas 150,720 80,782 53.6%Maine 40,089 21,015 52.4% Louisiana 262,145 124,422 47.5%Massachusetts 164,451 112,278 68.3% New Mexico 119,042 59,244 49.8%New Hampshire 34,748 16,587 47.7% Oklahoma 183,621 106,537 58.0%New York 799,584 458,839 57.4% Texas 1,251,406 757,427 60.5%Rhode Island 36,106 22,146 61.3%Vermont 24,174 15,825 65.5% Mountain Plains 938,958 476,176 50.7%
Colorado 174,122 72,982 41.9%Mid-Atlantic 1,569,322 888,639 56.6% Iowa 105,342 61,177 58.1%
Delaware 34,273 16,668 48.6% Kansas 109,853 54,215 49.4%D.C. 27,698 15,284 55.2% Missouri 228,980 126,121 55.1%Maryland 176,325 94,701 53.7% Montana 42,562 21,458 50.4%New Jersey 247,596 130,076 52.5% Nebraska 72,146 35,080 48.6%Pennsylvania 410,061 226,138 55.1% North Dakota 20,346 13,958 68.6%Puerto Rico 345,341 218,951 63.4% South Dakota 32,815 20,483 62.4%Virginia 244,055 130,672 53.5% Utah 128,900 59,518 46.2%West Virginia 75,636 50,107 66.2% Wyoming 23,892 11,185 46.8%
Southeast 2,596,486 1,343,229 51.7% Western 2,821,324 1,791,917 63.5%Alabama 226,573 112,811 49.8% Alaska 30,327 23,844 78.6%Florida 669,536 323,730 48.4% Arizona 324,994 152,078 46.8%Georgia 460,732 229,262 49.8% California 1,784,831 1,251,265 70.1%Kentucky 185,920 111,644 60.0% Hawaii 59,333 32,694 55.1%Mississippi 176,336 99,694 56.5% Idaho 67,329 33,040 49.1%North Carolina 401,895 203,073 50.5% Nevada 95,255 40,871 42.9%South Carolina 185,715 111,949 60.3% Oregon 161,574 94,708 58.6%Tennessee 289,778 151,066 52.1% Washington 266,736 151,364 56.7%
Midwest 1,953,344 1,038,447 53.2% Total 13,035,181 7,363,287 56.5%Illinois 522,350 254,110 48.6%Indiana 242,697 120,689 49.7%Michigan 383,741 215,697 56.2%Minnesota 152,053 97,798 64.3%Ohio 461,886 249,280 54.0%Wisconsin 190,617 100,873 52.9%
Source: 2002 CPS-ASEC, 2001 ACS, Census population estimates, WIC Administrative Data
Notes:a
Table D.3-2001: WIC Eligibles and Coverage Rates by FNS Region and State, CY 2001a
Estimates for the other island territories (territories other than Puerto Rico) are included in regional totals but not shown separately due to small sample constraints.
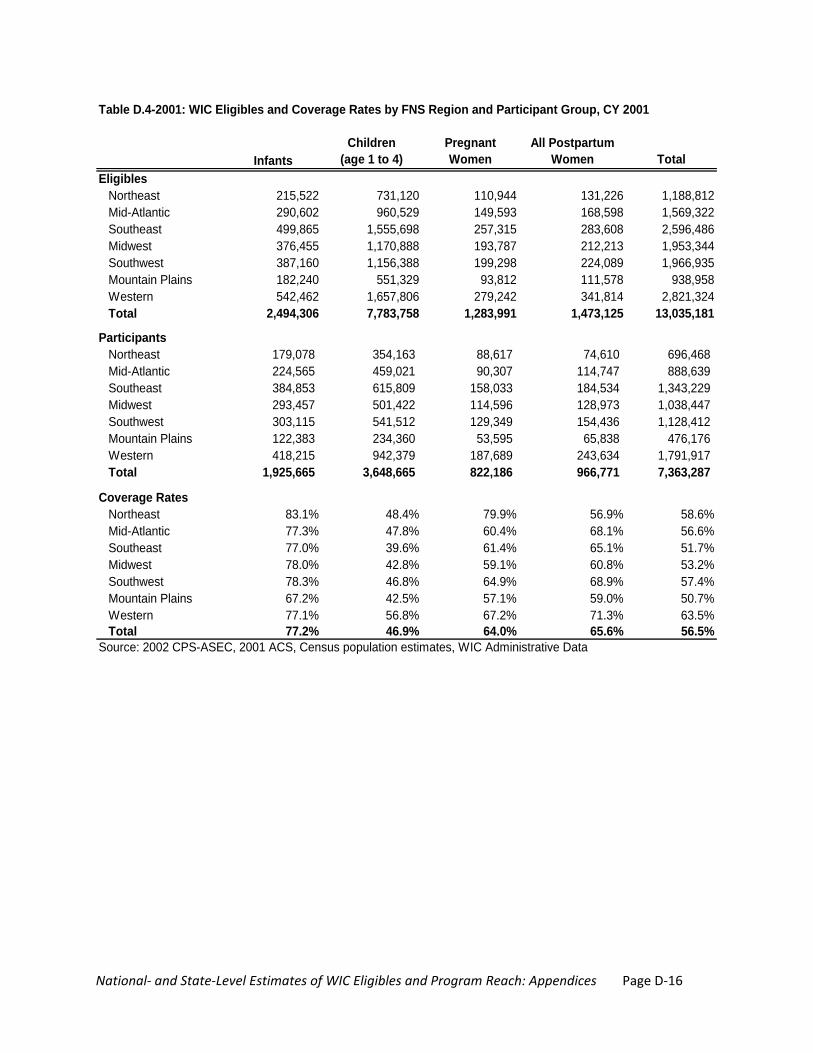
National‐ and State‐Level Estimates of WIC Eligibles and Program Reach: Appendices Page D‐16
InfantsChildren
(age 1 to 4)Pregnant Women
All Postpartum Women Total
EligiblesNortheast 215,522 731,120 110,944 131,226 1,188,812Mid-Atlantic 290,602 960,529 149,593 168,598 1,569,322Southeast 499,865 1,555,698 257,315 283,608 2,596,486Midwest 376,455 1,170,888 193,787 212,213 1,953,344Southwest 387,160 1,156,388 199,298 224,089 1,966,935Mountain Plains 182,240 551,329 93,812 111,578 938,958Western 542,462 1,657,806 279,242 341,814 2,821,324Total 2,494,306 7,783,758 1,283,991 1,473,125 13,035,181
ParticipantsNortheast 179,078 354,163 88,617 74,610 696,468Mid-Atlantic 224,565 459,021 90,307 114,747 888,639Southeast 384,853 615,809 158,033 184,534 1,343,229Midwest 293,457 501,422 114,596 128,973 1,038,447Southwest 303,115 541,512 129,349 154,436 1,128,412Mountain Plains 122,383 234,360 53,595 65,838 476,176Western 418,215 942,379 187,689 243,634 1,791,917Total 1,925,665 3,648,665 822,186 966,771 7,363,287
Coverage RatesNortheast 83.1% 48.4% 79.9% 56.9% 58.6%Mid-Atlantic 77.3% 47.8% 60.4% 68.1% 56.6%Southeast 77.0% 39.6% 61.4% 65.1% 51.7%Midwest 78.0% 42.8% 59.1% 60.8% 53.2%Southwest 78.3% 46.8% 64.9% 68.9% 57.4%Mountain Plains 67.2% 42.5% 57.1% 59.0% 50.7%Western 77.1% 56.8% 67.2% 71.3% 63.5%Total 77.2% 46.9% 64.0% 65.6% 56.5%
Source: 2002 CPS-ASEC, 2001 ACS, Census population estimates, WIC Administrative Data
Table D.4-2001: WIC Eligibles and Coverage Rates by FNS Region and Participant Group, CY 2001

National‐ and State‐Level Estimates of WIC Eligibles and Program Reach: Appendices Page D‐17
Table D.1c-2002: National Estimates by Participant Group with Children by Single Year of AgeCY 2002
U.S. States and D.C. (2003 CPS-ASEC) InfantsChildren Age 1h
Children Age 2h
Children Age 3h
Children Age 4h
Total Children Age 1 to 4
Pregnant Women
Postpartum Breastfeeding
Women
Postpartum Non-
Breastfeeding Women Total
Total number of infants/children in the 2003 CPS-ASEC 3,377,303 16,410,094 19,787,397
Number (non-U.S. Territory) after adjustment for CPS under/overcounta 3,584,514 4,178,125 4,024,191 3,961,386 3,969,562 16,133,264 19,717,778
Number with annual income <185% FPG 1,444,500 6,181,379 7,625,879
Number of additional people adjunctively eligible above 185% FPG 281,582 1,256,075 1,537,657
Through Food Stampsb 47,922 208,837 256,759Through TANF 9,080 26,119 35,199Through Medicaid 224,580 1,021,119 1,245,699
Total number income and adjunctively eligible 1,726,082 7,437,454 9,163,536
Number after monthly income adjustmentc 2,209,385 8,181,199 10,390,584
Total Eligibles - Number after adjustment for nutritional risk (infants and children)d 2,143,103 2,152,419 2,045,105 1,966,273 1,935,591 8,099,387 10,242,491
Starting point for estimates of women is fully eligible infants 2,143,103 2,143,103 2,143,103 6,429,309
Number after adjustment for length of pregnancy and income of woman during pregnancye 1,141,202 1,141,202
Number after adjustment for multiple births and infant deathsf 1,137,322 2,135,817 2,135,817 5,408,956
Number after adjustment for breastfeedingg 624,403 653,665 1,278,068
Total Eligibles - Number after adjustment for nutritional risk (pregnant and postpartum women)e 1,103,203 624,403 653,665 2,381,271Source: 2003 CPS-ASECSee notes on page 2.
Eligibles in the U.S. Territories InfantsChildren
Age 1Children
Age 2Children
Age 3Children
Age 4Total Children
Age 1 to 4Pregnant Women
Postpartum Breastfeeding
Women
Postpartum Non-
Breastfeeding Women Total
Total Eligibles in the U.S. Territories 60,004 59,432 59,867 60,201 60,393 239,892 30,888 17,483 18,302 366,570Source: Census Bureau population estimates
Total Eligibles - States and Territories U.S. Total 2,203,108 2,211,850 2,104,972 2,026,474 1,995,984 8,339,280 1,134,091 641,885 671,967 12,990,331
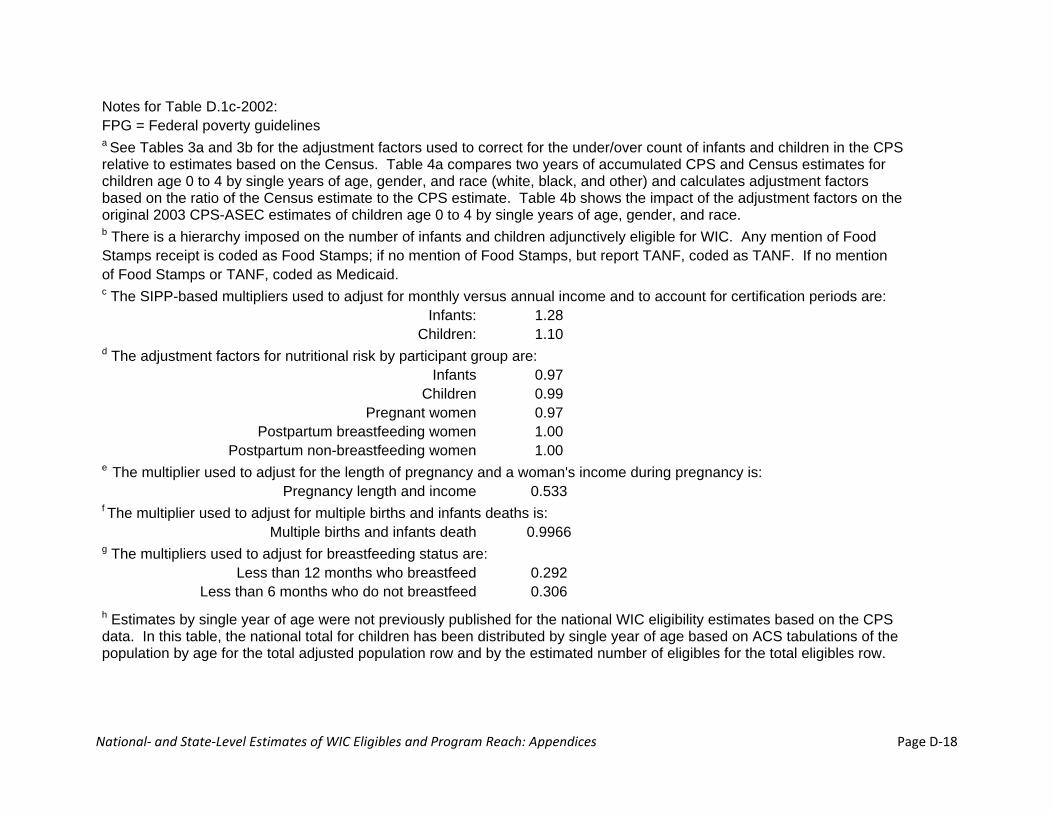
National‐ and State‐Level Estimates of WIC Eligibles and Program Reach: Appendices Page D‐18
Notes for Table D.1c-2002: FPG = Federal poverty guidelines a See Tables 3a and 3b for the adjustment factors used to correct for the under/over count of infants and children in the CPS relative to estimates based on the Census. Table 4a compares two years of accumulated CPS and Census estimates for children age 0 to 4 by single years of age, gender, and race (white, black, and other) and calculates adjustment factors based on the ratio of the Census estimate to the CPS estimate. Table 4b shows the impact of the adjustment factors on the original 2003 CPS-ASEC estimates of children age 0 to 4 by single years of age, gender, and race. b There is a hierarchy imposed on the number of infants and children adjunctively eligible for WIC. Any mention of Food Stamps receipt is coded as Food Stamps; if no mention of Food Stamps, but report TANF, coded as TANF. If no mention of Food Stamps or TANF, coded as Medicaid. c The SIPP-based multipliers used to adjust for monthly versus annual income and to account for certification periods are:
Infants: 1.28 Children: 1.10
d The adjustment factors for nutritional risk by participant group are: Infants 0.97
Children 0.99 Pregnant women 0.97
Postpartum breastfeeding women 1.00 Postpartum non-breastfeeding women 1.00
e The multiplier used to adjust for the length of pregnancy and a woman's income during pregnancy is: Pregnancy length and income 0.533
f The multiplier used to adjust for multiple births and infants deaths is: Multiple births and infants death 0.9966
g The multipliers used to adjust for breastfeeding status are: Less than 12 months who breastfeed 0.292
Less than 6 months who do not breastfeed 0.306 h Estimates by single year of age were not previously published for the national WIC eligibility estimates based on the CPS data. In this table, the national total for children has been distributed by single year of age based on ACS tabulations of the population by age for the total adjusted population row and by the estimated number of eligibles for the total eligibles row.
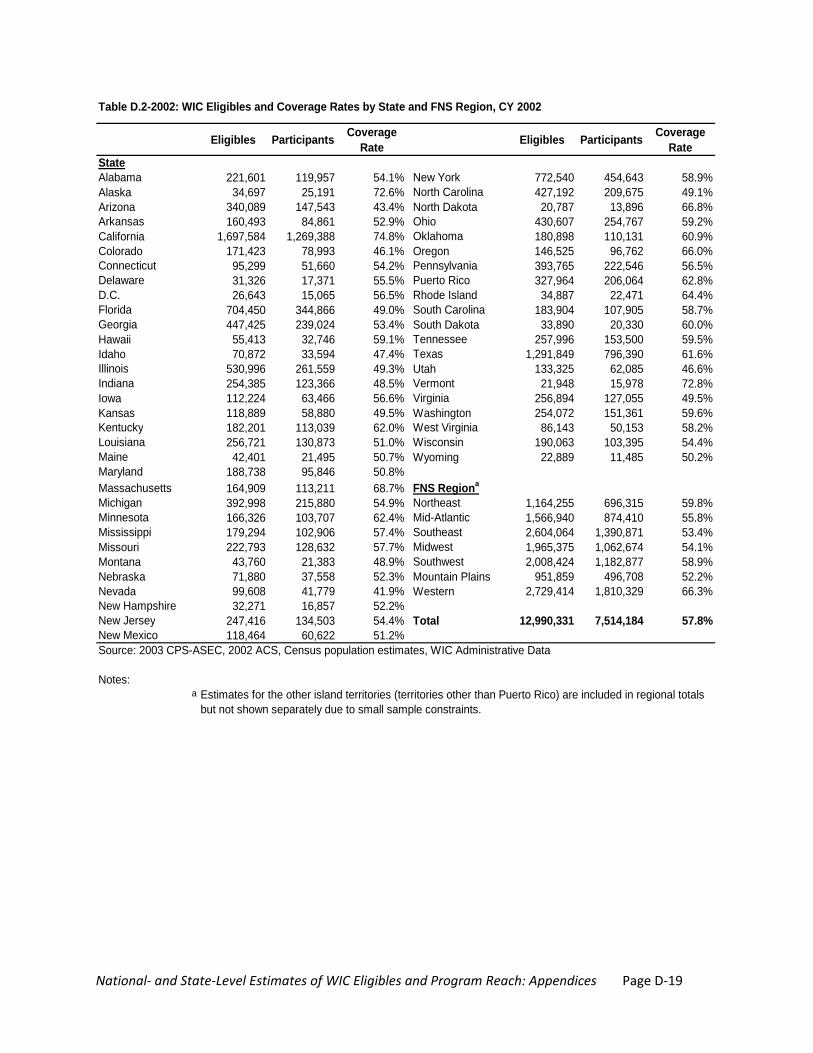
National‐ and State‐Level Estimates of WIC Eligibles and Program Reach: Appendices Page D‐19
Eligibles Participants Coverage Rate Eligibles Participants Coverage
RateStateAlabama 221,601 119,957 54.1% New York 772,540 454,643 58.9%Alaska 34,697 25,191 72.6% North Carolina 427,192 209,675 49.1%Arizona 340,089 147,543 43.4% North Dakota 20,787 13,896 66.8%Arkansas 160,493 84,861 52.9% Ohio 430,607 254,767 59.2%California 1,697,584 1,269,388 74.8% Oklahoma 180,898 110,131 60.9%Colorado 171,423 78,993 46.1% Oregon 146,525 96,762 66.0%Connecticut 95,299 51,660 54.2% Pennsylvania 393,765 222,546 56.5%Delaware 31,326 17,371 55.5% Puerto Rico 327,964 206,064 62.8%D.C. 26,643 15,065 56.5% Rhode Island 34,887 22,471 64.4%Florida 704,450 344,866 49.0% South Carolina 183,904 107,905 58.7%Georgia 447,425 239,024 53.4% South Dakota 33,890 20,330 60.0%Hawaii 55,413 32,746 59.1% Tennessee 257,996 153,500 59.5%Idaho 70,872 33,594 47.4% Texas 1,291,849 796,390 61.6%Illinois 530,996 261,559 49.3% Utah 133,325 62,085 46.6%Indiana 254,385 123,366 48.5% Vermont 21,948 15,978 72.8%Iowa 112,224 63,466 56.6% Virginia 256,894 127,055 49.5%Kansas 118,889 58,880 49.5% Washington 254,072 151,361 59.6%Kentucky 182,201 113,039 62.0% West Virginia 86,143 50,153 58.2%Louisiana 256,721 130,873 51.0% Wisconsin 190,063 103,395 54.4%Maine 42,401 21,495 50.7% Wyoming 22,889 11,485 50.2%Maryland 188,738 95,846 50.8%Massachusetts 164,909 113,211 68.7% FNS Regiona
Michigan 392,998 215,880 54.9% Northeast 1,164,255 696,315 59.8%Minnesota 166,326 103,707 62.4% Mid-Atlantic 1,566,940 874,410 55.8%Mississippi 179,294 102,906 57.4% Southeast 2,604,064 1,390,871 53.4%Missouri 222,793 128,632 57.7% Midwest 1,965,375 1,062,674 54.1%Montana 43,760 21,383 48.9% Southwest 2,008,424 1,182,877 58.9%Nebraska 71,880 37,558 52.3% Mountain Plains 951,859 496,708 52.2%Nevada 99,608 41,779 41.9% Western 2,729,414 1,810,329 66.3%New Hampshire 32,271 16,857 52.2%New Jersey 247,416 134,503 54.4% Total 12,990,331 7,514,184 57.8%New Mexico 118,464 60,622 51.2%Source: 2003 CPS-ASEC, 2002 ACS, Census population estimates, WIC Administrative Data
Notes:a
Table D.2-2002: WIC Eligibles and Coverage Rates by State and FNS Region, CY 2002
Estimates for the other island territories (territories other than Puerto Rico) are included in regional totals but not shown separately due to small sample constraints.
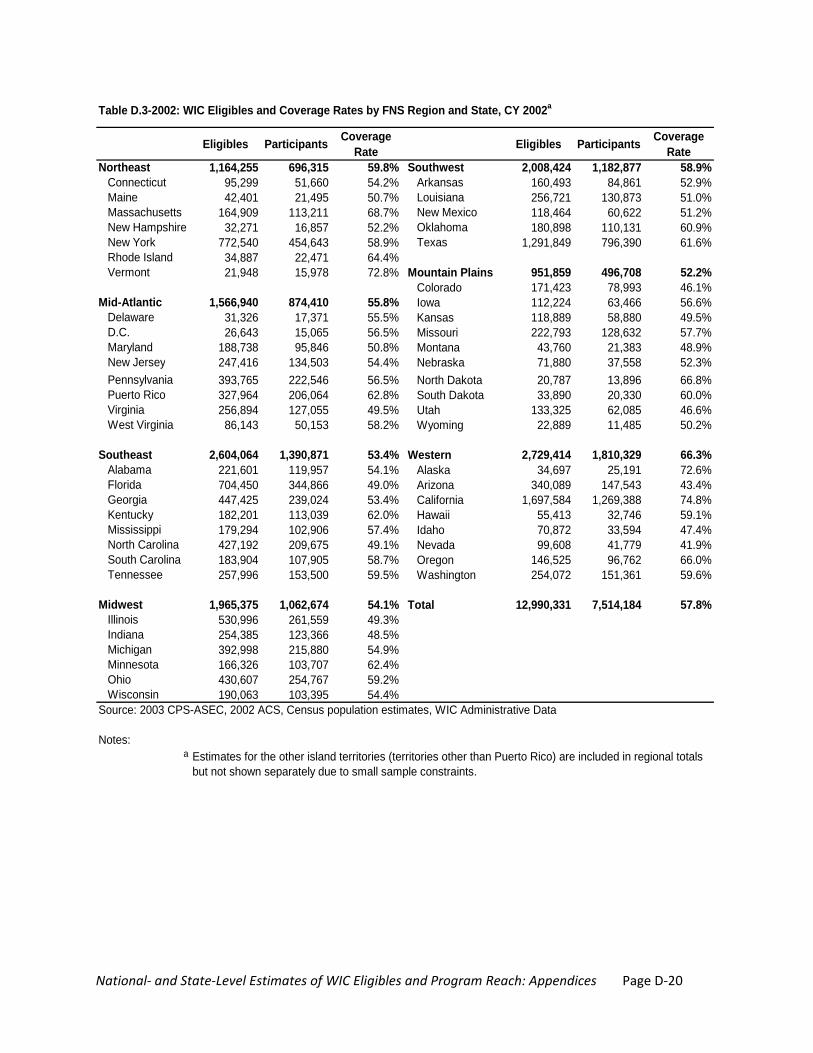
National‐ and State‐Level Estimates of WIC Eligibles and Program Reach: Appendices Page D‐20
Eligibles Participants Coverage Rate Eligibles Participants Coverage
RateNortheast 1,164,255 696,315 59.8% Southwest 2,008,424 1,182,877 58.9%
Connecticut 95,299 51,660 54.2% Arkansas 160,493 84,861 52.9%Maine 42,401 21,495 50.7% Louisiana 256,721 130,873 51.0%Massachusetts 164,909 113,211 68.7% New Mexico 118,464 60,622 51.2%New Hampshire 32,271 16,857 52.2% Oklahoma 180,898 110,131 60.9%New York 772,540 454,643 58.9% Texas 1,291,849 796,390 61.6%Rhode Island 34,887 22,471 64.4%Vermont 21,948 15,978 72.8% Mountain Plains 951,859 496,708 52.2%
Colorado 171,423 78,993 46.1%Mid-Atlantic 1,566,940 874,410 55.8% Iowa 112,224 63,466 56.6%
Delaware 31,326 17,371 55.5% Kansas 118,889 58,880 49.5%D.C. 26,643 15,065 56.5% Missouri 222,793 128,632 57.7%Maryland 188,738 95,846 50.8% Montana 43,760 21,383 48.9%New Jersey 247,416 134,503 54.4% Nebraska 71,880 37,558 52.3%Pennsylvania 393,765 222,546 56.5% North Dakota 20,787 13,896 66.8%Puerto Rico 327,964 206,064 62.8% South Dakota 33,890 20,330 60.0%Virginia 256,894 127,055 49.5% Utah 133,325 62,085 46.6%West Virginia 86,143 50,153 58.2% Wyoming 22,889 11,485 50.2%
Southeast 2,604,064 1,390,871 53.4% Western 2,729,414 1,810,329 66.3%Alabama 221,601 119,957 54.1% Alaska 34,697 25,191 72.6%Florida 704,450 344,866 49.0% Arizona 340,089 147,543 43.4%Georgia 447,425 239,024 53.4% California 1,697,584 1,269,388 74.8%Kentucky 182,201 113,039 62.0% Hawaii 55,413 32,746 59.1%Mississippi 179,294 102,906 57.4% Idaho 70,872 33,594 47.4%North Carolina 427,192 209,675 49.1% Nevada 99,608 41,779 41.9%South Carolina 183,904 107,905 58.7% Oregon 146,525 96,762 66.0%Tennessee 257,996 153,500 59.5% Washington 254,072 151,361 59.6%
Midwest 1,965,375 1,062,674 54.1% Total 12,990,331 7,514,184 57.8%Illinois 530,996 261,559 49.3%Indiana 254,385 123,366 48.5%Michigan 392,998 215,880 54.9%Minnesota 166,326 103,707 62.4%Ohio 430,607 254,767 59.2%Wisconsin 190,063 103,395 54.4%
Source: 2003 CPS-ASEC, 2002 ACS, Census population estimates, WIC Administrative Data
Notes:a
Table D.3-2002: WIC Eligibles and Coverage Rates by FNS Region and State, CY 2002a
Estimates for the other island territories (territories other than Puerto Rico) are included in regional totals but not shown separately due to small sample constraints.
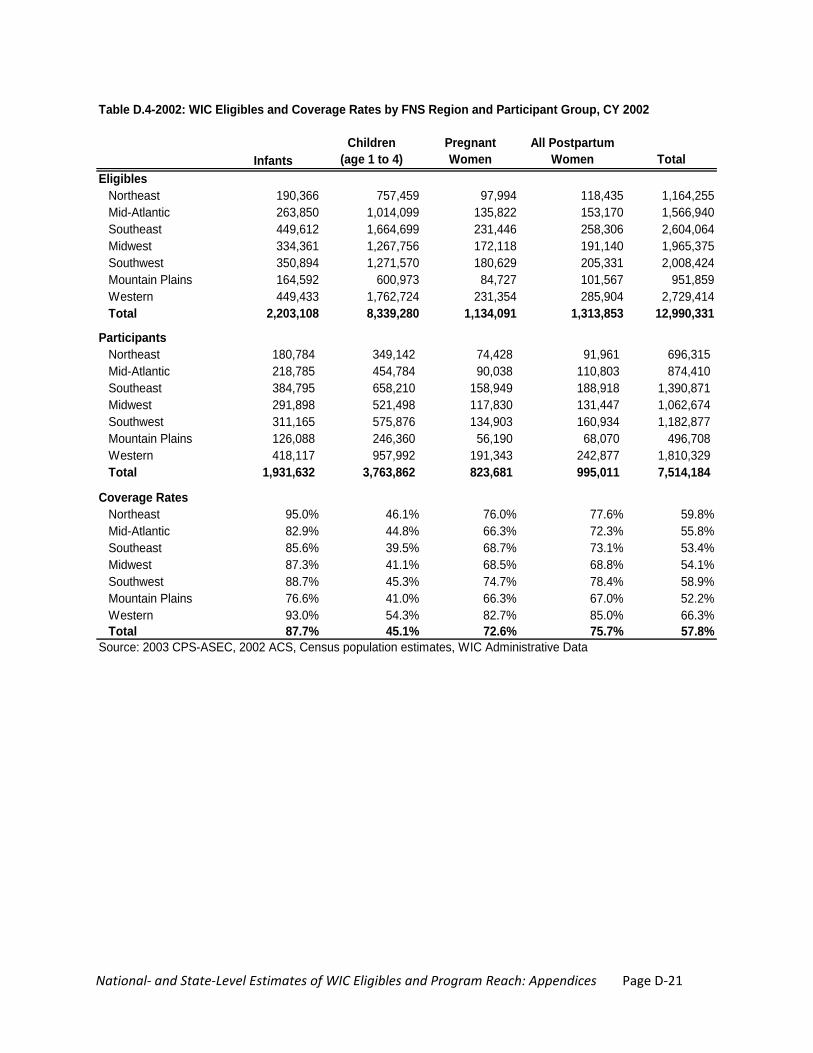
National‐ and State‐Level Estimates of WIC Eligibles and Program Reach: Appendices Page D‐21
InfantsChildren
(age 1 to 4)Pregnant Women
All Postpartum Women Total
EligiblesNortheast 190,366 757,459 97,994 118,435 1,164,255Mid-Atlantic 263,850 1,014,099 135,822 153,170 1,566,940Southeast 449,612 1,664,699 231,446 258,306 2,604,064Midwest 334,361 1,267,756 172,118 191,140 1,965,375Southwest 350,894 1,271,570 180,629 205,331 2,008,424Mountain Plains 164,592 600,973 84,727 101,567 951,859Western 449,433 1,762,724 231,354 285,904 2,729,414Total 2,203,108 8,339,280 1,134,091 1,313,853 12,990,331
ParticipantsNortheast 180,784 349,142 74,428 91,961 696,315Mid-Atlantic 218,785 454,784 90,038 110,803 874,410Southeast 384,795 658,210 158,949 188,918 1,390,871Midwest 291,898 521,498 117,830 131,447 1,062,674Southwest 311,165 575,876 134,903 160,934 1,182,877Mountain Plains 126,088 246,360 56,190 68,070 496,708Western 418,117 957,992 191,343 242,877 1,810,329Total 1,931,632 3,763,862 823,681 995,011 7,514,184
Coverage RatesNortheast 95.0% 46.1% 76.0% 77.6% 59.8%Mid-Atlantic 82.9% 44.8% 66.3% 72.3% 55.8%Southeast 85.6% 39.5% 68.7% 73.1% 53.4%Midwest 87.3% 41.1% 68.5% 68.8% 54.1%Southwest 88.7% 45.3% 74.7% 78.4% 58.9%Mountain Plains 76.6% 41.0% 66.3% 67.0% 52.2%Western 93.0% 54.3% 82.7% 85.0% 66.3%Total 87.7% 45.1% 72.6% 75.7% 57.8%
Source: 2003 CPS-ASEC, 2002 ACS, Census population estimates, WIC Administrative Data
Table D.4-2002: WIC Eligibles and Coverage Rates by FNS Region and Participant Group, CY 2002
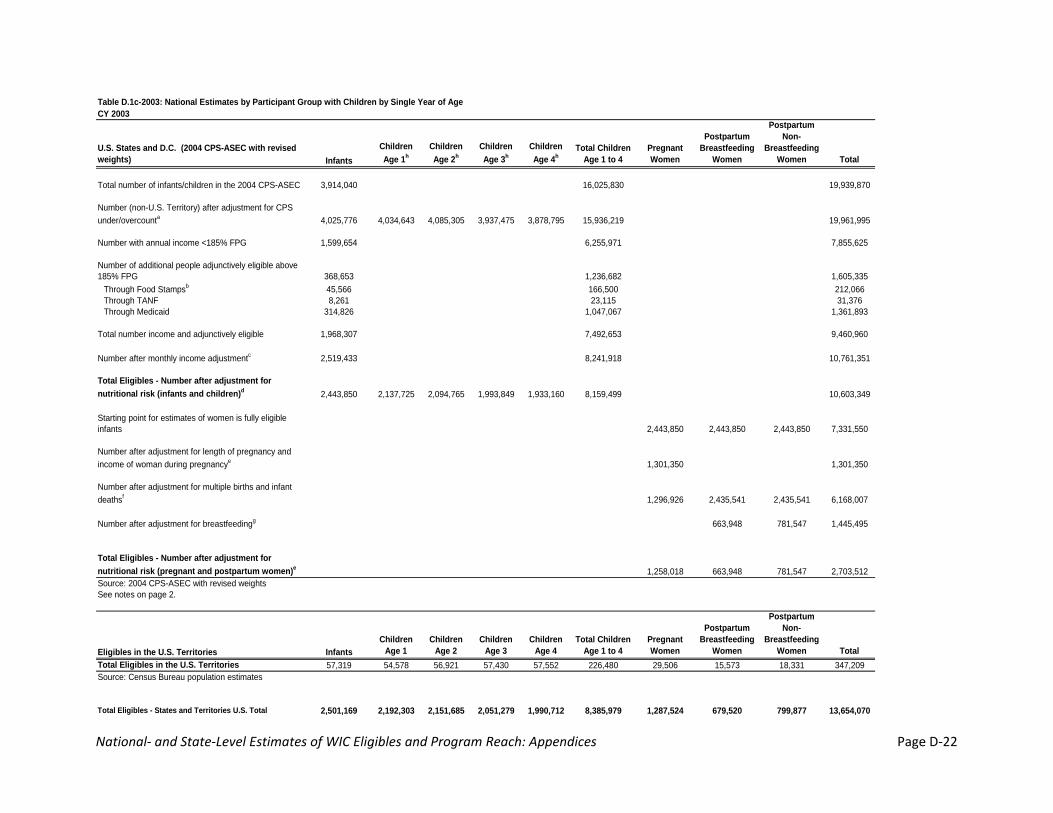
National‐ and State‐Level Estimates of WIC Eligibles and Program Reach: Appendices Page D‐22
Table D.1c-2003: National Estimates by Participant Group with Children by Single Year of AgeCY 2003
U.S. States and D.C. (2004 CPS-ASEC with revised weights) Infants
Children Age 1h
Children Age 2h
Children Age 3h
Children Age 4h
Total Children Age 1 to 4
Pregnant Women
Postpartum Breastfeeding
Women
Postpartum Non-
Breastfeeding Women Total
Total number of infants/children in the 2004 CPS-ASEC 3,914,040 16,025,830 19,939,870
Number (non-U.S. Territory) after adjustment for CPS under/overcounta 4,025,776 4,034,643 4,085,305 3,937,475 3,878,795 15,936,219 19,961,995
Number with annual income <185% FPG 1,599,654 6,255,971 7,855,625
Number of additional people adjunctively eligible above 185% FPG 368,653 1,236,682 1,605,335
Through Food Stampsb 45,566 166,500 212,066Through TANF 8,261 23,115 31,376Through Medicaid 314,826 1,047,067 1,361,893
Total number income and adjunctively eligible 1,968,307 7,492,653 9,460,960
Number after monthly income adjustmentc 2,519,433 8,241,918 10,761,351
Total Eligibles - Number after adjustment for nutritional risk (infants and children)d 2,443,850 2,137,725 2,094,765 1,993,849 1,933,160 8,159,499 10,603,349
Starting point for estimates of women is fully eligible infants 2,443,850 2,443,850 2,443,850 7,331,550
Number after adjustment for length of pregnancy and income of woman during pregnancye 1,301,350 1,301,350
Number after adjustment for multiple births and infant deathsf 1,296,926 2,435,541 2,435,541 6,168,007
Number after adjustment for breastfeedingg 663,948 781,547 1,445,495
Total Eligibles - Number after adjustment for nutritional risk (pregnant and postpartum women)e 1,258,018 663,948 781,547 2,703,512Source: 2004 CPS-ASEC with revised weightsSee notes on page 2.
Eligibles in the U.S. Territories InfantsChildren
Age 1Children
Age 2Children
Age 3Children
Age 4Total Children
Age 1 to 4Pregnant Women
Postpartum Breastfeeding
Women
Postpartum Non-
Breastfeeding Women Total
Total Eligibles in the U.S. Territories 57,319 54,578 56,921 57,430 57,552 226,480 29,506 15,573 18,331 347,209Source: Census Bureau population estimates
Total Eligibles - States and Territories U.S. Total 2,501,169 2,192,303 2,151,685 2,051,279 1,990,712 8,385,979 1,287,524 679,520 799,877 13,654,070

National‐ and State‐Level Estimates of WIC Eligibles and Program Reach: Appendices Page D‐23
Notes for Table D.1c-2003: FPG = Federal poverty guidelines a See Tables 3a and 3b for the adjustment factors used to correct for the under/over count of infants and children in the CPS relative to estimates based on the Census. Table 4a compares two years of accumulated CPS and Census estimates for children age 0 to 4 by single years of age, gender, and race (white, black, and other) and calculates adjustment factors based on the ratio of the Census estimate to the CPS estimate. Table 4b shows the impact of the adjustment factors on the original 2004 CPS-ASEC estimates of children age 0 to 4 by single years of age, gender, and race. b There is a hierarchy imposed on the number of infants and children adjunctively eligible for WIC. Any mention of Food Stamps receipt is coded as Food Stamps; if no mention of Food Stamps, but report TANF, coded as TANF. If no mention of Food Stamps or TANF, coded as Medicaid. c The SIPP-based multipliers used to adjust for monthly versus annual income and to account for certification periods are:
Infants: 1.28 Children: 1.10
d The adjustment factors for nutritional risk by participant group are: Infants 0.97
Children 0.99 Pregnant women 0.97
Postpartum breastfeeding women 1.00 Postpartum non-breastfeeding women 1.00
e The multiplier used to adjust for the length of pregnancy and a woman's income during pregnancy is: Pregnancy length and income 0.533
f The multiplier used to adjust for multiple births and infants deaths is: Multiple births and infants death 0.9966
g The multipliers used to adjust for breastfeeding status are: Less than 12 months who breastfeed 0.273
Less than 6 months who do not breastfeed 0.321 h Estimates by single year of age were not previously published for the national WIC eligibility estimates based on the CPS data. In this table, the national total for children has been distributed by single year of age based on ACS tabulations of the population by age for the total adjusted population row and by the estimated number of eligibles for the total eligibles row.
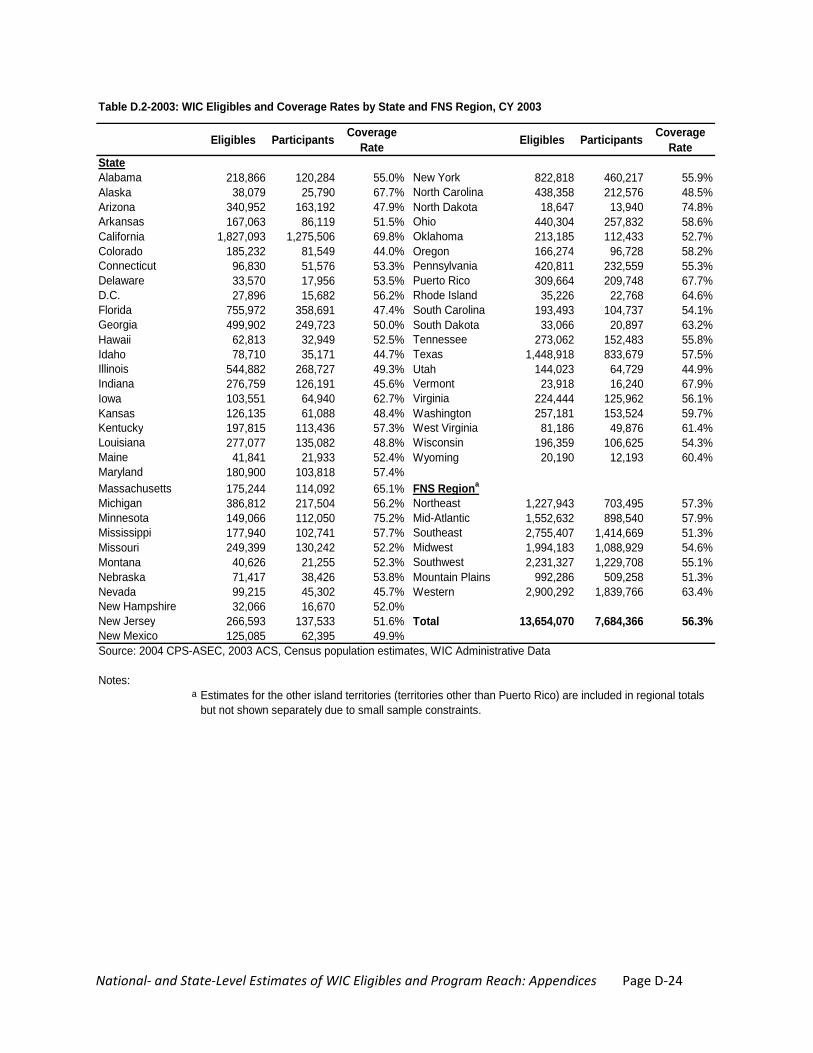
National‐ and State‐Level Estimates of WIC Eligibles and Program Reach: Appendices Page D‐24
Eligibles Participants Coverage Rate Eligibles Participants Coverage
RateStateAlabama 218,866 120,284 55.0% New York 822,818 460,217 55.9%Alaska 38,079 25,790 67.7% North Carolina 438,358 212,576 48.5%Arizona 340,952 163,192 47.9% North Dakota 18,647 13,940 74.8%Arkansas 167,063 86,119 51.5% Ohio 440,304 257,832 58.6%California 1,827,093 1,275,506 69.8% Oklahoma 213,185 112,433 52.7%Colorado 185,232 81,549 44.0% Oregon 166,274 96,728 58.2%Connecticut 96,830 51,576 53.3% Pennsylvania 420,811 232,559 55.3%Delaware 33,570 17,956 53.5% Puerto Rico 309,664 209,748 67.7%D.C. 27,896 15,682 56.2% Rhode Island 35,226 22,768 64.6%Florida 755,972 358,691 47.4% South Carolina 193,493 104,737 54.1%Georgia 499,902 249,723 50.0% South Dakota 33,066 20,897 63.2%Hawaii 62,813 32,949 52.5% Tennessee 273,062 152,483 55.8%Idaho 78,710 35,171 44.7% Texas 1,448,918 833,679 57.5%Illinois 544,882 268,727 49.3% Utah 144,023 64,729 44.9%Indiana 276,759 126,191 45.6% Vermont 23,918 16,240 67.9%Iowa 103,551 64,940 62.7% Virginia 224,444 125,962 56.1%Kansas 126,135 61,088 48.4% Washington 257,181 153,524 59.7%Kentucky 197,815 113,436 57.3% West Virginia 81,186 49,876 61.4%Louisiana 277,077 135,082 48.8% Wisconsin 196,359 106,625 54.3%Maine 41,841 21,933 52.4% Wyoming 20,190 12,193 60.4%Maryland 180,900 103,818 57.4%Massachusetts 175,244 114,092 65.1% FNS Regiona
Michigan 386,812 217,504 56.2% Northeast 1,227,943 703,495 57.3%Minnesota 149,066 112,050 75.2% Mid-Atlantic 1,552,632 898,540 57.9%Mississippi 177,940 102,741 57.7% Southeast 2,755,407 1,414,669 51.3%Missouri 249,399 130,242 52.2% Midwest 1,994,183 1,088,929 54.6%Montana 40,626 21,255 52.3% Southwest 2,231,327 1,229,708 55.1%Nebraska 71,417 38,426 53.8% Mountain Plains 992,286 509,258 51.3%Nevada 99,215 45,302 45.7% Western 2,900,292 1,839,766 63.4%New Hampshire 32,066 16,670 52.0%New Jersey 266,593 137,533 51.6% Total 13,654,070 7,684,366 56.3%New Mexico 125,085 62,395 49.9%Source: 2004 CPS-ASEC, 2003 ACS, Census population estimates, WIC Administrative Data
Notes:a
Table D.2-2003: WIC Eligibles and Coverage Rates by State and FNS Region, CY 2003
Estimates for the other island territories (territories other than Puerto Rico) are included in regional totals but not shown separately due to small sample constraints.

National‐ and State‐Level Estimates of WIC Eligibles and Program Reach: Appendices Page D‐25
Eligibles Participants Coverage Rate Eligibles Participants Coverage
RateNortheast 1,227,943 703,495 57.3% Southwest 2,231,327 1,229,708 55.1%
Connecticut 96,830 51,576 53.3% Arkansas 167,063 86,119 51.5%Maine 41,841 21,933 52.4% Louisiana 277,077 135,082 48.8%Massachusetts 175,244 114,092 65.1% New Mexico 125,085 62,395 49.9%New Hampshire 32,066 16,670 52.0% Oklahoma 213,185 112,433 52.7%New York 822,818 460,217 55.9% Texas 1,448,918 833,679 57.5%Rhode Island 35,226 22,768 64.6%Vermont 23,918 16,240 67.9% Mountain Plains 992,286 509,258 51.3%
Colorado 185,232 81,549 44.0%Mid-Atlantic 1,552,632 898,540 57.9% Iowa 103,551 64,940 62.7%
Delaware 33,570 17,956 53.5% Kansas 126,135 61,088 48.4%D.C. 27,896 15,682 56.2% Missouri 249,399 130,242 52.2%Maryland 180,900 103,818 57.4% Montana 40,626 21,255 52.3%New Jersey 266,593 137,533 51.6% Nebraska 71,417 38,426 53.8%Pennsylvania 420,811 232,559 55.3% North Dakota 18,647 13,940 74.8%Puerto Rico 309,664 209,748 67.7% South Dakota 33,066 20,897 63.2%Virginia 224,444 125,962 56.1% Utah 144,023 64,729 44.9%West Virginia 81,186 49,876 61.4% Wyoming 20,190 12,193 60.4%
Southeast 2,755,407 1,414,669 51.3% Western 2,900,292 1,839,766 63.4%Alabama 218,866 120,284 55.0% Alaska 38,079 25,790 67.7%Florida 755,972 358,691 47.4% Arizona 340,952 163,192 47.9%Georgia 499,902 249,723 50.0% California 1,827,093 1,275,506 69.8%Kentucky 197,815 113,436 57.3% Hawaii 62,813 32,949 52.5%Mississippi 177,940 102,741 57.7% Idaho 78,710 35,171 44.7%North Carolina 438,358 212,576 48.5% Nevada 99,215 45,302 45.7%South Carolina 193,493 104,737 54.1% Oregon 166,274 96,728 58.2%Tennessee 273,062 152,483 55.8% Washington 257,181 153,524 59.7%
Midwest 1,994,183 1,088,929 54.6% Total 13,654,070 7,684,366 56.3%Illinois 544,882 268,727 49.3%Indiana 276,759 126,191 45.6%Michigan 386,812 217,504 56.2%Minnesota 149,066 112,050 75.2%Ohio 440,304 257,832 58.6%Wisconsin 196,359 106,625 54.3%
Source: 2004 CPS-ASEC, 2003 ACS, Census population estimates, WIC Administrative Data
Notes:a
Table D.3-2003: WIC Eligibles and Coverage Rates by FNS Region and State, CY 2003a
Estimates for the other island territories (territories other than Puerto Rico) are included in regional totals but not shown separately due to small sample constraints.
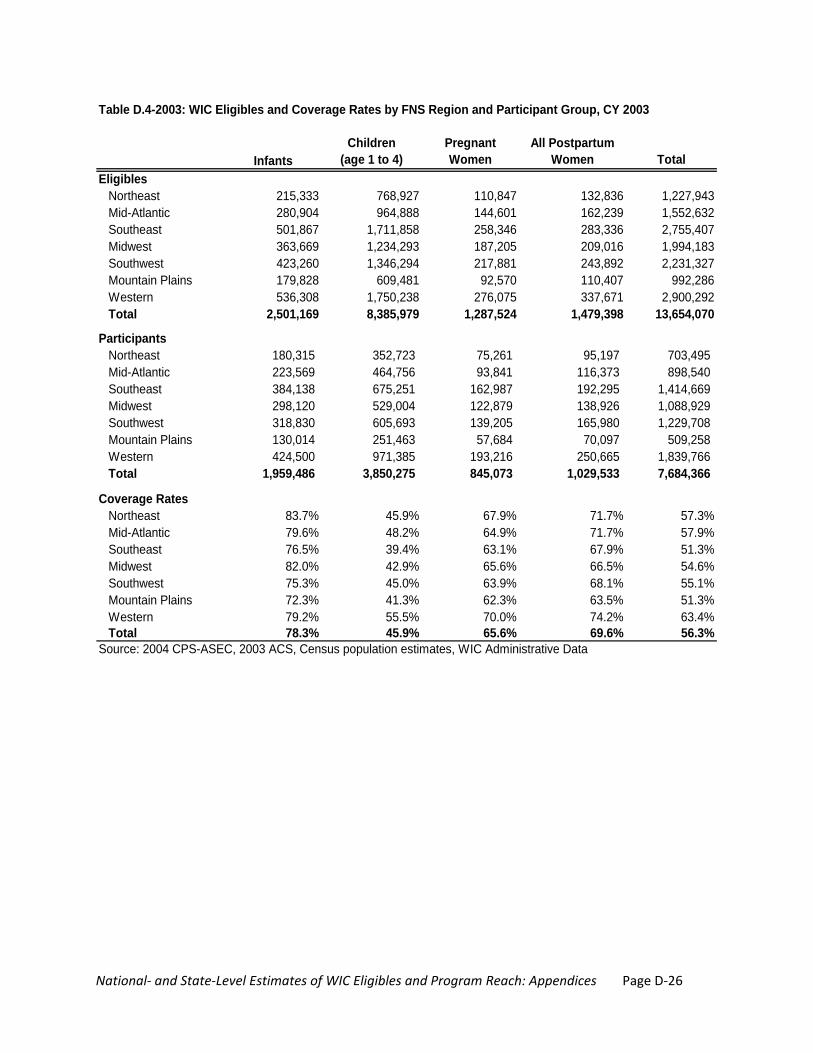
National‐ and State‐Level Estimates of WIC Eligibles and Program Reach: Appendices Page D‐26
InfantsChildren
(age 1 to 4)Pregnant Women
All Postpartum Women Total
EligiblesNortheast 215,333 768,927 110,847 132,836 1,227,943Mid-Atlantic 280,904 964,888 144,601 162,239 1,552,632Southeast 501,867 1,711,858 258,346 283,336 2,755,407Midwest 363,669 1,234,293 187,205 209,016 1,994,183Southwest 423,260 1,346,294 217,881 243,892 2,231,327Mountain Plains 179,828 609,481 92,570 110,407 992,286Western 536,308 1,750,238 276,075 337,671 2,900,292Total 2,501,169 8,385,979 1,287,524 1,479,398 13,654,070
ParticipantsNortheast 180,315 352,723 75,261 95,197 703,495Mid-Atlantic 223,569 464,756 93,841 116,373 898,540Southeast 384,138 675,251 162,987 192,295 1,414,669Midwest 298,120 529,004 122,879 138,926 1,088,929Southwest 318,830 605,693 139,205 165,980 1,229,708Mountain Plains 130,014 251,463 57,684 70,097 509,258Western 424,500 971,385 193,216 250,665 1,839,766Total 1,959,486 3,850,275 845,073 1,029,533 7,684,366
Coverage RatesNortheast 83.7% 45.9% 67.9% 71.7% 57.3%Mid-Atlantic 79.6% 48.2% 64.9% 71.7% 57.9%Southeast 76.5% 39.4% 63.1% 67.9% 51.3%Midwest 82.0% 42.9% 65.6% 66.5% 54.6%Southwest 75.3% 45.0% 63.9% 68.1% 55.1%Mountain Plains 72.3% 41.3% 62.3% 63.5% 51.3%Western 79.2% 55.5% 70.0% 74.2% 63.4%Total 78.3% 45.9% 65.6% 69.6% 56.3%
Source: 2004 CPS-ASEC, 2003 ACS, Census population estimates, WIC Administrative Data
Table D.4-2003: WIC Eligibles and Coverage Rates by FNS Region and Participant Group, CY 2003

National‐ and State‐Level Estimates of WIC Eligibles and Program Reach: Appendices Page D‐27
Table D.1c-2004: National Estimates by Participant Group with Children by Single Year of AgeCY 2004
U.S. States and D.C. (2005 CPS-ASEC) InfantsChildren Age 1h
Children Age 2h
Children Age 3h
Children Age 4h
Total Children Age 1 to 4
Pregnant Women
Postpartum Breastfeeding
Women
Postpartum Non-
Breastfeeding Women Total
Total number of infants/children in the 2005 CPS-ASEC 4,017,852 16,244,430 20,262,282
Number (non-U.S. Territory) after adjustment for CPS under/overcounta 4,118,137 4,077,871 4,037,940 4,090,318 3,945,542 16,151,670 20,269,807
Number with annual income <185% FPG 1,706,267 6,220,864 7,927,131
Number of additional people adjunctively eligible above 185% FPG 325,598 1,364,102 1,689,700
Through Food Stampsb 49,909 169,961 219,870Through TANF 4,290 32,114 36,404Through Medicaid 271,399 1,162,027 1,433,426
Total number income and adjunctively eligible 2,031,865 7,584,966 9,616,831
Number after monthly income adjustmentc 2,600,787 8,343,463 10,944,250
Total Eligibles - Number after adjustment for nutritional risk (infants and children)e 2,522,764 2,133,060 2,083,740 2,057,092 1,986,136 8,260,028 10,782,792
Starting point for estimates of women is fully eligible infants 2,522,764 2,522,764 2,522,764 7,568,291
Number after adjustment for length of pregnancy and income of woman during pregnancyf 1,343,372 1,343,372
Number after adjustment for multiple births and infant deathsg 1,338,132 2,512,925 2,512,925 6,363,982
Number after adjustment for breastfeedingh 683,717 812,182 1,495,898
Total Eligibles - Number after adjustment for nutritional risk (pregnant and postpartum women)e 1,297,988 683,717 812,182 2,793,887Source: 2005 CPS-ASECSee notes on page 2.
Eligibles in the U.S. Territories InfantsChildren
Age 1Children
Age 2Children
Age 3Children
Age 4Total Children
Age 1 to 4Pregnant Women
Postpartum Breastfeeding
Women
Postpartum Non-
Breastfeeding Women Total
Total Eligibles in the U.S. Territories 55,871 50,587 52,347 54,374 55,009 212,317 28,746 15,142 17,987 330,064Source: Census Bureau population estimates
Total Eligibles - States and Territories U.S. Total 2,578,635 2,183,648 2,136,087 2,111,466 2,041,145 8,472,345 1,326,735 698,859 830,169 13,906,742
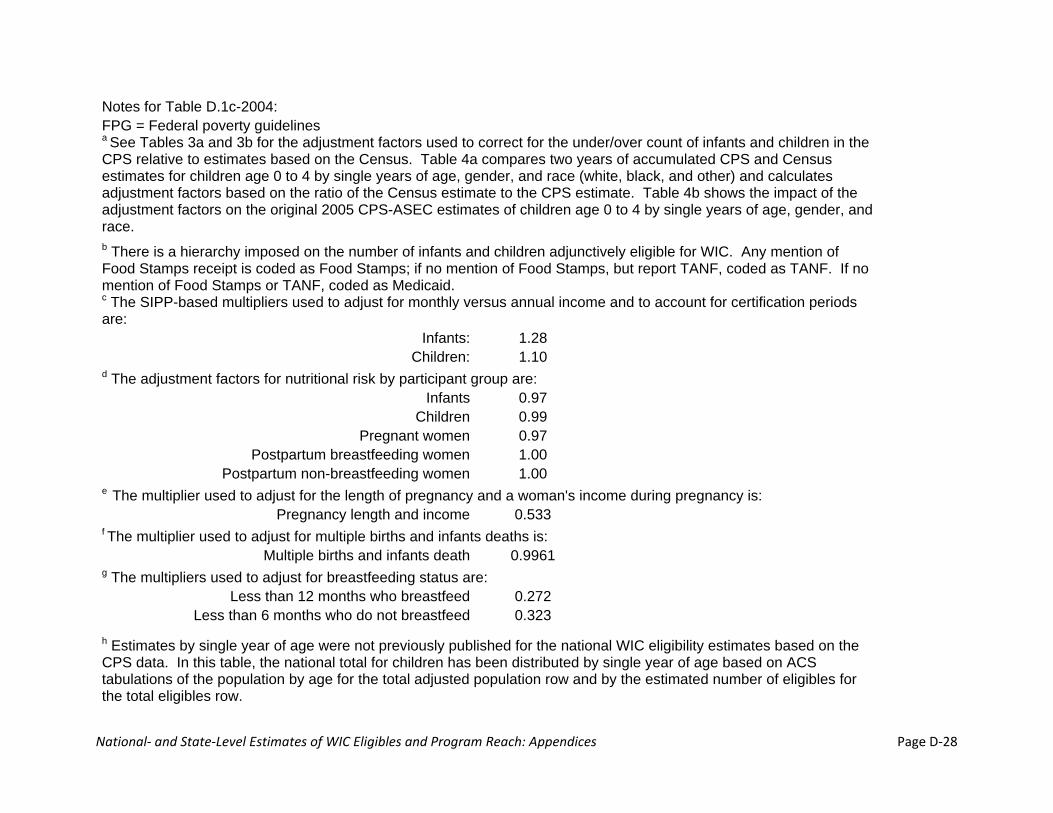
National‐ and State‐Level Estimates of WIC Eligibles and Program Reach: Appendices Page D‐28
Notes for Table D.1c-2004: FPG = Federal poverty guidelines a See Tables 3a and 3b for the adjustment factors used to correct for the under/over count of infants and children in the CPS relative to estimates based on the Census. Table 4a compares two years of accumulated CPS and Census estimates for children age 0 to 4 by single years of age, gender, and race (white, black, and other) and calculates adjustment factors based on the ratio of the Census estimate to the CPS estimate. Table 4b shows the impact of the adjustment factors on the original 2005 CPS-ASEC estimates of children age 0 to 4 by single years of age, gender, and race. b There is a hierarchy imposed on the number of infants and children adjunctively eligible for WIC. Any mention of Food Stamps receipt is coded as Food Stamps; if no mention of Food Stamps, but report TANF, coded as TANF. If no mention of Food Stamps or TANF, coded as Medicaid. c The SIPP-based multipliers used to adjust for monthly versus annual income and to account for certification periods are:
Infants: 1.28 Children: 1.10
d The adjustment factors for nutritional risk by participant group are: Infants 0.97
Children 0.99 Pregnant women 0.97
Postpartum breastfeeding women 1.00 Postpartum non-breastfeeding women 1.00
e The multiplier used to adjust for the length of pregnancy and a woman's income during pregnancy is: Pregnancy length and income 0.533
f The multiplier used to adjust for multiple births and infants deaths is: Multiple births and infants death 0.9961
g The multipliers used to adjust for breastfeeding status are: Less than 12 months who breastfeed 0.272
Less than 6 months who do not breastfeed 0.323 h Estimates by single year of age were not previously published for the national WIC eligibility estimates based on the CPS data. In this table, the national total for children has been distributed by single year of age based on ACS tabulations of the population by age for the total adjusted population row and by the estimated number of eligibles for the total eligibles row.
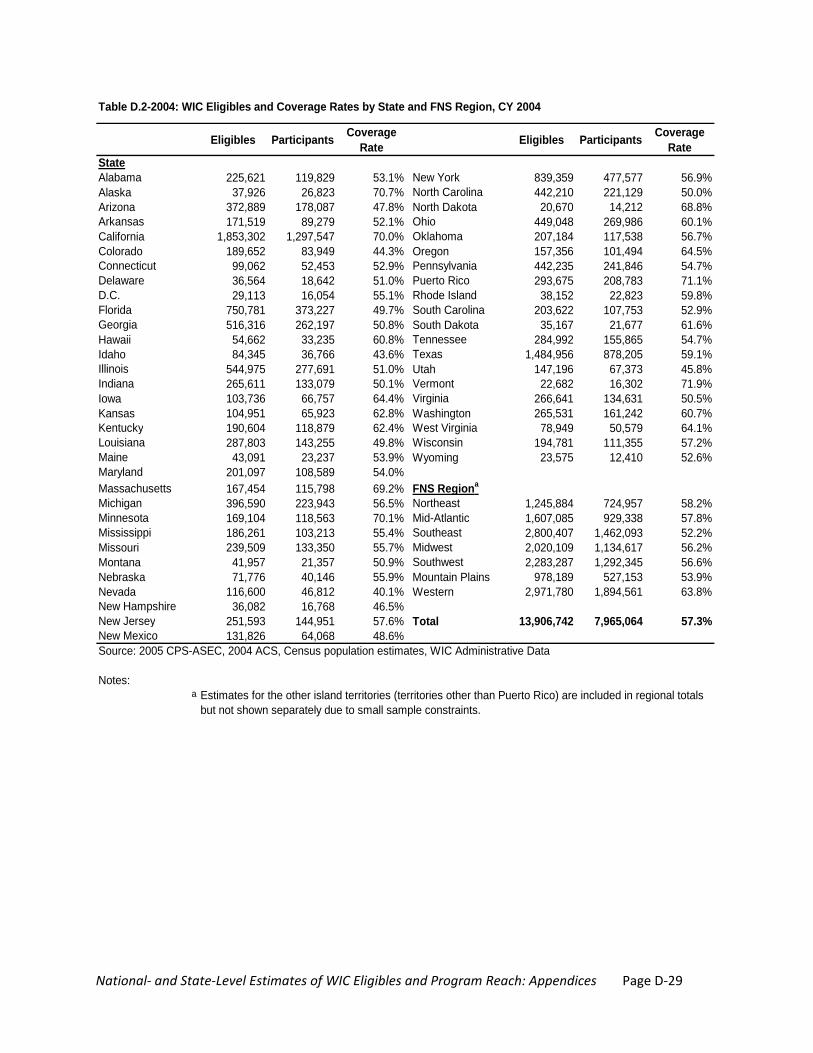
National‐ and State‐Level Estimates of WIC Eligibles and Program Reach: Appendices Page D‐29
Eligibles Participants Coverage Rate Eligibles Participants Coverage
RateStateAlabama 225,621 119,829 53.1% New York 839,359 477,577 56.9%Alaska 37,926 26,823 70.7% North Carolina 442,210 221,129 50.0%Arizona 372,889 178,087 47.8% North Dakota 20,670 14,212 68.8%Arkansas 171,519 89,279 52.1% Ohio 449,048 269,986 60.1%California 1,853,302 1,297,547 70.0% Oklahoma 207,184 117,538 56.7%Colorado 189,652 83,949 44.3% Oregon 157,356 101,494 64.5%Connecticut 99,062 52,453 52.9% Pennsylvania 442,235 241,846 54.7%Delaware 36,564 18,642 51.0% Puerto Rico 293,675 208,783 71.1%D.C. 29,113 16,054 55.1% Rhode Island 38,152 22,823 59.8%Florida 750,781 373,227 49.7% South Carolina 203,622 107,753 52.9%Georgia 516,316 262,197 50.8% South Dakota 35,167 21,677 61.6%Hawaii 54,662 33,235 60.8% Tennessee 284,992 155,865 54.7%Idaho 84,345 36,766 43.6% Texas 1,484,956 878,205 59.1%Illinois 544,975 277,691 51.0% Utah 147,196 67,373 45.8%Indiana 265,611 133,079 50.1% Vermont 22,682 16,302 71.9%Iowa 103,736 66,757 64.4% Virginia 266,641 134,631 50.5%Kansas 104,951 65,923 62.8% Washington 265,531 161,242 60.7%Kentucky 190,604 118,879 62.4% West Virginia 78,949 50,579 64.1%Louisiana 287,803 143,255 49.8% Wisconsin 194,781 111,355 57.2%Maine 43,091 23,237 53.9% Wyoming 23,575 12,410 52.6%Maryland 201,097 108,589 54.0%Massachusetts 167,454 115,798 69.2% FNS Regiona
Michigan 396,590 223,943 56.5% Northeast 1,245,884 724,957 58.2%Minnesota 169,104 118,563 70.1% Mid-Atlantic 1,607,085 929,338 57.8%Mississippi 186,261 103,213 55.4% Southeast 2,800,407 1,462,093 52.2%Missouri 239,509 133,350 55.7% Midwest 2,020,109 1,134,617 56.2%Montana 41,957 21,357 50.9% Southwest 2,283,287 1,292,345 56.6%Nebraska 71,776 40,146 55.9% Mountain Plains 978,189 527,153 53.9%Nevada 116,600 46,812 40.1% Western 2,971,780 1,894,561 63.8%New Hampshire 36,082 16,768 46.5%New Jersey 251,593 144,951 57.6% Total 13,906,742 7,965,064 57.3%New Mexico 131,826 64,068 48.6%Source: 2005 CPS-ASEC, 2004 ACS, Census population estimates, WIC Administrative Data
Notes:a
Table D.2-2004: WIC Eligibles and Coverage Rates by State and FNS Region, CY 2004
Estimates for the other island territories (territories other than Puerto Rico) are included in regional totals but not shown separately due to small sample constraints.
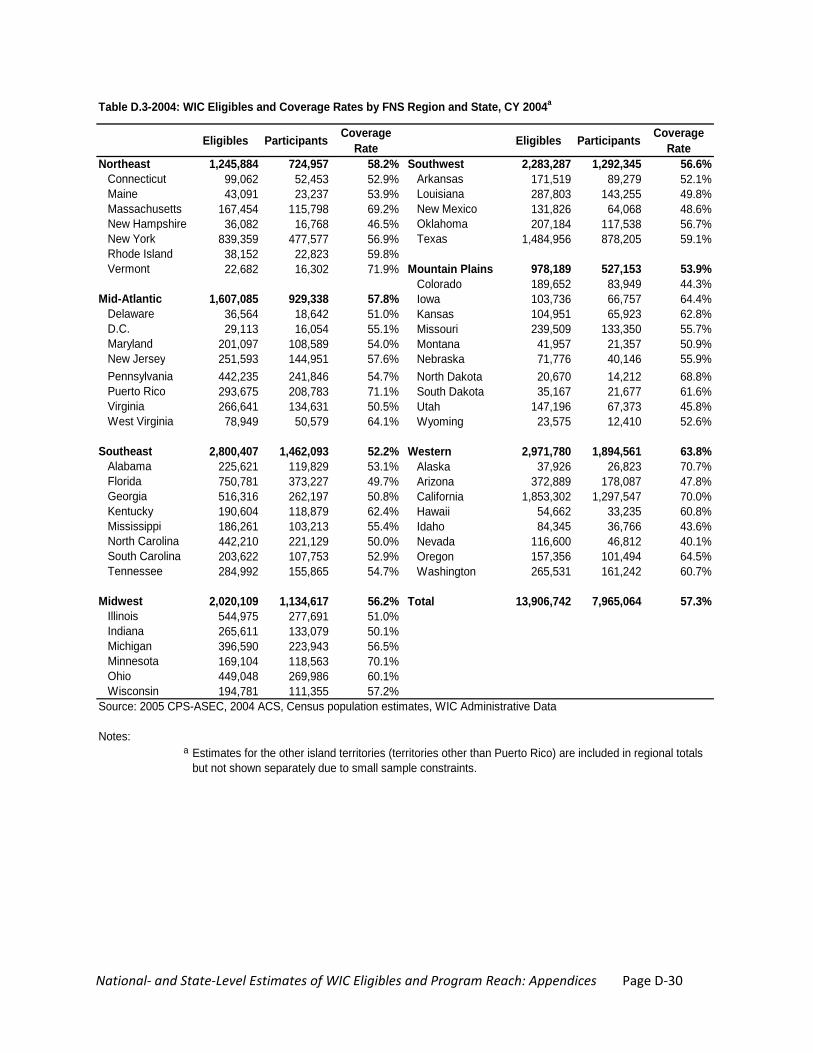
National‐ and State‐Level Estimates of WIC Eligibles and Program Reach: Appendices Page D‐30
Eligibles Participants Coverage Rate Eligibles Participants Coverage
RateNortheast 1,245,884 724,957 58.2% Southwest 2,283,287 1,292,345 56.6%
Connecticut 99,062 52,453 52.9% Arkansas 171,519 89,279 52.1%Maine 43,091 23,237 53.9% Louisiana 287,803 143,255 49.8%Massachusetts 167,454 115,798 69.2% New Mexico 131,826 64,068 48.6%New Hampshire 36,082 16,768 46.5% Oklahoma 207,184 117,538 56.7%New York 839,359 477,577 56.9% Texas 1,484,956 878,205 59.1%Rhode Island 38,152 22,823 59.8%Vermont 22,682 16,302 71.9% Mountain Plains 978,189 527,153 53.9%
Colorado 189,652 83,949 44.3%Mid-Atlantic 1,607,085 929,338 57.8% Iowa 103,736 66,757 64.4%
Delaware 36,564 18,642 51.0% Kansas 104,951 65,923 62.8%D.C. 29,113 16,054 55.1% Missouri 239,509 133,350 55.7%Maryland 201,097 108,589 54.0% Montana 41,957 21,357 50.9%New Jersey 251,593 144,951 57.6% Nebraska 71,776 40,146 55.9%Pennsylvania 442,235 241,846 54.7% North Dakota 20,670 14,212 68.8%Puerto Rico 293,675 208,783 71.1% South Dakota 35,167 21,677 61.6%Virginia 266,641 134,631 50.5% Utah 147,196 67,373 45.8%West Virginia 78,949 50,579 64.1% Wyoming 23,575 12,410 52.6%
Southeast 2,800,407 1,462,093 52.2% Western 2,971,780 1,894,561 63.8%Alabama 225,621 119,829 53.1% Alaska 37,926 26,823 70.7%Florida 750,781 373,227 49.7% Arizona 372,889 178,087 47.8%Georgia 516,316 262,197 50.8% California 1,853,302 1,297,547 70.0%Kentucky 190,604 118,879 62.4% Hawaii 54,662 33,235 60.8%Mississippi 186,261 103,213 55.4% Idaho 84,345 36,766 43.6%North Carolina 442,210 221,129 50.0% Nevada 116,600 46,812 40.1%South Carolina 203,622 107,753 52.9% Oregon 157,356 101,494 64.5%Tennessee 284,992 155,865 54.7% Washington 265,531 161,242 60.7%
Midwest 2,020,109 1,134,617 56.2% Total 13,906,742 7,965,064 57.3%Illinois 544,975 277,691 51.0%Indiana 265,611 133,079 50.1%Michigan 396,590 223,943 56.5%Minnesota 169,104 118,563 70.1%Ohio 449,048 269,986 60.1%Wisconsin 194,781 111,355 57.2%
Source: 2005 CPS-ASEC, 2004 ACS, Census population estimates, WIC Administrative Data
Notes:a
Table D.3-2004: WIC Eligibles and Coverage Rates by FNS Region and State, CY 2004a
Estimates for the other island territories (territories other than Puerto Rico) are included in regional totals but not shown separately due to small sample constraints.

National‐ and State‐Level Estimates of WIC Eligibles and Program Reach: Appendices Page D‐31
InfantsChildren
(age 1 to 4)Pregnant Women
All Postpartum Women Total
EligiblesNortheast 233,115 751,851 119,940 140,978 1,245,884Mid-Atlantic 286,771 1,000,302 147,547 172,465 1,607,085Southeast 517,480 1,720,136 266,249 296,543 2,800,407Midwest 374,531 1,238,099 192,700 214,779 2,020,109Southwest 432,579 1,382,266 222,567 245,876 2,283,287Mountain Plains 183,193 590,603 94,255 110,138 978,189Western 550,967 1,789,087 283,478 348,248 2,971,780Total 2,578,635 8,472,345 1,326,735 1,529,028 13,906,742
ParticipantsNortheast 182,817 365,331 76,667 100,142 724,957Mid-Atlantic 232,893 478,684 95,667 122,094 929,338Southeast 396,826 697,019 167,179 201,069 1,462,093Midwest 313,397 547,700 126,600 146,919 1,134,617Southwest 331,385 643,227 144,724 173,009 1,292,345Mountain Plains 135,527 260,117 59,082 72,427 527,153Western 435,342 999,887 199,588 259,744 1,894,561Total 2,028,188 3,991,965 869,508 1,075,404 7,965,064
Coverage RatesNortheast 78.4% 48.6% 63.9% 71.0% 58.2%Mid-Atlantic 81.2% 47.9% 64.8% 70.8% 57.8%Southeast 76.7% 40.5% 62.8% 67.8% 52.2%Midwest 83.7% 44.2% 65.7% 68.4% 56.2%Southwest 76.6% 46.5% 65.0% 70.4% 56.6%Mountain Plains 74.0% 44.0% 62.7% 65.8% 53.9%Western 79.0% 55.9% 70.4% 74.6% 63.8%Total 78.7% 47.1% 65.5% 70.3% 57.3%
Source: 2005 CPS-ASEC, 2004 ACS, Census population estimates, WIC Administrative Data
Table D.4-2004: WIC Eligibles and Coverage Rates by FNS Region and Participant Group, CY 2004
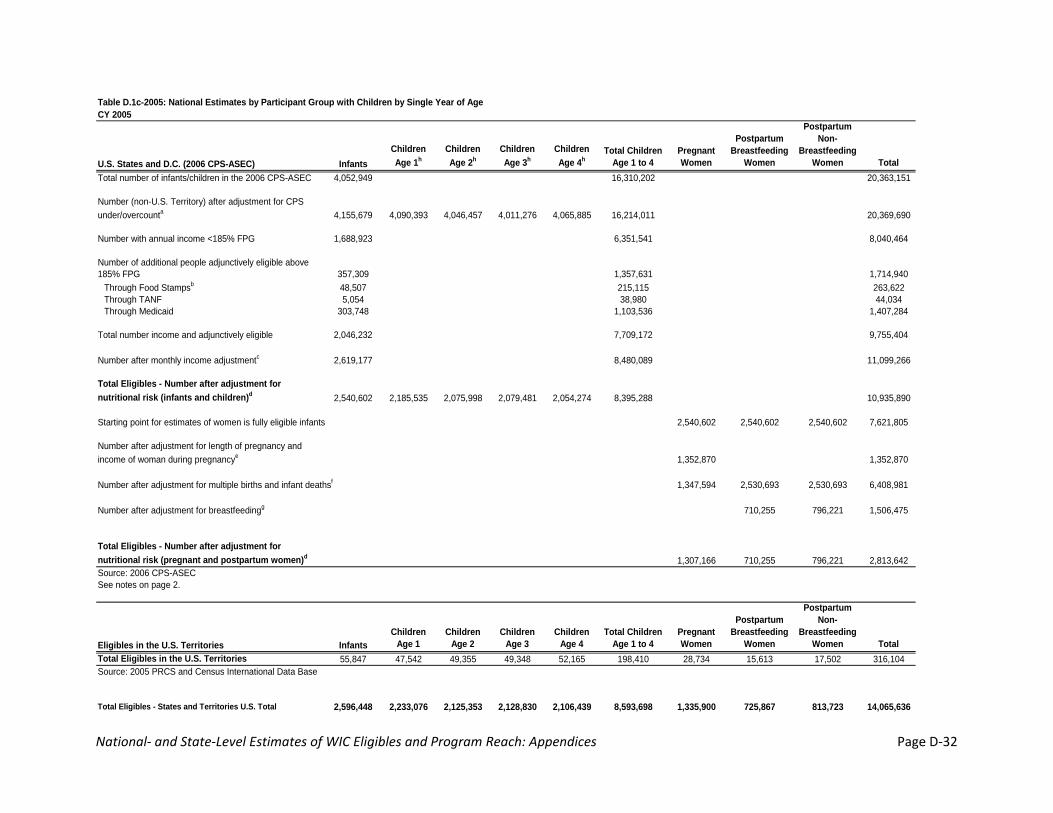
National‐ and State‐Level Estimates of WIC Eligibles and Program Reach: Appendices Page D‐32
Table D.1c-2005: National Estimates by Participant Group with Children by Single Year of AgeCY 2005
U.S. States and D.C. (2006 CPS-ASEC) InfantsChildren Age 1h
Children Age 2h
Children Age 3h
Children Age 4h
Total Children Age 1 to 4
Pregnant Women
Postpartum Breastfeeding
Women
Postpartum Non-
Breastfeeding Women Total
Total number of infants/children in the 2006 CPS-ASEC 4,052,949 16,310,202 20,363,151
Number (non-U.S. Territory) after adjustment for CPS under/overcounta 4,155,679 4,090,393 4,046,457 4,011,276 4,065,885 16,214,011 20,369,690
Number with annual income <185% FPG 1,688,923 6,351,541 8,040,464
Number of additional people adjunctively eligible above 185% FPG 357,309 1,357,631 1,714,940
Through Food Stampsb 48,507 215,115 263,622Through TANF 5,054 38,980 44,034Through Medicaid 303,748 1,103,536 1,407,284
Total number income and adjunctively eligible 2,046,232 7,709,172 9,755,404
Number after monthly income adjustmentc 2,619,177 8,480,089 11,099,266
Total Eligibles - Number after adjustment for nutritional risk (infants and children)d 2,540,602 2,185,535 2,075,998 2,079,481 2,054,274 8,395,288 10,935,890
Starting point for estimates of women is fully eligible infants 2,540,602 2,540,602 2,540,602 7,621,805
Number after adjustment for length of pregnancy and income of woman during pregnancye 1,352,870 1,352,870
Number after adjustment for multiple births and infant deathsf 1,347,594 2,530,693 2,530,693 6,408,981
Number after adjustment for breastfeedingg 710,255 796,221 1,506,475
Total Eligibles - Number after adjustment for nutritional risk (pregnant and postpartum women)d 1,307,166 710,255 796,221 2,813,642Source: 2006 CPS-ASECSee notes on page 2.
Eligibles in the U.S. Territories InfantsChildren
Age 1Children
Age 2Children
Age 3Children
Age 4Total Children
Age 1 to 4Pregnant Women
Postpartum Breastfeeding
Women
Postpartum Non-
Breastfeeding Women Total
Total Eligibles in the U.S. Territories 55,847 47,542 49,355 49,348 52,165 198,410 28,734 15,613 17,502 316,104Source: 2005 PRCS and Census International Data Base
Total Eligibles - States and Territories U.S. Total 2,596,448 2,233,076 2,125,353 2,128,830 2,106,439 8,593,698 1,335,900 725,867 813,723 14,065,636
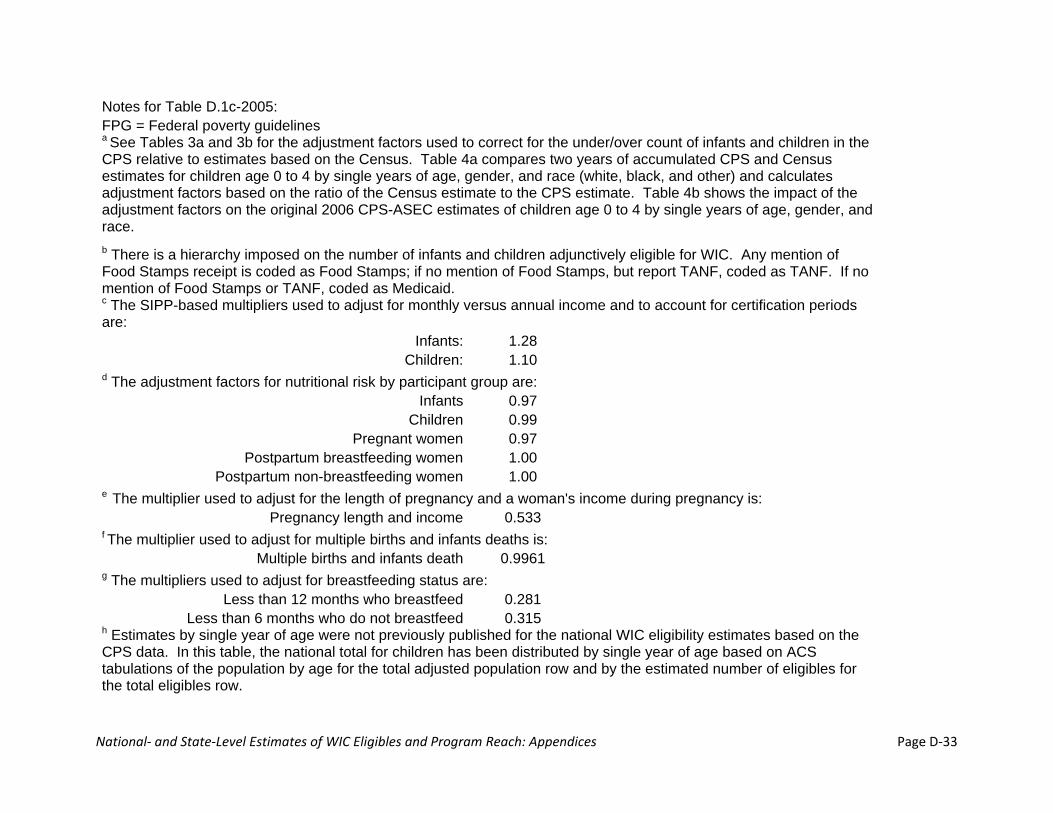
National‐ and State‐Level Estimates of WIC Eligibles and Program Reach: Appendices Page D‐33
Notes for Table D.1c-2005: FPG = Federal poverty guidelines a See Tables 3a and 3b for the adjustment factors used to correct for the under/over count of infants and children in the CPS relative to estimates based on the Census. Table 4a compares two years of accumulated CPS and Census estimates for children age 0 to 4 by single years of age, gender, and race (white, black, and other) and calculates adjustment factors based on the ratio of the Census estimate to the CPS estimate. Table 4b shows the impact of the adjustment factors on the original 2006 CPS-ASEC estimates of children age 0 to 4 by single years of age, gender, and race. b There is a hierarchy imposed on the number of infants and children adjunctively eligible for WIC. Any mention of Food Stamps receipt is coded as Food Stamps; if no mention of Food Stamps, but report TANF, coded as TANF. If no mention of Food Stamps or TANF, coded as Medicaid. c The SIPP-based multipliers used to adjust for monthly versus annual income and to account for certification periods are:
Infants: 1.28 Children: 1.10
d The adjustment factors for nutritional risk by participant group are: Infants 0.97
Children 0.99 Pregnant women 0.97
Postpartum breastfeeding women 1.00 Postpartum non-breastfeeding women 1.00
e The multiplier used to adjust for the length of pregnancy and a woman's income during pregnancy is: Pregnancy length and income 0.533
f The multiplier used to adjust for multiple births and infants deaths is: Multiple births and infants death 0.9961
g The multipliers used to adjust for breastfeeding status are: Less than 12 months who breastfeed 0.281
Less than 6 months who do not breastfeed 0.315 h Estimates by single year of age were not previously published for the national WIC eligibility estimates based on the CPS data. In this table, the national total for children has been distributed by single year of age based on ACS tabulations of the population by age for the total adjusted population row and by the estimated number of eligibles for the total eligibles row.
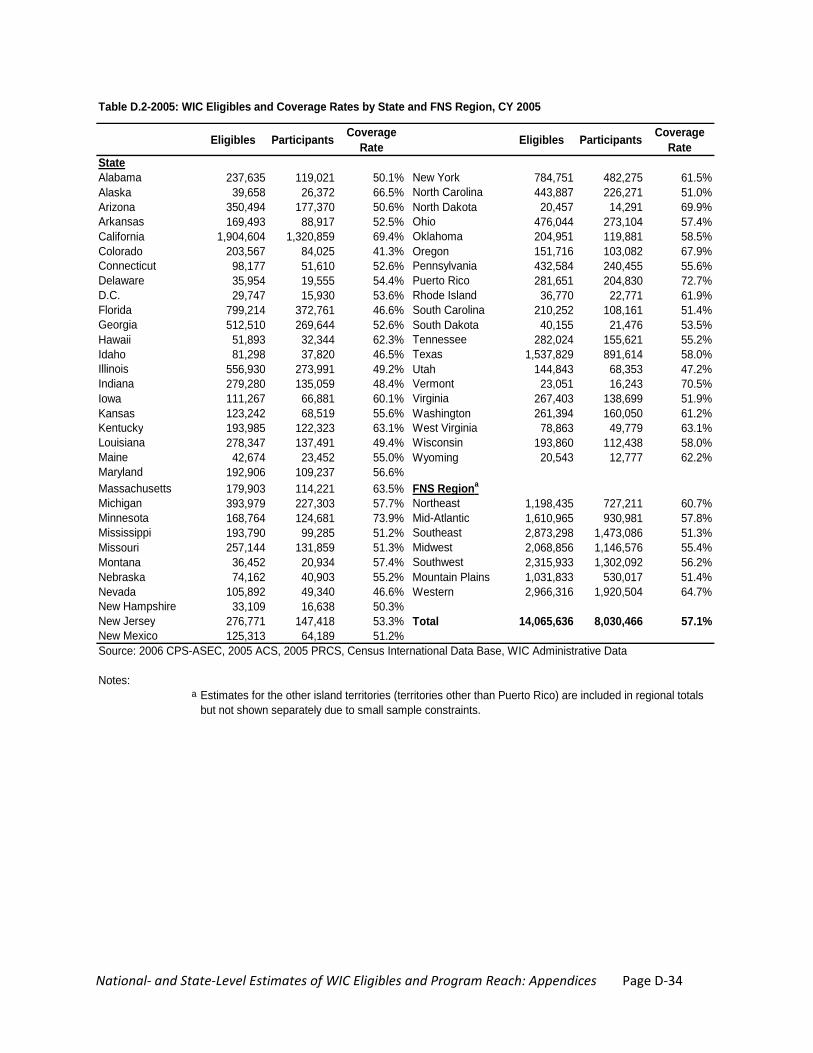
National‐ and State‐Level Estimates of WIC Eligibles and Program Reach: Appendices Page D‐34
Eligibles Participants Coverage Rate Eligibles Participants Coverage
RateStateAlabama 237,635 119,021 50.1% New York 784,751 482,275 61.5%Alaska 39,658 26,372 66.5% North Carolina 443,887 226,271 51.0%Arizona 350,494 177,370 50.6% North Dakota 20,457 14,291 69.9%Arkansas 169,493 88,917 52.5% Ohio 476,044 273,104 57.4%California 1,904,604 1,320,859 69.4% Oklahoma 204,951 119,881 58.5%Colorado 203,567 84,025 41.3% Oregon 151,716 103,082 67.9%Connecticut 98,177 51,610 52.6% Pennsylvania 432,584 240,455 55.6%Delaware 35,954 19,555 54.4% Puerto Rico 281,651 204,830 72.7%D.C. 29,747 15,930 53.6% Rhode Island 36,770 22,771 61.9%Florida 799,214 372,761 46.6% South Carolina 210,252 108,161 51.4%Georgia 512,510 269,644 52.6% South Dakota 40,155 21,476 53.5%Hawaii 51,893 32,344 62.3% Tennessee 282,024 155,621 55.2%Idaho 81,298 37,820 46.5% Texas 1,537,829 891,614 58.0%Illinois 556,930 273,991 49.2% Utah 144,843 68,353 47.2%Indiana 279,280 135,059 48.4% Vermont 23,051 16,243 70.5%Iowa 111,267 66,881 60.1% Virginia 267,403 138,699 51.9%Kansas 123,242 68,519 55.6% Washington 261,394 160,050 61.2%Kentucky 193,985 122,323 63.1% West Virginia 78,863 49,779 63.1%Louisiana 278,347 137,491 49.4% Wisconsin 193,860 112,438 58.0%Maine 42,674 23,452 55.0% Wyoming 20,543 12,777 62.2%Maryland 192,906 109,237 56.6%Massachusetts 179,903 114,221 63.5% FNS Regiona
Michigan 393,979 227,303 57.7% Northeast 1,198,435 727,211 60.7%Minnesota 168,764 124,681 73.9% Mid-Atlantic 1,610,965 930,981 57.8%Mississippi 193,790 99,285 51.2% Southeast 2,873,298 1,473,086 51.3%Missouri 257,144 131,859 51.3% Midwest 2,068,856 1,146,576 55.4%Montana 36,452 20,934 57.4% Southwest 2,315,933 1,302,092 56.2%Nebraska 74,162 40,903 55.2% Mountain Plains 1,031,833 530,017 51.4%Nevada 105,892 49,340 46.6% Western 2,966,316 1,920,504 64.7%New Hampshire 33,109 16,638 50.3%New Jersey 276,771 147,418 53.3% Total 14,065,636 8,030,466 57.1%New Mexico 125,313 64,189 51.2%Source: 2006 CPS-ASEC, 2005 ACS, 2005 PRCS, Census International Data Base, WIC Administrative Data
Notes:a
Table D.2-2005: WIC Eligibles and Coverage Rates by State and FNS Region, CY 2005
Estimates for the other island territories (territories other than Puerto Rico) are included in regional totals but not shown separately due to small sample constraints.

National‐ and State‐Level Estimates of WIC Eligibles and Program Reach: Appendices Page D‐35
Eligibles Participants Coverage Rate Eligibles Participants Coverage
RateNortheast 1,198,435 727,211 60.7% Southwest 2,315,933 1,302,092 56.2%
Connecticut 98,177 51,610 52.6% Arkansas 169,493 88,917 52.5%Maine 42,674 23,452 55.0% Louisiana 278,347 137,491 49.4%Massachusetts 179,903 114,221 63.5% New Mexico 125,313 64,189 51.2%New Hampshire 33,109 16,638 50.3% Oklahoma 204,951 119,881 58.5%New York 784,751 482,275 61.5% Texas 1,537,829 891,614 58.0%Rhode Island 36,770 22,771 61.9%Vermont 23,051 16,243 70.5% Mountain Plains 1,031,833 530,017 51.4%
Colorado 203,567 84,025 41.3%Mid-Atlantic 1,610,965 930,981 57.8% Iowa 111,267 66,881 60.1%
Delaware 35,954 19,555 54.4% Kansas 123,242 68,519 55.6%D.C. 29,747 15,930 53.6% Missouri 257,144 131,859 51.3%Maryland 192,906 109,237 56.6% Montana 36,452 20,934 57.4%New Jersey 276,771 147,418 53.3% Nebraska 74,162 40,903 55.2%Pennsylvania 432,584 240,455 55.6% North Dakota 20,457 14,291 69.9%Puerto Rico 281,651 204,830 72.7% South Dakota 40,155 21,476 53.5%Virginia 267,403 138,699 51.9% Utah 144,843 68,353 47.2%West Virginia 78,863 49,779 63.1% Wyoming 20,543 12,777 62.2%
Southeast 2,873,298 1,473,086 51.3% Western 2,966,316 1,920,504 64.7%Alabama 237,635 119,021 50.1% Alaska 39,658 26,372 66.5%Florida 799,214 372,761 46.6% Arizona 350,494 177,370 50.6%Georgia 512,510 269,644 52.6% California 1,904,604 1,320,859 69.4%Kentucky 193,985 122,323 63.1% Hawaii 51,893 32,344 62.3%Mississippi 193,790 99,285 51.2% Idaho 81,298 37,820 46.5%North Carolina 443,887 226,271 51.0% Nevada 105,892 49,340 46.6%South Carolina 210,252 108,161 51.4% Oregon 151,716 103,082 67.9%Tennessee 282,024 155,621 55.2% Washington 261,394 160,050 61.2%
Midwest 2,068,856 1,146,576 55.4% Total 14,065,636 8,030,466 57.1%Illinois 556,930 273,991 49.2%Indiana 279,280 135,059 48.4%Michigan 393,979 227,303 57.7%Minnesota 168,764 124,681 73.9%Ohio 476,044 273,104 57.4%Wisconsin 193,860 112,438 58.0%
Source: 2006 CPS-ASEC, 2005 ACS, 2005 PRCS, Census International Data Base, WIC Administrative Data
Notes:a
Table D.3-2005: WIC Eligibles and Coverage Rates by FNS Region and State, CY 2005a
Estimates for the other island territories (territories other than Puerto Rico) are included in regional totals but not shown separately due to small sample constraints.

National‐ and State‐Level Estimates of WIC Eligibles and Program Reach: Appendices Page D‐36
InfantsChildren
(age 1 to 4)Pregnant Women
All Postpartum Women Total
EligiblesNortheast 215,054 742,426 110,648 130,307 1,198,435Mid-Atlantic 293,809 993,353 151,168 172,634 1,610,965Southeast 537,473 1,758,795 276,535 300,495 2,873,298Midwest 385,933 1,256,999 198,567 227,358 2,068,856Southwest 436,284 1,403,111 224,473 252,065 2,315,933Mountain Plains 189,564 626,520 97,533 118,217 1,031,833Western 538,331 1,812,493 276,977 338,514 2,966,316Total 2,596,448 8,593,698 1,335,900 1,539,590 14,065,636
ParticipantsNortheast 181,553 366,752 77,231 101,675 727,211Mid-Atlantic 234,876 476,331 96,186 123,588 930,981Southeast 403,350 695,175 167,862 206,700 1,473,086Midwest 315,113 553,356 128,692 149,414 1,146,576Southwest 334,748 647,124 144,059 176,161 1,302,092Mountain Plains 137,201 259,913 59,009 73,893 530,017Western 446,440 1,003,129 201,140 269,795 1,920,504Total 2,053,280 4,001,780 874,180 1,101,226 8,030,466
Coverage RatesNortheast 84.4% 49.4% 69.8% 78.0% 60.7%Mid-Atlantic 79.9% 48.0% 63.6% 71.6% 57.8%Southeast 75.0% 39.5% 60.7% 68.8% 51.3%Midwest 81.6% 44.0% 64.8% 65.7% 55.4%Southwest 76.7% 46.1% 64.2% 69.9% 56.2%Mountain Plains 72.4% 41.5% 60.5% 62.5% 51.4%Western 82.9% 55.3% 72.6% 79.7% 64.7%Total 79.1% 46.6% 65.4% 71.5% 57.1%
Source: 2006 CPS-ASEC, 2005 ACS, 2005 PRCS, Census International Data Base, WIC Administrative Data
Table D.4-2005: WIC Eligibles and Coverage FNS Rates by Region and Participant Group, CY 2005
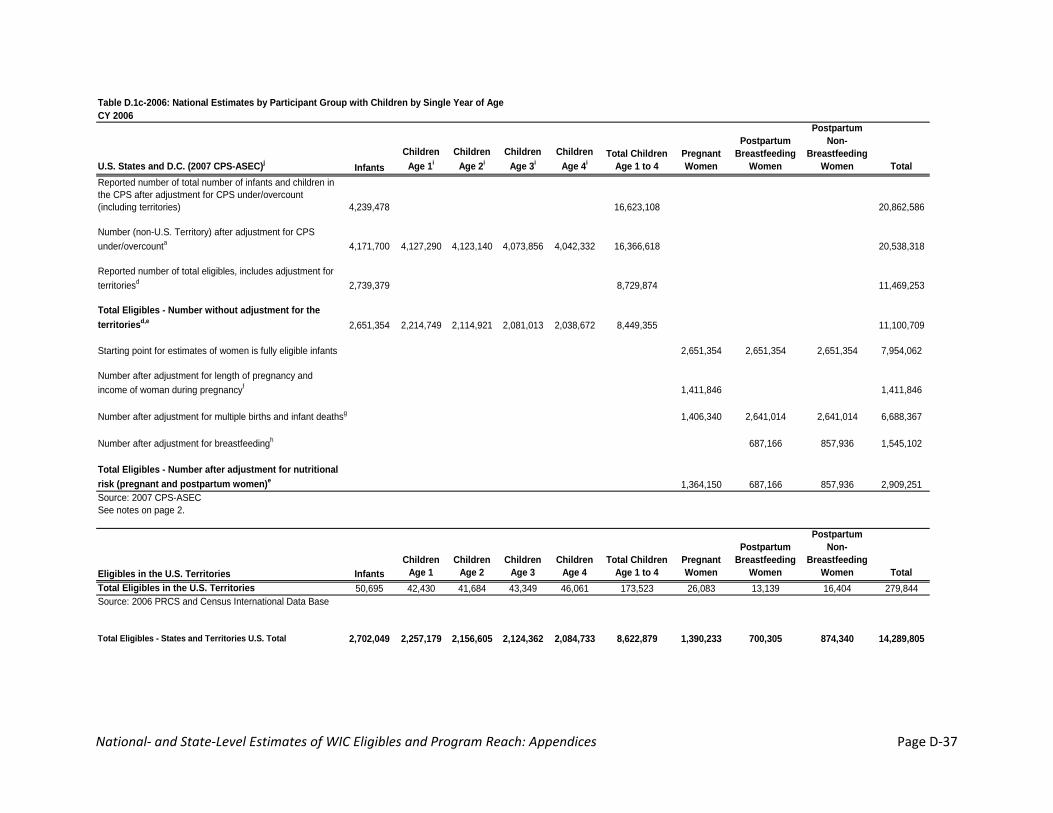
National‐ and State‐Level Estimates of WIC Eligibles and Program Reach: Appendices Page D‐37
Table D.1c-2006: National Estimates by Participant Group with Children by Single Year of AgeCY 2006
U.S. States and D.C. (2007 CPS-ASEC)j InfantsChildren
Age 1iChildren
Age 2iChildren
Age 3iChildren
Age 4iTotal Children
Age 1 to 4Pregnant Women
Postpartum Breastfeeding
Women
Postpartum Non-
Breastfeeding Women Total
Reported number of total number of infants and children in the CPS after adjustment for CPS under/overcount (including territories) 4,239,478 16,623,108 20,862,586
Number (non-U.S. Territory) after adjustment for CPS under/overcounta 4,171,700 4,127,290 4,123,140 4,073,856 4,042,332 16,366,618 20,538,318
Reported number of total eligibles, includes adjustment for territoriesd 2,739,379 8,729,874 11,469,253
Total Eligibles - Number without adjustment for the territoriesd,e 2,651,354 2,214,749 2,114,921 2,081,013 2,038,672 8,449,355 11,100,709
Starting point for estimates of women is fully eligible infants 2,651,354 2,651,354 2,651,354 7,954,062
Number after adjustment for length of pregnancy and income of woman during pregnancyf 1,411,846 1,411,846
Number after adjustment for multiple births and infant deathsg 1,406,340 2,641,014 2,641,014 6,688,367
Number after adjustment for breastfeedingh 687,166 857,936 1,545,102
Total Eligibles - Number after adjustment for nutritional risk (pregnant and postpartum women)e 1,364,150 687,166 857,936 2,909,251Source: 2007 CPS-ASECSee notes on page 2.
Eligibles in the U.S. Territories InfantsChildren
Age 1Children
Age 2Children
Age 3Children
Age 4Total Children
Age 1 to 4Pregnant Women
Postpartum Breastfeeding
Women
Postpartum Non-
Breastfeeding Women Total
Total Eligibles in the U.S. Territories 50,695 42,430 41,684 43,349 46,061 173,523 26,083 13,139 16,404 279,844Source: 2006 PRCS and Census International Data Base
Total Eligibles - States and Territories U.S. Total 2,702,049 2,257,179 2,156,605 2,124,362 2,084,733 8,622,879 1,390,233 700,305 874,340 14,289,805
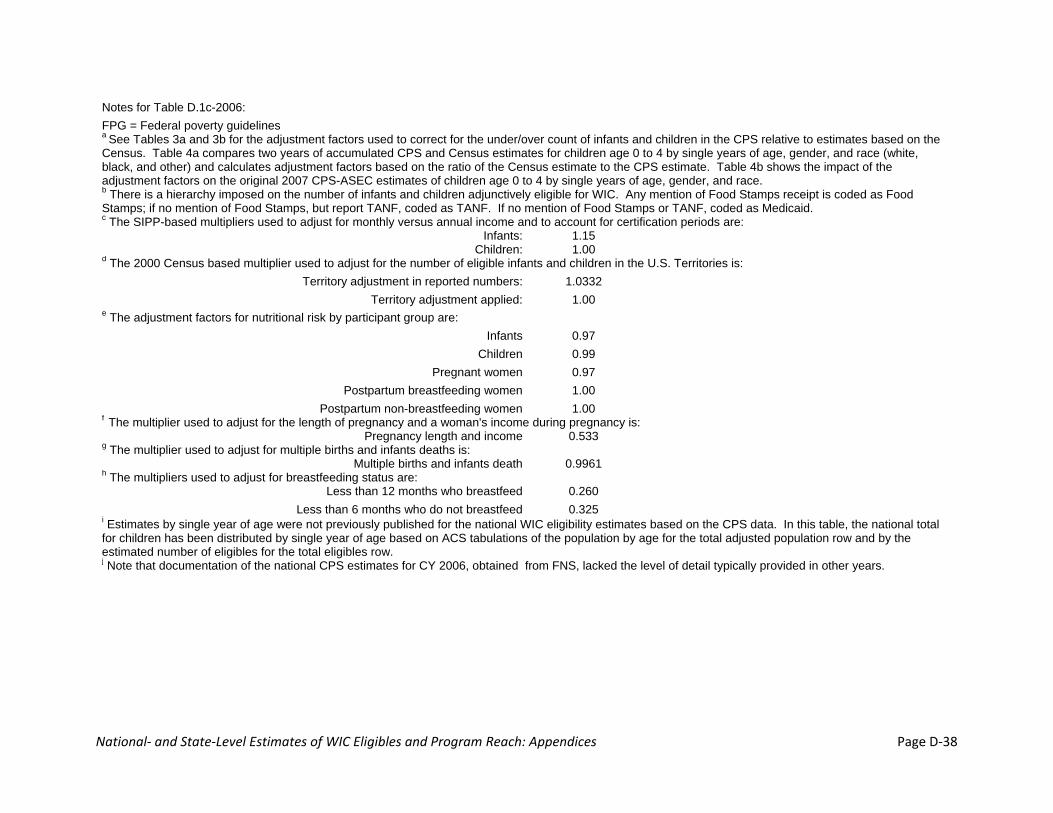
National‐ and State‐Level Estimates of WIC Eligibles and Program Reach: Appendices Page D‐38
Notes for Table D.1c-2006: FPG = Federal poverty guidelines a See Tables 3a and 3b for the adjustment factors used to correct for the under/over count of infants and children in the CPS relative to estimates based on the Census. Table 4a compares two years of accumulated CPS and Census estimates for children age 0 to 4 by single years of age, gender, and race (white, black, and other) and calculates adjustment factors based on the ratio of the Census estimate to the CPS estimate. Table 4b shows the impact of the adjustment factors on the original 2007 CPS-ASEC estimates of children age 0 to 4 by single years of age, gender, and race. b There is a hierarchy imposed on the number of infants and children adjunctively eligible for WIC. Any mention of Food Stamps receipt is coded as Food Stamps; if no mention of Food Stamps, but report TANF, coded as TANF. If no mention of Food Stamps or TANF, coded as Medicaid. c The SIPP-based multipliers used to adjust for monthly versus annual income and to account for certification periods are:
Infants: 1.15 Children: 1.00
d The 2000 Census based multiplier used to adjust for the number of eligible infants and children in the U.S. Territories is: Territory adjustment in reported numbers: 1.0332
Territory adjustment applied: 1.00 e The adjustment factors for nutritional risk by participant group are:
Infants 0.97 Children 0.99
Pregnant women 0.97 Postpartum breastfeeding women 1.00
Postpartum non-breastfeeding women 1.00 f The multiplier used to adjust for the length of pregnancy and a woman's income during pregnancy is:
Pregnancy length and income 0.533 g The multiplier used to adjust for multiple births and infants deaths is:
Multiple births and infants death 0.9961 h The multipliers used to adjust for breastfeeding status are:
Less than 12 months who breastfeed 0.260 Less than 6 months who do not breastfeed 0.325
i Estimates by single year of age were not previously published for the national WIC eligibility estimates based on the CPS data. In this table, the national total for children has been distributed by single year of age based on ACS tabulations of the population by age for the total adjusted population row and by the estimated number of eligibles for the total eligibles row. j Note that documentation of the national CPS estimates for CY 2006, obtained from FNS, lacked the level of detail typically provided in other years.
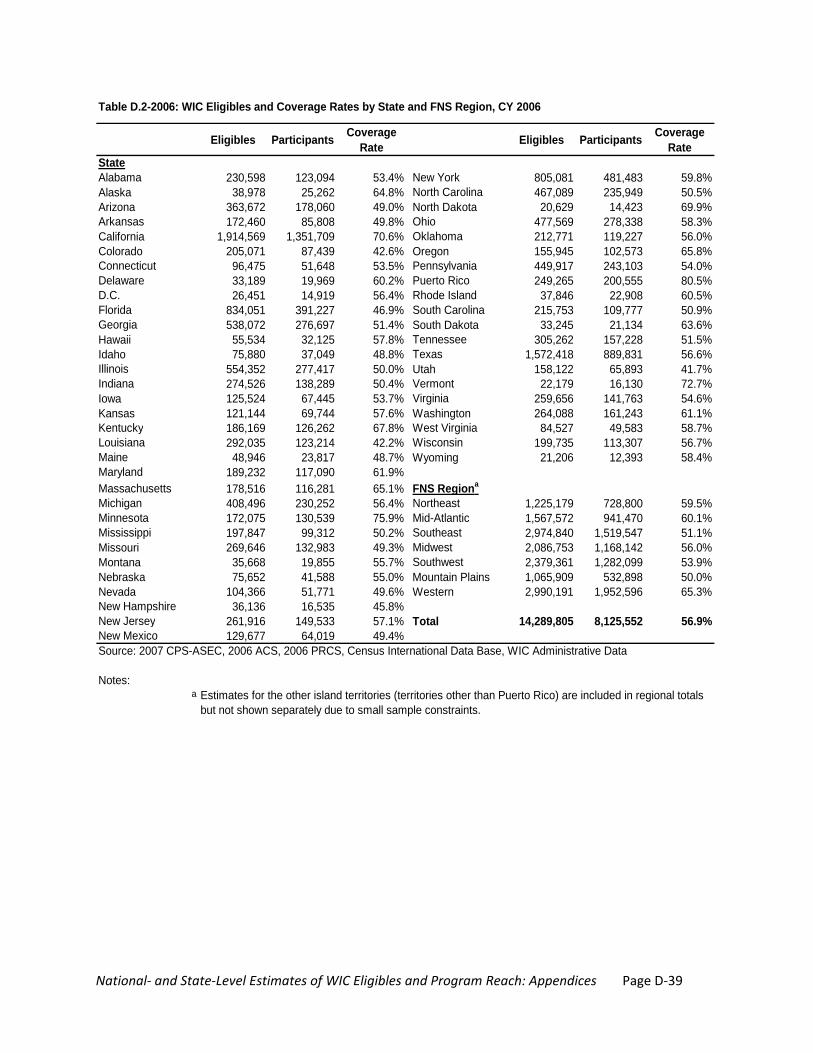
National‐ and State‐Level Estimates of WIC Eligibles and Program Reach: Appendices Page D‐39
Eligibles Participants Coverage Rate Eligibles Participants Coverage
RateStateAlabama 230,598 123,094 53.4% New York 805,081 481,483 59.8%Alaska 38,978 25,262 64.8% North Carolina 467,089 235,949 50.5%Arizona 363,672 178,060 49.0% North Dakota 20,629 14,423 69.9%Arkansas 172,460 85,808 49.8% Ohio 477,569 278,338 58.3%California 1,914,569 1,351,709 70.6% Oklahoma 212,771 119,227 56.0%Colorado 205,071 87,439 42.6% Oregon 155,945 102,573 65.8%Connecticut 96,475 51,648 53.5% Pennsylvania 449,917 243,103 54.0%Delaware 33,189 19,969 60.2% Puerto Rico 249,265 200,555 80.5%D.C. 26,451 14,919 56.4% Rhode Island 37,846 22,908 60.5%Florida 834,051 391,227 46.9% South Carolina 215,753 109,777 50.9%Georgia 538,072 276,697 51.4% South Dakota 33,245 21,134 63.6%Hawaii 55,534 32,125 57.8% Tennessee 305,262 157,228 51.5%Idaho 75,880 37,049 48.8% Texas 1,572,418 889,831 56.6%Illinois 554,352 277,417 50.0% Utah 158,122 65,893 41.7%Indiana 274,526 138,289 50.4% Vermont 22,179 16,130 72.7%Iowa 125,524 67,445 53.7% Virginia 259,656 141,763 54.6%Kansas 121,144 69,744 57.6% Washington 264,088 161,243 61.1%Kentucky 186,169 126,262 67.8% West Virginia 84,527 49,583 58.7%Louisiana 292,035 123,214 42.2% Wisconsin 199,735 113,307 56.7%Maine 48,946 23,817 48.7% Wyoming 21,206 12,393 58.4%Maryland 189,232 117,090 61.9%Massachusetts 178,516 116,281 65.1% FNS Regiona
Michigan 408,496 230,252 56.4% Northeast 1,225,179 728,800 59.5%Minnesota 172,075 130,539 75.9% Mid-Atlantic 1,567,572 941,470 60.1%Mississippi 197,847 99,312 50.2% Southeast 2,974,840 1,519,547 51.1%Missouri 269,646 132,983 49.3% Midwest 2,086,753 1,168,142 56.0%Montana 35,668 19,855 55.7% Southwest 2,379,361 1,282,099 53.9%Nebraska 75,652 41,588 55.0% Mountain Plains 1,065,909 532,898 50.0%Nevada 104,366 51,771 49.6% Western 2,990,191 1,952,596 65.3%New Hampshire 36,136 16,535 45.8%New Jersey 261,916 149,533 57.1% Total 14,289,805 8,125,552 56.9%New Mexico 129,677 64,019 49.4%Source: 2007 CPS-ASEC, 2006 ACS, 2006 PRCS, Census International Data Base, WIC Administrative Data
Notes:a
Table D.2-2006: WIC Eligibles and Coverage Rates by State and FNS Region, CY 2006
Estimates for the other island territories (territories other than Puerto Rico) are included in regional totals but not shown separately due to small sample constraints.

National‐ and State‐Level Estimates of WIC Eligibles and Program Reach: Appendices Page D‐40
Eligibles Participants Coverage Rate Eligibles Participants Coverage
RateNortheast 1,225,179 728,800 59.5% Southwest 2,379,361 1,282,099 53.9%
Connecticut 96,475 51,648 53.5% Arkansas 172,460 85,808 49.8%Maine 48,946 23,817 48.7% Louisiana 292,035 123,214 42.2%Massachusetts 178,516 116,281 65.1% New Mexico 129,677 64,019 49.4%New Hampshire 36,136 16,535 45.8% Oklahoma 212,771 119,227 56.0%New York 805,081 481,483 59.8% Texas 1,572,418 889,831 56.6%Rhode Island 37,846 22,908 60.5%Vermont 22,179 16,130 72.7% Mountain Plains 1,065,909 532,898 50.0%
Colorado 205,071 87,439 42.6%Mid-Atlantic 1,567,572 941,470 60.1% Iowa 125,524 67,445 53.7%
Delaware 33,189 19,969 60.2% Kansas 121,144 69,744 57.6%D.C. 26,451 14,919 56.4% Missouri 269,646 132,983 49.3%Maryland 189,232 117,090 61.9% Montana 35,668 19,855 55.7%New Jersey 261,916 149,533 57.1% Nebraska 75,652 41,588 55.0%Pennsylvania 449,917 243,103 54.0% North Dakota 20,629 14,423 69.9%Puerto Rico 249,265 200,555 80.5% South Dakota 33,245 21,134 63.6%Virginia 259,656 141,763 54.6% Utah 158,122 65,893 41.7%West Virginia 84,527 49,583 58.7% Wyoming 21,206 12,393 58.4%
Southeast 2,974,840 1,519,547 51.1% Western 2,990,191 1,952,596 65.3%Alabama 230,598 123,094 53.4% Alaska 38,978 25,262 64.8%Florida 834,051 391,227 46.9% Arizona 363,672 178,060 49.0%Georgia 538,072 276,697 51.4% California 1,914,569 1,351,709 70.6%Kentucky 186,169 126,262 67.8% Hawaii 55,534 32,125 57.8%Mississippi 197,847 99,312 50.2% Idaho 75,880 37,049 48.8%North Carolina 467,089 235,949 50.5% Nevada 104,366 51,771 49.6%South Carolina 215,753 109,777 50.9% Oregon 155,945 102,573 65.8%Tennessee 305,262 157,228 51.5% Washington 264,088 161,243 61.1%
Midwest 2,086,753 1,168,142 56.0% Total 14,289,805 8,125,552 56.9%Illinois 554,352 277,417 50.0%Indiana 274,526 138,289 50.4%Michigan 408,496 230,252 56.4%Minnesota 172,075 130,539 75.9%Ohio 477,569 278,338 58.3%Wisconsin 199,735 113,307 56.7%
Source: 2007 CPS-ASEC, 2006 ACS, 2006 PRCS, Census International Data Base, WIC Administrative Data
Notes:a
Table D.3-2006: WIC Eligibles and Coverage Rates by FNS Region and State, CY 2006a
Estimates for the other island territories (territories other than Puerto Rico) are included in regional totals but not shown separately due to small sample constraints.
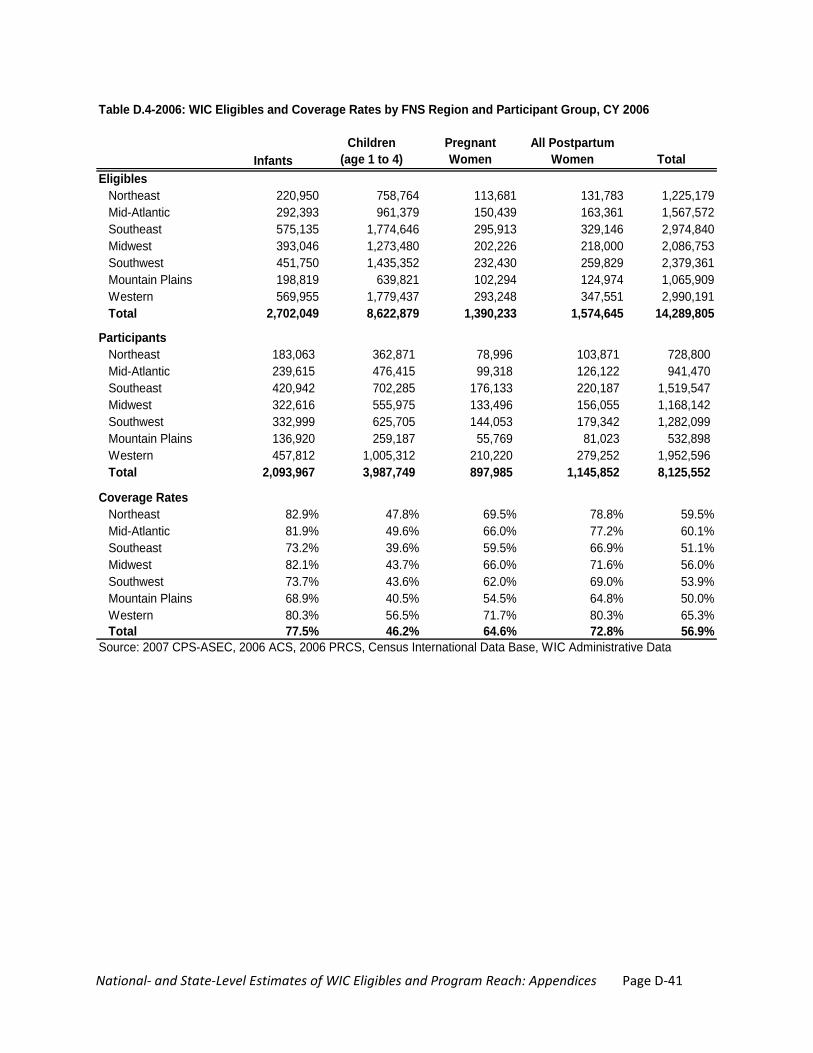
National‐ and State‐Level Estimates of WIC Eligibles and Program Reach: Appendices Page D‐41
InfantsChildren
(age 1 to 4)Pregnant Women
All Postpartum Women Total
EligiblesNortheast 220,950 758,764 113,681 131,783 1,225,179Mid-Atlantic 292,393 961,379 150,439 163,361 1,567,572Southeast 575,135 1,774,646 295,913 329,146 2,974,840Midwest 393,046 1,273,480 202,226 218,000 2,086,753Southwest 451,750 1,435,352 232,430 259,829 2,379,361Mountain Plains 198,819 639,821 102,294 124,974 1,065,909Western 569,955 1,779,437 293,248 347,551 2,990,191Total 2,702,049 8,622,879 1,390,233 1,574,645 14,289,805
ParticipantsNortheast 183,063 362,871 78,996 103,871 728,800Mid-Atlantic 239,615 476,415 99,318 126,122 941,470Southeast 420,942 702,285 176,133 220,187 1,519,547Midwest 322,616 555,975 133,496 156,055 1,168,142Southwest 332,999 625,705 144,053 179,342 1,282,099Mountain Plains 136,920 259,187 55,769 81,023 532,898Western 457,812 1,005,312 210,220 279,252 1,952,596Total 2,093,967 3,987,749 897,985 1,145,852 8,125,552
Coverage RatesNortheast 82.9% 47.8% 69.5% 78.8% 59.5%Mid-Atlantic 81.9% 49.6% 66.0% 77.2% 60.1%Southeast 73.2% 39.6% 59.5% 66.9% 51.1%Midwest 82.1% 43.7% 66.0% 71.6% 56.0%Southwest 73.7% 43.6% 62.0% 69.0% 53.9%Mountain Plains 68.9% 40.5% 54.5% 64.8% 50.0%Western 80.3% 56.5% 71.7% 80.3% 65.3%Total 77.5% 46.2% 64.6% 72.8% 56.9%
Source: 2007 CPS-ASEC, 2006 ACS, 2006 PRCS, Census International Data Base, WIC Administrative Data
Table D.4-2006: WIC Eligibles and Coverage Rates by FNS Region and Participant Group, CY 2006
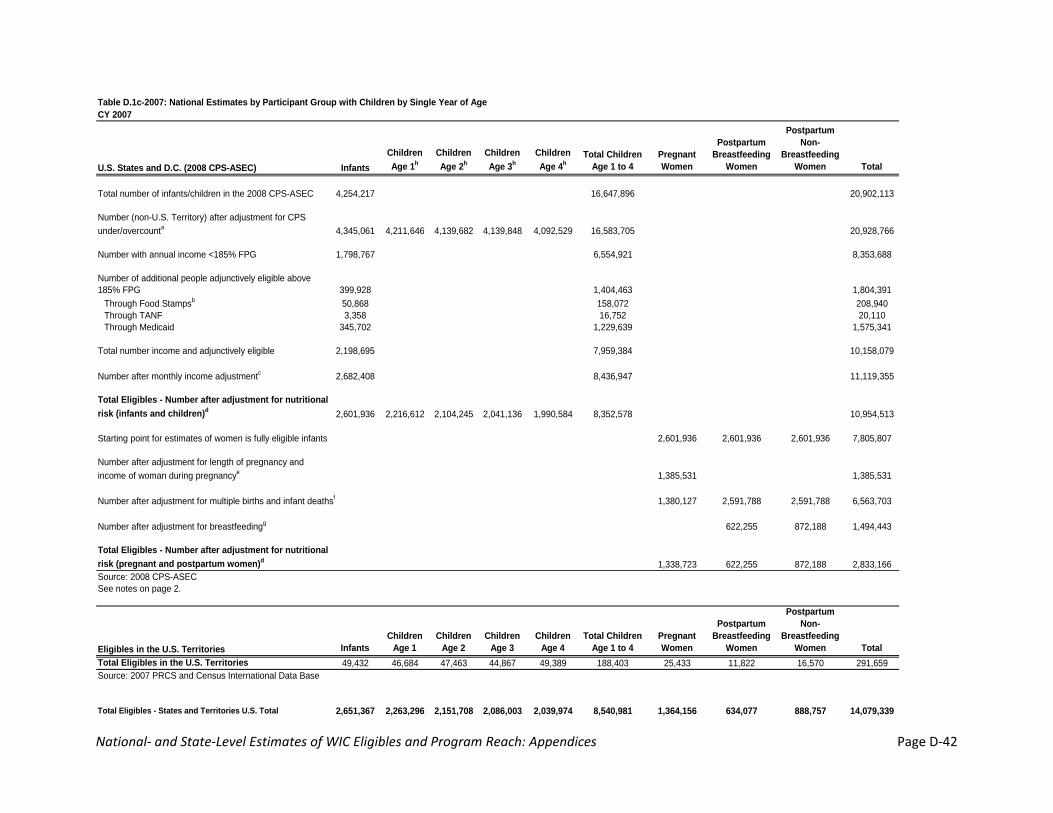
National‐ and State‐Level Estimates of WIC Eligibles and Program Reach: Appendices Page D‐42
Table D.1c-2007: National Estimates by Participant Group with Children by Single Year of AgeCY 2007
U.S. States and D.C. (2008 CPS-ASEC) InfantsChildren Age 1h
Children Age 2h
Children Age 3h
Children Age 4h
Total Children Age 1 to 4
Pregnant Women
Postpartum Breastfeeding
Women
Postpartum Non-
Breastfeeding Women Total
Total number of infants/children in the 2008 CPS-ASEC 4,254,217 16,647,896 20,902,113
Number (non-U.S. Territory) after adjustment for CPS under/overcounta 4,345,061 4,211,646 4,139,682 4,139,848 4,092,529 16,583,705 20,928,766
Number with annual income <185% FPG 1,798,767 6,554,921 8,353,688
Number of additional people adjunctively eligible above 185% FPG 399,928 1,404,463 1,804,391
Through Food Stampsb 50,868 158,072 208,940Through TANF 3,358 16,752 20,110Through Medicaid 345,702 1,229,639 1,575,341
Total number income and adjunctively eligible 2,198,695 7,959,384 10,158,079
Number after monthly income adjustmentc 2,682,408 8,436,947 11,119,355
Total Eligibles - Number after adjustment for nutritional risk (infants and children)d 2,601,936 2,216,612 2,104,245 2,041,136 1,990,584 8,352,578 10,954,513
Starting point for estimates of women is fully eligible infants 2,601,936 2,601,936 2,601,936 7,805,807
Number after adjustment for length of pregnancy and income of woman during pregnancye 1,385,531 1,385,531
Number after adjustment for multiple births and infant deathsf 1,380,127 2,591,788 2,591,788 6,563,703
Number after adjustment for breastfeedingg 622,255 872,188 1,494,443
Total Eligibles - Number after adjustment for nutritional risk (pregnant and postpartum women)d 1,338,723 622,255 872,188 2,833,166Source: 2008 CPS-ASECSee notes on page 2.
Eligibles in the U.S. Territories InfantsChildren
Age 1Children
Age 2Children
Age 3Children
Age 4Total Children
Age 1 to 4Pregnant Women
Postpartum Breastfeeding
Women
Postpartum Non-
Breastfeeding Women Total
Total Eligibles in the U.S. Territories 49,432 46,684 47,463 44,867 49,389 188,403 25,433 11,822 16,570 291,659Source: 2007 PRCS and Census International Data Base
Total Eligibles - States and Territories U.S. Total 2,651,367 2,263,296 2,151,708 2,086,003 2,039,974 8,540,981 1,364,156 634,077 888,757 14,079,339
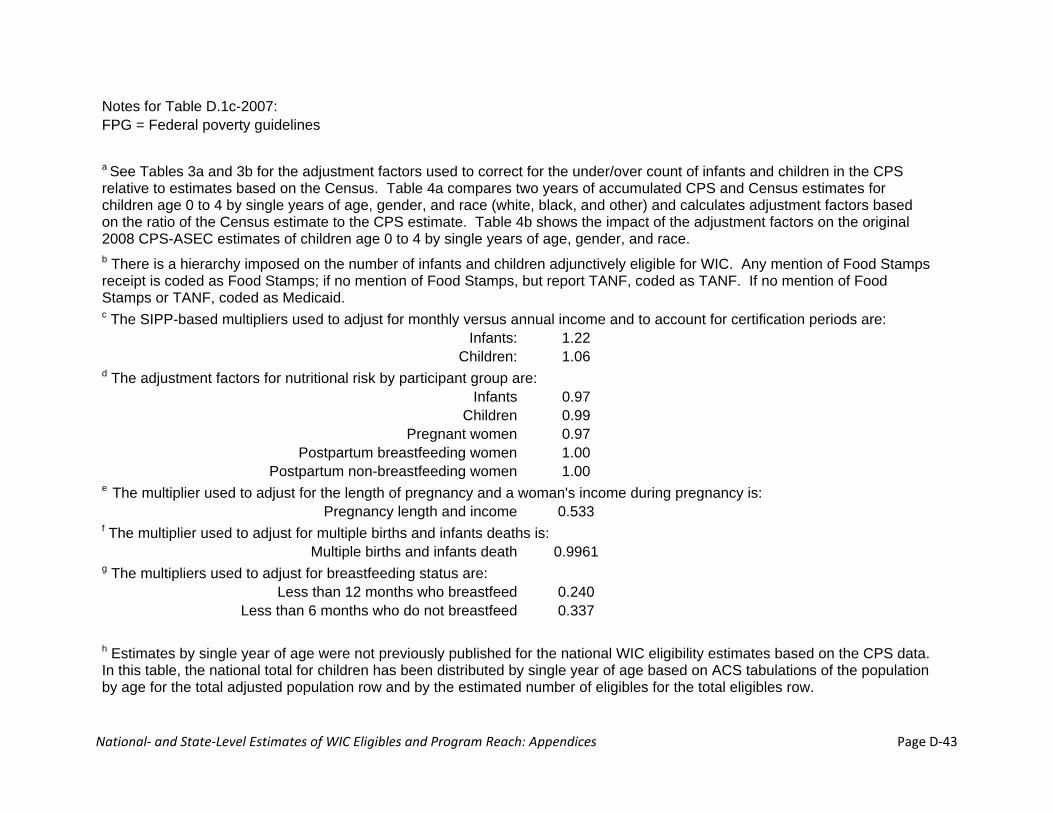
National‐ and State‐Level Estimates of WIC Eligibles and Program Reach: Appendices Page D‐43
Notes for Table D.1c-2007: FPG = Federal poverty guidelines
a See Tables 3a and 3b for the adjustment factors used to correct for the under/over count of infants and children in the CPS relative to estimates based on the Census. Table 4a compares two years of accumulated CPS and Census estimates for children age 0 to 4 by single years of age, gender, and race (white, black, and other) and calculates adjustment factors based on the ratio of the Census estimate to the CPS estimate. Table 4b shows the impact of the adjustment factors on the original 2008 CPS-ASEC estimates of children age 0 to 4 by single years of age, gender, and race. b There is a hierarchy imposed on the number of infants and children adjunctively eligible for WIC. Any mention of Food Stamps receipt is coded as Food Stamps; if no mention of Food Stamps, but report TANF, coded as TANF. If no mention of Food Stamps or TANF, coded as Medicaid. c The SIPP-based multipliers used to adjust for monthly versus annual income and to account for certification periods are:
Infants: 1.22 Children: 1.06
d The adjustment factors for nutritional risk by participant group are: Infants 0.97
Children 0.99 Pregnant women 0.97
Postpartum breastfeeding women 1.00 Postpartum non-breastfeeding women 1.00
e The multiplier used to adjust for the length of pregnancy and a woman's income during pregnancy is: Pregnancy length and income 0.533
f The multiplier used to adjust for multiple births and infants deaths is: Multiple births and infants death 0.9961
g The multipliers used to adjust for breastfeeding status are: Less than 12 months who breastfeed 0.240
Less than 6 months who do not breastfeed 0.337
h Estimates by single year of age were not previously published for the national WIC eligibility estimates based on the CPS data. In this table, the national total for children has been distributed by single year of age based on ACS tabulations of the population by age for the total adjusted population row and by the estimated number of eligibles for the total eligibles row.
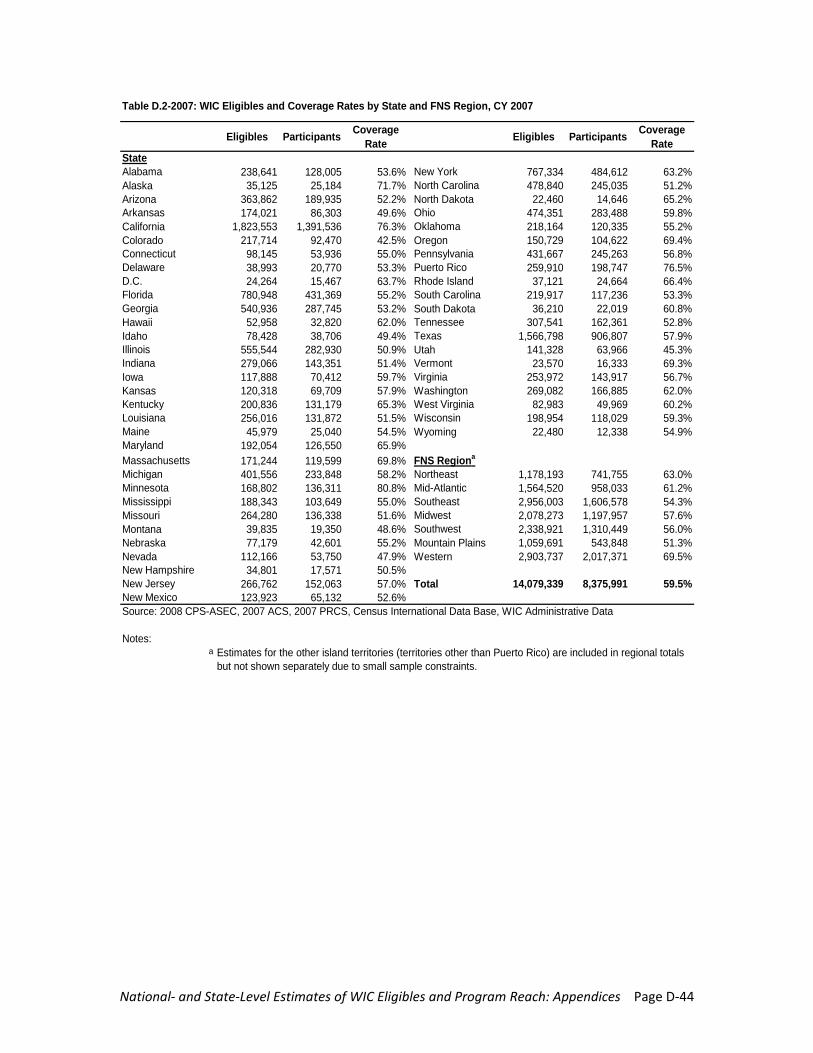
National‐ and State‐Level Estimates of WIC Eligibles and Program Reach: Appendices Page D‐44
Eligibles Participants Coverage Rate Eligibles Participants Coverage
RateStateAlabama 238,641 128,005 53.6% New York 767,334 484,612 63.2%Alaska 35,125 25,184 71.7% North Carolina 478,840 245,035 51.2%Arizona 363,862 189,935 52.2% North Dakota 22,460 14,646 65.2%Arkansas 174,021 86,303 49.6% Ohio 474,351 283,488 59.8%California 1,823,553 1,391,536 76.3% Oklahoma 218,164 120,335 55.2%Colorado 217,714 92,470 42.5% Oregon 150,729 104,622 69.4%Connecticut 98,145 53,936 55.0% Pennsylvania 431,667 245,263 56.8%Delaware 38,993 20,770 53.3% Puerto Rico 259,910 198,747 76.5%D.C. 24,264 15,467 63.7% Rhode Island 37,121 24,664 66.4%Florida 780,948 431,369 55.2% South Carolina 219,917 117,236 53.3%Georgia 540,936 287,745 53.2% South Dakota 36,210 22,019 60.8%Hawaii 52,958 32,820 62.0% Tennessee 307,541 162,361 52.8%Idaho 78,428 38,706 49.4% Texas 1,566,798 906,807 57.9%Illinois 555,544 282,930 50.9% Utah 141,328 63,966 45.3%Indiana 279,066 143,351 51.4% Vermont 23,570 16,333 69.3%Iowa 117,888 70,412 59.7% Virginia 253,972 143,917 56.7%Kansas 120,318 69,709 57.9% Washington 269,082 166,885 62.0%Kentucky 200,836 131,179 65.3% West Virginia 82,983 49,969 60.2%Louisiana 256,016 131,872 51.5% Wisconsin 198,954 118,029 59.3%Maine 45,979 25,040 54.5% Wyoming 22,480 12,338 54.9%Maryland 192,054 126,550 65.9%Massachusetts 171,244 119,599 69.8% FNS Regiona
Michigan 401,556 233,848 58.2% Northeast 1,178,193 741,755 63.0%Minnesota 168,802 136,311 80.8% Mid-Atlantic 1,564,520 958,033 61.2%Mississippi 188,343 103,649 55.0% Southeast 2,956,003 1,606,578 54.3%Missouri 264,280 136,338 51.6% Midwest 2,078,273 1,197,957 57.6%Montana 39,835 19,350 48.6% Southwest 2,338,921 1,310,449 56.0%Nebraska 77,179 42,601 55.2% Mountain Plains 1,059,691 543,848 51.3%Nevada 112,166 53,750 47.9% Western 2,903,737 2,017,371 69.5%New Hampshire 34,801 17,571 50.5%New Jersey 266,762 152,063 57.0% Total 14,079,339 8,375,991 59.5%New Mexico 123,923 65,132 52.6%Source: 2008 CPS-ASEC, 2007 ACS, 2007 PRCS, Census International Data Base, WIC Administrative Data
Notes:a
Table D.2-2007: WIC Eligibles and Coverage Rates by State and FNS Region, CY 2007
Estimates for the other island territories (territories other than Puerto Rico) are included in regional totals but not shown separately due to small sample constraints.

National‐ and State‐Level Estimates of WIC Eligibles and Program Reach: Appendices Page D‐45
Eligibles Participants Coverage Rate Eligibles Participants Coverage
RateNortheast 1,178,193 741,755 63.0% Southwest 2,338,921 1,310,449 56.0%
Connecticut 98,145 53,936 55.0% Arkansas 174,021 86,303 49.6%Maine 45,979 25,040 54.5% Louisiana 256,016 131,872 51.5%Massachusetts 171,244 119,599 69.8% New Mexico 123,923 65,132 52.6%New Hampshire 34,801 17,571 50.5% Oklahoma 218,164 120,335 55.2%New York 767,334 484,612 63.2% Texas 1,566,798 906,807 57.9%Rhode Island 37,121 24,664 66.4%Vermont 23,570 16,333 69.3% Mountain Plains 1,059,691 543,848 51.3%
Colorado 217,714 92,470 42.5%Mid-Atlantic 1,564,520 958,033 61.2% Iowa 117,888 70,412 59.7%
Delaware 38,993 20,770 53.3% Kansas 120,318 69,709 57.9%D.C. 24,264 15,467 63.7% Missouri 264,280 136,338 51.6%Maryland 192,054 126,550 65.9% Montana 39,835 19,350 48.6%New Jersey 266,762 152,063 57.0% Nebraska 77,179 42,601 55.2%Pennsylvania 431,667 245,263 56.8% North Dakota 22,460 14,646 65.2%Puerto Rico 259,910 198,747 76.5% South Dakota 36,210 22,019 60.8%Virginia 253,972 143,917 56.7% Utah 141,328 63,966 45.3%West Virginia 82,983 49,969 60.2% Wyoming 22,480 12,338 54.9%
Southeast 2,956,003 1,606,578 54.3% Western 2,903,737 2,017,371 69.5%Alabama 238,641 128,005 53.6% Alaska 35,125 25,184 71.7%Florida 780,948 431,369 55.2% Arizona 363,862 189,935 52.2%Georgia 540,936 287,745 53.2% California 1,823,553 1,391,536 76.3%Kentucky 200,836 131,179 65.3% Hawaii 52,958 32,820 62.0%Mississippi 188,343 103,649 55.0% Idaho 78,428 38,706 49.4%North Carolina 478,840 245,035 51.2% Nevada 112,166 53,750 47.9%South Carolina 219,917 117,236 53.3% Oregon 150,729 104,622 69.4%Tennessee 307,541 162,361 52.8% Washington 269,082 166,885 62.0%
Midwest 2,078,273 1,197,957 57.6% Total 14,079,339 8,375,991 59.5%Illinois 555,544 282,930 50.9%Indiana 279,066 143,351 51.4%Michigan 401,556 233,848 58.2%Minnesota 168,802 136,311 80.8%Ohio 474,351 283,488 59.8%Wisconsin 198,954 118,029 59.3%
Source: 2008 CPS-ASEC, 2007 ACS, 2007 PRCS, Census International Data Base, WIC Administrative Data
Notes:a
Table D.3-2007: WIC Eligibles and Coverage Rates by FNS Region and State, CY 2007a
Estimates for the other island territories (territories other than Puerto Rico) are included in regional totals but not shown separately due to small sample constraints.
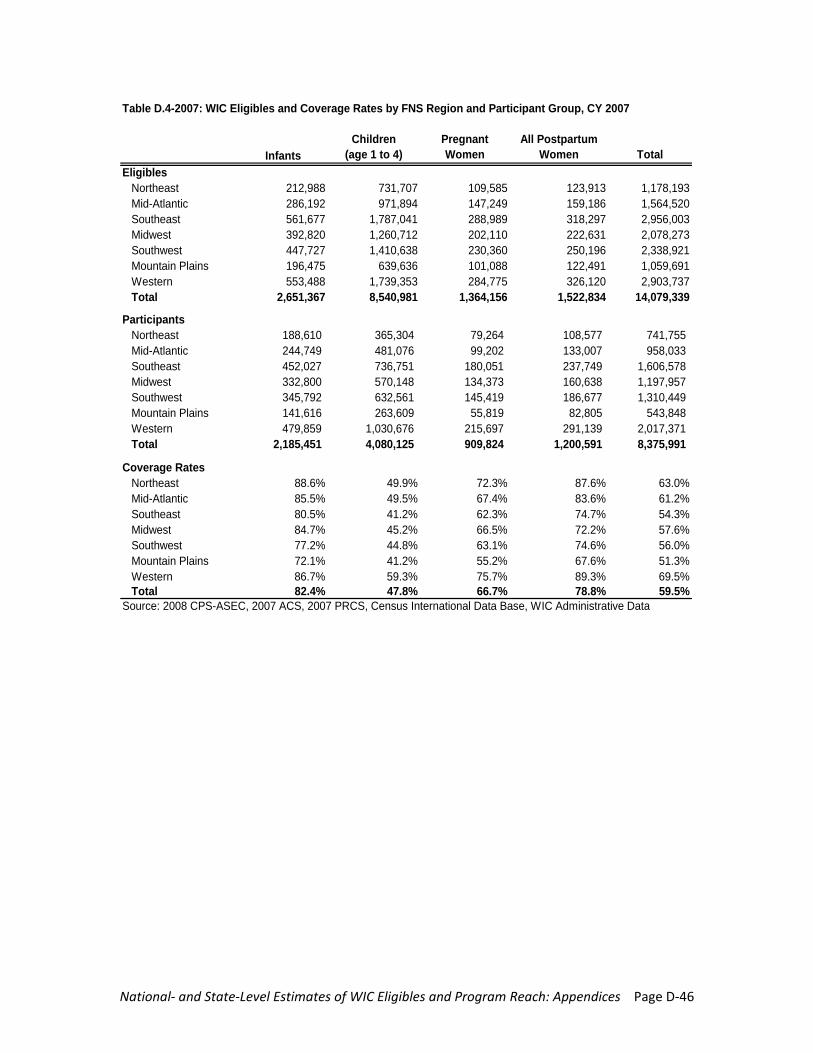
National‐ and State‐Level Estimates of WIC Eligibles and Program Reach: Appendices Page D‐46
InfantsChildren
(age 1 to 4)Pregnant Women
All Postpartum Women Total
EligiblesNortheast 212,988 731,707 109,585 123,913 1,178,193Mid-Atlantic 286,192 971,894 147,249 159,186 1,564,520Southeast 561,677 1,787,041 288,989 318,297 2,956,003Midwest 392,820 1,260,712 202,110 222,631 2,078,273Southwest 447,727 1,410,638 230,360 250,196 2,338,921Mountain Plains 196,475 639,636 101,088 122,491 1,059,691Western 553,488 1,739,353 284,775 326,120 2,903,737Total 2,651,367 8,540,981 1,364,156 1,522,834 14,079,339
ParticipantsNortheast 188,610 365,304 79,264 108,577 741,755Mid-Atlantic 244,749 481,076 99,202 133,007 958,033Southeast 452,027 736,751 180,051 237,749 1,606,578Midwest 332,800 570,148 134,373 160,638 1,197,957Southwest 345,792 632,561 145,419 186,677 1,310,449Mountain Plains 141,616 263,609 55,819 82,805 543,848Western 479,859 1,030,676 215,697 291,139 2,017,371Total 2,185,451 4,080,125 909,824 1,200,591 8,375,991
Coverage RatesNortheast 88.6% 49.9% 72.3% 87.6% 63.0%Mid-Atlantic 85.5% 49.5% 67.4% 83.6% 61.2%Southeast 80.5% 41.2% 62.3% 74.7% 54.3%Midwest 84.7% 45.2% 66.5% 72.2% 57.6%Southwest 77.2% 44.8% 63.1% 74.6% 56.0%Mountain Plains 72.1% 41.2% 55.2% 67.6% 51.3%Western 86.7% 59.3% 75.7% 89.3% 69.5%Total 82.4% 47.8% 66.7% 78.8% 59.5%
Source: 2008 CPS-ASEC, 2007 ACS, 2007 PRCS, Census International Data Base, WIC Administrative Data
Table D.4-2007: WIC Eligibles and Coverage Rates by FNS Region and Participant Group, CY 2007
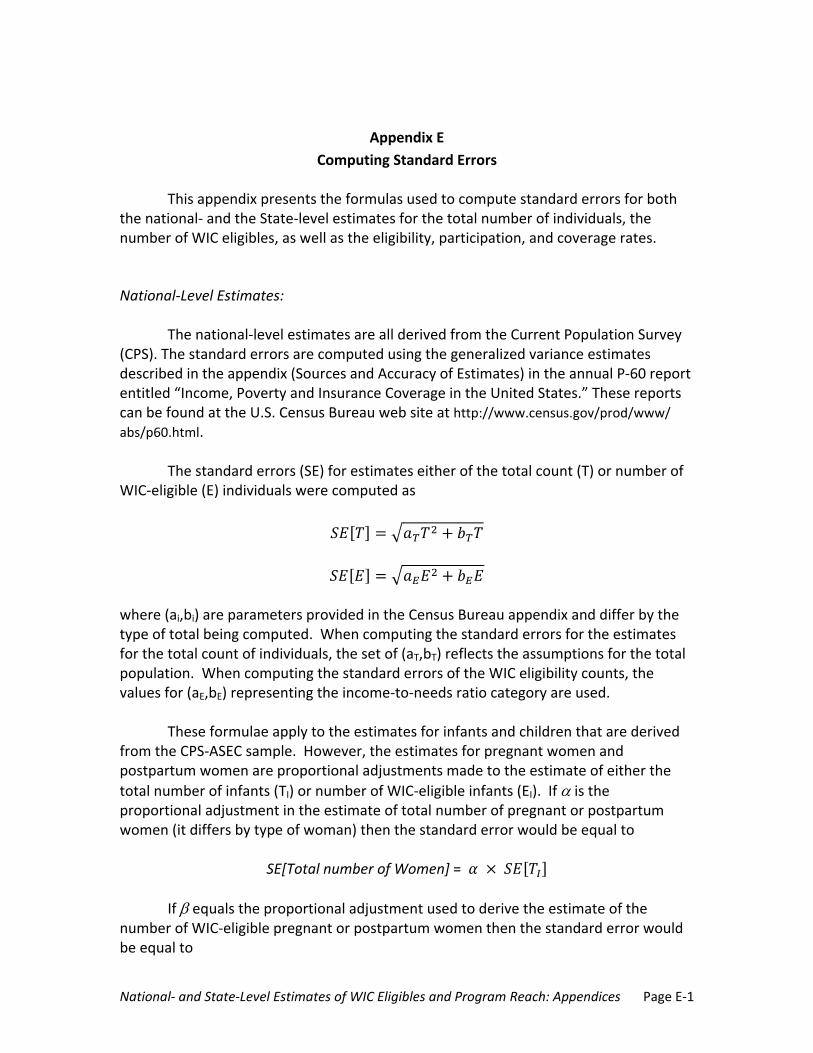
National‐ and State‐Level Estimates of WIC Eligibles and Program Reach: Appendices Page E‐1
Appendix E
Computing Standard Errors
This appendix presents the formulas used to compute standard errors for both the national‐ and the State‐level estimates for the total number of individuals, the number of WIC eligibles, as well as the eligibility, participation, and coverage rates. National‐Level Estimates:
The national‐level estimates are all derived from the Current Population Survey (CPS). The standard errors are computed using the generalized variance estimates described in the appendix (Sources and Accuracy of Estimates) in the annual P‐60 report entitled “Income, Poverty and Insurance Coverage in the United States.” These reports can be found at the U.S. Census Bureau web site at http://www.census.gov/prod/www/ abs/p60.html.
The standard errors (SE) for estimates either of the total count (T) or number of
WIC‐eligible (E) individuals were computed as
where (ai,bi) are parameters provided in the Census Bureau appendix and differ by the type of total being computed. When computing the standard errors for the estimates for the total count of individuals, the set of (aT,bT) reflects the assumptions for the total population. When computing the standard errors of the WIC eligibility counts, the values for (aE,bE) representing the income‐to‐needs ratio category are used.
These formulae apply to the estimates for infants and children that are derived from the CPS‐ASEC sample. However, the estimates for pregnant women and postpartum women are proportional adjustments made to the estimate of either the
total number of infants (TI) or number of WIC‐eligible infants (EI). If is the proportional adjustment in the estimate of total number of pregnant or postpartum women (it differs by type of woman) then the standard error would be equal to
SE[Total number of Women] =
If equals the proportional adjustment used to derive the estimate of the number of WIC‐eligible pregnant or postpartum women then the standard error would be equal to

National‐ and State‐Level Estimates of WIC Eligibles and Program Reach: Appendices Page E‐2
SE[WIC Eligible Women] = .
While the estimates of the number of participants are subject to error, we
assume that that neither sampling variation nor measurement error are present in the FNS estimates of participation (P). Consequently the SE[P] is assumed to be zero.
The standard errors of the coverage rate (CR = P/E) was derived using the ratio rule
where CV[X] is the coefficient of variation of X (= SE[X]/X). Given our assumption that CV[P] is equal to zero, the standard error of the coverage rate are equal to
.
State‐Level Estimates:
Estimates of the total number of individuals and the number of WIC‐eligible individuals are derived by multiplying the CPS national estimate of the total population
(T) or number of WIC eligibles (E) times the State’s share of the respective concept (Tj and Ej where the subscript j denotes the jth State). If Tj represents the total number of individuals in the jth State and Ej denotes the number of WIC eligibles in the jth State, then for infants and children,
While E and T are derived using CPS data, the ’s are derived using American Community Survey (ACS) data. T(ACS) and Tj(ACS) denote the total count of individuals in the nation and in the jth State, respectively, in the ACS data. Consequently,
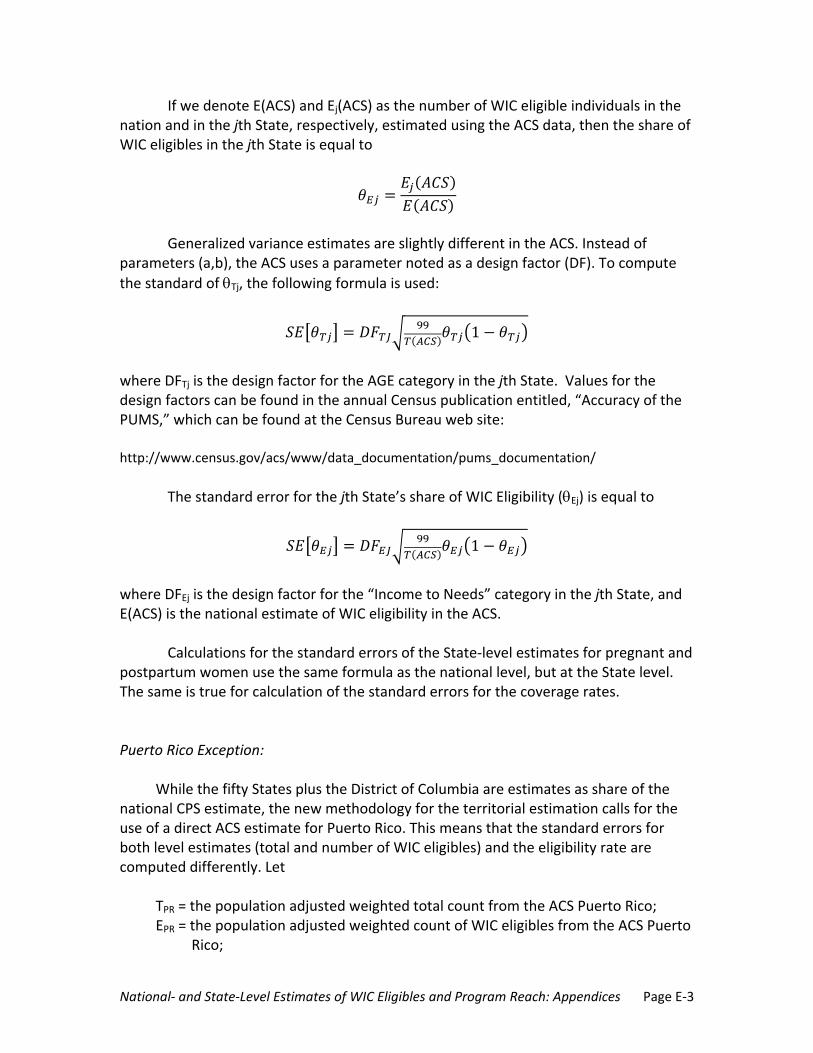
National‐ and State‐Level Estimates of WIC Eligibles and Program Reach: Appendices Page E‐3
If we denote E(ACS) and Ej(ACS) as the number of WIC eligible individuals in the nation and in the jth State, respectively, estimated using the ACS data, then the share of WIC eligibles in the jth State is equal to
Generalized variance estimates are slightly different in the ACS. Instead of
parameters (a,b), the ACS uses a parameter noted as a design factor (DF). To compute
the standard of Tj, the following formula is used:
1
where DFTj is the design factor for the AGE category in the jth State. Values for the design factors can be found in the annual Census publication entitled, “Accuracy of the PUMS,” which can be found at the Census Bureau web site: http://www.census.gov/acs/www/data_documentation/pums_documentation/
The standard error for the jth State’s share of WIC Eligibility (Ej) is equal to
1
where DFEj is the design factor for the “Income to Needs” category in the jth State, and E(ACS) is the national estimate of WIC eligibility in the ACS.
Calculations for the standard errors of the State‐level estimates for pregnant and postpartum women use the same formula as the national level, but at the State level. The same is true for calculation of the standard errors for the coverage rates. Puerto Rico Exception:
While the fifty States plus the District of Columbia are estimates as share of the national CPS estimate, the new methodology for the territorial estimation calls for the use of a direct ACS estimate for Puerto Rico. This means that the standard errors for both level estimates (total and number of WIC eligibles) and the eligibility rate are computed differently. Let
TPR = the population adjusted weighted total count from the ACS Puerto Rico; EPR = the population adjusted weighted count of WIC eligibles from the ACS Puerto
Rico;

National‐ and State‐Level Estimates of WIC Eligibles and Program Reach: Appendices Page E‐4
DFT,PR = the design factor for AGE in Puerto Rico; DFE,PR = the design factor for ’Income to Needs’ in Puerto Rico; and NPR = total population control (for all ages) in Puerto Rico.
The last three values can be found in the “Accuracy of the PUMS” publication described above.
The standard errors of TPR and EPR for infants and children are equal to
, 99 1
, 99 1 .
The standard errors for the estimates of women, participation rates, and coverage rates would be computed using the same formula used for the national estimates. Other Island Territories:
The standard errors for estimates reflect the effect of sampling has on the estimation process. They don’t reflect the effect of errors or uncertainty in the adjustments made to direct sample estimates. For example, in estimating the number of WIC‐eligible infants, we have adjusted the direct counts of infants who meet the eligibility criteria from the CPS. Because this estimate is based upon a sample, different samples can be expected to create different direct sample estimates. However, the adjustments, such as annual‐to‐monthly or for nutritional risk, are assumed to be constant and measured without error. The computed standard errors reflect only the potential variation in the estimates due to sampling and not the potential variation errors in the adjustments used to construct the estimates of eligibility.
Our estimates of eligibility in the 50 States, the District of Columbia, and Puerto Rico are based upon samples of households, and consequently they are subject to sampling variability. However, our estimates of WIC eligibility in the other island territories are not based on samples but rather on Census Bureau estimates of the population by age, and they are not subject to sampling variability. While non‐sampling error can still be present in the other island estimates just as they are for the other jurisdictions, standard errors for the other island territories cannot be computed because of the non‐sample based methodology used in the estimation.
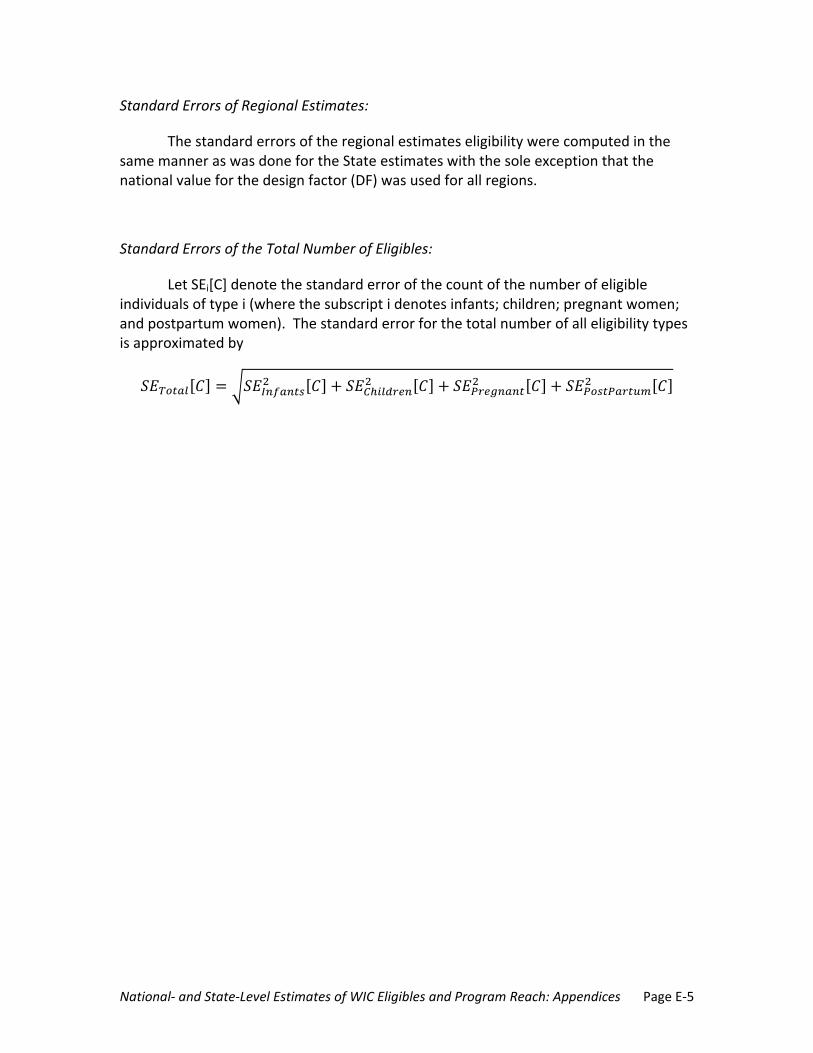
National‐ and State‐Level Estimates of WIC Eligibles and Program Reach: Appendices Page E‐5
Standard Errors of Regional Estimates:
The standard errors of the regional estimates eligibility were computed in the same manner as was done for the State estimates with the sole exception that the national value for the design factor (DF) was used for all regions.
Standard Errors of the Total Number of Eligibles:
Let SEi[C] denote the standard error of the count of the number of eligible individuals of type i (where the subscript i denotes infants; children; pregnant women; and postpartum women). The standard error for the total number of all eligibility types is approximated by

This page was left intentionally blank.
National‐ and State‐Level Estimates of WIC Eligibles and Program Reach: Appendices Page F‐1
Appendix F Estimating WIC Eligibility Among Postpartum Women
This appendix provides a detailed description of how WIC eligibility is
determined for postpartum women, including how estimates of breastfeeding rates are employed in the estimation. We begin with a description of the current methodology used to estimate WIC eligibility among mothers. Since WIC eligibility for postpartum women is determined not only on the basis of income or their participation in SNAP, TANF, or Medicaid, but also on whether or not they are breastfeeding, estimates of breastfeeding behavior are an important factor in this estimation. In this appendix, we evaluate the current source of the assumptions about breastfeeding rates and present recommendations about how these assumptions may in the future be improved.
Estimating WIC Eligibility for Postpartum Women
The estimation of the number of WIC‐eligible postpartum women reflects that the number of potentially WIC‐eligible mothers is closely related to the number of WIC‐eligible infants. However, it is not a one‐to‐one relationship due to multiple births and infant deaths. Consequently, the total number of mothers of WIC‐eligible infants (M) will be less than the number of WIC‐eligible infants (EI). The relationship can be estimated with vital statistics data and Census Bureau population estimates, given the following relationship between M and EI:
.9961
While infants can be certified for WIC eligibility up to their first birthday, mothers with a WIC‐eligible infant are initially certified for only the first six months. Breastfeeding mothers can be recertified for an additional six months (if they continue to satisfy other eligibility requirements), but mothers who are not breastfeeding at six months cannot gain additional eligibility. Given that different benefit packages are provided to mothers and infants based upon whether the mother is breastfeeding, the total universe of mothers of WIC‐eligible infants is broken down into four groups: mothers who are breastfeeding at birth; mothers who are not breastfeeding at birth; mothers who are breastfeeding at six months; and mothers who are not breastfeeding at six months. Of these four groups, the first three are potentially eligible for WIC while the last group of mothers will not be eligible. The implicit assumption employed by the current methodology is that mothers apply for WIC eligibility at the birth of the child, and then reapply (if still breastfeeding) at six months postpartum.
The division of the universe of the mothers of WIC‐eligible infants into four groups is based on two key pieces of information—the breastfeeding rates of the
National‐ and State‐Level Estimates of WIC Eligibles and Program Reach: Appendices Page F‐2
mothers of WIC‐eligible infants at birth or in the hospital and the breastfeeding rates of these mothers at six months postpartum. The Ross Labs Mothers Survey (RLMS) is the current source of estimates of breastfeeding rates for mothers participating in WIC. The
estimates of in‐hospital breastfeeding rates (RLMS,0) and at six months (RLMS,6) are published annually and are available at both the national and State levels.
While the RLMS can provide estimates of mothers who are participating in WIC, we need estimates of breastfeeding rates of mothers who are eligible for WIC. (The difference between these two populations is most likely related to income where the average income of WIC participants is lower than the average income of WIC‐eligible mothers.) If breastfeeding rates are positively related to income then the use of breastfeeding rates for WIC participants would underestimate the breastfeeding rate for mothers who are WIC‐eligible. To acquire an estimate of the relationship between the breastfeeding rates of these two groups, breastfeeding rates for both groups can be computed from the NHANES and their ratio employed to adjust the RLMS breastfeeding rates. This adjustment factor is computed separately at the in‐hospital and at six
months. The current values for the NHANES adjustment in hospital (NHANES,0) and at six
months (NHANES,6) are 1.056 and 1.150 respectively.
In the absence of further complications, the estimated rates of breastfeeding by mothers of WIC‐eligible infants at birth and in the hospital could be used to estimate the numbers of breastfeeding and non‐breastfeeding WIC‐eligible mothers in the first six months, and the number of breastfeeding WIC‐eligible mothers in the second six months. However, not all mothers of WIC‐eligible infants will be either income or adjunctively WIC eligible, either at the birth of their child or at six months postpartum when they must be recertified. For example, consider the situation where at birth the infant is not income‐eligible but gains WIC eligibility through enrollment in Medicaid. Unless the mother is also enrolled in Medicaid, she will not be WIC‐eligible. While the mother may not be WIC‐eligible at the birth of her child, the mother may gain WIC eligibility prior to being six months postpartum. Given declining breastfeeding rates during the infant’s first year, the in‐hospital rate will overstate the prevalence of breastfeeding for these mothers and cause a misclassification between breastfeeding and non‐breastfeeding WIC eligibles. Even when the mother is WIC‐eligible at the birth of the child, she may not be at the time of the six‐month recertification. Finally, mothers who are certified as breastfeeding may have incentive to report that they have stopped breastfeeding prior to the end of a certification period, in order to obtain a food package that considers their infant fully fed by formula.
To account for the complications caused by declining breastfeeding rates during the year, data from the Survey of Income and Program Participation (SIPP) have been
used to simulate adjustments to the in‐hospital (SIPP,0) and the six‐month breastfeeding
rates (SIPP,6). Adjustments were initially calculated by Urban Institute staff under a prior contract. MPR updated the calculations, adding an assumption that a
National‐ and State‐Level Estimates of WIC Eligibles and Program Reach: Appendices Page F‐3
breastfeeding mother will immediately report her change in status if she stops breastfeeding.
Two simulations are performed with different breastfeeding assumptions, and the average monthly estimates of WIC‐eligible mothers produced by the two simulations are compared to derive the adjustment factors. The simulations begin by identifying mothers of infants who are WIC‐eligible in the SIPP. For each month in the sample, the number of months since the birth of the child is determined, as well as whether the mother is WIC‐eligible based upon income or through participation in SNAP, TANF, or Medicaid. Next, two distinct patterns of breastfeeding behavior are randomly assigned based upon the breastfeeding rates by postpartum month estimated from the NHANES data. One pattern of monthly breastfeeding assumes that the in‐hospital rate remains constant for the first six months, and then the six‐month rate is assumed for months 6 through 12. For example, assume that the in‐hospital rate is 60 percent while the six‐month rate is 25 percent. A random number from a uniform distribution is drawn (the same random number is used for all imputations) and if the random number is 0.60 or less then the mother is assumed to breastfeed for the first six months (months 0 through 5). Otherwise the mother is assumed not to have initiated breastfeeding. Next, if the random number is 0.25 or less then the mother is assumed to breastfeed in the second six months (months 6 through 11). If the random number is greater than 0.25 but less than or equal to 0.60, then the mother is imputed to have breastfeed the child during the first six months but not during the second six months.
The second simulated breastfeeding pattern is based upon declining monthly breastfeeding rates tabulated from NHANES data. While the breastfeeding behavior in first and sixth month of the child’s life is the same under both imputations, the second set of monthly breastfeeding statuses will differ across the two simulations for months 1 through 5 and 7 through 11. Continuing with the above example, the in‐hospital rate is still assumed to be 60 percent. Assume further that in month one the breastfeeding rate falls to 55 percent and then to 50 percent in month two and so on until it is 25 percent in month six. The second set of imputed breastfeeding data uses these rates to assign breastfeeding status in the same manner as above. If the random number is 0.60 or less then the mother is assumed to be breastfeeding in month zero, otherwise she is not breastfeeding. In month one, if the random number is 0.55 or less then the mother is assumed to have continued breastfeeding. If the random number is 0.50 or less then the mother is assumed to have continued into the third month and so on until month 11.
Beginning with the birth month of the infant, mothers are certified based upon whether they are income or adjunctively eligible. If a mother is WIC‐eligible at birth, then she is certified for six months of WIC eligibility. If she was not initially eligible but becomes WIC‐eligible in the second postpartum month, she is assigned five months of eligibility. This continues until the sixth month. In the sixth postpartum month, the certification process begins again. If the mother is not breastfeeding in the sixth postpartum month, then the mother is no longer WIC‐eligible. However, if the mother is simulated to be breastfeeding and is WIC‐eligible, then an additional six months of

National‐ and State‐Level Estimates of WIC Eligibles and Program Reach: Appendices Page F‐4
eligibility is assigned to the mother. However, if she is not WIC‐eligible in the sixth postpartum month but is still breastfeeding and becomes WIC‐eligible in the seventh postpartum month then five months of eligibility is assigned to the mother. This process continues through the remaining months until her child is one year old.
Each simulation produces two weighted counts—total months of WIC eligibility for breastfeeding mothers in the first six months and the second six months. The counts are compared to compute two adjustment factors. One adjustment factor is used to estimate average monthly eligibility for WIC‐eligible mothers of infants under six
months old (SIPP,0) and the other is used to estimate eligibility for mothers with infants
ages six months to under one year old ( SIPP,6). Each adjustment factor is equal to the eligibility estimate from the simulation of month‐by‐month breastfeeding rates (which decline over the year) divided by the eligibility estimate from the simulation that uses the in‐hospital rates for the first half of the infant’s first year and at the at‐six‐months rate for the second half of the year. Since the simpler assumptions overstate eligibility, the factors are less than 1.
The estimation of the three groups of WIC‐eligible mothers can be summarized as
,12
, , ,
,12
, , ,
, ,
12
1 , , ,
where EBFPW,0 is equal to the number of WIC‐eligible postpartum women who are breastfeeding during the first six months; EBFPW,6 is equal to the number of WIC‐eligible postpartum women breastfeeding in the second six months; EBFPW is equal to the number of breastfeeding WIC‐eligible postpartum women; and ENBFPW is equal to the number of WIC‐eligible postpartum women who do not breastfeed and are eligible for a maximum of six months. (Note that a separate adjustment factor is not needed for the non‐breastfeeding women. To the extent that the adjustment causes the estimate of breastfeeding mothers in the first six months to fall, the estimate of non‐breastfeeding mothers in the first six months increases.) In all three equations, the ½ reflects the six‐month period of certification attached to each category since M—the number of mothers of WIC‐eligible infants—reflects an annual average count of mothers.
National‐ and State‐Level Estimates of WIC Eligibles and Program Reach: Appendices Page F‐5
Recommendations for Improving the Current Methodology
These procedures have led researchers to recommend possible use of the National Immunization Survey (NIS) as the source of breastfeeding rates in lieu of the RLMS. The breastfeeding rates in these two surveys display remarkably different trends. While the RLMS breastfeeding rates have shown a downward trend over time, the NIS shows an upward trend. Given the similarity of the NIS with other government surveys (NHANES and others) most observers believe that the RLMS estimates are providing a misleading picture of WIC participants. Switching to the NIS would have the effect of increasing the recent estimates of breastfeeding WIC‐eligible mothers while decreasing the estimates of non‐breastfeeding WIC‐eligible mothers. This option must be carefully considered, however.
There are at least three concerns with the NIS data. The first is the fact that mothers are asked to recall breastfeeding information for children who are 19 to 35 months at the time of the interview. This suggests the need to examine the potential recall bias in the NIS. Second, the age range of the children who are the focus of the NIS means that it requires three years of NIS data to estimate the breastfeeding rates of infants born in the same calendar year. This creates a significant time delay in the estimates of breastfeeding rates. For example, the 2009 Report Card on Breastfeeding utilizes data on infants born in 2006. A third concern is the sample size of the NIS. While the NIS is larger today than when it was introduced, the sample size and design may not render it possible to estimate breastfeeding rates at the State level. Prior to any decision about changing the source of breastfeeding rates these issues will need to be addressed.
Researchers have also recommended accounting for how factors other than WIC eligibility affect breastfeeding rates. Instead of using a single breastfeeding rate for all WIC‐eligible mothers, this recommendation calls for the application of a multivariate model of breastfeeding patterns. This may be reasonable, but it is not clear that it will markedly improve the accuracy of the estimates for breastfeeding and non‐breastfeeding WIC‐eligible mothers. What would be improved would be the ability to identify characteristics of the group of WIC‐eligible postpartum women. However, this would come at the cost of annually (or periodically) updating a multivariate model of breastfeeding.
This review of the breastfeeding adjusters also leads us to recommend the recalculation of the adjusters derived from SIPP using the latest data. We note that other information affecting the postpartum estimates—the annual‐to‐monthly adjustment applied to infants and the breastfeeding rates over 12 months—has been estimated at different times using different years of data. It is not totally clear how this progression has affected the outcomes over time. Also, we know that adjunctive eligibility through SNAP and Medicaid has been changing in recent years. A complete re‐estimation of this set of assumptions would provide greater confidence that they do

National‐ and State‐Level Estimates of WIC Eligibles and Program Reach: Appendices Page F‐6
indeed represent today's breastfeeding behavior and mothers' income and adjunctive eligibility.
National‐ and State‐Level Estimates of WIC Eligibles and Program Reach: Appendices Page G‐1
Appendix G Annual‐to‐Monthly Adjustment Factor
The annual‐to‐monthly adjustment factor is one of several adjustments used to estimate the
number of WIC‐eligible infants and young children, following procedures outlined in 2003 by CNSTAT.
This factor accounts for the fact that the initial WIC eligibility estimates for infants and young children
are based on an annual accounting period (the CPS‐ASEC asks annual income and whether the family
ever participated in various programs) with no modeling of intra‐year income fluctuations or periods
during which an enrolled infant or child remains eligible regardless of income changes. In reality,
families’ incomes may fluctuate during the year; a family with income above 185 percent of the poverty
guideline on an annual basis may have had income below that level for part of the year. Further, people
remain enrolled during their certification period (12 months for infants and 6 months for children age 1
through 4) even if their circumstances change. As a result, some infants and children not identified as
eligible based on annual income and program participation might in fact be eligible if their families
applied for benefits in certain months of the year; or they might still be eligible in the early part of a year
due to low income at the end of the prior calendar year.
The annual‐to‐monthly adjustment factor can have a substantial impact on the WIC eligibility
estimates. This memorandum examines the apparent changes in this factor over time, and provides
recommendations for FNS to consider for future work.
The Computation of the Annual‐to‐Monthly Adjustment Factor
The annual‐to‐monthly adjustment factor has been derived from analysis of data from the SIPP
and updated periodically. Separate adjustments are estimated for infants and children to reflect their
different eligibility periods. The factors are calculated using two different SIPP‐based WIC eligibility
estimates:
First, an estimate that mimics the type of estimates that can be computed from the CPS‐
ASEC data, with family income and program participation status viewed on a calendar‐
year basis, and with age taken from the March following the calendar year.3 The infant
or child is counted as eligible for the entire year.
Second, an estimate that takes advantage of the monthly detail available in SIPP,
assessing each month’s eligibility based on age, family income, and program
participation in that month, and then considering an infant or child eligible for the
duration of the certification period. If the end of a certification period occurs during the
calendar year, eligibility is re‐assessed to see if eligibility will continue. Because an 11‐
month‐old in January could be eligible based on initial enrollment at birth in February of
the prior calendar year, creating this eligibility estimate for a particular calendar year
requires SIPP data from February of the prior calendar year.
3 If a child’s family does not have data for that March, the child’s age is taken from the latest month for which the child’s family has data.

National‐ and State‐Level Estimates of WIC Eligibles and Program Reach: Appendices Page G‐2
The use of monthly income data (in the second estimate) finds more infants and children ever‐
eligible during the calendar year than the use of annual income data (in the first estimate); all those with
annual income below 185 percent of the poverty guidelines will have monthly income below that level
in at least one month. However, the modeling of certification periods can both increase and decrease
the eligibility estimates in average monthly terms. For example, a child with annual income just below
185 percent of the guidelines is considered eligible for 12 months in the first estimate, but if the family’s
income only fell below 185% of poverty during October, the second estimate will count this child as
eligible for only 3 months of the calendar year.
The annual‐to‐monthly adjustment factor is the ratio of the estimate including monthly detail
and modeling certification periods to the estimate that uses only annual data produces the adjustment
factors.
Past Estimates and Changes Over Time
To date, these adjustment factors have been estimated for 1997 and 1998 (using the 1996 SIPP
panel), 2002 (2001 SIPP panel), and 2005 and 2006 (2004 SIPP panel). The SIPP panels provide data for
different spans of time, with the 1996 panel continuing for 4 years, the 2001 panel for 3 years, and the
2004 panel for 2.5 years. (After the 2004 panel, the next SIPP panel began interviews in September
2008; it could provide updates to the factor for 2010 through 2013).4
Past WIC eligibility estimates have generally used a simple average of the available factors. (See
table G.1.) The estimates for 1994 through 2005 used annual‐to‐monthly factors of 1.28 for infants and
1.10 for children, averaging across the factors computed for calendar years 1997, 1998, and 2002. The
2006 estimates appear to have used the factors of 1.15 and 1.00 computed from 2006 data in the 2004
SIPP panel.5 However, for the 2007 and 2008 WIC eligibility estimates, all five of the previously
estimated factors are averaged to produce adjustments of 1.22 for infants and 1.06 for children.
4 Note that the estimates require having 11 months of data prior to the calendar year estimate in order to estimate 12‐month certification. The 2008 panel is currently scheduled to include 17 waves, with the final interviews conducted in January through April 2014, collecting information through at least December 2013 for all rotation groups. 5 We draw this conclusion on the basis of unpublished memoranda that accompanied the submission of the estimates for FNS.

National‐ and State‐Level Estimates of WIC Eligibles and Program Reach: Appendices Page G‐3
Table G.1
Adjustment Factors for the Impact of Fluctuations in Monthly Income and Certification Periods:
SIPP‐based eligibility estimates using annual vs. monthly approach, and resulting factors
Infants 1997 1998 2002 2005 2006 Average
Annual (% eligible) 44.01 45.77 47.83 52.72 49.16 47.90
Monthly (% eligible) 58.85 56.99 60.61 58.87 56.70 58.40
Factor 1.34 1.25 1.27 1.12 1.15 1.22
Children
Annual (% eligible) 48.26 45.45 52.38 55.71 54.23 51.21
Monthly (% eligible) 54.44 51.64 54.67 55.58 54.45 54.15
Factor 1.13 1.14 1.04 1.00 1.00 1.06
Source: various estimates from the SIPP.
As the data show, it is unclear whether there is a stable relationship between annual eligibility
and monthly eligibility with certification. The adjustment factors for 2005 and 2006 (based on the 2004
SIPP panel) are appreciably lower than the earlier estimates, despite the fact that the same computer
program was applied to the SIPP data to compute the adjustments.6 For infants, the 2005 and 2006
estimates are 1.12 and 1.15, compared to prior estimates of 1.34, 1.25, and 1.27. For children, both the
2005 and 2006 estimates are 1.00, compared to prior estimates of 1.13, 1.14, and 1.04. (In fact, for
2005, there was a very small reduction in the percent of children eligible for WIC using monthly income
and modeling certification periods compared to the percentage found eligible when the CPS‐ASEC
procedures are mimicked. This suggests that the impact of finding some children eligible for only part of
the year more than offset any increase in eligible children due to the use of monthly income.)
Focusing on two elements that are used to develop the factor—the two different SIPP‐based
estimates—table G.1 shows different patterns in the results from the two estimation approaches. The
percentages of infants and children eligible for WIC when the annual approach is applied to the SIPP
data tend to move upward over the period. The share of infants eligible for WIC increases from 44 to 53
percent over the 1997 to 2005 period and declines to 49 percent in 2006. The share of young children
eligible for WIC increases from 48 to 56 percent from 1997 to 2005 and declines to 54 percent in 2006.
6 The computer code was originally written by Sandra Nelson at the Urban Institute, under an earlier contract. We were informed by FNS that MPR did not change any of the computer code. Methods for extracting/preparing SIPP data would also affect results.

National‐ and State‐Level Estimates of WIC Eligibles and Program Reach: Appendices Page G‐4
In contrast, the percentages of infants and children eligible according to the SIPP‐based monthly
estimates show no clear pattern over the period.
Possible Reasons for the Changes
The changes in the factors over time raise questions about the most appropriate adjustments to
use for current and future estimates. The past practice of averaging the factors was based on the
assumption that changes from one estimate to another were due in large part to sampling variability,
with no systematic trend. The SIPP has a smaller sample than the CPS‐ASEC (44,000 families were
interviewed in the first wave of the 2004 panel, compared with 76,000 households in the ASEC data
covering CY 2004), and at least some portion of the year‐to‐year changes is due to sampling variability.
However, if there are other reasons for the changes in the adjustment factors, it would be preferable to
use only the most current factor or an average of a small number of recent factors, rather than an
average of the full set of factors back to 1997. Further, if differences are due to any underlying issues
related to the SIPP data that might also suggest a modified approach to obtaining the factors used for
future WIC eligibility estimates.
Given the small number of years for which this factor has been computed, it is not possible to
draw strong conclusions about whether the changes in the factor are due to sampling variability or
something more systematic. However, below we explore three possible reasons for systematic
differences in the annual‐to‐monthly adjustment factors: issues related to the SIPP data, trends in
adjunctive eligibility, and real‐world changes in income volatility.
(1) Issues Related to the SIPP Sample Data. The SIPP interviews a group of families (a “panel”)
for multiple years, and substantial numbers of SIPP respondents do not complete all waves of
interviews. Total sample loss rates were 36 percent for the 1996 panel (after 12 waves), 32 percent for
the 2001 panel (after 9 waves), and 37 percent for the 2004 panel (after 12 waves).7 The families who
leave may differ systematically from those who stay in the sample, and the Census Bureau attempts to
compensate for this possibility through changes to the weights. Nevertheless, a panel of experts
examining SIPP for the NRC lists “possible biases resulting from attrition” as a major weakness of the
survey (Citro and Scholz 2009). Since attrition cumulates throughout a panel, this could be a source of
the differences between two factors computed from the same panel’s data, with factors for years closer
to the start of a panel having less potential for being affected by attrition bias than factors for years
farther from the start of a panel. The within‐panel variation in the adjustment factor could also be
affected if respondents continue to participate, but if over time the quality of their reports decreases,
perhaps due to “sample fatigue.” However, table G.1 shows no clear pattern suggesting an impact from
attrition bias or changed reporting behavior; from 1997 to 1998 (1996 panel), the infant factor falls but
the child factor is almost unchanged; from 2005 to 2006 the infant factor rises very slightly but the child
factor is unchanged. Different patterns might be seen if estimates were produced for each year across a
longer panel (such as the current 2008 panel).
7 See “SIPP User’s Guide, Sample Design and Interview Procedures,” at http://www.census.gov/sipp/usrguide/ch2_nov20.pdf.
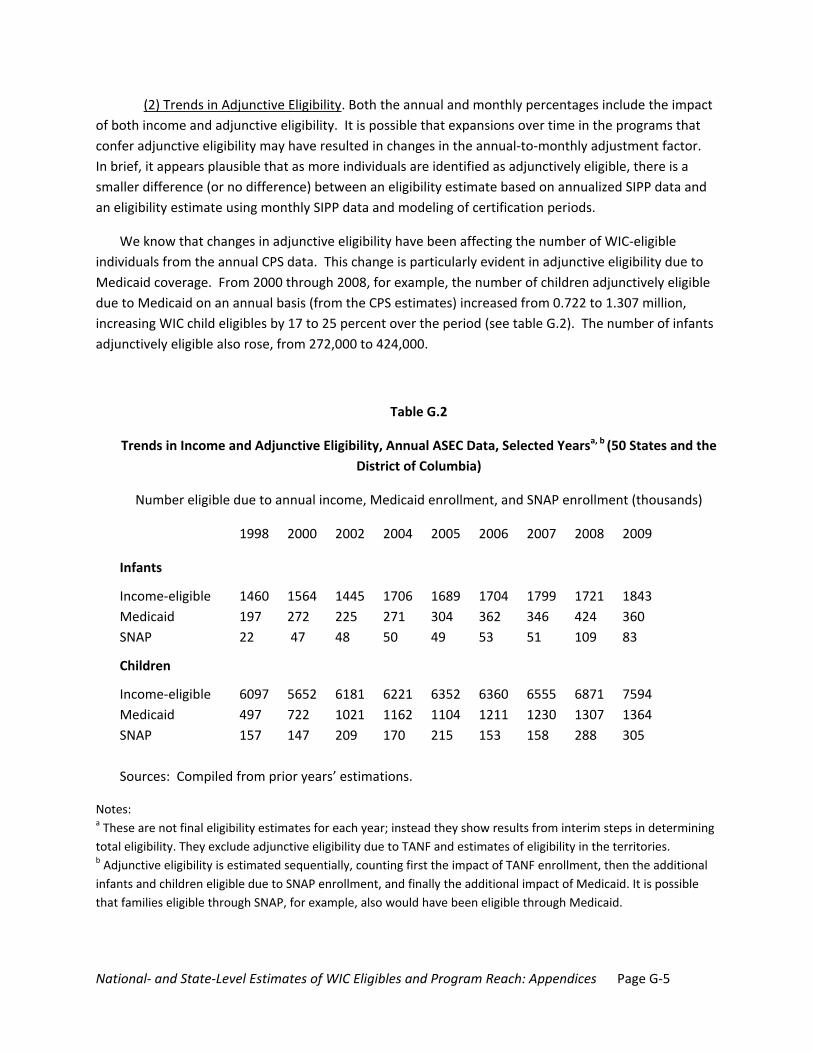
National‐ and State‐Level Estimates of WIC Eligibles and Program Reach: Appendices Page G‐5
(2) Trends in Adjunctive Eligibility. Both the annual and monthly percentages include the impact
of both income and adjunctive eligibility. It is possible that expansions over time in the programs that
confer adjunctive eligibility may have resulted in changes in the annual‐to‐monthly adjustment factor.
In brief, it appears plausible that as more individuals are identified as adjunctively eligible, there is a
smaller difference (or no difference) between an eligibility estimate based on annualized SIPP data and
an eligibility estimate using monthly SIPP data and modeling of certification periods.
We know that changes in adjunctive eligibility have been affecting the number of WIC‐eligible
individuals from the annual CPS data. This change is particularly evident in adjunctive eligibility due to
Medicaid coverage. From 2000 through 2008, for example, the number of children adjunctively eligible
due to Medicaid on an annual basis (from the CPS estimates) increased from 0.722 to 1.307 million,
increasing WIC child eligibles by 17 to 25 percent over the period (see table G.2). The number of infants
adjunctively eligible also rose, from 272,000 to 424,000.
Table G.2
Trends in Income and Adjunctive Eligibility, Annual ASEC Data, Selected Yearsa, b (50 States and the
District of Columbia)
Number eligible due to annual income, Medicaid enrollment, and SNAP enrollment (thousands)
1998 2000 2002 2004 2005 2006 2007 2008 2009
Infants
Income‐eligible 1460 1564 1445 1706 1689 1704 1799 1721 1843
Medicaid 197 272 225 271 304 362 346 424 360
SNAP 22 47 48 50 49 53 51 109 83
Children
Income‐eligible 6097 5652 6181 6221 6352 6360 6555 6871 7594
Medicaid 497 722 1021 1162 1104 1211 1230 1307 1364
SNAP 157 147 209 170 215 153 158 288 305
Sources: Compiled from prior years’ estimations.
Notes: a These are not final eligibility estimates for each year; instead they show results from interim steps in determining
total eligibility. They exclude adjunctive eligibility due to TANF and estimates of eligibility in the territories. b Adjunctive eligibility is estimated sequentially, counting first the impact of TANF enrollment, then the additional
infants and children eligible due to SNAP enrollment, and finally the additional impact of Medicaid. It is possible
that families eligible through SNAP, for example, also would have been eligible through Medicaid.
National‐ and State‐Level Estimates of WIC Eligibles and Program Reach: Appendices Page G‐6
Since the CNSTAT made the recommendation to adjust WIC eligibles to account for monthly
eligibility and certification periods, numerous changes have been made to the Medicaid program
pertaining to coverage for low‐income children. In 1997, the State Children’s Health Insurance Program
(CHIP) passed, extending coverage to most children living in families with income below 200 percent of
poverty. States could extend coverage either through their Medicaid program, a separate CHIP
program, or both. Coverage through Medicaid, even if extended through CHIP, confers adjunctive
eligibility for WIC.
Eligibility for Medicaid varies for infants, young children, and pregnant women, and Medicaid
income eligibility has been expanding over time. In 1998, nine States (Alaska, California, Illinois,
Minnesota, New Hampshire, Rhode Island, Tennessee, Washington, and Vermont) had income eligibility
limits above those used in the WIC program (including 300 percent of poverty in New Hampshire and
400 percent of poverty in Tennessee) for pregnant women and infants.8 Just five States (Alaska, Rhode
Island, Tennessee, Vermont, and Washington) had these income limits for children under age six.
Additional States had expansions through waivers (Hawaii, Massachusetts, Minnesota, and New Jersey)
that expanded income eligibility limits above 185 percent of poverty.
CHIP has been reauthorized several times since the original legislation. The most recent
legislation in 2009 allows States to set eligibility for children in families at 250 percent of poverty and
higher. The number of States with the higher Medicaid‐CHIP income thresholds has increased over
time.9 By January 2011, 19 States (Alaska, Delaware, the District of Columbia, Florida, Hawaii, Illinois,
Iowa, Louisiana, Maine, Maryland, Massachusetts, Minnesota, Nebraska, New Hampshire, New Mexico,
North Carolina, Ohio, Rhode Island, and South Carolina) had Medicaid‐CHIP income eligibility limits
above 185 percent of poverty for infants, and 12 States (Alaska, the District of Columbia, Hawaii,
Louisiana, Maryland, Nebraska, New Mexico, North Carolina, Ohio, Rhode Island, South Carolina, and
Wisconsin) had such limits for children age 1 through 5.10 Clearly, there has been a growing gap
between Medicaid and WIC income eligibility limits over time. As Medicaid has expanded to cover more
children, more will gain WIC eligibility through adjunctive Medicaid eligibility based on their annual
reports of insurance coverage. It is therefore likely that dips in income during the year that may initiate
a Medicaid spell and therefore WIC eligibility are becoming less important over time.
Adjunctive eligibility due to SNAP enrollment, also shown above, presents a less clear trend over
the 2000 through 2006 period. However, the increases in 2008, corresponding with the huge SNAP
caseload increases during the recession, are pronounced. Both economic and program factors were
8 See the rules from the Kaiser Commission on Medicaid, “Medicaid Eligibility for Families and Children, http://www.kff.org/medicaid/2106‐eligibility5.cfm. 9 While States’ CHIP programs have changed over time as to whether they are expansions of Medicaid or separate, the trend in Medicaid has been an expansion of the number of States with higher income eligibility limits. For example, 25 States had Medicaid income limits above 185 percent of poverty for infants in 2008 and 13 States had higher income limits for children (Besharov 2009). 10 From the Kaiser Commission on Medicaid, http://www.statehealthfacts.org/comparereport.jsp?rep=76&cat=4&gsa=2.
National‐ and State‐Level Estimates of WIC Eligibles and Program Reach: Appendices Page G‐7
affecting SNAP caseloads during this period. Eligibility increased in 2001 through 2003 as
unemployment increased, and then declined in 2005 and 2006 as the unemployment rate declined
(Leftin 2010). SNAP access and participation have increased. Since passage of the 2002 Farm Bill in
particular, States have increased outreach efforts and improved access through program simplifications.
Most States have modified reporting requirements and recertification procedures to help families
maintain their eligibility and benefit levels. Many States have adopted categorical eligibility for SNAP
(26 States by 2008) that provides eligibility to families with children receiving any TANF‐funded services.
We expect that these SNAP program changes have and will continue to increase the share of
low‐income families with children that receive SNAP during the year and gain WIC eligibility through
adjunctive eligibility. In 2008, the SNAP program’s benefit receipt rate—the benefits actually provided as
a percentage of all the benefits for which households were eligible—was 84 percent, more than 2
percentage points higher than in 2007 and an increase of 19 percentage points from 2001 (Leftin 2010).
Among children eligible for any amount of SNAP benefits, the 2008 program participation rate is 86
percent.
An increase in the number of families participating in SNAP or Medicaid over a 12‐month period
will increase the annual WIC eligibility estimates and likely narrow the annual‐to‐monthly ratio. More
children live in families with SNAP or have Medicaid coverage during the year, and the refinements in
eligibility estimation due to using monthly income and modeling certification periods make less of a
difference. This suggests that the newer factors may be more appropriate for future estimates than
continued use of the factors that were estimated using data from years with lower SNAP and Medicaid
enrollment.
(3) Changing income volatility. If there have been actual changes in income volatility over time,
those changes could lead to changes in the computed annual‐to‐monthly adjustment factor. If more
(fewer) families with infants and young children have incomes that dip below the WIC eligibility income
standards sometime during the year but have annual incomes above the WIC eligibility standard, the
monthly to annual factors will be higher (lower) as more infants and children gain eligibility due to a
change in income during the year. To the extent the factor has changed due to actual changes in
income volatility, that would suggest that use of newer factors is more appropriate than continued use
of older factors.
However, there is little evidence about how patterns of income have been changing.11 Acs,
Loprest, and Nichols (2009) analyzed the 1996, 2001, and 2004 SIPP panels to examine volatility in
income during the year. They focused on adults age 25 through 61 and income drops of 50 percent or
more. The authors document that drops in income are common (one in eight families experiences drops
in a single year) and more common among families in the lowest and highest income deciles (one in five
experiences drops during the year). The authors find some evidence that large declines in income were
11 We have read a lot recently about increasing volatility of income over the period from 1970 through 2004, but this reflects annual income volatility and does not necessarily reflect within‐year volatility. A number of studies find that the volatility of family income has risen over time (consistently and modestly) over the 1970–2004 time frame (Gosselin and Zimmerman 2008; Dynan, Elmendorf, and Sichel 2007).
National‐ and State‐Level Estimates of WIC Eligibles and Program Reach: Appendices Page G‐8
more common in 2001 (a recession year) than in 1996 and 2004, but they find little difference in the
subsequent chance of recovery after a large income drop in these years. The adjustment factors
computed to date do not show a strong relationship with the overall economic situation; comparing the
factors for 2002 (a recession year) with the 1998 factors, the factor for infants increased only slightly,
and the factor for children fell.
Summary and Recommendations
The estimates of the annual‐to‐monthly adjustment factor have ranged from 1.12 (2005) to 1.34
(1997) for infants, and from 1.0 (2005 and 2006) to 1.14 (1998) for young children. Some portion of the
differences is likely due to sampling variability in the SIPP data underlying the estimates. Considering
possible systematic differences, it is possible that SIPP sample attrition makes estimates from earlier in a
panel more reliable than those from later in a panel; however, only the infant estimates from the 1996
panel show a large within‐panel difference. It is also possible that real‐world changes in income
volatility play a role, but the estimates to date do not show an obvious pattern with the economic cycle,
perhaps because of other influences also at work.
We believe there is strong evidence that changes over time in Medicaid and SNAP eligibility and
outreach policies have affected the computation of the factor. In brief, it appears that as more infants
and children with family incomes above WIC limits are enrolled in Medicaid or SNAP, the impact of intra‐
year income fluctuations is lessened. This suggests that newer estimates of the adjustment factor may
be more appropriate for future WIC eligibility estimation than the use of an average factor that
incorporates data from before the Medicaid and SNAP expansions.
With that in mind, we offer the following recommendations:
1) The annual‐to‐monthly factor should be recomputed regularly when a new SIPP panel
becomes available. Regular updates will capture the impact of changes in SNAP and
Medicaid adjunctive eligibility as well as changes in the economy (changes in the
unemployment rate that could affect intra‐year income volatility). Updating the factor will
also help to capture changes associated with States using the new option (effective in 2011)
to extend the certification period for young children from 6 months to 12 months. In the
next updates, the estimates that use the monthly detail and that apply certification periods
could be performed two ways—once with a 6‐month certification period for all young
children, and again with either the 6‐month or 12‐month period depending on a child’s
State of residence. The first estimate could be used to construct the adjustment for use in
the 2010 eligibility estimate (before the option was implemented); and the second estimate
could be used for the 2011 WIC eligibility estimates.
2) The interim steps in the monthly eligibility estimates should be documented and validated.
The estimates should provide the underlying counts of infants and children. The effects of
adjunctive eligibility, separately due to SNAP, Medicaid, and TANF, should be provided.
National‐ and State‐Level Estimates of WIC Eligibles and Program Reach: Appendices Page G‐9
3) After recomputing the factor with newer data, analysis should be conducted of how to
incorporate newly estimated factors in the WIC eligibility estimates. Options include the
current approach of averaging the factors over a long time series; using the most recent
factor; or a hybrid approach such as a weighted average that gives greater weight to the
most recent years. A factor estimated for 2010 will presumably reflect that year’s very high
unemployment. Also, as more States have adopted higher income eligibility limits in their
Medicaid programs as a result of the most recent reauthorization of CHIP, the adjunctive
eligibility effects observed in earlier years may no longer be accurate. We recommend
considering the pros and cons of using 2010 factors by themselves, averaged with all prior
factors, or using a weighted average that gives greater weights to the more recent years.
The next opportunity for an update will be for 2010, using data for 2009 and 2010 from the
2008 SIPP panel. (As discussed above, the computation of the factor requires data for 11 months prior
to the calendar year of interest, due to one‐year certification periods.) The SAS program would need to
be changed to disaggregate results. Also, results would need to be validated with the 2010 CPS results.
The estimates for 2010 will represent a high‐unemployment year and should be used cautiously over the
economic cycle.
FNS should give some consideration to separate estimates for regions in the United States.
Currently, the same annual‐to‐monthly adjustment factors are being used in developing State WIC
eligibility estimates. Yet, we know that different States have adopted different SNAP and Medicaid
policies and adjunctive eligibility will have different effects across the country. Program participation
rates also vary across regions.12 Also, the country has experienced the recession in different ways. The
SIPP could support annual to monthly eligibility factors for the FNS regions.
12See http://www.fns.usda.gov/ora/menu/Published/snap/FILES/Participation/Reaching2008.pdf for documentation of SNAP participation by region and http://www.statehealthfacts.org/comparemaptable.jsp?ind=868&cat=4 for State and regional Medicaid/CHIP participation rates.
National‐ and State‐Level Estimates of WIC Eligibles and Program Reach: Appendices Page G‐10
References
Acs, Gregory, Pamela Loprest, and Austin Nichols. 2009. “Risk and Recovery: Understanding the
Changing Risks to Family Incomes.” Washington, D.C.: The Urban Institute. Low‐Income Working
Families Paper 14.
Besharov, Douglas and Douglas Call. 2009. “The Expansion of WIC Eligibility and Enrollment: Good
Intentions, Uncontrolled Local Discretion and Compliant Federal Officials.” Washington, D.C.: American
Enterprise Institute for Public Policy Research.
Citro, Constance F. and John Karl Scholz (Eds.) 2009. Reengineering the Survey of Income and Program
Participation. Washington, D.C.: National Research Council.
Dynan, Karen, Douglas Elmendorf, and Daniel Sichel. 2007. “The Evolution of Household Income
Volatility.” Finance and Economics Series, Federal Reserve Board. Washington, D.C.: Federal Reserve.
Gosselin, Peter and Seth Zimmerman. 2008. “Trends in Income Volatility and Risk, 1970‐2004.” Urban
Institute Working Paper. Washington, D.C.: The Urban Institute.
Leftin, Joshua. 2010. “Trends in Supplemental Nutrition Assistance Program Participation Rates: 2001
to 2008.” A Report to the U.S. Department of Agriculture, Food and Nutrition Service. Washington,
D.C.: Mathematica Policy Research.
Zebel, J.E. 1994. “An Analysis of Attrition in the PSID and SIPP with an Application to a Model of Labor
Market Behavior.” Census Bureau Working Paper No. 191. Washington, D.C.: U.S. Census Bureau.

National‐ and State‐Level Estimates of WIC Eligibles and Program Reach: Appendices Page H‐1
Appendix H Coverage Rate Maps
The maps in this appendix display WIC coverage rates at the State and regional levels
over the period 2000 through 2009. A coverage rate is defined here as the number of individuals participating in the WIC program divided by the number estimated to be eligible. For 2008 and 2009, rates are shown at the regional level for all participants and for each of four subgroups—infants, children, pregnant women, and postpartum women. Coverage rates are shown at the State level for the years 2000 through 2009 for all participants combined. The maps are listed individually below. FNS Region Level Coverage Rate, 2008
H.1 – All Groups
H.2 – Infants
H.3 – Children
H.4 – Pregnant Women
H.5 – Postpartum Women FNS Region Level Coverage Rate, 2009
H.6 – All Groups
H.7 – Infants
H.8 – Children
H.9 – Pregnant Women
H.10 – Postpartum Women State Level Coverage Rate, All Groups
H.11 – 2000
H.12 – 2001
H.13 – 2002
H.14 – 2003
H.15 – 2004
H.16 – 2005
H.17 – 2006
H.18 – 2007
H.19 – 2008
H.20 – 2009
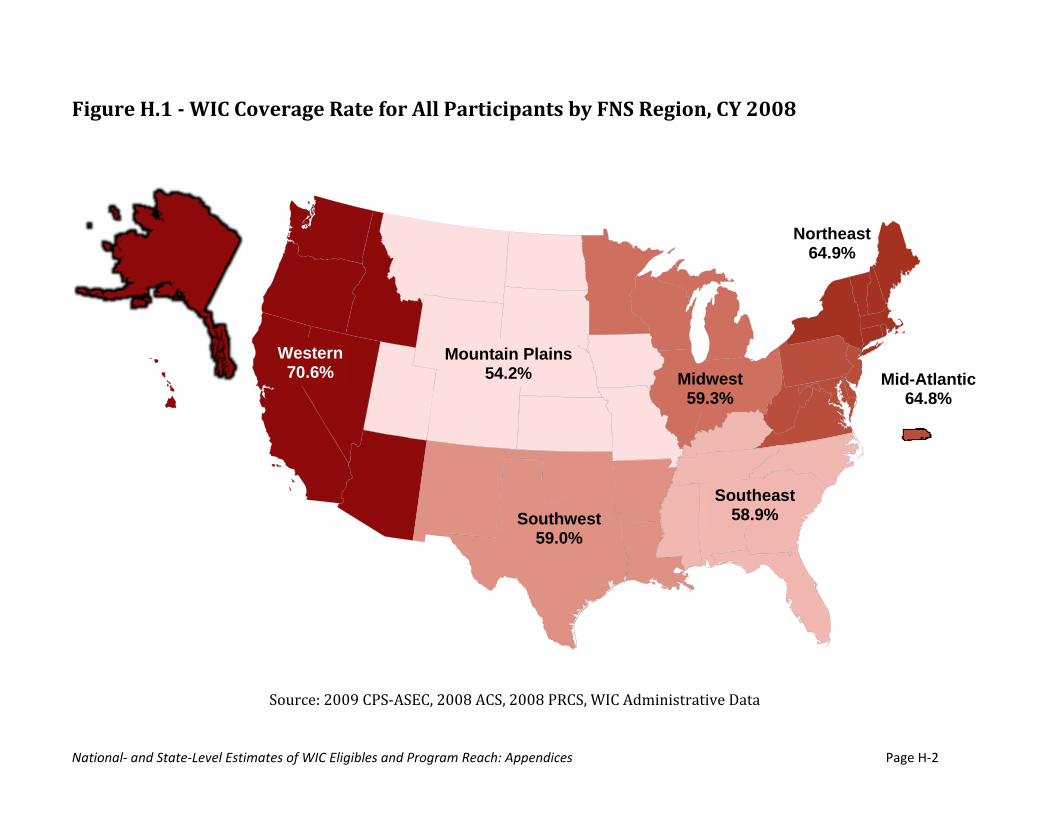
National‐ and State‐Level Estimates of WIC Eligibles and Program Reach: Appendices Page H‐2
Figure H.1 WIC Coverage Rate for All Participants by FNS Region, CY 2008
Source: 2009 CPS‐ASEC, 2008 ACS, 2008 PRCS, WIC Administrative Data
Midwest59.3%
Southwest59.0%
Southeast58.9%
Western70.6%
Mountain Plains54.2% Mid-Atlantic
64.8%
Northeast64.9%
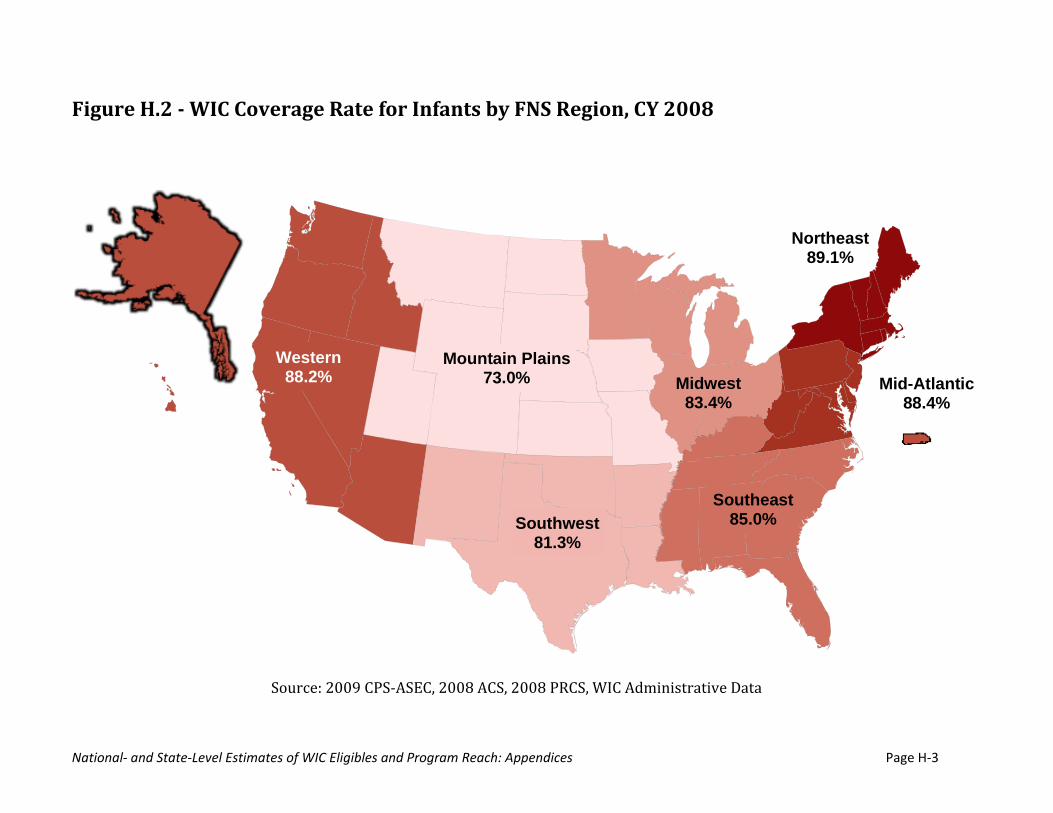
National‐ and State‐Level Estimates of WIC Eligibles and Program Reach: Appendices Page H‐3
Figure H.2 WIC Coverage Rate for Infants by FNS Region, CY 2008
Source: 2009 CPS‐ASEC, 2008 ACS, 2008 PRCS, WIC Administrative Data
Midwest83.4%
Southwest81.3%
Southeast85.0%
Western88.2%
Mountain Plains73.0% Mid-Atlantic
88.4%
Northeast89.1%
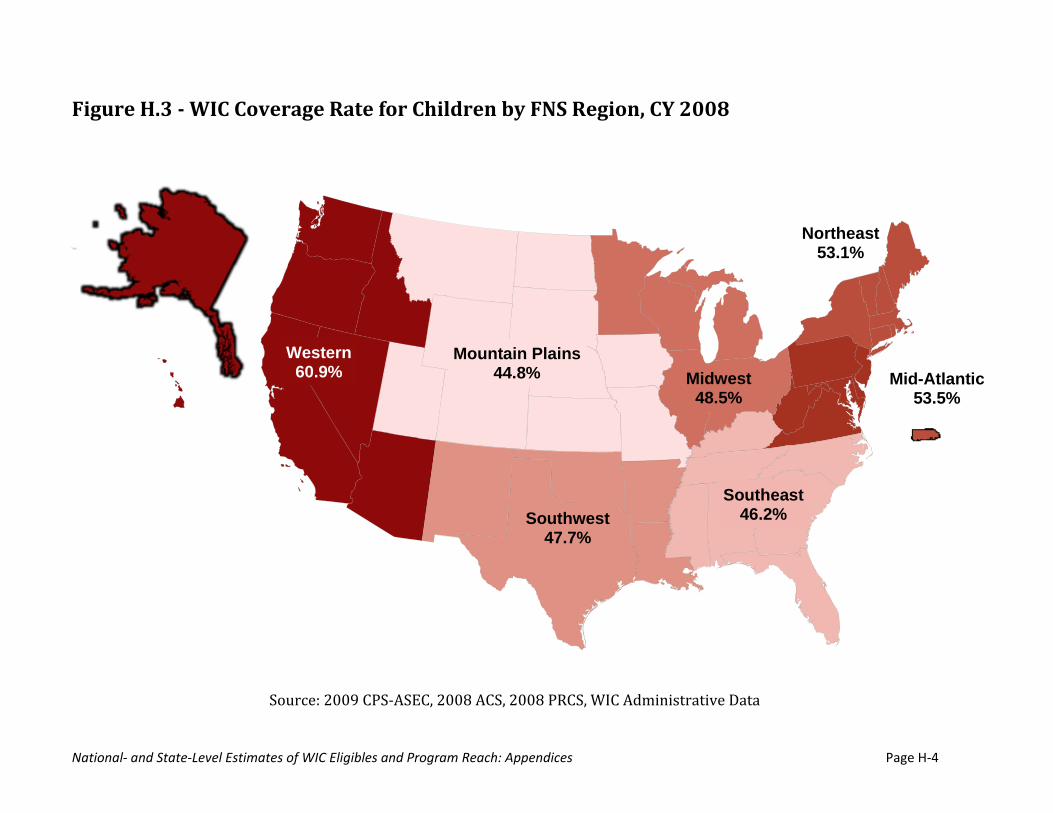
National‐ and State‐Level Estimates of WIC Eligibles and Program Reach: Appendices Page H‐4
Figure H.3 WIC Coverage Rate for Children by FNS Region, CY 2008
Source: 2009 CPS‐ASEC, 2008 ACS, 2008 PRCS, WIC Administrative Data
Midwest48.5%
Southwest47.7%
Southeast46.2%
Western60.9%
Mountain Plains44.8% Mid-Atlantic
53.5%
Northeast53.1%
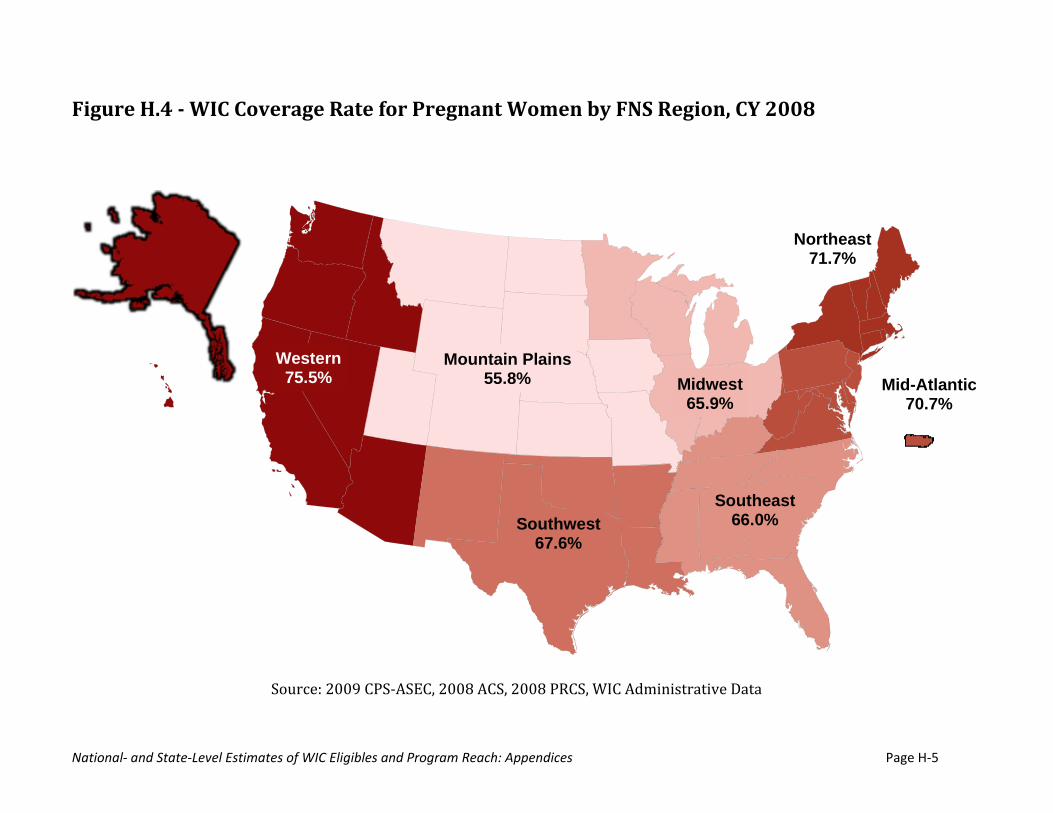
National‐ and State‐Level Estimates of WIC Eligibles and Program Reach: Appendices Page H‐5
Figure H.4 WIC Coverage Rate for Pregnant Women by FNS Region, CY 2008
Source: 2009 CPS‐ASEC, 2008 ACS, 2008 PRCS, WIC Administrative Data
Midwest65.9%
Southwest67.6%
Southeast66.0%
Western75.5%
Mountain Plains55.8% Mid-Atlantic
70.7%
Northeast71.7%
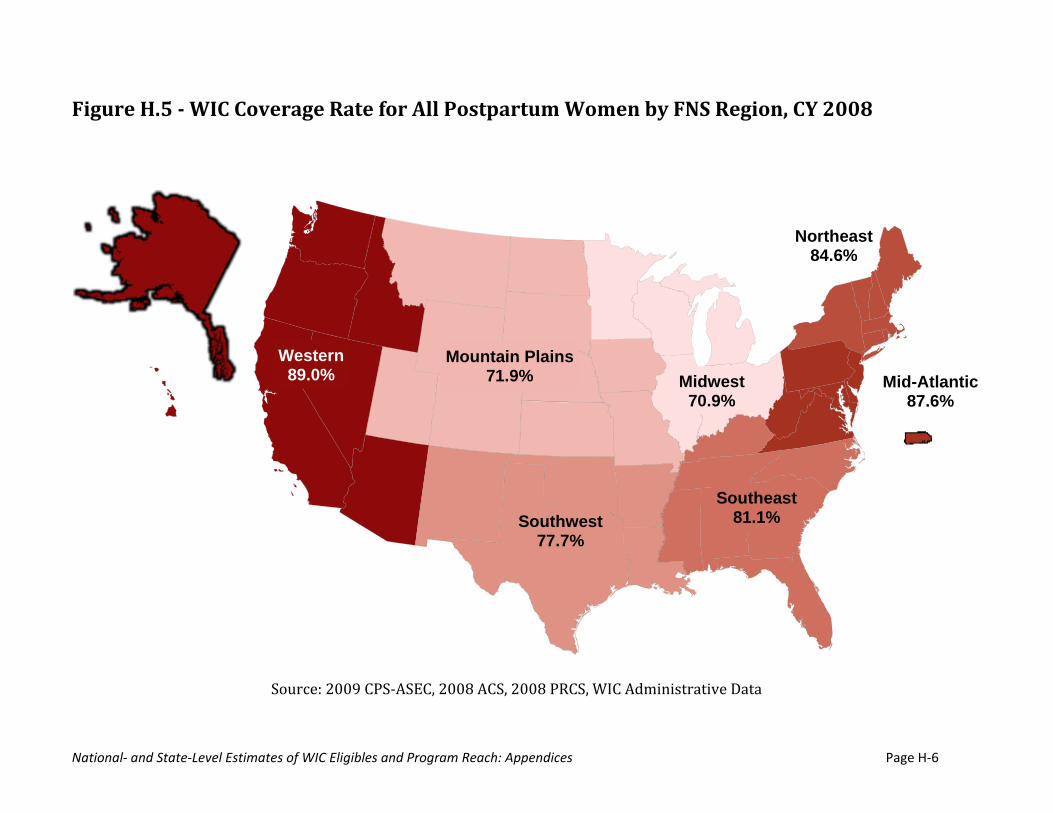
National‐ and State‐Level Estimates of WIC Eligibles and Program Reach: Appendices Page H‐6
Figure H.5 WIC Coverage Rate for All Postpartum Women by FNS Region, CY 2008
Source: 2009 CPS‐ASEC, 2008 ACS, 2008 PRCS, WIC Administrative Data
Midwest70.9%
Southwest77.7%
Southeast81.1%
Western89.0%
Mountain Plains71.9% Mid-Atlantic
87.6%
Northeast84.6%

National‐ and State‐Level Estimates of WIC Eligibles and Program Reach: Appendices Page H‐7
Figure H.6 WIC Coverage Rate for All Participants by FNS Region, CY 2009
Source: 2010 CPS‐ASEC, 2009 ACS, 2009 PRCS, WIC Administrative Data
Western68.2%
Mountain Plains52.8%
Southwest61.2%
Midwest57.3%
Southeast57.0%
Northeast63.7%
Mid-Atlantic62.6%

National‐ and State‐Level Estimates of WIC Eligibles and Program Reach: Appendices Page H‐8
Figure H.7 WIC Coverage Rate for Infants by FNS Region, CY 2009
Source: 2010 CPS‐ASEC, 2009 ACS, 2009 PRCS, WIC Administrative Data
Midwest80.7%
Southwest85.2%
Southeast81.5%
Western86.0%
Mountain Plains74.0% Mid-Atlantic
83.1%
Northeast86.3%
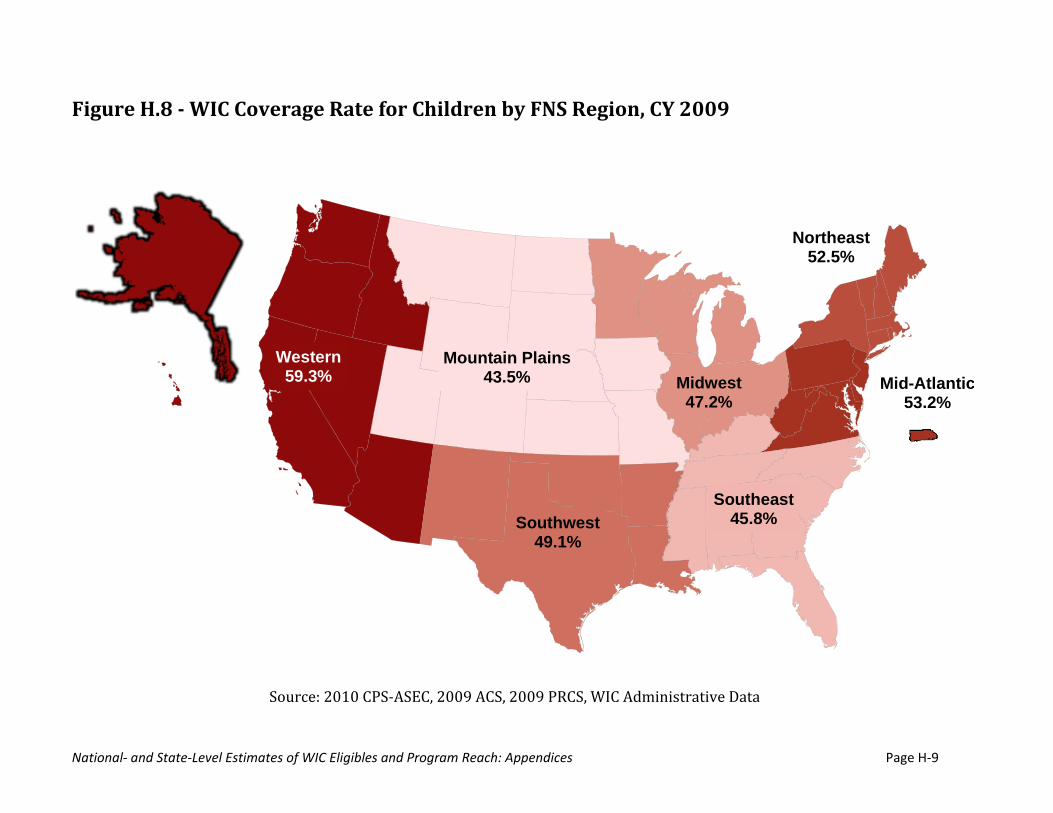
National‐ and State‐Level Estimates of WIC Eligibles and Program Reach: Appendices Page H‐9
Figure H.8 WIC Coverage Rate for Children by FNS Region, CY 2009
Source: 2010 CPS‐ASEC, 2009 ACS, 2009 PRCS, WIC Administrative Data
Midwest47.2%
Southwest49.1%
Southeast45.8%
Western59.3%
Mountain Plains43.5% Mid-Atlantic
53.2%
Northeast52.5%

National‐ and State‐Level Estimates of WIC Eligibles and Program Reach: Appendices Page H‐10
Figure H.9 WIC Coverage Rate for Pregnant Women by FNS Region, CY 2009
Source: 2010 CPS‐ASEC, 2009 ACS, 2009 PRCS, WIC Administrative Data
Western74.2%
Mountain Plains58.4%
Southwest71.8%
Midwest67.1%
Southeast64.7%
Northeast71.1%
Mid-Atlantic67.9%
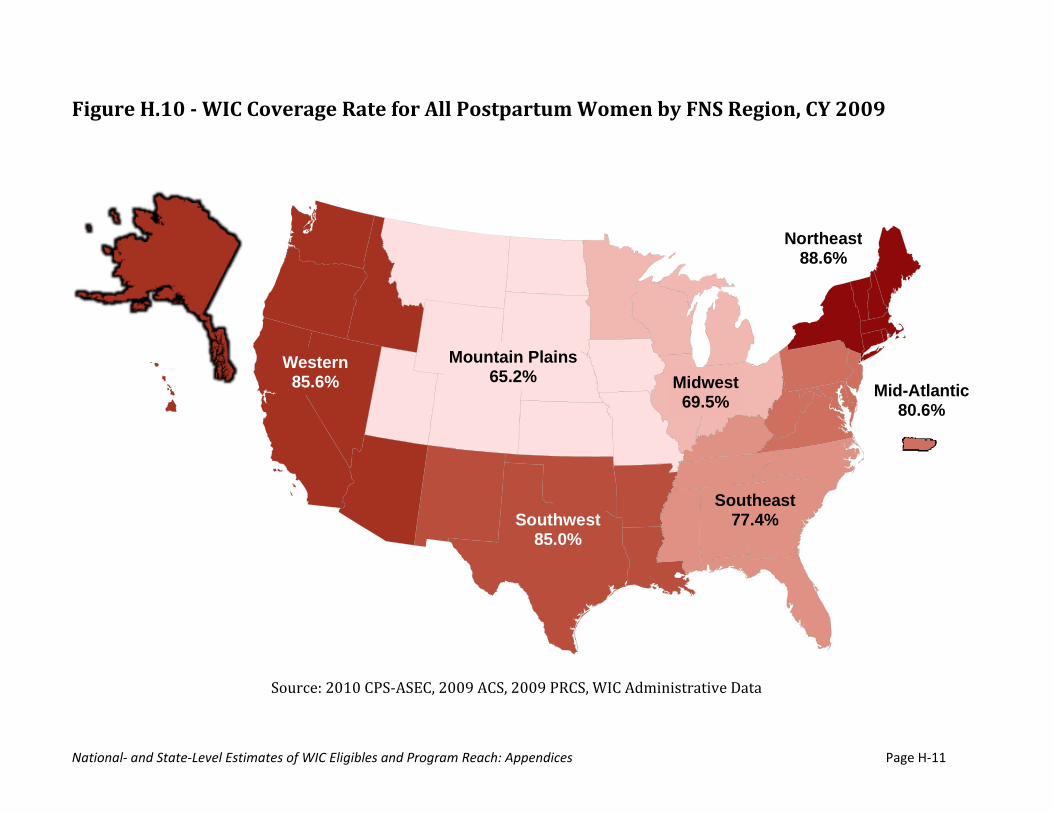
National‐ and State‐Level Estimates of WIC Eligibles and Program Reach: Appendices Page H‐11
Figure H.10 WIC Coverage Rate for All Postpartum Women by FNS Region, CY 2009
Source: 2010 CPS‐ASEC, 2009 ACS, 2009 PRCS, WIC Administrative Data
Northeast88.6%
Western85.6%
Southwest85.0%
Mountain Plains65.2% Midwest
69.5% Mid-Atlantic80.6%
Southeast77.4%
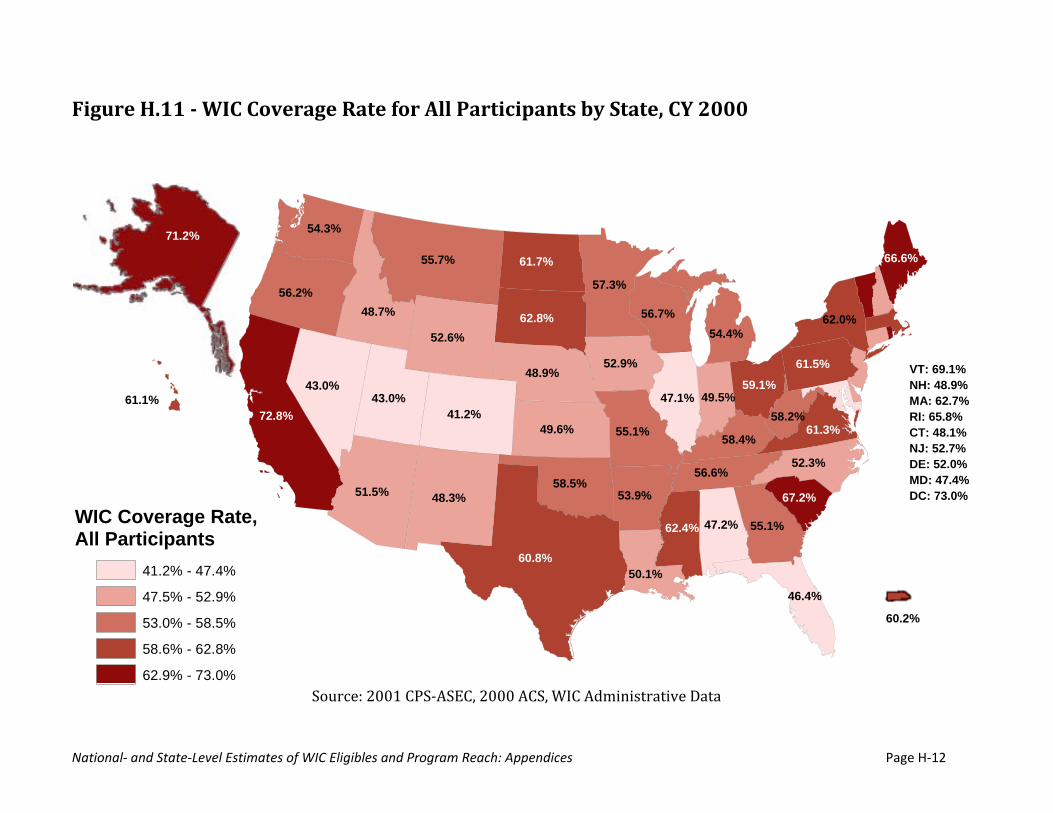
National‐ and State‐Level Estimates of WIC Eligibles and Program Reach: Appendices Page H‐12
Figure H.11 WIC Coverage Rate for All Participants by State, CY 2000
Source: 2001 CPS‐ASEC, 2000 ACS, WIC Administrative Data
60.8%
72.8%
55.7%
48.3%51.5%
43.0%
41.2%
52.6%
56.2%
43.0%
57.3%
48.7%
49.6%
48.9%
62.8%
61.7%
58.5%
55.1%
54.3%
55.1%
47.1%
52.9%
56.7%
53.9%
47.2%
52.3%
62.4%
62.0%
50.1%
61.5%
56.6%
54.4%
59.1%
58.4%61.3%
67.2%
46.4%
49.5%
66.6%
58.2%
WIC Coverage Rate,All Participants
41.2% - 47.4%
47.5% - 52.9%
53.0% - 58.5%
58.6% - 62.8%
62.9% - 73.0%
61.1%
60.2%
VT: 69.1%NH: 48.9% MA: 62.7% RI: 65.8% CT: 48.1% NJ: 52.7% DE: 52.0% MD: 47.4% DC: 73.0%
71.2%
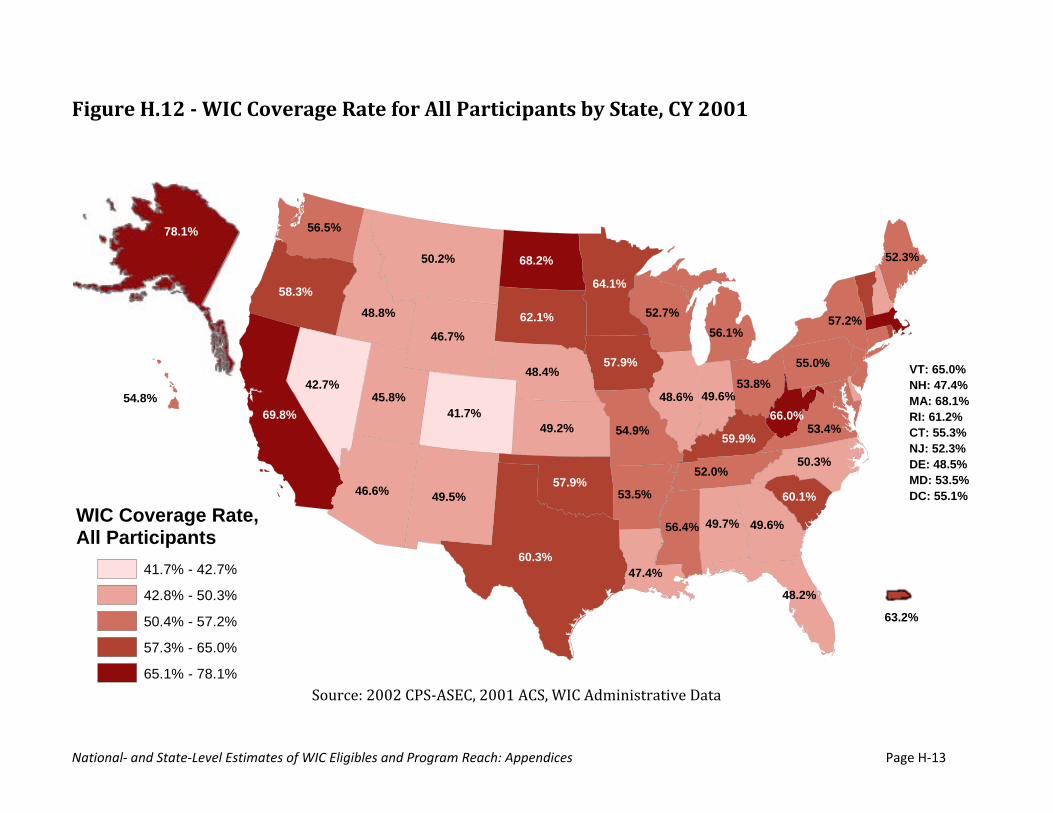
National‐ and State‐Level Estimates of WIC Eligibles and Program Reach: Appendices Page H‐13
Figure H.12 WIC Coverage Rate for All Participants by State, CY 2001
Source: 2002 CPS‐ASEC, 2001 ACS, WIC Administrative Data
60.3%
69.8%
50.2%
49.5%46.6%
42.7%
41.7%
46.7%
58.3%
45.8%
64.1%
48.8%
49.2%
48.4%
62.1%
68.2%
57.9%
54.9%
56.5%
49.6%
48.6%
57.9%
52.7%
53.5%
49.7%
50.3%
56.4%
57.2%
47.4%
55.0%
52.0%
56.1%
53.8%
59.9%53.4%
60.1%
48.2%
49.6%
52.3%
66.0%
WIC Coverage Rate,All Participants
41.7% - 42.7%
42.8% - 50.3%
50.4% - 57.2%
57.3% - 65.0%
65.1% - 78.1%
VT: 65.0%NH: 47.4% MA: 68.1% RI: 61.2% CT: 55.3% NJ: 52.3% DE: 48.5% MD: 53.5% DC: 55.1%
54.8%
63.2%
78.1%
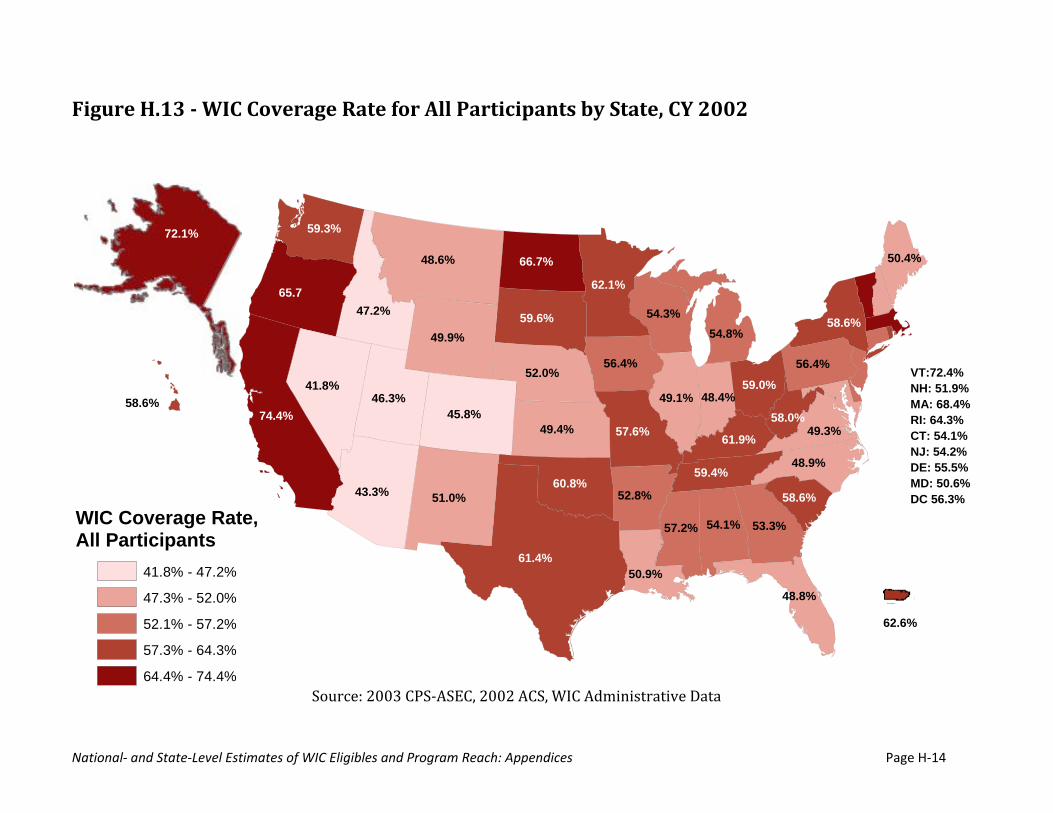
National‐ and State‐Level Estimates of WIC Eligibles and Program Reach: Appendices Page H‐14
Figure H.13 WIC Coverage Rate for All Participants by State, CY 2002
Source: 2003 CPS‐ASEC, 2002 ACS, WIC Administrative Data
61.4%
74.4%
48.6%
51.0%43.3%
41.8%
45.8%
49.9%
65.7
46.3%
62.1%
47.2%
49.4%
52.0%
59.6%
66.7%
60.8%
57.6%
59.3%
53.3%
49.1%
56.4%
54.3%
52.8%
54.1%
48.9%
57.2%
58.6%
50.9%
56.4%
59.4%
54.8%
59.0%
61.9%49.3%
58.6%
48.8%
48.4%
50.4%
58.0%
WIC Coverage Rate,All Participants
41.8% - 47.2%
47.3% - 52.0%
52.1% - 57.2%
57.3% - 64.3%
64.4% - 74.4%
VT:72.4%NH: 51.9% MA: 68.4% RI: 64.3% CT: 54.1% NJ: 54.2% DE: 55.5% MD: 50.6% DC 56.3%
58.6%
62.6%
72.1%
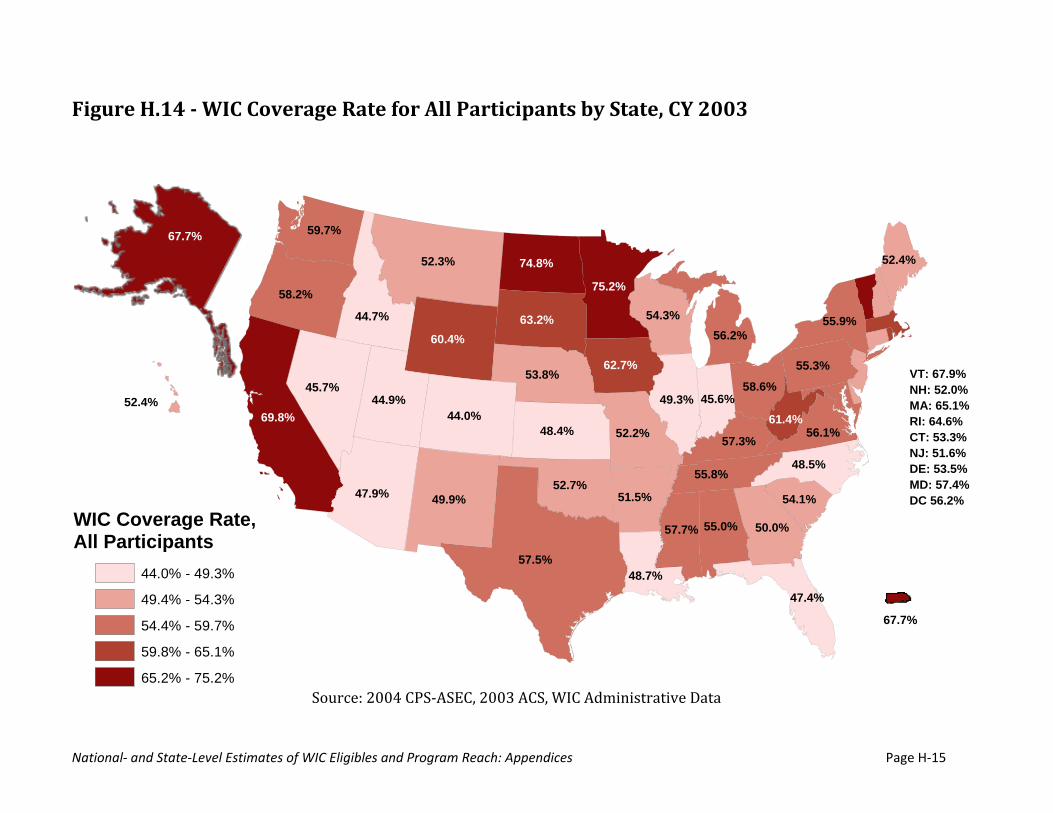
National‐ and State‐Level Estimates of WIC Eligibles and Program Reach: Appendices Page H‐15
Figure H.14 WIC Coverage Rate for All Participants by State, CY 2003
Source: 2004 CPS‐ASEC, 2003 ACS, WIC Administrative Data
57.5%
69.8%
52.3%
49.9%47.9%
45.7%
44.0%
60.4%
58.2%
44.9%
75.2%
44.7%
48.4%
53.8%
63.2%
74.8%
52.7%
52.2%
59.7%
50.0%
49.3%
62.7%
54.3%
51.5%
55.0%
48.5%
57.7%
55.9%
48.7%
55.3%
55.8%
56.2%
58.6%
57.3%56.1%
54.1%
47.4%
45.6%
52.4%
61.4%52.4%
67.7%
WIC Coverage Rate,All Participants
44.0% - 49.3%
49.4% - 54.3%
54.4% - 59.7%
59.8% - 65.1%
65.2% - 75.2%
VT: 67.9%NH: 52.0% MA: 65.1% RI: 64.6% CT: 53.3% NJ: 51.6% DE: 53.5% MD: 57.4% DC 56.2%
67.7%
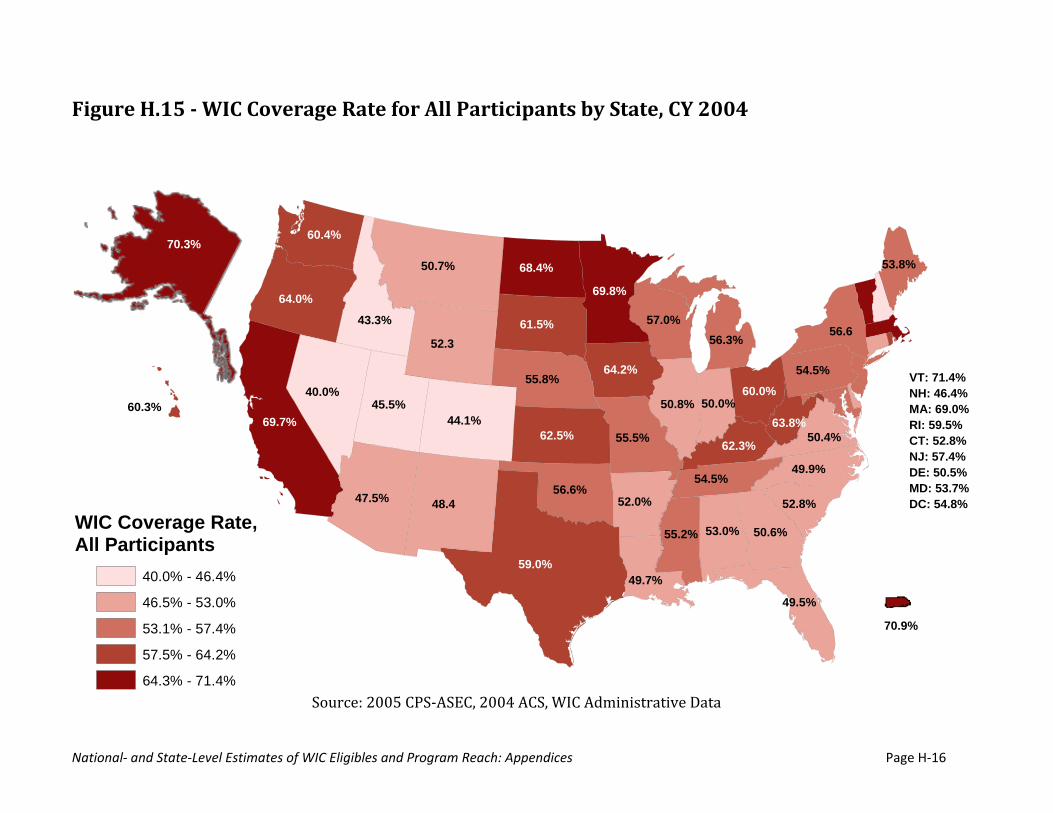
National‐ and State‐Level Estimates of WIC Eligibles and Program Reach: Appendices Page H‐16
Figure H.15 WIC Coverage Rate for All Participants by State, CY 2004
Source: 2005 CPS‐ASEC, 2004 ACS, WIC Administrative Data
59.0%
69.7%
50.7%
48.447.5%
40.0%
44.1%
52.3
64.0%
45.5%
69.8%
43.3%
62.5%
55.8%
61.5%
68.4%
56.6%
55.5%
60.4%
50.6%
50.8%
64.2%
57.0%
52.0%
53.0%
49.9%
55.2%
56.6
49.7%
54.5%
54.5%
56.3%
60.0%
62.3%50.4%
52.8%
49.5%
50.0%
53.8%
63.8%
WIC Coverage Rate,All Participants
40.0% - 46.4%
46.5% - 53.0%
53.1% - 57.4%
57.5% - 64.2%
64.3% - 71.4%
VT: 71.4%NH: 46.4% MA: 69.0% RI: 59.5% CT: 52.8% NJ: 57.4% DE: 50.5% MD: 53.7% DC: 54.8%
60.3%
70.9%
70.3%
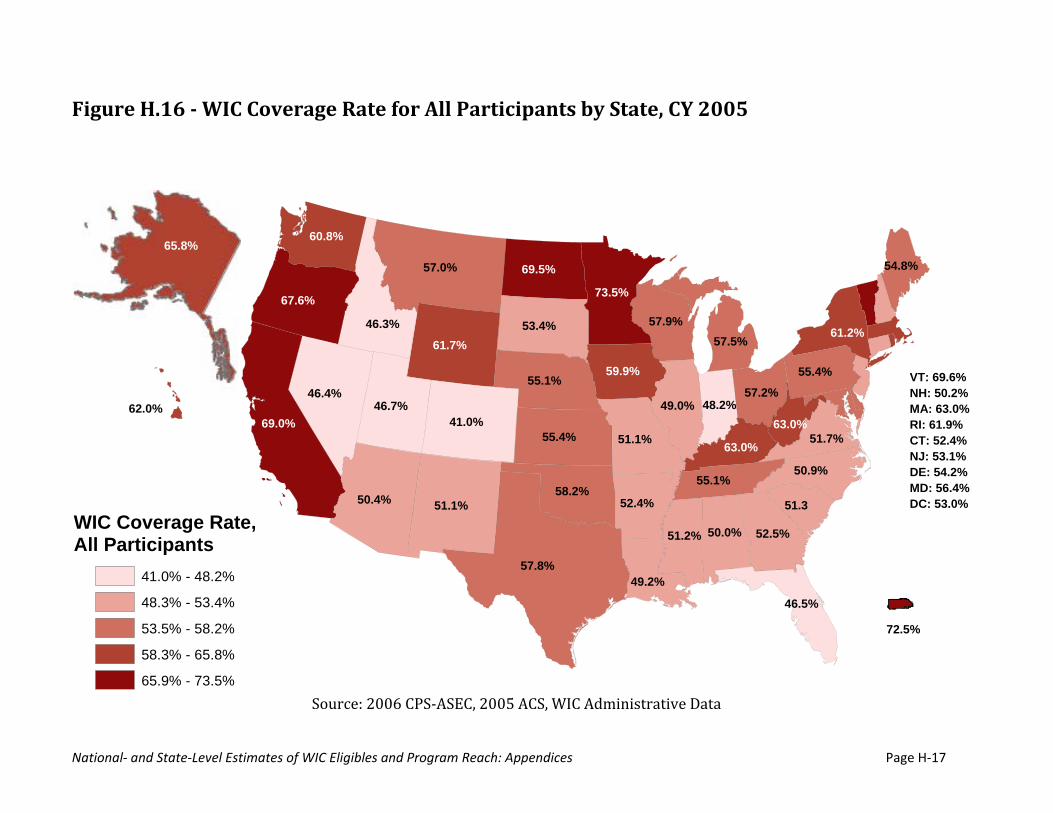
National‐ and State‐Level Estimates of WIC Eligibles and Program Reach: Appendices Page H‐17
Figure H.16 WIC Coverage Rate for All Participants by State, CY 2005
Source: 2006 CPS‐ASEC, 2005 ACS, WIC Administrative Data
57.8%
69.0%
57.0%
51.1%50.4%
46.4%
41.0%
61.7%
67.6%
46.7%
73.5%
46.3%
55.4%
55.1%
53.4%
69.5%
58.2%
51.1%
60.8%
52.5%
49.0%
59.9%
57.9%
52.4%
50.0%
50.9%
51.2%
61.2%
49.2%
55.4%
55.1%
57.5%
57.2%
63.0%51.7%
51.3
46.5%
48.2%
54.8%
63.0%
WIC Coverage Rate,All Participants
41.0% - 48.2%
48.3% - 53.4%
53.5% - 58.2%
58.3% - 65.8%
65.9% - 73.5%
VT: 69.6%NH: 50.2% MA: 63.0% RI: 61.9% CT: 52.4% NJ: 53.1% DE: 54.2% MD: 56.4% DC: 53.0%
62.0%
72.5%
65.8%
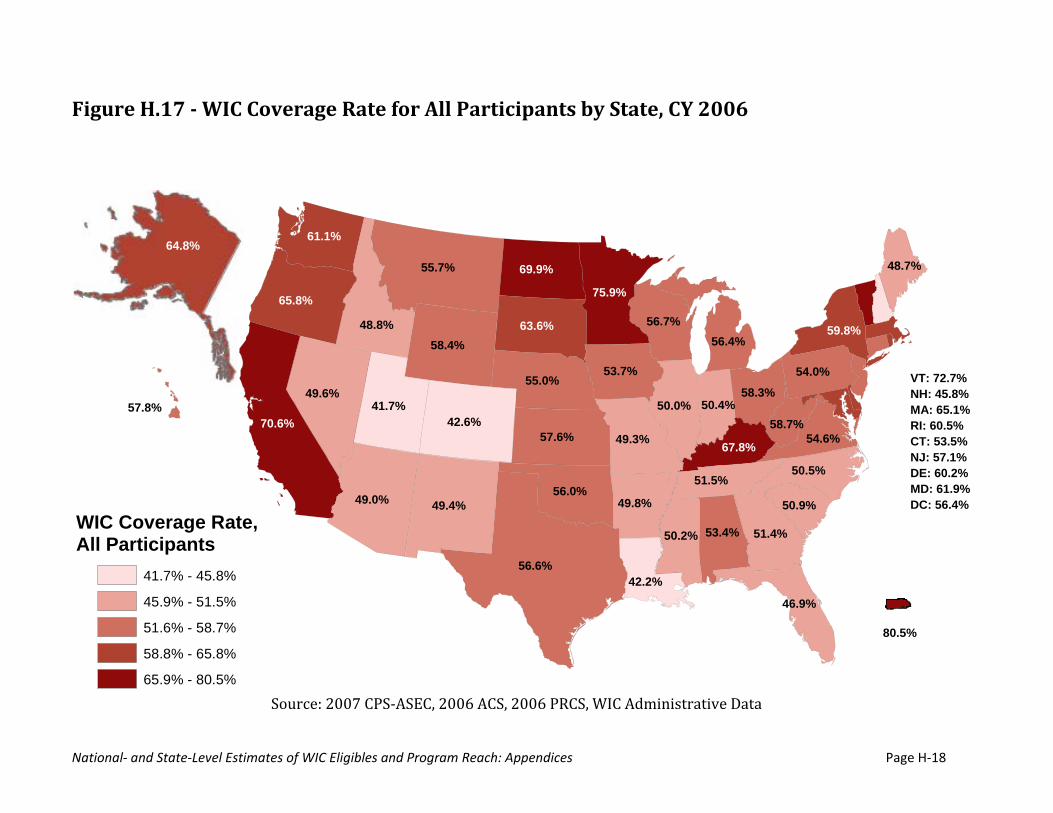
National‐ and State‐Level Estimates of WIC Eligibles and Program Reach: Appendices Page H‐18
Figure H.17 WIC Coverage Rate for All Participants by State, CY 2006
Source: 2007 CPS‐ASEC, 2006 ACS, 2006 PRCS, WIC Administrative Data
56.6%
70.6%
55.7%
49.4%49.0%
49.6%
42.6%
58.4%
65.8%
41.7%
75.9%
48.8%
57.6%
55.0%
63.6%
69.9%
56.0%
49.3%
61.1%
51.4%
50.0%
53.7%
56.7%
49.8%
53.4%
50.5%
50.2%
59.8%
42.2%
54.0%
51.5%
56.4%
58.3%
67.8%54.6%
50.9%
46.9%
50.4%
48.7%
58.7%
WIC Coverage Rate,All Participants
41.7% - 45.8%
45.9% - 51.5%
51.6% - 58.7%
58.8% - 65.8%
65.9% - 80.5%
57.8%
VT: 72.7%NH: 45.8% MA: 65.1% RI: 60.5% CT: 53.5% NJ: 57.1% DE: 60.2% MD: 61.9% DC: 56.4%
80.5%
64.8%
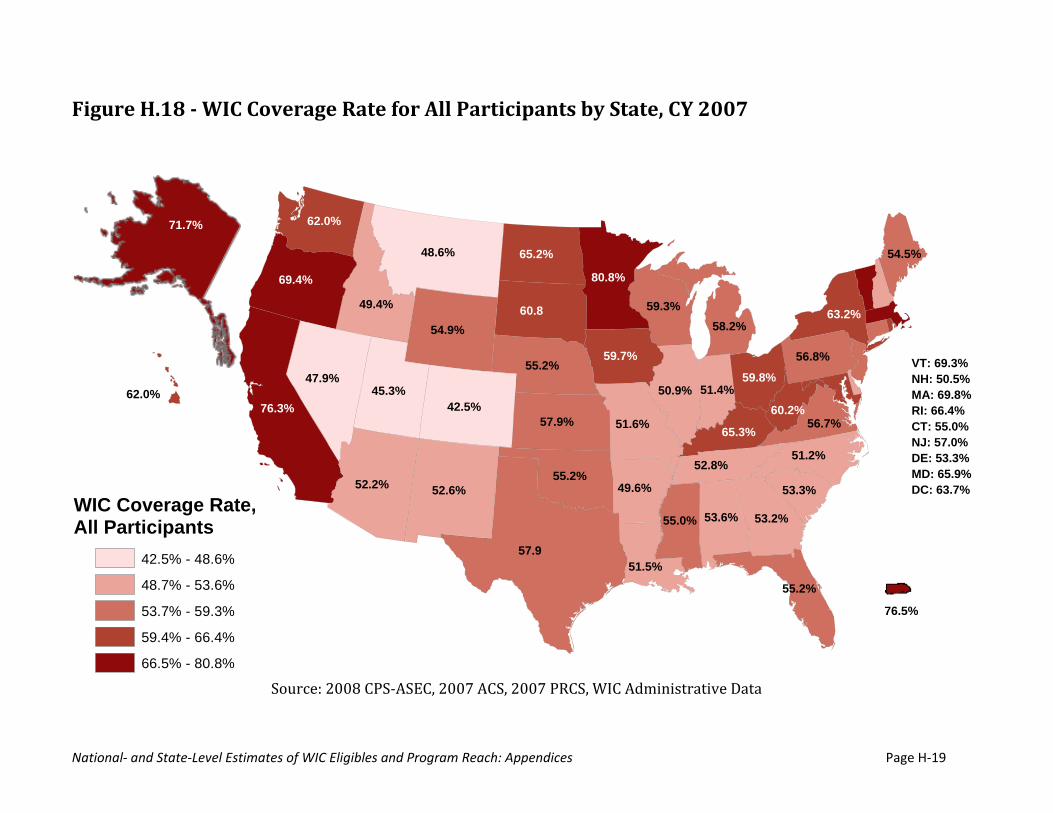
National‐ and State‐Level Estimates of WIC Eligibles and Program Reach: Appendices Page H‐19
Figure H.18 WIC Coverage Rate for All Participants by State, CY 2007
Source: 2008 CPS‐ASEC, 2007 ACS, 2007 PRCS, WIC Administrative Data
57.9
76.3%
48.6%
52.6%52.2%
47.9%
42.5%
54.9%
69.4%
45.3%
80.8%
49.4%
57.9%
55.2%
60.8
65.2%
55.2%
51.6%
62.0%
53.2%
50.9%
59.7%
59.3%
49.6%
53.6%
51.2%
55.0%
63.2%
51.5%
56.8%
52.8%
58.2%
59.8%
65.3%56.7%
53.3%
55.2%
51.4%
54.5%
60.2%
WIC Coverage Rate,All Participants
42.5% - 48.6%
48.7% - 53.6%
53.7% - 59.3%
59.4% - 66.4%
66.5% - 80.8%
62.0%
76.5%
VT: 69.3%NH: 50.5% MA: 69.8% RI: 66.4% CT: 55.0% NJ: 57.0% DE: 53.3% MD: 65.9% DC: 63.7%
71.7%
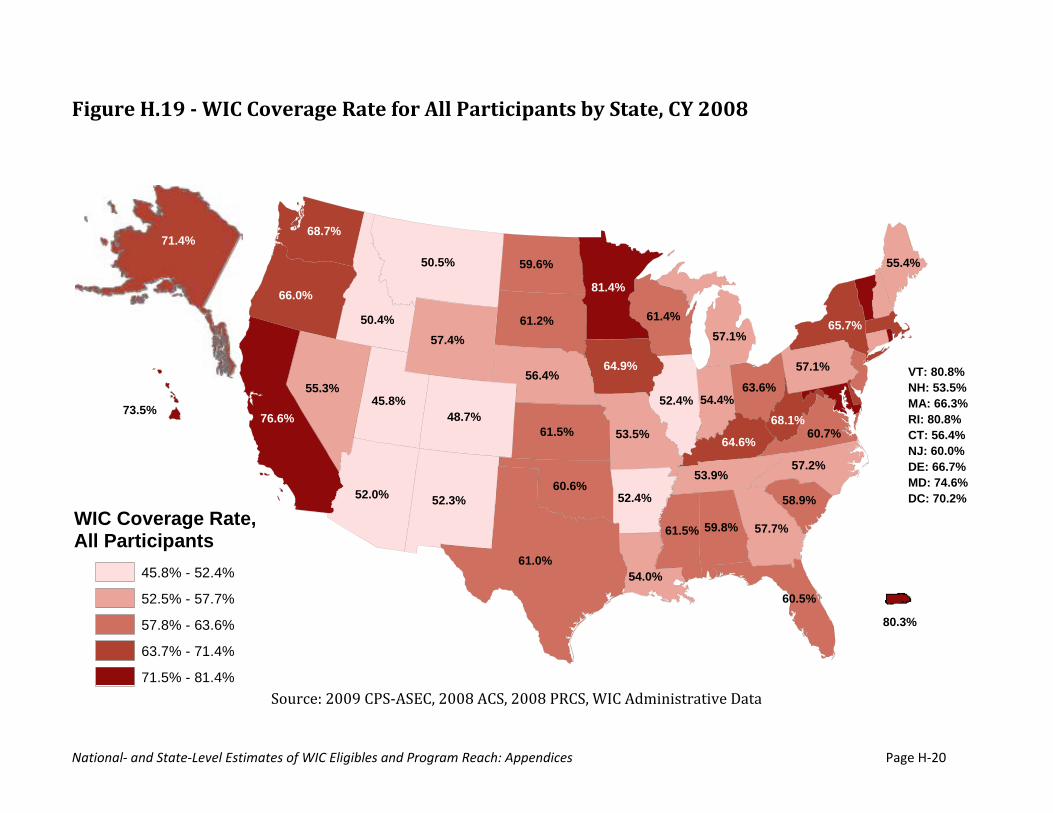
National‐ and State‐Level Estimates of WIC Eligibles and Program Reach: Appendices Page H‐20
Figure H.19 WIC Coverage Rate for All Participants by State, CY 2008
Source: 2009 CPS‐ASEC, 2008 ACS, 2008 PRCS, WIC Administrative Data
61.0%
76.6%
50.5%
52.3%52.0%
55.3%
48.7%
57.4%
66.0%
45.8%
81.4%
50.4%
61.5%
56.4%
61.2%
59.6%
60.6%
53.5%
68.7%
57.7%
52.4%
64.9%
61.4%
52.4%
59.8%
57.2%
61.5%
65.7%
54.0%
57.1%
53.9%
57.1%
63.6%
64.6%60.7%
58.9%
60.5%
54.4%
55.4%
68.1%
WIC Coverage Rate,All Participants
45.8% - 52.4%
52.5% - 57.7%
57.8% - 63.6%
63.7% - 71.4%
71.5% - 81.4%
VT: 80.8%NH: 53.5% MA: 66.3% RI: 80.8% CT: 56.4% NJ: 60.0% DE: 66.7% MD: 74.6% DC: 70.2%
73.5%
80.3%
71.4%
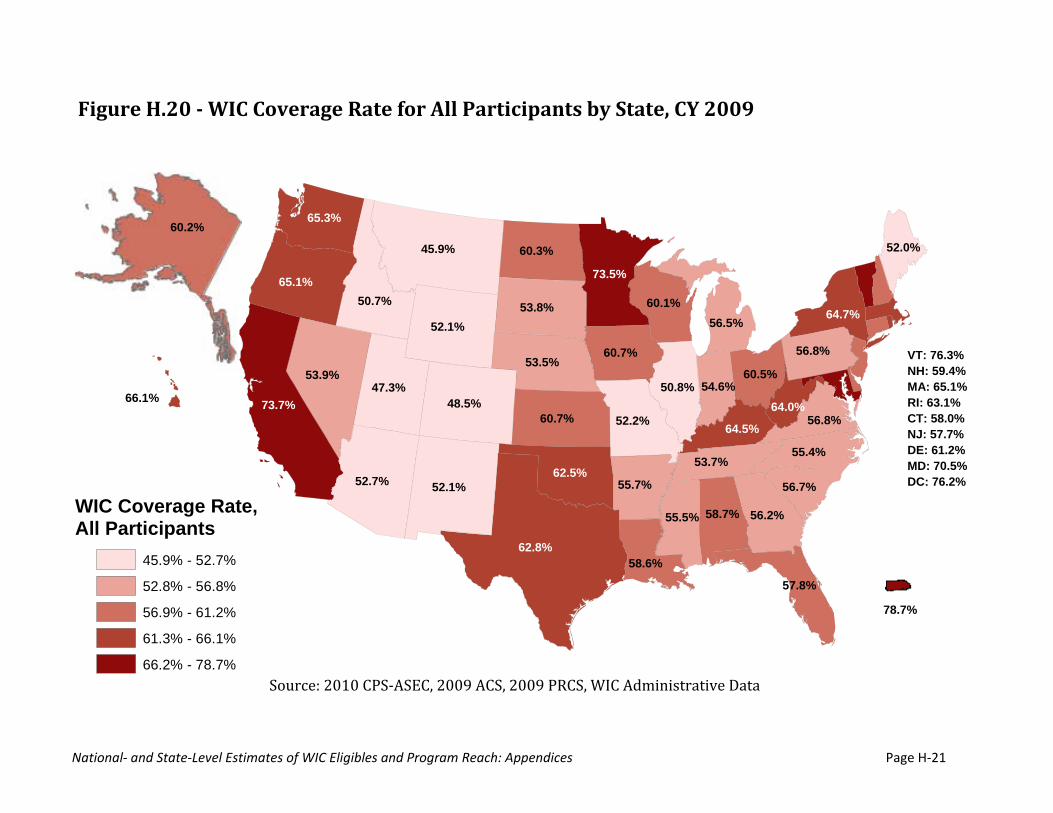
National‐ and State‐Level Estimates of WIC Eligibles and Program Reach: Appendices Page H‐21
Figure H.20 WIC Coverage Rate for All Participants by State, CY 2009
Source: 2010 CPS‐ASEC, 2009 ACS, 2009 PRCS, WIC Administrative Data
62.8%
73.7%
45.9%
52.1%52.7%
53.9%
48.5%
52.1%
65.1%
47.3%
73.5%
50.7%
60.7%
53.5%
53.8%
60.3%
62.5%
52.2%
65.3%
56.2%
50.8%
60.7%
60.1%
55.7%
58.7%
55.4%
55.5%
64.7%
58.6%
56.8%
53.7%
56.5%
60.5%
64.5%56.8%
56.7%
57.8%
54.6%
52.0%
64.0%66.1%
78.7%
VT: 76.3%NH: 59.4% MA: 65.1% RI: 63.1% CT: 58.0% NJ: 57.7% DE: 61.2% MD: 70.5% DC: 76.2%
WIC Coverage Rate,All Participants
45.9% - 52.7%
52.8% - 56.8%
56.9% - 61.2%
61.3% - 66.1%
66.2% - 78.7%
60.2%