1. international overview 1.0 area and populationwko.at/statistik/jahrbuch/2016_c1.pdf · united...
TRANSCRIPT

7
Belgium 30,530 9,967 10,251 11,355 372Germany 357,170 79,433 82,212 82,282 230Estonia 45,230 1,569 1,397 1,307 29Finland 338,420 4,986 5,176 5,501 16France 549,087 58,185 60,762 66,785 122Greece 131,960 10,197 10,806 10,858 82Ireland 70,280 3,514 3,805 4,691 67Italy 301,340 56,760 56,983 60,747 202Latvia 64,490 2,663 2,368 1,965 30Lithuania 65,300 3,698 3,500 2,871 44Luxembourg 2,590 382 436 580 224Malta 320 354 386 435 1,358Netherlands 41,500 14,952 15,926 17,037 411Austria 83,879 7,678 8,012 8,683 104Portugal 92,220 9,983 10,290 10,299 112Slovakia 49,036 5,299 5,389 5,423 111Slovenia 20,270 1,998 1,989 2,067 102Spain 505,940 38,850 40,263 46,377 92Cyprus 9,250 580 694 842 91Euro area (19) 2,758,812 311,049 320,643 340,105 123Bulgaria 111,000 8,718 8,170 7,138 64Denmark 43,090 5,141 5,340 5,710 133United Kingdom 243,610 57,248 58,893 65,647 269Croatia 56,590 4,777 4,397 4,207 74Poland 312,680 38,111 38,259 38,000 122Romania 238,390 23,202 22,443 19,842 83Sweden 447,420 8,559 8,872 9,924 22Czech Republic 78,870 10,333 10,255 10,567 134Hungary 93,030 10,374 10,211 9,825 106EU (28) 4,383,492 477,512 487,481 510,965 117Albania 28,750 3,259 3,047 2,893 101Iceland 103,000 255 281 334 3Macedonia 25,710 1,882 2,026 2,090 81Montenegro 13,810 . 605 622 45Serbia 88,360 . 7,516 7,055 80Turkey 783,560 55,120 64,252 79,202 101Switzerland 41,285 6,716 7,184 8,260 200Norway 385,178 4,241 4,491 5,152 13United States 9,831,510 249,623 282,162 323,954 33Japan 377,962 123,611 126,926 126,656 335
1.0 Area and population
country areakm2
population (1,000) 2000 201612010
inhabitantsper km2
1. INTERNATIONAL OVERVIEW
1 estimate (EU-Commission, May 2016) source: EU-Commission, WB

8
Belgium 258.2 311.5 365.1 409.8 420.9 2.8Germany 2,116.5 2,300.9 2,580.1 3,025.9 3,130.8 21.1Estonia 6.2 11.3 14.7 20.5 21.2 0.1Finland 136.3 164.4 187.1 207.2 210.4 1.4France 1,485.3 1,772.0 1,998.5 2,183.6 2,234.4 15.0Greece 143.0 199.2 226.0 176.0 175.1 1.2Ireland 108.4 170.0 166.2 214.6 229.2 1.5Italy 1,239.3 1,489.7 1,604.5 1,636.4 1,667.9 11.2Latvia 8.6 13.7 17.8 24.4 25.3 0.2Lithuania 12.5 21.0 28.0 37.2 38.9 0.3Luxembourg 23.2 29.7 39.5 52.1 54.3 0.4Malta 4.4 5.1 6.6 8.8 9.4 0.1Netherlands 448.1 545.6 631.5 678.6 697.6 4.7Austria 213.2 253.0 294.6 337.2 346.5 2.3Portugal 128.5 158.7 179.9 179.4 184.5 1.2Slovakia 22.3 39.2 67.4 78.1 80.6 0.5Slovenia 21.9 29.2 36.3 38.5 39.6 0.3Spain 646.3 930.6 1,080.9 1,081.2 1,119.5 7.5Cyprus 10.8 14.9 19.1 17.4 17.7 0.1Euro area (19) 7,032.7 8,459.7 9,543.8 10,406.8 10,703.7 72.0Bulgaria 14.3 24.0 37.7 44.2 45.1 0.3Denmark 178.0 212.9 241.5 266.2 272.5 1.8United Kingdom 1,686.0 1,945.6 1,813.3 2,569.0 2,431.9 16.4Croatia 23.6 36.5 45.0 43.9 45.3 0.3Poland 186.4 244.8 361.7 427.7 432.4 2.9Romania 40.8 80.2 126.7 160.4 169.4 1.1Sweden 281.9 313.2 369.1 444.2 477.0 3.2Czech Republic 66.6 109.4 156.4 163.9 170.7 1.1Hungary 51.2 90.5 98.2 108.7 113.5 0.8EU (28) 9,561.5 11,517.0 12,793.5 14,635.1 14,861.5 100.0Albania 3.9 6.6 9.0 10.3 10.9Iceland 9.7 13.5 10.0 15.1 16.6Macedonia 4.1 5.0 7.1 9.1 9.5Montenegro 1.1 1.8 3.1 3.6 3.8Serbia 7.1 21.1 29.8 32.9 33.7Turkey 289.9 386.9 550.4 645.4 681.4Switzerland 294.5 327.8 439.1 599.1 589.4Norway 185.9 248.3 323.6 350.9 344.4United States 11,135.4 10,524.7 11,287.8 16,167.3 16,543.2Japan 5,125.5 3,682.2 4,152.5 3,715.9 4,050.2
1.1 Gross domestic product (GDP)
countryGross Domestic Product (GDP) 1 billion EUR
2005 2016 2 2010%-share 2016
of EU (28)
1. INTERNATIONAL OVERVIEW
2000 2015
1 at current prices and current exchange rates source: EU-Commission, OECD2 estimate (EU-Commission, May 2016)
9
1. INTERNATIONAL OVERVIEW
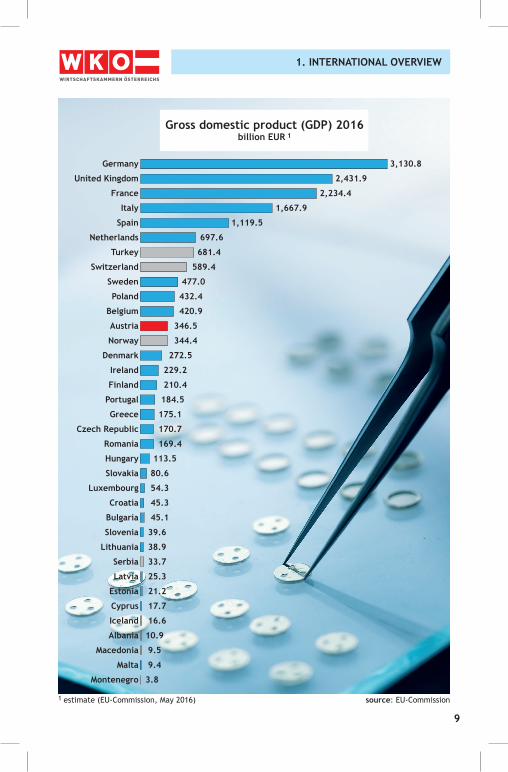
1 estimate (EU-Commission, May 2016) source: EU-Commission
Gross domestic product (GDP) 2016 billion EUR 1
Germany
United Kingdom
France
Italy
Spain
Netherlands
Turkey
Switzerland
Sweden
Poland
Belgium
Austria
Norway
Denmark
Ireland
Finland
Portugal
Greece
Czech Republic
Romania
Hungary
Slovakia
Luxembourg
Croatia
Bulgaria
Slovenia
Lithuania
Serbia
Latvia
Estonia
Cyprus
Iceland
Albania
Macedonia
Malta
Montenegro
3,130.8
2,431.9
2,234.4
1,667.9
1,119.5
697.6
681.4
589.4
477.0
432.4
420.9
346.5
344.4
272.5
229.2
210.4
184.5
175.1
170.7
169.4
113.5
80.6
54.3
45.3
45.1
39.6
38.9
33.7
25.3
21.2
17.7
16.6
10.9
9.5
9.4
3.8

10
Belgium 24,582 27,662 30,245 33,726 33,819Germany 23,352 27,306 30,791 35,818 35,968Estonia 8,408 13,816 16,079 21,768 22,200Finland 22,994 26,832 29,225 31,186 31,178France 22,580 25,437 27,393 30,296 30,460Greece 16,756 21,251 22,101 20,506 20,381Ireland 25,734 33,845 32,985 40,487 41,906Italy 23,146 24,719 26,229 27,318 27,520Latvia 7,093 11,815 13,279 18,649 19,238Lithuania 7,555 12,286 15,317 21,750 22,557Luxembourg 49,091 56,068 64,439 77,221 77,657Malta 16,575 18,803 21,795 25,511 26,263Netherlands 27,399 31,223 34,152 37,483 37,778Austria 25,688 29,038 31,956 36,461 36,608Portugal 15,506 18,470 20,547 22,419 22,791Slovakia 9,673 13,792 18,563 22,424 23,065Slovenia 15,529 19,986 21,051 23,901 24,196Spain 18,864 23,316 24,695 26,570 27,212Cyprus 18,019 22,931 25,971 23,589 23,997Euro area (19) 21,825 25,236 27,499 30,527 30,815Bulgaria 5,514 8,473 11,292 13,598 13,904Denmark 25,689 28,520 31,908 35,345 35,479United Kingdom 23,844 28,967 27,365 31,235 31,426Croatia 9,604 13,393 14,886 16,917 17,198Poland 9,217 11,555 15,729 19,791 20,473Romania 4,977 8,012 12,644 16,193 16,841Sweden 25,523 28,729 31,843 35,676 36,328Czech Republic 14,123 18,608 20,559 24,800 25,186Hungary 10,500 14,489 16,454 19,781 20,246EU (28) 19,628 23,273 25,400 28,723 29,065Albania 3,543 5,188 7,095 8,762 9,022Iceland 25,723 30,114 29,451 34,829 35,646Macedonia 5,386 6,891 8,938 10,689 10,978Montenegro 5,756 7,094 10,249 11,872 12,262Serbia 4,990 7,414 9,009 10,604 10,846Turkey 7,971 9,534 12,188 15,280 15,564Switzerland 29,706 32,565 39,012 45,736 45,960Norway 31,964 40,467 44,853 50,508 51,332United States 31,643 37,017 36,835 42,225 42,700Japan 22,521 25,474 25,749 28,151 28,353
GDP per head, in EUR at PPP 1
2016 2
1 at current prices and purchasing power parities source: EU-Commission
2 estimate (EU-Commission, May 2016)
1.2 Gross domestic product (GDP) per capita
country 2005 2010 2000 2015
1. INTERNATIONAL OVERVIEW

11
1. INTERNATIONAL OVERVIEW
GDP per head 2016 at current prices and PPP (EUR) 1
1 estimate (EU-Commission, May 2016) source: EU-Commission
23,065
22,791
23,997
24,196
25,186
26,263
27,212
31,178
27,520
30,460
31,426
33,819
35,479
35,646
35,968
36,328
36,608
41,906
37,778
45,960
51,332
77,657
16,841
12,262
17,198
20,381
19,238
22,200
20,473
22,557
15,564
13,904
10,978
10,846
9,022
Luxembourg
Norway
Switzerland
Ireland
Netherlands
Austria
Sweden
Germany
Iceland
Denmark
Belgium
United Kingdom
Finland
France
Italy
Spain
Malta
Czech Republic
Slovenia
Cyprus
Slovakia
Portugal
Lithuania
Estonia
Poland
Greece
Hungary
Latvia
Croatia
Romania
Turkey
Bulgaria
Montenegro
Macedonia
Serbia
Albania
20,246

12
2 average annual growth rate
Real GDP, change from previous year (%) 1
2017
source: EU-Commission, OECD
1.3 Economic growth
country 2014 2015 2000-2010 2
1 2016 and 2017: forecast (May 2016)
Belgium + 1.6 + 0.0 + 1.3 + 1.4 + 1.2 + 1.6Germany + 0.9 + 0.3 + 1.6 + 1.7 + 1.6 + 1.6Estonia + 3.3 + 1.6 + 2.9 + 1.1 + 1.9 + 2.4Finland + 1.7 - 0.8 - 0.7 + 0.5 + 0.7 + 0.7France + 1.2 + 0.7 + 0.2 + 1.2 + 1.3 + 1.7Greece + 1.8 - 3.2 + 0.7 - 0.2 - 0.3 + 2.7Ireland + 3.0 + 1.4 + 5.2 + 7.8 + 4.9 + 3.7Italy + 0.3 - 1.7 - 0.3 + 0.8 + 1.1 + 1.3Latvia + 3.8 + 3.0 + 2.4 + 2.7 + 2.8 + 3.1Lithuania + 4.3 + 3.5 + 3.0 + 1.6 + 2.8 + 3.1Luxembourg + 2.7 + 4.3 + 4.1 + 4.8 + 3.3 + 3.9Malta + 2.0 + 4.1 + 3.7 + 6.3 + 4.1 + 3.5Netherlands + 1.3 - 0.5 + 1.0 + 2.0 + 1.7 + 2.0Austria + 1.5 + 0.3 + 0.4 + 0.9 + 1.5 + 1.6Portugal + 0.7 - 1.1 + 0.9 + 1.5 + 1.5 + 1.7Slovakia + 4.9 + 1.4 + 2.5 + 3.6 + 3.2 + 3.3Slovenia + 2.6 - 1.1 + 3.0 + 2.9 + 1.7 + 2.3Spain + 2.2 - 1.7 + 1.4 + 3.2 + 2.6 + 2.5Cyprus + 3.0 - 5.9 - 2.5 + 1.6 + 1.7 + 2.0Euro area (19) + 1.2 - 0.3 + 0.9 + 1.7 + 1.6 + 1.8Bulgaria + 4.4 + 1.3 + 1.5 + 3.0 + 2.0 + 2.4Denmark + 0.7 - 0.2 + 1.3 + 1.2 + 1.2 + 1.9United Kingdom + 1.6 + 2.2 + 2.9 + 2.3 + 1.8 + 1.9Croatia + 2.5 - 1.1 - 0.4 + 1.6 + 1.8 + 2.1Poland + 3.9 + 1.3 + 3.3 + 3.6 + 3.7 + 3.6Romania + 4.3 + 3.5 + 3.0 + 3.8 + 4.2 + 3.7Sweden + 2.1 + 1.2 + 2.3 + 4.1 + 3.4 + 2.9Czech Republic + 3.2 - 0.5 + 2.0 + 4.2 + 2.1 + 2.6Hungary + 2.0 + 1.9 + 3.7 + 2.9 + 2.5 + 2.8EU (28) + 1.4 + 0.2 + 1.4 + 2.0 + 1.8 + 1.9Albania + 5.5 + 1.1 + 2.0 + 2.6 + 3.2 + 3.5Iceland + 2.7 + 3.9 + 1.8 + 4.1 + 3.7 + 2.9Macedonia + 3.0 + 2.9 + 3.5 + 3.7 + 3.5 + 3.5Montenegro + 3.6 + 3.5 + 1.8 + 3.2 + 3.6 + 3.9Serbia + 4.4 + 2.6 - 1.8 + 0.7 + 2.0 + 2.5Turkey + 3.9 + 4.2 + 2.9 + 4.0 + 3.5 + 3.7Switzerland + 1.9 + 1.8 + 1.9 + 0.7 + 1.1 + 1.6Norway + 1.6 + 0.7 + 2.2 + 1.2 + 1.1 + 1.9United States + 1.6 + 1.5 + 2.4 + 2.4 + 2.3 + 2.2Japan + 0.8 + 1.4 + 0.0 + 0.5 + 0.8 + 0.4
2013 2016
1. INTERNATIONAL OVERVIEW
13
1. INTERNATIONAL OVERVIEW
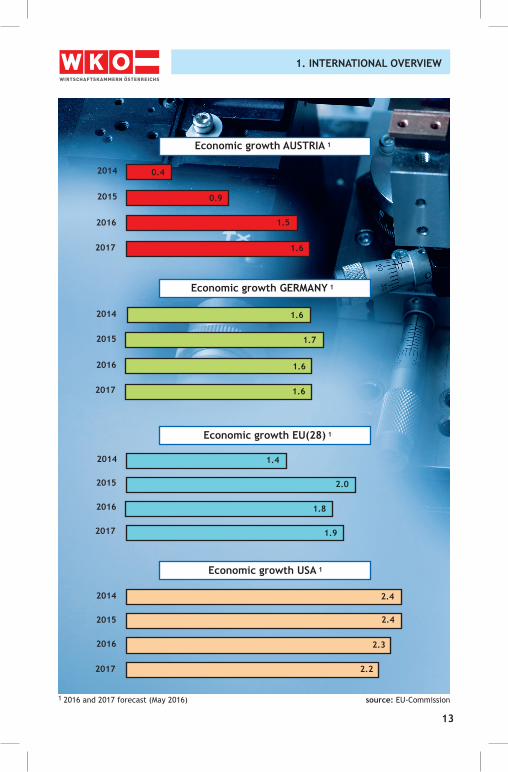
1 2016 and 2017 forecast (May 2016) source: EU-Commission
Economic growth AUSTRIA 1
Economic growth USA 1
Economic growth EU(28) 1
Economic growth GERMANY 1
2014
0.9
2017
2016
2015
2014
2017
2016
2015
2014
2017
2016
2015
2014
2017
2016
2015
1.7
1.6
1.6
1.6
2.0
1.9
1.8
1.4
2.4
2.2
2.3
2.4
1.5
1.6
0.4

14
1. INTERNATIONAL OVERVIEW
Belgium 341.6 360.6 59.7 83.2Germany 946.6 1,198.9 39.1 46.9Estonia 13.1 11.6 53.9 79.8Finland 54.3 53.9 26.7 37.3France 515.9 456.0 21.6 29.8Greece 43.6 25.9 16.2 30.1Ireland 66.8 110.7 67.0 121.4Italy 368.7 413.9 24.8 30.2Latvia 12.9 10.9 42.2 58.8Lithuania 25.4 23.0 60.6 77.3Luxembourg 20.9 15.6 35.7 213.8Malta 5.2 2.3 31.5 141.5Netherlands 456.7 511.4 63.3 82.8Austria 140.2 137.8 37.8 53.4Portugal 60.2 49.9 29.1 40.3Slovakia 66.3 68.0 84.6 93.8Slovenia 26.8 28.8 62.4 77.8Spain 281.3 255.4 23.3 33.1Cyprus 5.0 1.7 14.2 59.9Euro area (19) 3,451.7 3,736.3 34.1 45.8Bulgaria 26.4 23.1 50.2 66.5Denmark 77.2 85.9 32.5 53.3United Kingdom 564.3 414.9 15.3 27.4Croatia 19.1 11.6 24.4 49.4Poland 175.0 178.7 40.1 49.4Romania 63.0 54.6 30.6 41.1Sweden 124.5 126.4 30.9 45.2Czech Republic 126.9 142.8 72.0 84.5Hungary 83.5 88.9 74.1 92.1EU (28) 4,711.6 4,863.3 31.6 43.6Albania 3.1 0.8 7.5 27.1Iceland 4.6 3.9 27.8 53.3Macedonia 4.7 2.9 31.5 48.5Montenegro 1.8 0.3 9.0 42.8Serbia 15.4 11.6 35.3 47.7Turkey 187.7 127.7 21.5 27.8Switzerland 158.0 195.6 46.4 63.5Norway 65.4 91.6 26.5 37.0United States 2,022.3 1,358.6 8.4 12.6Japan 583.9 549.8 14.9 17.9
countrybillion EUR
importsof goods 1
1.4 Foreign trade and export ratios 2015
% of GDP
exportsof goods 1
exportsof goods 1
exports g & s 2
2 exports of goods and services acc. to National Accounts1 acc. to National Accounts: partly estimates (EUROSTAT, May 2016) source: EUROSTAT

15
1. INTERNATIONAL OVERVIEW
2 period averages
Current balance in % of GDP 1
2017
source: EU-Commission
1.5 Current balances
country 2014 2015 2000-2010 2
1 2016 and 2017: forecast (May 2016)
Belgium + 3.8 + 1.0 + 0.8 + 1.3 + 1.8 + 1.9Germany + 3.7 + 6.7 + 7.8 + 8.8 + 8.5 + 8.3Estonia - 8.6 + 0.2 + 1.1 + 2.0 + 0.9 + 1.6Finland + 4.7 - 1.9 - 1.2 + 0.1 + 0.3 + 0.4France - 0.1 - 2.6 - 2.3 - 1.5 - 1.1 - 1.0Greece -11.4 - 2.2 - 3.0 - 0.2 + 0.6 + 1.3Ireland - 2.1 + 3.1 + 3.6 + 4.4 + 4.6 + 4.6Italy - 1.3 + 0.9 + 1.8 + 2.2 + 2.4 + 2.3Latvia - 9.1 - 2.1 - 2.0 - 1.2 - 2.6 - 2.4Lithuania - 6.6 + 1.4 + 3.9 - 1.5 - 0.0 + 0.1Luxembourg + 9.2 + 5.7 + 5.5 + 5.6 + 5.3 + 4.8Malta - 5.0 + 3.6 + 3.4 + 9.9 + 5.6 + 4.4Netherlands + 6.8 +11.0 +10.6 + 9.2 + 8.9 + 8.2Austria + 1.9 + 2.1 + 2.1 + 3.1 + 3.1 + 3.3Portugal -10.0 + 0.7 - 0.0 - 0.1 + 0.3 + 0.5Slovakia - 6.1 + 0.7 - 0.8 + 0.8 - 0.6 - 1.1Slovenia - 2.2 + 3.9 + 6.5 + 7.0 + 7.0 + 6.9Spain - 5.9 + 1.5 + 1.0 + 1.4 + 1.5 + 1.3Cyprus -11.3 - 4.5 - 4.6 - 3.5 - 4.2 - 4.6Euro area (19) + 0.2 + 2.5 + 3.0 + 3.6 + 3.7 + 3.6Bulgaria -10.9 + 1.5 + 2.8 + 1.9 + 2.3 + 2.7Denmark + 3.4 + 7.1 + 7.7 + 7.0 + 6.3 + 6.2United Kingdom - 2.3 - 4.5 - 5.1 - 5.2 - 4.9 - 4.4Croatia - 4.7 + 1.6 + 1.1 + 5.1 + 4.4 + 4.0Poland - 4.1 - 0.5 - 1.3 + 0.1 - 0.3 - 0.9Romania - 7.0 - 0.6 + 0.2 - 0.9 - 2.1 - 2.8Sweden + 6.8 + 5.5 + 4.2 + 4.9 + 5.8 + 5.7Czech Republic - 4.2 - 1.1 - 2.0 - 2.0 - 1.5 - 1.3Hungary - 6.3 + 3.9 + 2.2 + 4.9 + 5.0 + 4.5EU (28) - 0.2 + 1.5 + 1.6 + 2.0 + 2.2 + 2.1Albania . -10.5 -12.9 -11.2 -12.1 -12.5Iceland -10.9 + 5.7 + 3.7 + 4.2 + 0.9 - 0.0Macedonia - 5.6 - 1.6 - 0.8 - 1.4 - 1.7 - 2.2Montenegro . -14.5 -15.2 -13.4 -13.8 -14.7Serbia . - 6.1 - 6.0 - 4.8 - 4.3 - 4.3Turkey - 3.5 - 7.9 - 5.8 - 4.5 - 4.8 - 5.1Switzerland +10.9 +12.0 + 8.6 +12.5 +11.7 +11.8Norway +13.6 +10.2 +11.9 + 9.0 + 5.0 + 5.3United States - 4.4 - 2.4 - 2.3 - 3.4 - 2.8 - 3.1Japan + 3.3 + 0.7 + 0.5 + 3.3 + 3.9 + 4.1
2013 2016

16
1. INTERNATIONAL OVERVIEW
2 period averages
unemployed persons in % of labour force 1
source: EU-Commission
1.6 Unemployment rates
country 2014 2015 2000-2010 2
1 2016 and 2017: forecast (May 2016)
Belgium 7.7 8.4 8.5 8.5 8.2 7.7Germany 8.7 5.2 5.0 4.6 4.6 4.7Estonia 10.3 8.6 7.4 6.2 6.5 7.7Finland 8.3 8.2 8.7 9.4 9.4 9.3France 8.5 10.3 10.3 10.4 10.2 10.1Greece 10.0 27.5 26.5 24.9 24.7 23.6Ireland 6.2 13.1 11.3 9.4 8.2 7.5Italy 7.9 12.1 12.7 11.9 11.4 11.2Latvia 11.9 11.9 10.8 9.9 9.6 9.3Lithuania 11.5 11.8 10.7 9.1 7.8 6.4Luxembourg 4.0 5.9 6.0 6.4 6.2 6.2Malta 7.0 6.4 5.8 5.4 5.1 5.1Netherlands 4.5 7.3 7.4 6.9 6.4 6.1Austria 4.8 5.4 5.6 5.7 5.9 6.1Portugal 8.2 16.4 14.1 12.6 11.6 10.7Slovakia 15.5 14.2 13.2 11.5 10.5 9.5Slovenia 6.1 10.1 9.7 9.0 8.6 8.1Spain 12.0 26.1 24.5 22.1 20.0 18.1Cyprus 4.6 15.9 16.1 15.1 13.4 12.4Euro area (19) 8.8 12.0 11.6 10.9 10.4 10.0Bulgaria 11.7 13.0 11.4 9.2 8.6 8.0Denmark 4.9 7.0 6.6 6.2 6.0 5.7United Kingdom 5.6 7.6 6.1 5.3 5.0 4.9Croatia 12.6 17.3 17.3 16.3 15.5 14.7Poland 14.5 10.3 9.0 7.5 6.8 6.3Romania 7.2 7.1 6.8 6.8 6.8 6.7Sweden 6.9 8.0 7.9 7.4 6.8 6.3Czech Republic 7.2 7.0 6.1 5.1 4.5 4.4Hungary 7.3 10.2 7.7 6.8 6.4 6.1EU (28) 8.6 10.9 10.2 9.4 8.9 8.6Albania . . . . . .Iceland 3.6 5.4 5.0 4.0 3.9 3.7Macedonia 34.1 29.0 28.0 26.1 24.7 23.5Montenegro . 19.5 18.0 17.6 16.9 16.4Serbia 16.3 22.1 19.4 17.9 17.0 16.2Turkey 9.2 9.0 9.9 10.3 10.6 10.7Switzerland 3.5 4.1 4.2 4.3 4.9 4.6Norway 3.5 3.5 3.5 4.4 4.6 4.9United States 5.9 7.4 6.2 5.3 4.8 4.5Japan 4.7 4.0 3.6 3.4 3.3 3.3
2013 2016 2017

17
1. INTERNATIONAL OVERVIEW
Unemployment rates 2016% of labour force 1
1 forecast (May 2016) source: EU-Commission
6.8
6.8
7.8
8.2
8.2
8.6
9.6
8.6
9.4
10.2
10.5
11.4
11.6
13.4
15.5
16.9
20.0
17.0
24.7
24.7 no data available
5.0
5.9
5.1
6.0
6.4
6.2
6.5
6.4
6.8
4.6
4.9
10.6
4.6
4.5
3.9
Albania
Macedonia
Greece
Spain
Serbia
Montenegro
Croatia
Cyprus
Portugal
Italy
Turkey
Slovakia
France
Latvia
Finland
Bulgaria
Slovenia
Ireland
Belgium
Lithuania
Sweden
Romania
Poland
Estonia
Hungary
Netherlands
Luxembourg
Denmark
Austria
Malta
United Kingdom
Switzerland
Norway
Germany
Czech Republic
Iceland
18
1. INTERNATIONAL OVERVIEW
2 period averages
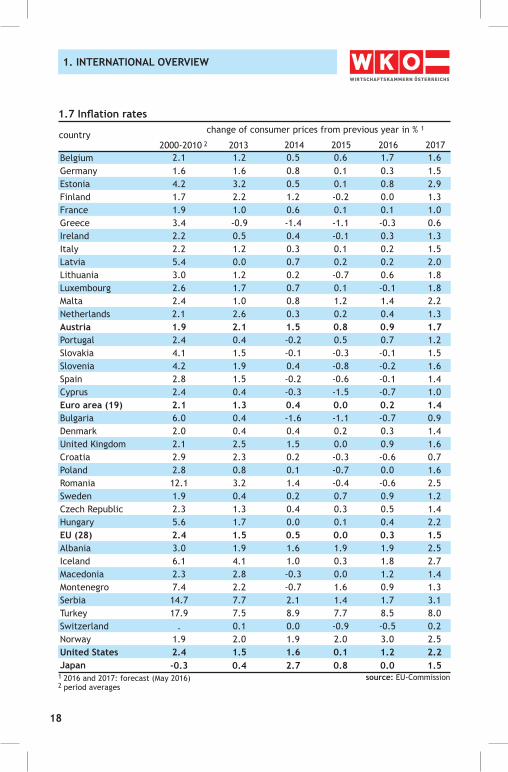
change of consumer prices from previous year in % 1
source: EU-Commission
1.7 Inflation rates
country 2014 2015 2000-2010 2
1 2016 and 2017: forecast (May 2016)
Belgium 2.1 1.2 0.5 0.6 1.7 1.6Germany 1.6 1.6 0.8 0.1 0.3 1.5Estonia 4.2 3.2 0.5 0.1 0.8 2.9Finland 1.7 2.2 1.2 -0.2 0.0 1.3France 1.9 1.0 0.6 0.1 0.1 1.0Greece 3.4 -0.9 -1.4 -1.1 -0.3 0.6Ireland 2.2 0.5 0.4 -0.1 0.3 1.3Italy 2.2 1.2 0.3 0.1 0.2 1.5Latvia 5.4 0.0 0.7 0.2 0.2 2.0Lithuania 3.0 1.2 0.2 -0.7 0.6 1.8Luxembourg 2.6 1.7 0.7 0.1 -0.1 1.8Malta 2.4 1.0 0.8 1.2 1.4 2.2Netherlands 2.1 2.6 0.3 0.2 0.4 1.3Austria 1.9 2.1 1.5 0.8 0.9 1.7Portugal 2.4 0.4 -0.2 0.5 0.7 1.2Slovakia 4.1 1.5 -0.1 -0.3 -0.1 1.5Slovenia 4.2 1.9 0.4 -0.8 -0.2 1.6Spain 2.8 1.5 -0.2 -0.6 -0.1 1.4Cyprus 2.4 0.4 -0.3 -1.5 -0.7 1.0Euro area (19) 2.1 1.3 0.4 0.0 0.2 1.4Bulgaria 6.0 0.4 -1.6 -1.1 -0.7 0.9Denmark 2.0 0.4 0.4 0.2 0.3 1.4United Kingdom 2.1 2.5 1.5 0.0 0.9 1.6Croatia 2.9 2.3 0.2 -0.3 -0.6 0.7Poland 2.8 0.8 0.1 -0.7 0.0 1.6Romania 12.1 3.2 1.4 -0.4 -0.6 2.5Sweden 1.9 0.4 0.2 0.7 0.9 1.2Czech Republic 2.3 1.3 0.4 0.3 0.5 1.4Hungary 5.6 1.7 0.0 0.1 0.4 2.2EU (28) 2.4 1.5 0.5 0.0 0.3 1.5Albania 3.0 1.9 1.6 1.9 1.9 2.5Iceland 6.1 4.1 1.0 0.3 1.8 2.7Macedonia 2.3 2.8 -0.3 0.0 1.2 1.4Montenegro 7.4 2.2 -0.7 1.6 0.9 1.3Serbia 14.7 7.7 2.1 1.4 1.7 3.1Turkey 17.9 7.5 8.9 7.7 8.5 8.0Switzerland . 0.1 0.0 -0.9 -0.5 0.2Norway 1.9 2.0 1.9 2.0 3.0 2.5United States 2.4 1.5 1.6 0.1 1.2 2.2Japan -0.3 0.4 2.7 0.8 0.0 1.5
2013 2016 2017

19
1. INTERNATIONAL OVERVIEW
Inflation rates 2016%-change of consumer prices 1
1 forecast (May 2016) source: EU-Commission
0.1
0.0
0.2
0.3
0.3
0.3
0.5
0.4
0.4
0.6
0.7
0.9
0.9
1.2
1.4
1.7
1.8
1.7
1.9
3.0
8.5
-0.6
-0.5
-0.3
-0.1
-0.2
-0.1
-0.1
0.0
-0.7
0.8
0.2
-0.6
-0.7
Turkey
Norway
Albania
Iceland
Serbia
Belgium
Malta
Macedonia
Sweden
Montenegro
Austria
United Kingdom
Estonia
Portugal
Lithuania
Czech Republic
Netherlands
Hungary
Germany
Denmark
Ireland
Italy
Latvia
France
Poland
Finland
Luxembourg
Slovakia
Spain
Slovenia
Greece
Switzerland
Croatia
Romania
Bulgaria
Cyprus
0.9
0.9

20
1. INTERNATIONAL OVERVIEW
deficit/surplus of general government in % of GDP 1
source: EU-Commission
1.8 Public financial balances
country 2014 2015 2000-20105 2
1 2016 and 2017: forecast (May 2016)
2013 2016 2017Belgium - 1.3 - 3.0 - 3.1 - 2.6 - 2.8 - 2.3Germany - 2.4 - 0.1 + 0.3 + 0.7 + 0.2 + 0.1Estonia + 0.6 - 0.2 + 0.8 + 0.4 - 0.1 - 0.2Finland + 2.8 - 2.6 - 3.2 - 2.7 - 2.5 - 2.3France - 3.5 - 4.0 - 4.0 - 3.5 - 3.4 - 3.2Greece - 8.0 -13.0 - 3.6 - 7.2 - 3.1 - 1.8Ireland - 3.7 - 5.7 - 3.8 - 2.3 - 1.2 - 0.7Italy - 3.3 - 2.9 - 3.0 - 2.6 - 2.4 - 1.9Latvia - 3.0 - 0.9 - 1.6 - 1.3 - 1.0 - 1.0Lithuania - 2.9 - 2.6 - 0.7 - 0.2 - 1.0 - 0.2Luxembourg + 1.9 + 0.8 + 1.7 + 1.2 + 1.0 + 0.1Malta - 4.4 - 2.6 - 2.0 - 1.5 - 0.9 - 0.8Netherlands - 1.4 - 2.4 - 2.4 - 1.8 - 1.7 - 1.2Austria - 2.6 - 1.3 - 2.7 - 1.2 - 1.5 - 1.4Portugal - 5.5 - 4.8 - 7.2 - 4.4 - 2.7 - 2.3Slovakia - 5.2 - 2.7 - 2.7 - 3.0 - 2.4 - 1.6Slovenia - 2.7 -15.0 - 5.0 - 2.9 - 2.4 - 2.1Spain - 2.0 - 6.9 - 5.9 - 5.1 - 3.9 - 3.1Cyprus - 2.5 - 4.9 - 8.9 - 1.0 - 0.4 - 0.0Euro area (19) - 2.8 - 3.0 - 2.6 - 2.1 - 1.9 - 1.6Bulgaria - 0.1 - 0.4 - 5.4 - 2.1 - 2.0 - 1.6Denmark + 1.6 - 1.1 + 1.5 - 2.1 - 2.5 - 1.9United Kingdom - 3.8 - 5.6 - 5.6 - 4.4 - 3.4 - 2.4Croatia . - 5.3 - 5.5 - 3.2 - 2.7 - 2.3Poland - 4.7 - 4.0 - 3.3 - 2.6 - 2.6 - 3.1Romania - 3.6 - 2.1 - 0.9 - 0.7 - 2.8 - 3.4Sweden + 1.0 - 1.4 - 1.6 - 0.0 - 0.4 - 0.7Czech Republic - 3.8 - 1.3 - 1.9 - 0.4 - 0.7 - 0.6Hungary - 5.9 - 2.6 - 2.3 - 2.0 - 2.0 - 2.0EU (28) . - 3.3 - 3.0 - 2.4 - 2.1 - 1.8Albania - 5.2 - 5.0 - 5.1 - 4.0 - 2.3 - 1.6Iceland - 2.1 - 1.8 - 0.1 - 0.5 + 0.4 + 0.5Macedonia . - 3.8 - 3.7 - 3.5 - 3.4 - 2.9Montenegro . - 5.2 - 3.1 - 8.5 - 6.2 - 6.1Serbia . - 5.5 - 6.6 - 3.8 - 3.1 - 2.9Turkey - 6.2 + 0.2 - 1.5 - 1.4 - 1.7 - 1.6Switzerland - 0.5 - 0.3 - 0.2 - 0.3 - 0.4 - 0.0Norway +13.2 +10.8 + 8.7 + 5.7 + 6.1 + 5.2United States - 5.4 - 5.3 - 4.9 - 4.0 - 4.4 - 4.4Japan - 5.6 - 8.5 - 6.2 - 5.2 - 4.5 - 4.2
2 period averages

21
1. INTERNATIONAL OVERVIEW
Public deficit/surplus 2016% of GDP 1
1 forecast (May 2016) source: EU-Commission
-2.4
-2.4
-2.3
-2.0
-2.0
-1.7
-1.2
-1.7
-1.5
-1.0
-1.0
-0.7
-0.4
-0.4
-0.4
-0.1+0.2
+0.4
+1.0
+6.1
-3.1
-2.8
-2.8
-2.7
-2.6
-2.7
-2.5
-2.5
-2.4
-3.4
-3.1
-0.9
-3.4
-3.4
-3.9
Norway
Luxembourg
Iceland
Germany
Estonia
Sweden
Cyprus
Switzerland
Czech Republic
Malta
Lithuania
Latvia
Ireland
Austria
Turkey
Netherlands
Bulgaria
Hungary
Albania
Slovenia
Slovakia
Italy
Denmark
Finland
Poland
Portugal
Croatia
Romania
Belgium
Serbia
Greece
United Kingdom
France
Macedonia
Spain
Montenegro -6.2
22
1. INTERNATIONAL OVERVIEW
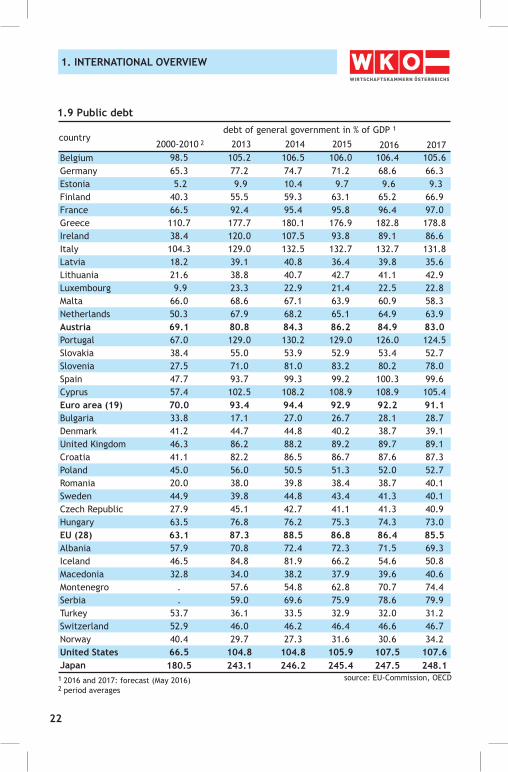
debt of general government in % of GDP 1
source: EU-Commission, OECD
1.9 Public debt
country 2014 20152000-2010 2
1 2016 and 2017: forecast (May 2016)
2013 2016Belgium 98.5 105.2 106.5 106.0 106.4 105.6Germany 65.3 77.2 74.7 71.2 68.6 66.3Estonia 5.2 9.9 10.4 9.7 9.6 9.3Finland 40.3 55.5 59.3 63.1 65.2 66.9France 66.5 92.4 95.4 95.8 96.4 97.0Greece 110.7 177.7 180.1 176.9 182.8 178.8Ireland 38.4 120.0 107.5 93.8 89.1 86.6Italy 104.3 129.0 132.5 132.7 132.7 131.8Latvia 18.2 39.1 40.8 36.4 39.8 35.6Lithuania 21.6 38.8 40.7 42.7 41.1 42.9Luxembourg 9.9 23.3 22.9 21.4 22.5 22.8Malta 66.0 68.6 67.1 63.9 60.9 58.3Netherlands 50.3 67.9 68.2 65.1 64.9 63.9Austria 69.1 80.8 84.3 86.2 84.9 83.0Portugal 67.0 129.0 130.2 129.0 126.0 124.5Slovakia 38.4 55.0 53.9 52.9 53.4 52.7Slovenia 27.5 71.0 81.0 83.2 80.2 78.0Spain 47.7 93.7 99.3 99.2 100.3 99.6Cyprus 57.4 102.5 108.2 108.9 108.9 105.4Euro area (19) 70.0 93.4 94.4 92.9 92.2 91.1Bulgaria 33.8 17.1 27.0 26.7 28.1 28.7Denmark 41.2 44.7 44.8 40.2 38.7 39.1United Kingdom 46.3 86.2 88.2 89.2 89.7 89.1Croatia 41.1 82.2 86.5 86.7 87.6 87.3Poland 45.0 56.0 50.5 51.3 52.0 52.7Romania 20.0 38.0 39.8 38.4 38.7 40.1Sweden 44.9 39.8 44.8 43.4 41.3 40.1Czech Republic 27.9 45.1 42.7 41.1 41.3 40.9Hungary 63.5 76.8 76.2 75.3 74.3 73.0EU (28) 63.1 87.3 88.5 86.8 86.4 85.5Albania 57.9 70.8 72.4 72.3 71.5 69.3Iceland 46.5 84.8 81.9 66.2 54.6 50.8Macedonia 32.8 34.0 38.2 37.9 39.6 40.6Montenegro . 57.6 54.8 62.8 70.7 74.4Serbia . 59.0 69.6 75.9 78.6 79.9Turkey 53.7 36.1 33.5 32.9 32.0 31.2Switzerland 52.9 46.0 46.2 46.4 46.6 46.7Norway 40.4 29.7 27.3 31.6 30.6 34.2United States 66.5 104.8 104.8 105.9 107.5 107.6Japan 180.5 243.1 246.2 245.4 247.5 248.1
2017
2 period averages

23
1. INTERNATIONAL OVERVIEW
Public debt 2016% of GDP 1
1 forecast (May 2016) source: EU-Commission, OECD
54.6
53.4
60.9
64.9
65.2
68.6
74.3
70.7
71.5
78.6
80.2
87.6
89.1
89.796.4
100.3
108.9
106.4
126.0
132.7
182.8
38.7
39.6
38.7
39.8
41.3
41.1
46.641.3
52.0
30.6
32.0
84.9
22.5
28.1
9.6
Greece
Italy
Portugal
Cyprus
Belgium
Spain
France
United Kingdom
Ireland
Croatia
Austria
Slovenia
Serbia
Hungary
Albania
Montenegro
Germany
Finland
Netherlands
Malta
Iceland
Slovakia
Poland
Switzerland
Sweden
Czech Republic
Lithuania
Latvia
Macedonia
Romania
Denmark
Turkey
Norway
Bulgaria
Luxembourg
Estonia

24
1. INTERNATIONAL OVERVIEW
2 forecast (May 2016)
real annual change of GDP in %
source: EU-Commission
1.10 Worldwide economic growth
country 2013 2015
1 relative weights based on GDP figures 2014 (constant prices und purchasing power parities)
EU (28) 17.1 + 0.2 + 1.4 + 2.0 + 1.8 + 1.9
Euro area (19) 12.1 - 0.3 + 0.9 + 1.7 + 1.6 + 1.8 Germany 3.4 + 0.3 + 1.6 + 1.7 + 1.6 + 1.6
France 2.4 + 0.7 + 0.2 + 1.2 + 1.3 + 1.7
United Kingdom 2.4 + 2.2 + 2.9 + 2.3 + 1.8 + 1.9
Italy 2.0 - 1.7 - 0.3 + 0.8 + 1.1 + 1.3
Spain 1.4 - 1.7 + 1.4 + 3.2 + 2.6 + 2.5
EU Candidate countries 3 1.5 + 4.0 + 2.7 + 3.8 + 3.4 + 3.6United States 15.9 + 1.5 + 2.4 + 2.4 + 2.3 + 2.2Japan 4.4 + 1.4 + 0.0 + 0.5 + 0.8 + 0.4Canada 1.5 + 2.2 + 2.5 + 1.2 + 1.7 + 2.1
Norway 0.3 + 1.0 + 2.2 + 1.6 + 1.2 + 1.7
Switzerland 0.4 + 1.8 + 1.9 + 0.9 + 1.2 + 1.5
Australia 1.0 + 2.0 + 2.6 + 2.5 + 2.5 + 2.8
New Zealand 0.1 + 1.7 + 3.0 + 2.3 + 2.3 + 2.4
Advanced Economies 42.4 + 1.1 + 1.8 + 2.0 + 2.0 + 2.0CIS 4.7 + 2.1 + 0.9 - 2.9 - 1.1 + 1.1 Russia 3.3 + 1.3 + 0.6 - 3.7 - 1.9 + 0.5
Other CIS 1.4 + 4.1 + 1.6 - 1.0 + 0.7 + 2.4
Middle East & North-Africa 6.8 + 1.7 + 2.7 + 2.8 + 2.9 + 3.4Asia 34.1 + 6.5 + 6.2 + 5.9 + 5.8 + 5.7 China 16.6 + 8.0 + 7.3 + 6.9 + 6.5 + 6.2
India 6.8 + 6.9 + 7.1 + 7.3 + 7.4 + 7.4
Hong Kong 0.4 + 3.1 + 2.6 + 2.4 + 1.9 + 2.2
Korea 1.6 + 2.9 + 3.3 + 2.6 + 2.6 + 2.8
Indonesia 2.5 + 5.6 + 5.0 + 4.8 + 4.9 + 5.0
Latin America 8.6 + 2.9 + 1.2 - 0.1 - 0.4 + 1.4 Brazil 3.0 + 2.7 + 0.1 - 3.8 - 3.7 + 0.3
Mexico 2.0 + 1.4 + 2.2 + 2.5 + 2.2 + 2.4
Sub-Saharan Africa 3.2 + 5.0 + 5.0 + 3.3 + 3.3 + 3.9Emerging & develop. economies 57.6 + 4.9 + 4.5 + 3.8 + 3.9 + 4.4World 100.0 + 3.2 + 3.3 + 3.0 + 3.1 + 3.4World excluding EU (28) 82.9 + 3.9 + 3.7 + 3.2 + 3.3 + 3.7World excluding Euro area (19) 87.9 + 3.7 + 3.7 + 3.2 + 3.3 + 3.6
2016 2 2017 2 weight 1
3 Albania, Macedonia, Montenegro, Serbia, Turkey
2013

25
1. INTERNATIONAL OVERVIEW
real annual change of GDP in %
2 forecast (May 2016)
real annual change in %
source: EU-Commission
1.11 Worldwide export growth (goods & services)
country 2014 2015
1 relative weights based on export volume figures 2014 (constant prices und purchasing power parities)
EU (28) 3 34.1 + 2.2 + 4.0 + 5.3 + 3.5 + 4.6
Euro area (19) 3 25.5 + 2.1 + 4.1 + 5.2 + 3.5 + 4.7EU Candidate countries 4 1.1 + 1.4 + 7.0 + 0.0 + 1.4 + 3.4 Turkey 1.0 - 0.3 + 7.4 - 0.8 + 0.8 + 3.0
Macedonia 0.0 + 6.1 +18.2 + 4.6 + 6.8 + 7.0
Montenegro 0.1 +21.3 + 5.7 + 7.8 + 6.9 + 6.3
Serbia 0.0 + 7.9 -17.5 + 0.0 + 3.8 + 4.6
Albania 0.0 + 6.7 + 3.1 + 8.1 + 6.1 + 4.8
United States 10.9 + 2.8 + 3.4 + 1.1 + 1.0 + 3.5Japan 3.6 + 1.2 + 8.3 + 2.7 + 2.0 + 3.0Canada 2.7 + 2.8 + 5.3 + 3.0 + 3.3 + 3.6
Norway 0.7 - 1.7 + 2.2 + 2.3 + 2.6 + 3.7
Switzerland 2.0 +15.2 - 6.9 + 3.2 + 3.1 + 3.2
Australia 1.2 + 5.9 + 6.7 + 6.1 + 5.6 + 5.6
New Zealand 0.3 + 0.8 + 3.0 + 4.1 + 2.1 + 2.4
Advanced Economies 56.5 + 2.8 + 3.9 + 4.0 + 2.9 + 4.2CIS 2.7 + 0.6 - 1.0 - 2.1 - 0.3 + 2.7 Russia 1.8 + 4.6 - 0.1 + 3.1 + 2.5 + 2.0
Other CIS 0.9 - 6.8 - 2.8 -12.3 - 5.9 + 4.1
Middle East & North-Africa 5.9 + 1.5 - 0.1 + 2.5 + 2.6 + 3.4Asien 27.7 + 5.8 + 3.9 - 0.8 + 1.9 + 2.7 China 11.7 + 8.8 + 4.8 - 1.4 + 2.1 + 3.0
India 2.1 + 4.4 + 4.4 - 3.2 + 3.0 + 4.2
Hong Kong 2.8 + 6.2 + 0.9 - 0.6 + 1.1 + 1.5
Korea 3.3 + 4.3 + 2.8 + 0.5 + 2.3 + 2.7
Indonesia 0.8 + 1.3 + 0.7 - 1.0 + 2.6 + 4.0
Latin America 5.7 + 1.3 + 1.6 + 4.7 + 2.3 + 2.9 Brasilia 1.2 + 2.3 - 1.0 + 6.3 - 0.5 + 1.9
Mexico 2.1 + 2.3 + 7.0 + 9.3 + 4.3 + 3.7
Sub-Saharan Africa 1.6 + 3.5 - 0.7 + 2.9 + 2.8 + 3.5Emerging & develop. economies 43.5 + 3.9 + 2.3 + 0.4 + 1.9 + 2.9World 100.0 + 3.3 + 3.2 + 2.5 + 2.5 + 3.6World excluding EU (28) 65.9 + 3.8 + 2.8 + 1.0 + 1.9 + 3.1World excluding Euro area (19) 74.5 + 3.7 + 2.9 + 1.5 + 2.2 + 3.2
2016 2 2017 2 weight1
3 Intra- and Extra-EU trade
2013
4 Albania, Macedonia, Montenegro, Serbia, Turkey