1 interpreting deep visual representations via network … · feature space? what differences in...
TRANSCRIPT

1
Interpreting Deep Visual Representations viaNetwork Dissection
Bolei Zhou∗, David Bau∗, Aude Oliva, and Antonio Torralba
Abstract—The success of recent deep convolutional neural networks (CNNs) depends on learning hidden representations that cansummarize the important factors of variation behind the data. In this work, we describe Network Dissection, a method that interpretsnetworks by providing meaningful labels to their individual units. The proposed method quantifies the interpretability of CNNrepresentations by evaluating the alignment between individual hidden units and visual semantic concepts. By identifying the bestalignments, units are given interpretable labels ranging from colors, materials, textures, parts, objects and scenes. The method revealsthat deep representations are more transparent and interpretable than they would be under a random equivalently powerful basis. Weapply our approach to interpret and compare the latent representations of several network architectures trained to solve a wide range ofsupervised and self-supervised tasks. We then examine factors affecting the network interpretability such as the number of the trainingiterations, regularizations, different initialization parameters, as well as networks depth and width. Finally we show that the interpretedunits can be used to provide explicit explanations of a given CNN prediction for an image. Our results highlight that interpretability is animportant property of deep neural networks that provides new insights into what hierarchical structures can learn.
Index Terms—Convolutional Neural Networks, Network Interpretability, Visual Recognition, Interpretable Machine Learning.
F
1 INTRODUCTION
O BSERVATIONS of hidden units in deep neural networks haverevealed that human-interpretable concepts can emerge as
individual latent variables within those networks. For example,object detector units emerge within networks trained to recognizeplaces [1], part detectors emerge in object classifiers [2] and objectdetectors emerge in generative video networks [3]. This internalstructure has appeared in situations where the networks are notconstrained to decompose problems in any interpretable way.
The emergence of interpretable structure suggests that deepnetworks may be spontaneously learning disentangled represen-tations. While a network can learn an efficient encoding thatmakes economical use of hidden variables to distinguish betweeninputs, the appearance of a disentangled representation is not wellunderstood. A disentangled representation aligns its variables witha meaningful factorization of the underlying problem structure [4],or units that have a semantic interpretation (a face, wheel, greencolor, etc). Here, we address the following key issues:• What is a disentangled representation of neural networks, and
how can its factors be detected and quantified?• Do interpretable hidden units reflect a special alignment of
feature space?• What differences in network architectures, data sources, and
training conditions lead to the internal representations withgreater or lesser entanglement?
We propose a general analytic framework, Network Dissection,for interpreting deep visual representations and quantifying theirinterpretability. Using a broadly and densely labeled dataset namedBroden, our framework identifies hidden units’ semantics for anygiven CNN, and aligns them with interpretable concepts.
• B. Zhou and D.Bau contributed equally to this work.• B. Zhou, D. Bau, A.Oliva, and A. Torralba are with CSAIL, MIT, MA,
02139.E-mail: {bzhou, davidbau, oliva, torralba}@csail.mit.edu
Building upon [5], we provide a description of the methodologyof Network Dissection in detail, and how it is used to interpret deepvisual representations trained with different network architectures(AlexNet, VGG, GoogLeNet, ResNet, DenseNet) and supervisionstasks (ImageNet for object recognition, Places for scene recognition,as well as other self-taught supervision tasks). We show thatinterpretability is an axis-aligned property of a representationthat can be destroyed by rotation without affecting discriminativepower. We further examine how interpretability is affected bydifferent training datasets, training regularizations such as dropout[6] and batch normalization [7], as well as fine-tuning betweendifferent data sources. Our experiments reveal that units emerge assemantic detectors in the intermediate layers of most deep visualrepresentations, while the degree of interpretability can vary widelyacross changes in architecture and training sets. We conclude thatrepresentations learned by deep networks are more interpretablethan previously thought, and that measurements of interpretabilityprovide insights about the structure of deep visual representationsthat that are not revealed by their classification power alone1.
1.1 Related WorkVisualizing deep visual representations. Though CNN modelsare often said to be black boxes, their behavior can be visualizedat the local individual unit level by sampling image patches thatmaximize activation of hidden individual units [1], [8], [9], or theglobal feature space level by using variants of backpropagationto identify or generate salient image features [10], [11]. Back-propagation together with a natural image prior can be used to inverta CNN layer activation [12], and an image generation network canbe trained to invert the deep features by synthesizing the inputimages [13]. [14] further synthesizes the prototypical images forindividual units by learning a feature code for the image generation
1. Code, data, and more dissection results are available at the project pagehttp://netdissect.csail.mit.edu/.
arX
iv:1
711.
0561
1v2
[cs
.CV
] 2
6 Ju
n 20
18
2
network from [13].These visualizations reveal the visual patternsthat have been learned and provide a qualitative guide to unitinterpretation. In [1], human evaluation of visualizations is usedto determine which individual units behave as object detectors ina network trained to classify scenes. However, human evaluationis not scalable to increasingly large networks such as ResNet[15]. Here, we introduce a scalable method to go from qualitativevisualization to quantitative interpretation of large networks.
Analyzing the properties of deep visual representations.Much work has studied the power of CNN layer activations asgeneric visual features for classification [16], [17]. While transfer-ability of layer activations has been explored, higher layer unitsremain most often specialized to the target task [18]. Susceptibilityto adversarial input has shown that discriminative CNN modelsare fooled by particular visual patterns [19], [20]. Analysis ofcorrelation between different random initialized networks revealsthat many units converge to the same set of representations aftertraining [21]. The question of how representations generalize hasbeen investigated by showing that a CNN can easily fit a randomlabeling of training data even under explicit regularization [22].
Unsupervised learning of deep visual representations. Un-supervised learning or self-supervised learning works exploit thecorrespondence structure that comes for free from unlabeled imagesto train networks from scratch [23], [24], [25], [26], [27]. Forexample, a CNN is trained by predicting image context [23],by colorizing gray images [28], [29], by solving image puzzle[24], and by associating the images with ambient sounds [30].The resulting deep visual representations learned from differentunsupervised learning tasks are compared by evaluating them togeneric visual features on classification datasets such as PascalVOC. Here, we provide an alternative approach to compare deepvisual representations in terms of their interpretability, beyond theirdiscriminative power.
2 FRAMEWORK OF NETWORK DISSECTION
The notion of a disentangled representation rests on humanperception of what it means for a concept to be mixed up. Thus,we define the interpretability of deep visual representation asthe degree of alignment with human-interpretable concepts. Ourquantitative measurement of interpretability proceeds in three steps:
1) Identify a broad set of human-labeled visual concepts.2) Gather the response of the hidden variables to known concepts.3) Quantify alignment of hidden variable−concept pairs.
This three-step process of network dissection is reminiscent ofneuroscientists’ method to characterize biological neurons [31].Since our purpose is to measure the level to which a representationis disentangled, we focus on quantifying the correspondencebetween a single latent variable and a visual concept.
In a fully interpretable local coding such as a one-hot-encoding,each variable will match with one human-interpretable concept.Although we expect a network to learn partially nonlocal repre-sentations in interior layers [4], as past experience shows thatan emergent concept will often align with a combination of aseveral hidden units [2], [17], our aim is to assess how well arepresentation is disentangled. Therefore we measure the alignmentbetween single units and single interpretable concepts. This doesnot gauge the discriminative power of the representation; ratherit quantifies its disentangled interpretability. As we will show inSec. 3.2, it is possible for two representations of perfectly equivalentdiscriminative power to have different levels of interpretability.
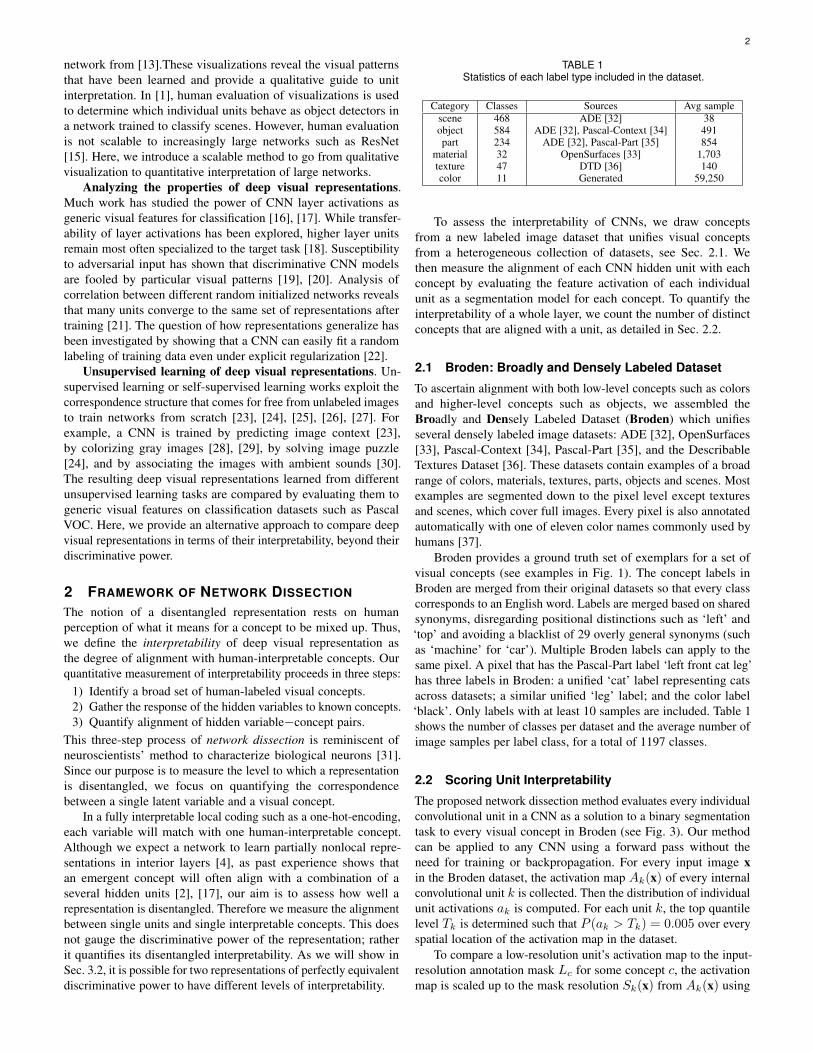
TABLE 1Statistics of each label type included in the dataset.
Category Classes Sources Avg samplescene 468 ADE [32] 38object 584 ADE [32], Pascal-Context [34] 491part 234 ADE [32], Pascal-Part [35] 854
material 32 OpenSurfaces [33] 1,703texture 47 DTD [36] 140color 11 Generated 59,250
To assess the interpretability of CNNs, we draw conceptsfrom a new labeled image dataset that unifies visual conceptsfrom a heterogeneous collection of datasets, see Sec. 2.1. Wethen measure the alignment of each CNN hidden unit with eachconcept by evaluating the feature activation of each individualunit as a segmentation model for each concept. To quantify theinterpretability of a whole layer, we count the number of distinctconcepts that are aligned with a unit, as detailed in Sec. 2.2.
2.1 Broden: Broadly and Densely Labeled Dataset
To ascertain alignment with both low-level concepts such as colorsand higher-level concepts such as objects, we assembled theBroadly and Densely Labeled Dataset (Broden) which unifiesseveral densely labeled image datasets: ADE [32], OpenSurfaces[33], Pascal-Context [34], Pascal-Part [35], and the DescribableTextures Dataset [36]. These datasets contain examples of a broadrange of colors, materials, textures, parts, objects and scenes. Mostexamples are segmented down to the pixel level except texturesand scenes, which cover full images. Every pixel is also annotatedautomatically with one of eleven color names commonly used byhumans [37].
Broden provides a ground truth set of exemplars for a set ofvisual concepts (see examples in Fig. 1). The concept labels inBroden are merged from their original datasets so that every classcorresponds to an English word. Labels are merged based on sharedsynonyms, disregarding positional distinctions such as ‘left’ and‘top’ and avoiding a blacklist of 29 overly general synonyms (suchas ‘machine’ for ‘car’). Multiple Broden labels can apply to thesame pixel. A pixel that has the Pascal-Part label ‘left front cat leg’has three labels in Broden: a unified ‘cat’ label representing catsacross datasets; a similar unified ‘leg’ label; and the color label‘black’. Only labels with at least 10 samples are included. Table 1shows the number of classes per dataset and the average number ofimage samples per label class, for a total of 1197 classes.
2.2 Scoring Unit Interpretability
The proposed network dissection method evaluates every individualconvolutional unit in a CNN as a solution to a binary segmentationtask to every visual concept in Broden (see Fig. 3). Our methodcan be applied to any CNN using a forward pass without theneed for training or backpropagation. For every input image xin the Broden dataset, the activation map Ak(x) of every internalconvolutional unit k is collected. Then the distribution of individualunit activations ak is computed. For each unit k, the top quantilelevel Tk is determined such that P (ak > Tk) = 0.005 over everyspatial location of the activation map in the dataset.
To compare a low-resolution unit’s activation map to the input-resolution annotation mask Lc for some concept c, the activationmap is scaled up to the mask resolution Sk(x) from Ak(x) using

3
red (color)
yellow (color)
wrinkled (texture)
meshed (texture)
wood (material)
fabric (material)
foot (part)
door (part)
airplane (object)
waterfall (object)
art studio (scene)
beach (scene)
Fig. 1. Samples from the Broden Dataset. The ground truth for each concept is a pixel-wise dense annotation.
Topactivatedimages
Segmentedimagesusingthebinarized unitactivationmap
Semanticsegmentationannotations
Segmentedannotations
Fig. 2. Scoring unit interpretability by evaluating the unit for semanticsegmentation.
bilinear interpolation, anchoring interpolants at the center of eachunit’s receptive field.
Sk(x) is then thresholded into a binary segmentation:Mk(x) ≡Sk(x) ≥ Tk, selecting all regions for which the activation exceedsthe threshold Tk. These segmentations are evaluated against everyconcept c in the dataset by computing intersections Mk(x)∩Lc(x),for every (k, c) pair.
The score of each unit k as segmentation for concept c isreported as a the Intersection over Union score (IoU) across all theimages in the dataset,
IoUk,c =
∑|Mk(x) ∩ Lc(x)|∑|Mk(x) ∪ Lc(x)|
, (1)
where | · | is the cardinality of a set. Because the dataset containssome types of labels which are not present on some subsets ofinputs, the sums are computed only on the subset of images thathave at least one labeled concept of the same category as c. Thevalue of IoUk,c is the accuracy of unit k in detecting conceptc; we consider one unit k as a detector for concept c if IoUk,cexceeds a threshold (> 0.04). Our qualitative results are insensitiveto the IoU threshold: different thresholds denote different numbersof units as concept detectors across all the networks but relativeorderings remain stable. Given that one unit might be the detectorfor multiple concepts, here we choose the top ranked label. Toquantify the interpretability of a layer, we count the number ofunique concepts aligned with units, i.e. unique detectors.
Figure 2 summarizes the whole process of scoring unitinterpretability: By segmenting the annotation mask using thereceptive field of units for the top activated images, we computethe IoU for each concept. Importantly, the IoU which evaluates thequality of the segmentation of a unit is an objective confidence scorefor interpretability that is comparable across networks, enabling us
TABLE 2Collection of tested CNN Models
Training Network dataset or tasknone AlexNet random
Supervised
AlexNet ImageNet, Places205, Places365, Hybrid.GoogLeNet ImageNet, Places205, Places365.
VGG-16 ImageNet, Places205, Places365, Hybrid.ResNet-152 ImageNet, Places365.
DenseNet-161 ImageNet, Places365.
Self AlexNet
context, puzzle, egomotion,tracking, moving, videoorder,audio, crosschannel,colorization.objectcentric, transinv.
to compare interpretability of different representations and so laysthe basis for the experiments below. Note that network dissectionresults depends on the underlying vocabulary: if a unit matches ahuman-understandable concept that is absent from Broden, that unitwill not score well for interpretability. Future versions of Brodenwill include a larger vocabulary of visual concepts.
3 EXPERIMENTS OF INTERPRETING DEEP VISUALREPRESENTATIONS
In this section, we conduct a series of experiments to interpret theinternal representations of deep visual representations. In Sec.3.1,we validate our method using human evaluation. In Sec.3.2 weuse random unitary rotations of a learned representation to testwhether interpretability of CNNs is an axis-independent property;we find that it is not, and we conclude that interpretability is notan inevitable result of the discriminative power of a representation.In Sec.3.3 we analyze all the convolutional layers of AlexNetas trained on ImageNet [38] and Places [39]. We confirm thatour method reveals detectors for higher-level semantic conceptsat higher layers and lower-level concepts at lower layers; andthat more detectors for higher-level concepts emerge under scenetraining. Then, we show that different network architectures suchas AlexNet, VGG, and ResNet yield different interpretability, anddifferently supervised training tasks and self-supervised trainingtasks also yield a variety of levels of interpretability in Sec.3.4.Additionally in Sec.3.5 we show the interpretability of modeltrained from captioning images. Another set of experimentsshows the impact of different training conditions in Sec.3.6and what happens during the transfer learning in Sec.3.7. Wefurther examine the relationship between discriminative powerand interpretability in Sec.3.9, and investigate a possible way toimprove the interpretability of CNNs by increasing their width inSec.3.8. Finally in Sec.3.10, we utilize the interpretable units asexplanatory factors to the prediction given by a CNN.
For testing we used CNN models with different architecturesand primary tasks (Table 2), including AlexNet [38], GoogLeNet

4
Input image Network being probed Pixel-wise segmentation
Freeze trained network weights
Conv
Conv
Conv
Conv
Conv
Upsample target layer
One Unit
Activation
Blu
e
Fabri
c
Door
Gra
ss
Pers
on
Evaluate on segmentation tasks
Car
Fig. 3. Illustration of network dissection for measuring semantic alignment of units in a given CNN. Here one unit of the last convolutional layer of agiven CNN is probed by evaluating its performance on various segmentation tasks. Our method can probe any convolutional layer.
[40], VGG [41], ResNet [15], and DenseNet [42]. For supervisedtraining, the models are trained from scratch (i.e., not pretrained)on ImageNet [43], Places205 [39], and Places365 [44]. ImageNetis an object-centric dataset, which contains 1.2 million imagesfrom 1000 object classes. Places205 (2.4 million images from 205scene classes) and Places365 (1.6 million images from 365 sceneclasses) are two subsets the scene-centric dataset Places.“Hybrid”network refers to a combination of ImageNet and Places365. Theself-supervised networks are introduced in Sec.3.4.
3.1 Human Evaluation of Interpretations
Using network dissection, we analyzed the interpretability ofunits within all the convolutional layers of Places-AlexNet andImageNet-AlexNet, then compared with human interpretation.Places-AlexNet is trained for scene classification on Places205[39], while ImageNet-AlexNet is the identical architecture trainedfor object classification on ImageNet [38].
Our evaluation was done by raters on Amazon MechanicalTurk (AMT). As a baseline, we used the descriptions from [1],where three independent raters wrote short phrases and gave aconfidence score, to describe the meaning of a unit, based on seeingthe top image patches for that unit. As a canonical description.we chose the most common description of a unit (when ratersagreed), and the highest-confidence description (when raters didnot agree). To identify non-interpretable units, raters were shownthe canonical descriptions of visualizations and asked whether thedescription was valid. Units with validated descriptions are takenas interpretable units. To compare these baseline descriptions tonetwork-dissection-derived labels, raters were shown a visualizationof top images patches for an interpretable unit, along with a wordor short phrase, and asked to vote (yes/no) whether the phrasewas descriptive of most of the patches. The baseline human-written descriptions were randomized with the labels from netdissection, and the origin of the labels was not revealed to theraters. Table 3 summarizes the results. The number of interpretableunits is shown for each layer and type of description. As expected,color and texture concepts dominate in the lower layers conv1 andconv2 while part, object and scene detectors are more frequentat conv4 and conv5. Average positive votes for descriptions ofinterpretable units are shown, both for human-written labels andnetwork-dissection-derived labels. Human labels are most highlyconsistent for units of conv5, suggesting that humans have notrouble identifying high-level visual concept detectors, while lower-level detectors, particularly textures, are more difficult to label.
Fig. 4. The annotation interface used by human raters on AmazonMechanical Turk. Raters are shown descriptive text in quotes togetherwith fifteen images, each with highlighted patches, and must evaluatewhether the quoted text is a good description for the highlighted patches.
Similarly, labels given by network dissection are best at conv5and for high-level concepts, and are found to be less descriptivefor lower layers and textures. In Fig. 5, a sample of units isshown together with both automatically inferred interpretations andmanually assigned interpretations taken from [1]. The predictedlabels match the human annotation well, though sometimes theycapture a different description of a concept, like the ‘crosswalk’predicted by the algorithm compared to ‘horizontal lines’ given byhuman for the third unit in conv4 of Places-AlexNet in Fig. 5.
3.2 Measurement of Axis-aligned Interpretability
Two hypotheses can explain the emergence of interpretability inindividual hidden layer units:
Hypothesis 1. Interpretability is a property of the representationas a whole, and individual interpretable units emerge becauseinterpretability is a generic property of typical directions ofrepresentational space. Under this hypothesis, projecting toany direction would typically reveal an interpretable concept,and interpretations of single units in the natural basis wouldnot be more meaningful than interpretations that can be foundin any other direction.
Hypothesis 2. Interpretable alignments are unusual, and inter-pretable units emerge because learning converges to a specialbasis that aligns explanatory factors with individual units.

5
Pla
ces
veined (texture) h:green
orange (color) h:color yellow
red (color) h:pink or red
sky (object) h:sky
lacelike (texture) h:black&white
lined (texture) h:grid pattern
grass (object) h:grass
banded (texture) h:corrugated
perforated (texture) h:pattern
chequered (texture) h:windows
tree (object) h:tree
crosswalk (part) h:horiz. lines
bed (object) h:bed
car (object) h:car
mountain (scene) h:montain
Imag
eNet
red (color) h:red
yellow (color) h:yellow
sky (object) h:blue
woven (texture) h:yellow
banded (texture) h:striped
grid (texture) h:mesh
food (material) h:orange
sky (object) h:blue sky
dotted (texture) h:nosed
muzzle (part) h:animal face
swirly (texture) h:round
head (part) h:face
wheel (part) h:wheels
cat (object) h:animal faces
leg (part) h:leg
conv1 conv2 conv3 conv4 conv5
1
Fig. 5. Comparison of the interpretability of the convolutional layers of AlexNet, trained on classification tasks for Places (top) and ImageNet(bottom).Four units in each layer are shown with their semantics. The segmentation generated by each unit is shown on the three Broden imageswith highest activation. Top-scoring labels are shown above to the left, and human-annotated labels are shown above to the right. There is somedisagreement: for example, raters mark the first conv4 unit on Places as a ‘windows’ detector, while the algorithm matches the ‘chequered’ texture.
TABLE 3Human evaluation of our Network Dissection approach.
conv1 conv2 conv3 conv4 conv5Interpretable units 57/96 126/256 247/384 258/384 194/256color units 36 45 44 19 12texture units 19 53 64 72 23material units 0 2 2 9 8part units 0 0 13 17 16object units 2 22 109 127 114scene units 0 4 15 14 21Human consistency 82% 76% 83% 82% 91%on color units 92% 80% 82% 84% 100%on texture units 68% 81% 83% 81% 96%on material units n/a 50% 100% 78% 100%on part units n/a n/a 92% 94% 88%on object units 50% 68% 84% 83% 90%on scene units n/a 25% 67% 71% 81%Network Dissection 37% 56% 54% 59% 71%on color units 44% 53% 55% 42% 67%on texture units 26% 58% 42% 54% 39%on material units n/a 50% 50% 89% 75%on part units n/a n/a 85% 71% 75%on object units 0% 59% 57% 65% 75%on scene units n/a 50% 53% 29% 86%
In this model, the natural basis represents a meaningfuldecomposition learned by the network.
Hypothesis 1 is the default assumption: in the past it has beenfound [19] that with respect to interpretability “there is nodistinction between individual high level units and random linearcombinations of high level units.” Network dissection allows usto re-evaluate this hypothesis. Thus, we conduct an experimentto determine whether it is meaningful to assign an interpretableconcept to an individual unit. We apply random changes in basis to arepresentation learned by AlexNet. Under hypothesis 1, the overalllevel of interpretability should not be affected by a change in basis,even as rotations cause the specific set of represented concepts tochange. Under hypothesis 2, the overall level of interpretability isexpected to drop under a change in basis.
We begin with the representation of the 256 convolutional units
baseline rotate 0.2 rotate 0.4 rotate 0.6 rotate 0.8 rotate 10
10
20
30
40
Nu
mb
er
of
un
iqu
e d
ete
cto
rs
Rotation of Representation
object
scene
part
material
texture
color
Fig. 6. Interpretability over changes in basis of the representation ofAlexNet conv5 trained on Places. The vertical axis shows the numberof unique interpretable concepts that match a unit in the representation.The horizontal axis shows α, which quantifies the degree of rotation.
of AlexNet conv5 trained on Places205 and examine the effect of achange in basis. To avoid any issues of conditioning or degeneracy,we change basis using a random orthogonal transformation Q.The rotation Q is drawn uniformly from SO(256) by applyingGram-Schmidt on a normally-distributed QR = A ∈ R2562
with positive-diagonal right-triangular R, as described by [45].Interpretability is summarized as the number of unique visualconcepts aligned with units, as defined in Sec. 2.2.
Denoting AlexNet conv5 as f(x), we found that the number ofunique detectors in Qf(x) is 80% fewer than the number of uniquedetectors in f(x). Our finding is inconsistent with hypothesis 1and consistent with hypothesis 2.
We also tested smaller perturbations of basis using Qα for 0 ≤α ≤ 1, where the fractional powers Qα ∈ SO(256) are chosento form a minimal geodesic gradually rotating from I to Q; theseintermediate rotations are computed using a Schur decomposition.Fig. 6 shows that interpretability of Qαf(x) decreases as largerrotations are applied. Fig. 7 shows some examples of the linearlycombined units.
Each rotated representation has the same discriminative poweras the original layer. Writing the original network as g(f(x)),note that g′(r) ≡ g(QT r) defines a neural network that processes

6
Baseline (individual units) Rotate 1 (linear combinations)car (single unit 87) IoU 0.16
car (combination, closest to unit 173) IoU 0.06
skyscraper (single unit 94) IoU 0.16
skyscraper (combination, closest to unit 94) IoU 0.05
tree (single unit 228) IoU 0.10
tree (combination, closest to unit 228) IoU 0.02
head (single unit 3) IoU 0.09
head (combination, closest to unit 70) IoU 0.02
closet (single unit 107) IoU 0.06
closet (combination, closest to unit 34) IoU 0.02
Fig. 7. Visualizations of the best single-unit concept detectors of fiveconcepts taken from individual units of AlexNet conv5 trained on Places(left), compared with the best linear-combination detectors of the sameconcepts taken from the same representation under a random rotation(right). For most concepts, both the IoU and the visualization of the topactivating image patches confirm that individual units match conceptsbetter than linear combinations. In other cases, (e.g. head detectors)visualization of a linear combination appears highly consistent, but theIoU reveals lower consistency when evaluated over the whole dataset.
baseline random combination0
10
20
30
40
Nu
mb
er
of
un
iqu
e d
ete
cto
rs
AlexNet on Places365
object
scene
part
material
texture
color
baseline random combination0
5
10
15
20
25
Nu
mb
er
of
un
iqu
e d
ete
cto
rs
AlexNet on ImageNet
object
scene
part
material
texture
color
Fig. 8. Complete rotation (α = 1) repeated on AlexNet trained onPlaces365 and ImageNet respectively. Rotation reduces the interpretabil-ity significantly for both of the networks.
the rotated representation r = Qf(x) exactly as the original goperates on f(x). Furthermore, we verify that a network canlearn to solve a task given a rotated representation. Startingwith AlexNet trained to solve places365, we freeze the bottomlayers up to pool5 and retrain the top layers of the networkunder two conditions: one in which the representation at pool5is randomly rotated (α = 1) before passing to fc6, and theother where the representation up to pool5 is left unchanged.Then we reinitialize and retrain the fc6-fc8 layers of an AlexNeton places365. Under both the unrotated and rotated conditions,reinitializing and retraining the top layers improves performance,and the improvement is similar regardless of whether the pool5representation is rotated. Initial accuracy is 50.3%. After retrainingthe unrotated representation, accuracy improves to 51.9%; afterretraining the rotated representation, accuracy is 51.7%. Thus thenetwork learns to solve the task even when the representation israndomly rotated. Since a network can be transformed into anequivalent network with the same discriminative ability but withlower interpretability, we conclude that interpretability must bemeasured separately from discrimination ability.
We repeated the measurement of interpretability upon completerotation (α = 1) on Places365 and ImageNet 10 times; see resultsin Fig. 8. There is a drop of interpretability for both. Alexnet onPlaces365 drops more, which can be explained due to that networkstarting with a higher number of interpretable units.
3.3 Network Architectures with Supervised LearningHow do different network architectures affect disentangled in-terpretability of the learned representations? For simplicity, the
Res
Net
152-
Place
s365
Den
seNet
161-
Place
s365
Res
Net
152-
Imag
eNet
Den
seNet
161-
Imag
eNet
VGG-P
lace
s205
VGG-H
ybrid
VGG-P
lace
s365
Goo
gLeN
et-P
lace
s365
Goo
gLeN
et-P
lace
s205
Goo
gLeN
et-Im
ageN
et
VGG-Im
ageN
et
AlexN
et-P
lace
s365
AlexN
et-H
ybrid
AlexN
et-P
lace
s205
AlexN
et-Im
ageN
et
AlexN
et-ra
ndom
0
100
200
300
Nu
mb
er
of
un
iqu
e d
ete
cto
rs
object
scene
part
material
texture
color
Res
Net
152-
Place
s365
Den
seNet
161-
Place
s365
Res
Net
152-
Imag
eNet
Den
seNet
161-
Imag
eNet
VGG-P
lace
s205
VGG-H
ybrid
VGG-P
lace
s365
Goo
gLeN
et-P
lace
s365
Goo
gLeN
et-P
lace
s205
Goo
gLeN
et-Im
ageN
et
VGG-Im
ageN
et
AlexN
et-P
lace
s365
AlexN
et-H
ybrid
AlexN
et-P
lace
s205
AlexN
et-Im
ageN
et
AlexN
et-ra
ndom
0
0.1
0.2
0.3
0.4
0.5
Ra
tio
of
un
iqu
e d
ete
cto
rs
Fig. 9. Interpretability across different architectures trained on ImageNetand Places. Plot above shows the number of unique detectors, plot belowshows the ratio of unique detectors (number of unique detectors dividedby the total number of units).
0 10 20 30 40
Number of detectors
0.04
0.05
0.06
0.07
0.08
0.09
0.1
0.11
0.12
0.13
Ave
rag
e I
oU
Resnet-152 on Places, COV=0.086
bus
waterfall horse
bottlestove
toiletsink
bicyclewaterplant
bird grassskyscraper
fieldhousebook sofa
pottedplantshelfroad tree
sheep buildingtvmonitor sky
chairflower
dog
cat
motorbikeairplane
traincarstairway
seatent boat
bed
mountaintrack
0 20 40 60 80 100
Number of detectors
0.04
0.05
0.06
0.07
0.08
0.09
0.1
0.11
0.12
0.13
0.14
Ave
rag
e I
oU
Resnet-152 on ImageNet, COV=0.084
bookcase
motorbiketrain
bicyclemountain
road catsea
carwatertvmonitor
airplanesnow bus
toiletcowgrasspool tablechairrock
bottle horsebedsidewalk
flowerbookplantfield
sheep bird dogtreepottedplant
tentwasher personsignboard
seat
windowpanelampwardrobe
Fig. 10. Average IoU versus the number of detectors for the object classin Resnet152 trained on Places and ImageNet respectively. For a set ofunits detecting the same object class, we average their IoU.
following experiments focus on the last convolutional layer of eachCNN, where semantic detectors emerge most.
Results showing the number of unique detectors that emergefrom various network architectures trained on ImageNet and Places,, and the ratio of unique detectors (the number of unique detectorsnormalized by the total number of units at that layer) are plotted inFig. 9. Interpretability in terms of the number of unique detectors,can be compared as follows: ResNet > DenseNet > VGG >GoogLeNet > AlexNet. Deeper architectures seem to have greaterinterpretability, though individual layer structure is different acrossarchitectures. Comparing training datasets, we find Places >ImageNet. As discussed in [1], scenes are composed of multipleobjects, with more object detectors emerging in CNNs trainedto recognize places. In terms of ratio of unique detectors, VGGarchitecture is highest. We consider the number of unique detectorsas the metric of interpretability for a network as it better measuresthe diversity and coverage of emergent interpretable concepts.
Fig. 10 shows the plot of average IoU versus the number of
7
Closet Dog Plant Bus AirplaneDe
nseN
et-1
61layer161 unit 1639 IoU=0.225 layer161 unit 2035 IoU=0.199 layer161 unit 1126 IoU=0.076 layer161 unit 1492 IoU=0.282 layer161 unit 1518 IoU=0.205
layer161 unit 1788 IoU=0.201 layer161 unit 2028 IoU=0.113 layer161 unit 1356 IoU=0.067 layer161 unit 1519 IoU=0.155 layer161 unit 1512 IoU=0.125
ResN
et-1
52
res5c unit 2011 IoU=0.171 res5c unit 1573 IoU=0.217 res5c unit 264 IoU=0.125 res5c unit 674 IoU=0.265 res5c unit 1243 IoU=0.172
res5c unit 9 IoU=0.161 res5c unit 1718 IoU=0.195 res5c unit 766 IoU=0.094 res5c unit 74 IoU=0.256 res5c unit 963 IoU=0.156
Goog
LeNe
t
inception_5b unit 758 IoU=0.159 inception_4e unit 750 IoU=0.203 inception_4e unit 56 IoU=0.139 inception_4e unit 824 IoU=0.168 inception_4e unit 92 IoU=0.164
inception_5b unit 235 IoU=0.136 inception_4e unit 225 IoU=0.152 inception_4e unit 714 IoU=0.105 inception_5b unit 603 IoU=0.154 inception_4e unit 759 IoU=0.144
VGG-
16
conv5_3 unit 213 IoU=0.125 conv5_3 unit 142 IoU=0.205 conv5_3 unit 85 IoU=0.086 conv5_3 unit 191 IoU=0.153 conv5_3 unit 151 IoU=0.150
conv5_3 unit 107 IoU=0.065 conv5_3 unit 491 IoU=0.112 conv4_3 unit 336 IoU=0.068 conv5_3 unit 20 IoU=0.149 conv5_3 unit 204 IoU=0.077
Alex
Net
conv5 unit 235 IoU=0.017 conv5 unit 180 IoU=0.090 conv5 unit 55 IoU=0.087 conv5 unit 10 IoU=0.040 conv5 unit 13 IoU=0.101
conv3 unit 255 IoU=0.015 conv5 unit 250 IoU=0.051 conv5 unit 16 IoU=0.062 conv5 unit 174 IoU=0.029 conv5 unit 28 IoU=0.049
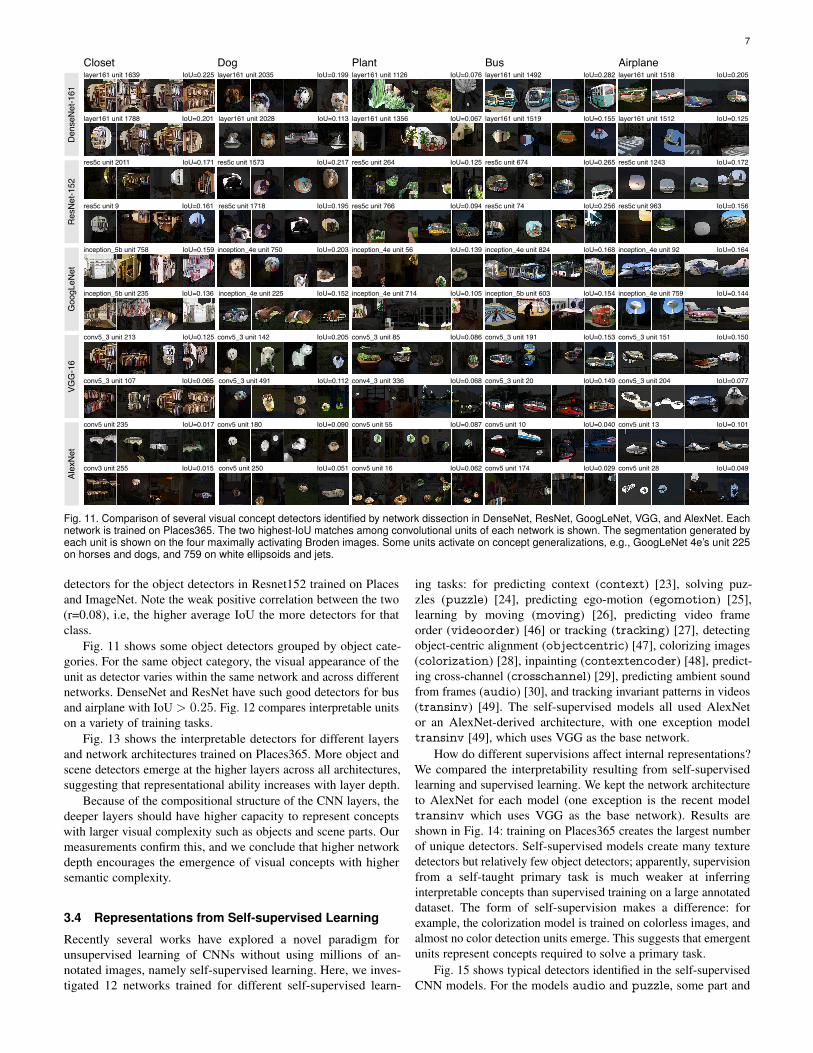
Fig. 11. Comparison of several visual concept detectors identified by network dissection in DenseNet, ResNet, GoogLeNet, VGG, and AlexNet. Eachnetwork is trained on Places365. The two highest-IoU matches among convolutional units of each network is shown. The segmentation generated byeach unit is shown on the four maximally activating Broden images. Some units activate on concept generalizations, e.g., GoogLeNet 4e’s unit 225on horses and dogs, and 759 on white ellipsoids and jets.
detectors for the object detectors in Resnet152 trained on Placesand ImageNet. Note the weak positive correlation between the two(r=0.08), i.e, the higher average IoU the more detectors for thatclass.
Fig. 11 shows some object detectors grouped by object cate-gories. For the same object category, the visual appearance of theunit as detector varies within the same network and across differentnetworks. DenseNet and ResNet have such good detectors for busand airplane with IoU > 0.25. Fig. 12 compares interpretable unitson a variety of training tasks.
Fig. 13 shows the interpretable detectors for different layersand network architectures trained on Places365. More object andscene detectors emerge at the higher layers across all architectures,suggesting that representational ability increases with layer depth.
Because of the compositional structure of the CNN layers, thedeeper layers should have higher capacity to represent conceptswith larger visual complexity such as objects and scene parts. Ourmeasurements confirm this, and we conclude that higher networkdepth encourages the emergence of visual concepts with highersemantic complexity.
3.4 Representations from Self-supervised Learning
Recently several works have explored a novel paradigm forunsupervised learning of CNNs without using millions of an-notated images, namely self-supervised learning. Here, we inves-tigated 12 networks trained for different self-supervised learn-
ing tasks: for predicting context (context) [23], solving puz-zles (puzzle) [24], predicting ego-motion (egomotion) [25],learning by moving (moving) [26], predicting video frameorder (videoorder) [46] or tracking (tracking) [27], detectingobject-centric alignment (objectcentric) [47], colorizing images(colorization) [28], inpainting (contextencoder) [48], predict-ing cross-channel (crosschannel) [29], predicting ambient soundfrom frames (audio) [30], and tracking invariant patterns in videos(transinv) [49]. The self-supervised models all used AlexNetor an AlexNet-derived architecture, with one exception modeltransinv [49], which uses VGG as the base network.
How do different supervisions affect internal representations?We compared the interpretability resulting from self-supervisedlearning and supervised learning. We kept the network architectureto AlexNet for each model (one exception is the recent modeltransinv which uses VGG as the base network). Results areshown in Fig. 14: training on Places365 creates the largest numberof unique detectors. Self-supervised models create many texturedetectors but relatively few object detectors; apparently, supervisionfrom a self-taught primary task is much weaker at inferringinterpretable concepts than supervised training on a large annotateddataset. The form of self-supervision makes a difference: forexample, the colorization model is trained on colorless images, andalmost no color detection units emerge. This suggests that emergentunits represent concepts required to solve a primary task.
Fig. 15 shows typical detectors identified in the self-supervisedCNN models. For the models audio and puzzle, some part and
8
25
0 3 6units
watergrass
treecar
plantwindowpane
roadmountainairplane
skyscraperdogsea
ceilingbuildingperson
horsebed
trackbook
pool tablecabinet
chairpaintingwaterfallsidewalk
sinkshelf
skyhousestovefloorbus
mountain snowyball pitpantry
building facadeskyscraper
streethair
wheelhead
screencrosswalk
shop windowfood
woodlined
dottedbandedstudded
gridhoneycombed
paisleyzigzagged
waffledmeshedcrackedstratified
chequeredperforated
sprinkledpotholedgroovedpleatedmatted
freckledswirly
spiralledwovenfibrous
cobwebbedred
72
32 objec
6 scen
6 pa
2 materia
textur1 co
Alexnet (Places)
ts
es
rts
ls
eslor
p
sk
wor
win
si
c
skmountai
swimming poolstadium-
a
conferenjacuz
hec
seat
shop
chp
polkco
hone
i
0 5 10units
cargrass
airplanemountain
paintingtree
ceilingdogbus
roadool table
waterhorse
yscraperplant
motorbikecat
bedsea
tracksinkfield
stairwayshelf
k surfacebuilding
housewaterfall
groundsidewalk
bookchair
skydowpane
floortoilet
personrailing
washergnboard
tableflower
handelierbird
ball pityscrapern snowy
closet-outdoorbaseball
coastcorridor
uditoriumcreek
highwayce roomzi-indoor
hairhead
screenwheel
roofadboardrosswalk cushion
drawerleg
armbody
windowfood
equerederforated
stripedgrid
spiralleddottedswirlylined
meshedstuddedpaisleybanded
a-dottedbwebbedgroovedstratified
porousycombed
wovennterlaced
red
92
44 objects
13 scenes
13 parts1 material
20 textures1 color
AlexNet-GAPWide (Places)
0 4 8units
dogcat
grasstree
bicycleseasky
waterroad
carpainting
windowpanemountainmotorbike
booksidewalk
busmountain snowy
wheelhair
headear
muzzlearmleg
screenfood
zigzaggeddotted
chequeredbanded
cobwebbedwaffled
perforatedstriped
polka-dottedfrilly
spiralledstudded
honeycombedgrid
meshedsprinkled
veinedporous
crackedinterlaced
crosshatchedred
yellow
50
17 objects1 scene
8 parts1 material
21 textures
2 colors
Alexnet (Imagenet)
0 10 20units
grassroadsky
watertreedog
ball pitforest-broadleafmountain snowybuilding facade
highwaychequered
linedbandedporouslacelikeveined
gridfrilly
fleckedperforated
crackedstratifiedpotholedfreckledstudded
wovenpolka-dotted
purpleorange
redyellow
bluepink
green
35
6 objects
5 scenes
17 textures
7 colors
Alexnet (Video Tracking)
0 5 9units
cartree
grasssea
mountainhighway
headhair
bandedlined
chequeredstudded
zigzaggedstriped
perforatedflecked
gridcrackedmeshed
gauzydotted
21
5 objects1 scene2 parts
13 textures
Alexnet (Ambient Sound)
0 6 12units
skyceilinggrass
treeforest-broadleaf
headbanded
lineddotted
perforatedgrid
chequeredcrosshatched
spiralled
14
4 objects1 scene
1 part
8 textures
Alexnet (Puzzle Solving)
0 5 9units
skyball pitveined
chequeredmeshed
stripeddotted
perforatedstuddedlacelike
frillycobwebbed
red
13
1 object1 scene
10 textures1 color
Alexnet (Egomotion)
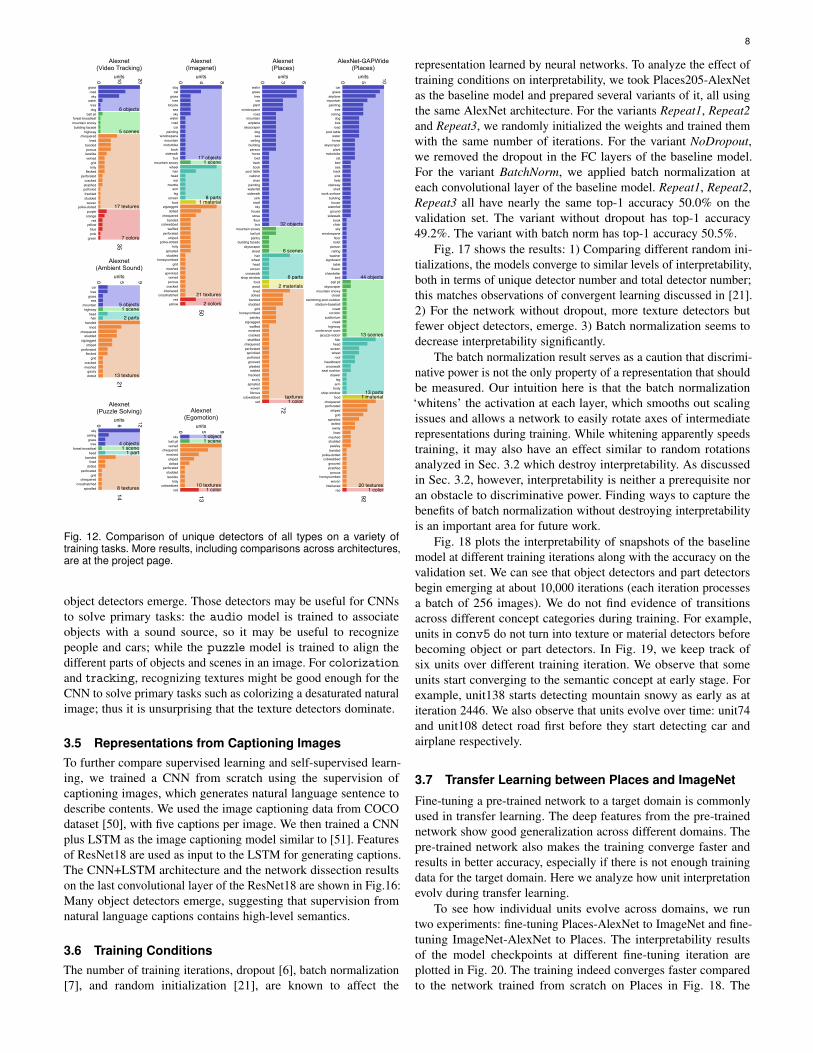
Fig. 12. Comparison of unique detectors of all types on a variety oftraining tasks. More results, including comparisons across architectures,are at the project page.
object detectors emerge. Those detectors may be useful for CNNsto solve primary tasks: the audio model is trained to associateobjects with a sound source, so it may be useful to recognizepeople and cars; while the puzzle model is trained to align thedifferent parts of objects and scenes in an image. For colorizationand tracking, recognizing textures might be good enough for theCNN to solve primary tasks such as colorizing a desaturated naturalimage; thus it is unsurprising that the texture detectors dominate.
3.5 Representations from Captioning ImagesTo further compare supervised learning and self-supervised learn-ing, we trained a CNN from scratch using the supervision ofcaptioning images, which generates natural language sentence todescribe contents. We used the image captioning data from COCOdataset [50], with five captions per image. We then trained a CNNplus LSTM as the image captioning model similar to [51]. Featuresof ResNet18 are used as input to the LSTM for generating captions.The CNN+LSTM architecture and the network dissection resultson the last convolutional layer of the ResNet18 are shown in Fig.16:Many object detectors emerge, suggesting that supervision fromnatural language captions contains high-level semantics.
3.6 Training ConditionsThe number of training iterations, dropout [6], batch normalization[7], and random initialization [21], are known to affect the
representation learned by neural networks. To analyze the effect oftraining conditions on interpretability, we took Places205-AlexNetas the baseline model and prepared several variants of it, all usingthe same AlexNet architecture. For the variants Repeat1, Repeat2and Repeat3, we randomly initialized the weights and trained themwith the same number of iterations. For the variant NoDropout,we removed the dropout in the FC layers of the baseline model.For the variant BatchNorm, we applied batch normalization ateach convolutional layer of the baseline model. Repeat1, Repeat2,Repeat3 all have nearly the same top-1 accuracy 50.0% on thevalidation set. The variant without dropout has top-1 accuracy49.2%. The variant with batch norm has top-1 accuracy 50.5%.
Fig. 17 shows the results: 1) Comparing different random ini-tializations, the models converge to similar levels of interpretability,both in terms of unique detector number and total detector number;this matches observations of convergent learning discussed in [21].2) For the network without dropout, more texture detectors butfewer object detectors, emerge. 3) Batch normalization seems todecrease interpretability significantly.
The batch normalization result serves as a caution that discrimi-native power is not the only property of a representation that shouldbe measured. Our intuition here is that the batch normalization‘whitens’ the activation at each layer, which smooths out scalingissues and allows a network to easily rotate axes of intermediaterepresentations during training. While whitening apparently speedstraining, it may also have an effect similar to random rotationsanalyzed in Sec. 3.2 which destroy interpretability. As discussedin Sec. 3.2, however, interpretability is neither a prerequisite noran obstacle to discriminative power. Finding ways to capture thebenefits of batch normalization without destroying interpretabilityis an important area for future work.
Fig. 18 plots the interpretability of snapshots of the baselinemodel at different training iterations along with the accuracy on thevalidation set. We can see that object detectors and part detectorsbegin emerging at about 10,000 iterations (each iteration processesa batch of 256 images). We do not find evidence of transitionsacross different concept categories during training. For example,units in conv5 do not turn into texture or material detectors beforebecoming object or part detectors. In Fig. 19, we keep track ofsix units over different training iteration. We observe that someunits start converging to the semantic concept at early stage. Forexample, unit138 starts detecting mountain snowy as early as atiteration 2446. We also observe that units evolve over time: unit74and unit108 detect road first before they start detecting car andairplane respectively.
3.7 Transfer Learning between Places and ImageNet
Fine-tuning a pre-trained network to a target domain is commonlyused in transfer learning. The deep features from the pre-trainednetwork show good generalization across different domains. Thepre-trained network also makes the training converge faster andresults in better accuracy, especially if there is not enough trainingdata for the target domain. Here we analyze how unit interpretationevolv during transfer learning.
To see how individual units evolve across domains, we runtwo experiments: fine-tuning Places-AlexNet to ImageNet and fine-tuning ImageNet-AlexNet to Places. The interpretability resultsof the model checkpoints at different fine-tuning iteration areplotted in Fig. 20. The training indeed converges faster comparedto the network trained from scratch on Places in Fig. 18. The

9
conv1conv2
conv3conv4
conv5
0
10
20
30
40
Num
ber
of uniq
ue d
ete
cto
rs
AlexNet on Places365
object
scene
part
material
texture
color
conv1conv2
conv3conv4
conv5
0
0.05
0.1
0.15
0.2
Ratio o
f uniq
ue d
ete
cto
rs
AlexNet on Places365
object
scene
part
material
texture
color
conv3-3
conv4-3
conv5-1
conv5-2
conv5-3
0
20
40
60
80
Num
ber
of uniq
ue d
ete
cto
rs
VGG16 on Places365
object
scene
part
material
texture
color
conv3-3
conv4-3
conv5-1
conv5-2
conv5-3
0
0.05
0.1
0.15
Ratio o
f uniq
ue d
ete
cto
rs
VGG16 on Places365
object
scene
part
material
texture
color
conv1-7x7-s2
conv2-norm2
inception-3b
inception-4c
inception-4e
inception-5a
inception-5b
0
20
40
60
80
100
120
Num
ber
of uniq
ue d
ete
cto
rs
GoogLeNet on Places365
object
scene
part
material
texture
color
conv1-7x7-s2
conv2-norm2
inception-3b
inception-4c
inception-4e
inception-5a
inception-5b
0
0.05
0.1
0.15
Ratio o
f uniq
ue d
ete
cto
rs
GoogLeNet on Places365
object
scene
part
material
texture
color
BN-1
Eltwise-116
Eltwise-238
Eltwise-358
Eltwise-478
Eltwise-510
0
50
100
150
200
Num
ber
of uniq
ue d
ete
cto
rs
ResNet152 on Places365
object
scene
part
material
texture
color
BN-1
Eltwise-116
Eltwise-238
Eltwise-358
Eltwise-478
Eltwise-510
0
0.02
0.04
0.06
0.08
0.1
Ratio o
f uniq
ue d
ete
cto
rs
ResNet152 on Places365
object
scene
part
material
texture
color
Fig. 13. Comparison of interpretability of the layers for AlexNet, VGG16, GoogLeNet, and ResNet152 trained on Places365. All five conv layers ofAlexNet and the selected layers of VGG, GoogLeNet, and ResNet are included. Plot above shows the number of unique detectors and the plot belowshow the ratio of unique detectors.
AlexN
et-P
lace
s365
AlexN
et-Im
ageN
et
track
ing
objectce
ntric
trans
inv
audio
mov
ing
coloriz
ation
puzz
le
cros
scha
nnel
egom
otion
cont
ext
fram
eord
er
AlexN
et-ra
ndom
cont
exte
ncod
er0
20
40
60
80
100
Nu
mb
er
of
un
iqu
e d
ete
cto
rs object
scene
part
material
texture
color
Fig. 14. Semantic detectors emerge across different supervision of theprimary training task. All these models use the AlexNet architecture andare tested at conv5.
audio puzzle colorization trackingchequered (texture) 0.102 head (part) 0.091 dotted (texture) 0.140 chequered (texture) 0.167
car (object) 0.063 perforated (texture) 0.085 head (part) 0.056 grass (object) 0.120
head (part) 0.061 sky (object) 0.069 sky (object) 0.048 red-c (color) 0.100
Fig. 15. The top ranked concepts in the three top categories in four self-supervised networks. Some object and part detectors emerge in audio.Detectors for person heads also appear in puzzle and colorization. Avariety of texture concepts dominate models with self-supervised training.
interpretations of the units also change over fine-tuning. Forexample, the number of unique object detectors first drop thenkeep increasing for the network trained on ImageNet being fine-tuned to Places365, while it is slowly dropping for the networktrained on Places being fine-tuned to ImageNet.
Fig. 21 shows some examples of the individual unit evolutionhappening in the networks trained from ImageNet to Places365 andfrom Places365 to ImageNet, at the beginning and at the end offine-tuning. In the ImageNet to Places365 network, unit15 whichdetects white dogs initially, evolves to detect waterfall; unit136and unit144 which detect dogs first, evolve to detect horse and cowrespectively (note a lot of scene categories in Places like pastureand corral contain these animals). In the Places365 to ImageNet
Trainfrom
Scratch
COCOcaptioningdataset:
Fig. 16. Example images in the COCO captioning dataset, theCNN+LSTM image captioning model, and the network dissection result.Training ResNet18 from scratch using the supervision from captioningimages leads to a lot of emergent object detectors.
Number of detectors
base
line
repe
at1
repe
at2
repe
at3
NoD
ropo
ut
Batch
Nor
m
0
50
100
150
200object
scene
part
material
texture
color
Number of unique detectors
base
line
repe
at1
repe
at2
repe
at3
NoD
ropo
ut
Batch
Nor
m
0
20
40
60
80
100object
scene
part
material
texture
color
Fig. 17. Effect of regularizations on the interpretability of CNNs.
network, several units evolve to be dog detectors, given ImageNetdistribution of categories. While units evolve to detect differentconcepts, the before and after- concepts often share low-level imagesimilarity such as colors and textures.
The fine-tuned model achieves almost the same classificationaccuracy as the train-from-scratch model, but the training convergesfaster due to the feature reuse. For the ImageNet to Places network,139 out of 256 units (54.4%) at conv5 layer keep the same conceptsduring the finetuning, while for the network fine-tuned from Placesto ImageNet, 135 out of 256 units (52.7%) at conv5 stay have thesame concepts. We further categorized the unit evolution into fivetypes based on the similarity between the concepts before and after

10
100
102
104
106
0
10
20
30
40N
um
ber
of uniq
ue d
ete
cto
rs
AlexNet on Places205
object
scene
part
material
texture
color
100
102
104
106
Training iteration
0
0.2
0.4
0.6
Valid
ation a
ccura
cy
Fig. 18. The evolution of the interpretability of conv5 of Places205-AlexNet over 3,000,000 training iterations. The accuracy on the validationat each iteration is also plotted. The baseline model is trained to 300,000iterations (marked at the red line).
fine-tuning. Out of the 117 units which evolved in the networkfine-tuned from Imagenet to Places, 47 units keep a similar typeof shape, 31 units have a similar texture, 18 units have similarcolors, 13 units have a similar type of object, and 8 units do nothave a clear pattern of similarities (see Fig.22). Fig. 23 illustratesthe evolution history for two units of each model. Units seem toswitch their top ranked label times before converging to a concept:unit15 in the fine-tuning of ImageNet to Places365 flipped to white,crystalline, before stabilizing to a waterfall concept. Other unitsare switching faster: unit132 in the fine-tuning of Places365 toImageNet goes from hair to dog at an early stage of fine-tuning.
3.8 Layer Width vs. InterpretabilityFrom AlexNet to ResNet, CNNs have grown deeper in the questfor higher classification accuracy. Depth is important for highdiscrimination ability, and as shown in Sec. 3.3, interpretabilityincreases with depth. However, the role of the width of layers(the number of units per layer) has been less explored. Onereason is that increasing the number of convolutional units ina layer significantly increases computational cost while yieldingonly marginal classification accuracy improvements. Nevertheless,some recent work [52] suggests that a carefully designed wideresidual network can achieve classification accuracy superior to thecommonly used thin and deep counterparts.
To test how width affects emergence of interpretable detectors,we removed the FC layers of AlexNet, then tripled the number ofunits at the conv5, i.e., from 256 to 768 units, as AlexNet-GAP-Wide. We further tripled the number of units for all the previousconv layers except conv1 for the standard AlexNet, as AlexNet-GAP-WideAll. Finally we put a global average pooling layer afterconv5 and fully connected the pooled 768-feature activationsto the final class prediction. After training on Places365, theAlexNet-GAP-Wide and the AlexNet-GAP-WideAll have similarclassification accuracy on the validation set as the standard AlexNet(∼ 0.5% top1 accuracy lower and higher): however many moreemergent unique concept detectors at conv5 are found for AlexNet-GAP-Wide and all the conv layers for AlexNet-GAL-WideAll (seeFig. 24). Increasing the number of units to 1024 and 2048 at conv5,
did not significantly increase the unique concepts. This may indicateeither a limit on the capacity of AlexNet to separate explanatoryfactors, or a limit on the number of disentangled concepts that arehelpful to solve the primary task of scene classification.
3.9 Discrimination vs. InterpretabilityActivations from the higher layers of pre-trained CNNs are oftenused as generic visual features (noted as deep features), generalizingwell to other image datasets [16], [39]. It is interesting to bridge thenotion of generic visual features with their interpretability. Herewe first benchmarked the deep features from several networks onseveral image classification datasets for their discriminative power.For each network, we fed in the images and extracted the activationat the last convolutional layer as the visual feature. Then we traineda linear SVM with C = 0.001 on the train split and evaluatedthe performance on the test split. We computed the classificationaccuracy averaged across classes, see Fig. 25. We include indoor67[53], sun397 [54] and caltech256 [55]. The deep features fromsupervised trained networks perform much better than the onesfrom the self-supervised trained networks. Networks trained onPlaces have better features for scene-centric datasets (sun397 andindoor67), while networks trained on ImageNet have better featuresfor object-centric datasets (caltech256).
Fig. 26 plots the number of the unique object detectors for eachrepresentation over that representation’s classification accuracyon three selected datasets. There is positive correlation betweenthem suggesting that the supervision tasks that encourage theemergence of more concept detectors may also improve thediscrimination ability of deep features. Interestingly, on someof the object centric dataset, the best discriminative representationis the representation from ResNet152-ImageNet, which has fewerunique object detectors compared to the ResNet152-Places365. Wehypothesize that the accuracy on a representation when applied toa task is dependent not only on the number of concept detectors inthe representation, but on how well the concept detectors capturesthe characteristics of the hidden factors in the transferred dataset.
3.10 Explaining the Predictions for the Deep FeaturesAfter we interpret the units inside the deep visual representation,we show that the unit activation along with the interpreted labelcan be used to explain the prediction given by the deep features.Previous work [56] uses the weighted sum of the unit activationmaps to highlight which image regions are most informative tothe prediction, here we further decouple at individual unit level tosegment the informative image regions.
We use the individual units identified as concept detectors tobuild an explanation of the individual image prediction given bya classifier. The procedure is as follows: Given any image, let theunit activation of the deep feature (for ResNet the GAP activation)be [x1, x2, ..., xN ], where each xn represents the value summedup from the activation map of unit n. Let the top prediction’s SVMresponse be s =
∑n wnxn, where [w1, w2, ..., wN ] is the SVM’s
learned weight. We get the top ranked units in Figure 27 by ranking[w1x1, w2x2, ..., wNxN ], which are the unit activations weightedby the SVM weight for the top predicted class. Then we simplyupsample the activation map of the top ranked unit to segment theimage. The threshold used for segmentation is the top 0.2 activationof the unit based on the feature map of the single instance.
Image segmentations using individual unit activation on ac-tion40 [57] dataset are plotted in Fig. 27a. The unit segmentation

11
Fig. 19. The interpretations of units change over iterations. Each row shows the interpretation of one unit.
100
102
104
106
0
10
20
30
40
50
Nu
mb
er
of
un
iqu
e d
ete
cto
rs
Places365 to ImageNet
object
scene
part
material
texture
color
100
102
104
106
Training iteration
0
0.2
0.4
0.6
Va
lida
tio
n a
ccu
racy
100
102
104
106
0
10
20
30
40ImageNet to Places365
100
102
104
106
Training iteration
0
0.2
0.4
0.6
Fig. 20. a) Fine-tune AlexNet from ImageNet to Places365. b) Fine-tuneAlexNet from Places365 to ImageNet.
Places365 to ImageNetImageNet to Places365Before After Before After
Fig. 21. Units evolve from a) the network fine-tuned from ImageNet toPlaces365 and b) the network fine-tuned from Places365 to ImageNet.Six units are shown with their semantics at the beginning of the fine-tuning and at the end of the fine-tuning.
Similar type of color
Similar type of shape Similar type of texture
Similar type of objectorange (0.023) chequered (0.020)unit12 food (0.042) bakery-shop (0.062)unit47
green (0.015) baseball_field (0.051)unit100
ground (0.067)porous (0.056)unit128swirly (0.094)wheel (0.102)unit137
honeycombed (0.029) auditorium (0.035)unit157leg (0.024)unit168 chair (0.057)
head (0.052)neck (0.034)unit227
Fig. 22. Examples from four types of unit evolutions. Types are definedbased on the concept similarity.
ImageNet to Places365
Places365 to ImageNet
before before
before before
after after
afterafter
unit15 unit100
unit31 unit132
Fig. 23. The history of one unit evolution during the fine-tuning fromImageNet to Places365 (top) and Places365 to ImageNet (low).
conv
1
conv
2
conv
3
conv
4
conv
5
conv
1
conv
2
conv
3
conv
4
conv
5
conv
1
conv
2
conv
3
conv
4
conv
50
50
100
150
Nu
mb
er
of
un
iqu
e d
ete
cto
rs
object
scene
part
material
texture
color
conv
1
conv
2
conv
3
conv
4
conv
5
conv
1
conv
2
conv
3
conv
4
conv
5
conv
1
conv
2
conv
3
conv
4
conv
50
0.1
0.2
0.3
0.4
Ra
tio
of
un
iqu
e d
ete
cto
rs
object
scene
part
material
texture
color
AlexNet
AlexNet AlexNet-GAP-Wide
AlexNet-GAP-Wide
AlexNet-GAP-WideAll
AlexNet-GAP-WideAll
Fig. 24. Comparison of the standard AlexNet, AlexNet-GAP-Wide, andAlexNet-GAP-WideAll. Widening the layer brings the emergence ofmore detectors. Networks are trained on Places365. Plot above showsthe number of unique detectors, plot below shows the ratio of uniquedetectors.

12
indoor67
0.8
27
0.7
97
0.7
92
0.7
88
0.7
85
0.7
68
0.7
56
0.7
50
0.6
74
0.6
72
0.6
64
0.6
15
0.6
07
0.5
80
0.5
74
0.5
10
0.4
30
0.4
24
0.4
02
0.3
92
0.3
62
0.3
39
0.3
35
0.2
85
0.2
59
0.2
06
0.1
78
Res
Net
152-
Place
s365
Goo
gLeN
et-P
lace
s205
Goo
gLeN
et-P
lace
s365
VGG-P
lace
s205
VGG-P
lace
s365
VGG-H
ybrid
Res
Net
50-Im
ageN
et
Res
Net
152-
Imag
eNet
AlexN
et-P
lace
s365
-GAP
VGG-Im
ageN
et
Goo
gLeN
et-Im
ageN
et
AlexN
et-P
lace
s205
-BN
AlexN
et-P
lace
s205
AlexN
et-P
lace
s365
AlexN
et-H
ybrid
AlexN
et-Im
ageN
et
cont
ext
cros
scha
nnel
audio
coloriz
ation
track
ing
puzz
le
objectce
ntric
egom
otion
mov
ing
fram
eord
er
AlexN
et-ra
ndom
0
0.5
1A
ccura
cy
sun397
0.6
90
0.6
66
0.6
57
0.6
55
0.6
49
0.6
29
0.6
05
0.5
97
0.5
15
0.5
13
0.5
13
0.4
72
0.4
60
0.4
54
0.4
47
0.3
81
0.2
87
0.2
71
0.2
68
0.2
50
0.2
50
0.2
08
0.1
88
0.1
60
0.1
42
0.1
05
0.1
02
Res
Net
152-
Place
s365
VGG-P
lace
s365
VGG-H
ybrid
VGG-P
lace
s205
Goo
gLeN
et-P
lace
s365
Goo
gLeN
et-P
lace
s205
Res
Net
152-
Imag
eNet
Res
Net
50-Im
ageN
et
AlexN
et-P
lace
s365
-GAP
VGG-Im
ageN
et
Goo
gLeN
et-Im
ageN
et
AlexN
et-P
lace
s205
-BN
AlexN
et-P
lace
s205
AlexN
et-P
lace
s365
AlexN
et-H
ybrid
AlexN
et-Im
ageN
et
cont
ext
cros
scha
nnel
audio
track
ing
coloriz
ation
puzz
le
objectce
ntric
egom
otion
mov
ing
AlexN
et-ra
ndom
fram
eord
er0
0.2
0.4
0.6
0.8
Accura
cy
caltech256
0.8
27
0.8
09
0.7
82
0.7
66
0.7
54
0.7
32
0.5
85
0.5
71
0.5
19
0.5
15
0.4
94
0.4
93
0.4
89
0.4
83
0.4
76
0.4
33
0.3
87
0.3
80
0.3
77
0.3
43
0.3
22
0.3
19
0.2
55
0.2
29
0.2
21
0.1
90
0.1
48
Res
Net
152-
Imag
eNet
Res
Net
50-Im
ageN
et
Goo
gLeN
et-Im
ageN
et
VGG-H
ybrid
VGG-Im
ageN
et
Res
Net
152-
Place
s365
AlexN
et-Im
ageN
et
AlexN
et-H
ybrid
VGG-P
lace
s365
VGG-P
lace
s205
AlexN
et-P
lace
s365
-GAP
AlexN
et-P
lace
s205
AlexN
et-P
lace
s365
Goo
gLeN
et-P
lace
s365
AlexN
et-P
lace
s205
-BN
Goo
gLeN
et-P
lace
s205
cont
ext
cros
scha
nnel
coloriz
ation
audio
track
ing
puzz
le
objectce
ntric
egom
otion
mov
ing
fram
eord
er
AlexN
et-ra
ndom
0
0.5
1
Accura
cy
Fig. 25. The classification accuracy of deep features on the three imagedatasets.
explain the prediction explicitly. For example, the prediction for thefirst image is Gardening, and the explanatory units detect person,arm, plate, pottedplant. The prediction for the second image isFishing, the explanatory units detect person, tree, river, water. Wealso plot some incorrectly predicted samples in Figure 27b. Thesegmentation gives the intuition as to why the classifier mademistakes. For example, for the first image the classifier predictscutting vegetables rather than the true label gardening, because thesecond unit incorrectly mistakes the ground as table.
4 DISCUSSION
We discuss the threshold τ and the potential biases in theinterpretation given by our approach below.
Influence of the threshold τ . Our choice of a tight threshold τis done to reveal information about fine-grained concept selectivityof individual units. The effect of choosing tighter and looser τ onthe interpretation of units across a whole representation is shownin Fig 28. A τ smaller than 0.005 identifies fewer objects becausesome objects will be missed by the small threshold. On the otherhand, a larger τ , or using no threshold at all, associates unitswith general concepts such as colors, textures, and large regions,rather than capturing the sensitivity of units on more specificconcepts. Fig. 29 shows the effect of varying τ on specific units’IoU. Although the two units are sensitive to paintings and horses,respectively, they are also both generally sensitive to the colorbrown when considered at a larger τ . The tight τ = 0.005 revealsthe sensitivity of the units to fine-grained concepts.
Potential biases in the interpretations. Several potentialbiases might occur to our method as follows: 1) Our methodwill not identify units that detect concepts that do not appear inthe Broden dataset, including some difficult-to-name concepts suchas ‘the corner of a room’; 2) Some units might detect a very fine-grained concept, such as a wooden stool chair leg, which are morespecific than concepts in Broden, thus yielding a low IoU on the‘chair’ category. Such units might not be counted as a concept
detector. 3) Our method measures the degree of alignment betweenindividual unit activations and a visual concept, so it will notidentify a group of units that might jointly represent one concept;4) Units might not be centered within their receptive fields so thatthe upsampled activation maps may be misaligned by a few pixels.5) The ”number of unique detectors” metric might favor largenetworks in comparing their network interpretability.
5 CONCLUSION
Network Dissection translates qualitative visualizations of represen-tation units into quantitative interpretations and measurements ofinterpretability. Here we show that the units of a deep representationare significantly more interpretable than expected for a basis ofthe representation space. We investigate the interpretability ofdeep visual representations resulting from different architectures,training supervisions, and training conditions. We also show thatinterpretability of deep visual representations is relevant to thepower of the representation as a generalizable visual feature. Weconclude that interpretability is an important property of deepneural networks that provides new insights into their hierarchicalstructure. Our work motivates future work towards building moreinterpretable and explainable AI systems.
ACKNOWLEDGMENTS
This work was funded by DARPA XAI program No. FA8750-18-C-0004 and NSF Grant No. 1524817 to A.T., NSF grant No. 1532591to A.O and A.T.; the Vannevar Bush Faculty Fellowship programfunded by the ONR grant No. N00014-16-1-3116 to A.O.; the MITBig Data Initiative at CSAIL, the Toyota Research Institute MITCSAIL Joint Research Center, Google and Amazon Awards, and ahardware donation from NVIDIA Corporation. B.Z. is supportedby a Facebook Fellowship.
REFERENCES
[1] B. Zhou, A. Khosla, A. Lapedriza, A. Oliva, and A. Torralba, “Objectdetectors emerge in deep scene cnns,” International Conference onLearning Representations, 2015.
[2] A. Gonzalez-Garcia, D. Modolo, and V. Ferrari, “Do semantic partsemerge in convolutional neural networks?” arXiv:1607.03738, 2016.
[3] C. Vondrick, H. Pirsiavash, and A. Torralba, “Generating videos withscene dynamics,” arXiv:1609.02612, 2016.
[4] Y. Bengio, A. Courville, and P. Vincent, “Representation learning: Areview and new perspectives,” IEEE transactions on pattern analysis andmachine intelligence, vol. 35, no. 8, pp. 1798–1828, 2013.
[5] D. Bau, B. Zhou, A. Khosla, A. Oliva, and A. Torralba, “Networkdissection: Quantifying interpretability of deep visual representations,” inProc. CVPR, 2017.
[6] N. Srivastava, G. E. Hinton, A. Krizhevsky, I. Sutskever, and R. Salakhut-dinov, “Dropout: a simple way to prevent neural networks from overfitting.”Journal of Machine Learning Research, vol. 15, no. 1, pp. 1929–1958,2014.
[7] S. Ioffe and C. Szegedy, “Batch normalization: Accelerating deep networktraining by reducing internal covariate shift,” arXiv:1502.03167, 2015.
[8] M. D. Zeiler and R. Fergus, “Visualizing and understanding convolutionalnetworks,” Proc. ECCV, 2014.
[9] R. Girshick, J. Donahue, T. Darrell, and J. Malik, “Region-basedconvolutional networks for accurate object detection and segmentation,”IEEE transactions on pattern analysis and machine intelligence, 2016.
[10] A. Mahendran and A. Vedaldi, “Understanding deep image representationsby inverting them,” Proc. CVPR, 2015.
[11] K. Simonyan, A. Vedaldi, and A. Zisserman, “Deep inside convolutionalnetworks: Visualising image classification models and saliency maps,”International Conference on Learning Representations Workshop, 2014.
[12] A. Mahendran and A. Vedaldi, “Understanding deep image representationsby inverting them,” in Proc. CVPR, 2015.

130.5 0.6 0.7 0.8 0.9 1
Accuracy on event8
0
20
40
60
80
100
Num
ber o
f uniq
ue o
bject
dete
ctors
ResNet152-ImageNet
ResNet152-Places365
ResNet50-ImageNet
VGG-ImageNet
VGG-Places365
VGG-Places205VGG-Hybrid
GoogLeNet-ImageNetGoogLeNet-Places205
GoogLeNet-Places365
AlexNet-random
AlexNet-ImageNet
AlexNet-Places205AlexNet-HybridAlexNet-Places205-BN
AlexNet-Places365
AlexNet-Places365-GAP
context
audioframeorder tracking
egomotion
movingobjectcentric
puzzlecolorizationcrosschannel
0.1 0.2 0.3 0.4 0.5 0.6 0.7 0.8Accuracy on action40
0
20
40
60
80
100
Num
ber o
f uniq
ue o
bject
dete
ctors
ResNet152-ImageNet
ResNet152-Places365
ResNet50-ImageNet
VGG-ImageNet
VGG-Places365
VGG-Places205VGG-Hybrid
GoogLeNet-ImageNetGoogLeNet-Places205
GoogLeNet-Places365
AlexNet-random
AlexNet-ImageNet
AlexNet-Places205 AlexNet-HybridAlexNet-Places205-BN
AlexNet-Places365
AlexNet-Places365-GAP
contextaudio
frameordertracking
egomotion
movingobjectcentricpuzzle
colorizationcrosschannel
0.3 0.4 0.5 0.6 0.7 0.8 0.9 1Accuracy on caltech101
0
20
40
60
80
100
Num
ber o
f uniq
ue o
bject
dete
ctors
AlexNet-Places205-BN
ResNet152-Places365ResNet50-ImageNet
VGG-ImageNet
VGG-Places365
VGG-Places205VGG-Hybrid
GoogLeNet-ImageNetGoogLeNet-Places205
GoogLeNet-Places365
AlexNet-random
AlexNet-ImageNet
AlexNet-Places205 AlexNet-Hybrid
ResNet152-ImageNet
AlexNet-Places365AlexNet-Places365-GAP
context
audio
frameorder
tracking
egomotion
movingobjectcentric
puzzle
colorization
crosschannel
0 0.2 0.4 0.6 0.8 1Accuracy on indoor67
0
20
40
60
80
100
Num
ber o
f uniq
ue o
bject
dete
ctors
ResNet152-ImageNet
ResNet152-Places365
ResNet50-ImageNet
VGG-ImageNet
VGG-Places365VGG-Places205
VGG-Hybrid
GoogLeNet-ImageNetGoogLeNet-Places205GoogLeNet-Places365
AlexNet-random
AlexNet-ImageNetAlexNet-Places205AlexNet-Hybrid
AlexNet-Places205-BN
AlexNet-Places365
AlexNet-Places365-GAP
context
audioframeorder
tracking
egomotion
moving
objectcentric
puzzle colorizationcrosschannel
0 0.1 0.2 0.3 0.4 0.5 0.6 0.7Accuracy on sun397
0
20
40
60
80
100
Num
ber o
f uniq
ue o
bject
dete
ctors
ResNet152-ImageNet
ResNet152-Places365
ResNet50-ImageNet
VGG-ImageNet
VGG-Places365VGG-Places205
VGG-Hybrid
GoogLeNet-ImageNetGoogLeNet-Places205
GoogLeNet-Places365
AlexNet-random
AlexNet-ImageNet
AlexNet-Places205AlexNet-Hybrid
AlexNet-Places205-BN
AlexNet-Places365
AlexNet-Places365-GAP
contextaudio
frameorder
tracking
egomotion
movingobjectcentric
puzzle
colorization
crosschannel
0 0.2 0.4 0.6 0.8 1Accuracy on caltech256
0
20
40
60
80
100
Num
ber o
f uniq
ue o
bject
dete
ctors
ResNet152-ImageNet
ResNet152-Places365
ResNet50-ImageNet
VGG-ImageNet
VGG-Places365
VGG-Places205VGG-Hybrid
GoogLeNet-ImageNetGoogLeNet-Places205 GoogLeNet-Places365
AlexNet-random
AlexNet-ImageNet
AlexNet-Places205 AlexNet-HybridAlexNet-Places205-BN
AlexNet-Places365
AlexNet-Places365-GAP
contextaudio
frameorder
tracking
egomotion
movingobjectcentric
puzzlecolorization
crosschannel
Fig. 26. The number of unique object detectors in the last convolutional layer compared to each representations classification accuracy on threedatasets. Supervised (in red) and unsupervised (in green) representations clearly form two clusters.
[13] A. Dosovitskiy and T. Brox, “Generating images with perceptual similaritymetrics based on deep networks,” in Advances in Neural InformationProcessing Systems, 2016, pp. 658–666.
[14] A. Nguyen, A. Dosovitskiy, J. Yosinski, T. Brox, and J. Clune, “Synthesiz-ing the preferred inputs for neurons in neural networks via deep generatornetworks,” In Advances in Neural Information Processing Systems, 2016.
[15] K. He, X. Zhang, S. Ren, and J. Sun, “Deep residual learning for imagerecognition,” in Proc. CVPR, 2016.
[16] A. S. Razavian, H. Azizpour, J. Sullivan, and S. Carlsson, “Cnn featuresoff-the-shelf: an astounding baseline for recognition,” arXiv:1403.6382,2014.
[17] P. Agrawal, R. Girshick, and J. Malik, “Analyzing the performance ofmultilayer neural networks for object recognition,” Proc. ECCV, 2014.
[18] J. Yosinski, J. Clune, Y. Bengio, and H. Lipson, “How transferable arefeatures in deep neural networks?” In Advances in Neural InformationProcessing Systems, 2014.
[19] C. Szegedy, W. Zaremba, I. Sutskever, J. Bruna, D. Erhan, I. Good-fellow, and R. Fergus, “Intriguing properties of neural networks,”arXiv:1312.6199, 2013.
[20] A. Nguyen, J. Yosinski, and J. Clune, “Deep neural networks are easilyfooled: High confidence predictions for unrecognizable images,” in Proc.CVPR, 2015.
[21] Y. Li, J. Yosinski, J. Clune, H. Lipson, and J. Hopcroft, “Convergentlearning: Do different neural networks learn the same representations?”arXiv:1511.07543, 2015.
[22] C. Zhang, S. Bengio, M. Hardt, B. Recht, and O. Vinyals, “Understandingdeep learning requires rethinking generalization,” International Confer-ence on Learning Representations, 2017.
[23] C. Doersch, A. Gupta, and A. A. Efros, “Unsupervised visual representa-tion learning by context prediction,” in Proc. CVPR, 2015.
[24] M. Noroozi and P. Favaro, “Unsupervised learning of visual representa-tions by solving jigsaw puzzles,” in Proc. ECCV, 2016.
[25] D. Jayaraman and K. Grauman, “Learning image representations tied toego-motion,” in Proc. ICCV, 2015.
[26] P. Agrawal, J. Carreira, and J. Malik, “Learning to see by moving,” inProc. ICCV, 2015.
[27] X. Wang and A. Gupta, “Unsupervised learning of visual representationsusing videos,” in Proc. CVPR, 2015.
[28] R. Zhang, P. Isola, and A. A. Efros, “Colorful image colorization,” inProc. ECCV. Springer, 2016.
[29] ——, “Split-brain autoencoders: Unsupervised learning by cross-channelprediction,” in Proc. CVPR, 2017.
[30] A. Owens, J. Wu, J. H. McDermott, W. T. Freeman, and A. Torralba,“Ambient sound provides supervision for visual learning,” in Proc. ECCV,2016.
[31] R. Q. Quiroga, L. Reddy, G. Kreiman, C. Koch, and I. Fried, “Invariantvisual representation by single neurons in the human brain,” Nature, vol.435, no. 7045, pp. 1102–1107, 2005.
[32] B. Zhou, H. Zhao, X. Puig, S. Fidler, A. Barriuso, and A. Torralba, “Sceneparsing through ade20k dataset,” Proc. CVPR, 2017.
[33] S. Bell, K. Bala, and N. Snavely, “Intrinsic images in the wild,” ACMTrans. on Graphics (SIGGRAPH), 2014.
[34] R. Mottaghi, X. Chen, X. Liu, N.-G. Cho, S.-W. Lee, S. Fidler, R. Urtasun,and A. Yuille, “The role of context for object detection and semanticsegmentation in the wild,” in Proc. CVPR, 2014.
[35] X. Chen, R. Mottaghi, X. Liu, S. Fidler, R. Urtasun, and A. Yuille, “Detectwhat you can: Detecting and representing objects using holistic modelsand body parts,” in Proc. CVPR, 2014.
[36] M. Cimpoi, S. Maji, I. Kokkinos, S. Mohamed, and A. Vedaldi, “Describ-ing textures in the wild,” in Proc. CVPR, 2014.
[37] J. Van De Weijer, C. Schmid, J. Verbeek, and D. Larlus, “Learningcolor names for real-world applications,” IEEE Transactions on ImageProcessing, vol. 18, no. 7, pp. 1512–1523, 2009.
[38] A. Krizhevsky, I. Sutskever, and G. E. Hinton, “Imagenet classificationwith deep convolutional neural networks,” in Advances in neural informa-tion processing systems, 2012, pp. 1097–1105.
[39] B. Zhou, A. Lapedriza, J. Xiao, A. Torralba, and A. Oliva, “Learningdeep features for scene recognition using places database,” In Advancesin Neural Information Processing Systems, 2014.
[40] C. Szegedy, W. Liu, Y. Jia, P. Sermanet, S. Reed, D. Anguelov, D. Erhan,V. Vanhoucke, and A. Rabinovich, “Going deeper with convolutions,” inProc. CVPR, 2015.
[41] K. Simonyan and A. Zisserman, “Very deep convolutional networks forlarge-scale image recognition,” arXiv:1409.1556, 2014.
[42] G. Huang, Z. Liu, K. Q. Weinberger, and L. van der Maaten, “Denselyconnected convolutional networks,” Proc. CVPR, 2017.
Correct label: gardening Correct label: brushing
a)
b)
Fig. 27. Segmenting images using top activated units weighted by the class label from ResNet152-Places365 deep feature. a) the correctly predictedsamples. b) the incorrectly predicted samples.

14
1
3
5
units
grassroa
d cartra
ck sea
mounta
inwate
rtre
epla
nt
skyscr
aperbo
okflo
wer
pool
tableho
rsebed
ceilin
g
signb
oardch
airfield
chan
delier
swim
ming po
olsink
railingriv
er
buildi
ngtrainlam
p
mounta
in sn
owyclo
set
corrid
or
crossw
alkwhe
el
scree
nhe
adhair
back
pillowpa
nefoodgri
d
cheq
uered
band
edfrillysw
irly
zigza
ggedfib
rous
paisle
ywov
en
studd
ed
perfo
rated
spira
lled
27 o
bjec
ts
3 sc
enes
7 pa
rts1
mat
eria
l
12 te
xtur
es
1
4
7
units
grassroa
dtre
ece
ilingwate
rpla
nt car
mounta
in seatra
ck
cabin
et skybedflo
werbo
okch
airho
rse
buildi
ngfield
window
pane
paint
ingpe
rson
signb
oard
pool
tablesin
krai
lingho
usesh
elf
groun
dtra
in
mounta
in sn
owy
skyscr
aperclo
sethe
ad
crossw
alkscr
eenha
ir
back
pillowwhe
elfoo
dgri
d
cheq
uered
band
edfib
rous
studd
edsw
irlylined
zigza
gged
paisle
yfril
lywov
enve
ined
perfo
rated
spira
lled
pleate
ddo
tted
groov
ed
waffled
polka
-dotte
d red
30 o
bjec
ts
3 sc
enes
6 pa
rts1
mat
eria
l
19 te
xtur
es1
colo
r
1
6
11
units
grasstre
eroa
d
buildi
ng skyce
iling
mounta
inwate
rflo
or carpla
ntbedse
ape
rsonch
air
cabin
etsh
elf
window
panetra
ckflo
wersofa
paint
ingho
rse
groun
dtab
leho
use
mounta
in sn
owystr
eet
skyscr
aperhe
adhair
scree
ntor
sowhe
el legca
rpetfoo
dwoo
d
cheq
uered
band
eddo
ttedsw
irly
waffled
cobw
ebbe
dgri
d
zigza
ggedfib
rousfril
lyline
dstr
iped
woven
crysta
lline
paisle
yve
ined
studd
ed
perfo
rated
spira
lled
pleate
d
cracke
d
potho
led
groov
ed
strati
fied
lacelik
e redbluebla
ckwhit
e26
obj
ects
3 sc
enes
6 pa
rts
3 m
ater
ials
25 te
xtur
es
4 co
lors
1
9
17
units
buildi
nggra
sstreeroa
dce
ilingflo
or skywaterca
r
perso
n
mounta
inpla
ntbed
window
pane
cabin
etch
airtab
leso
fa
groun
dwall
mounta
in sn
owystr
eet
living
room
skyscr
aper
kitche
n
dining
roomtor
sohe
adhairwhe
elwoo
d
paint
ed
cheq
uereddo
tted
zigza
gged
band
ed
waffledsw
irlystr
iped
cobw
ebbe
dwov
en
interl
aced
sprin
kledgri
dline
d
blotch
y
paisle
yfib
rousfril
ly
cracke
d
potho
led
pleate
d
perfo
rated
spira
lled
strati
fied
crysta
lline
lacelik
e
studd
ed
freckl
edblue red
greenbla
ckwhit
e
orang
epin
kye
llow
20 o
bjec
ts
6 sc
enes
4 pa
rts
2 m
ater
ials
27 te
xtur
es
8 co
lors
1
13
25
units
buildi
ngtreeflo
or skygrassroa
dpe
rson
ceilin
g carwall
water
cabin
etch
air
window
pane
mounta
intab
lestr
eet
kitche
n
bedro
om
skyscr
aper
dining
room
bathr
oom
living
roomtor
sofab
ric
paint
ed
cheq
uereddo
tted
band
ed
blotch
ystr
iped
zigza
ggedsw
irly
cobw
ebbe
dline
dgri
d
paisle
y
waffled
potho
led
cracke
d
pleate
d
strati
fied
perfo
rated
interl
acedwov
en
polka
-dotte
d
sprin
kledbla
ckgre
enblue
brown
greywhit
e red
orang
eye
llow
16 o
bjec
ts
7 sc
enes
1 pa
rt
2 m
ater
ials
22 te
xtur
es
9 co
lors
τ = .0025
τ = .005
τ = .01
τ = .02
τ = .04
Fig. 28. Labels that appear in Alexnet-conv5 on Places205 as τ is variedfrom 0.0025 to 0.04. At wider thresholds, more units are assigned tolabels for generic concepts such as colors and textures.
(a) Unit 46 “painting” top images (b) Unit 185 “horse” top images
(c) IoU of labels matching unit 46 atdifferent τ .
(d) IoU of lables matching unit 185at different τ .
Fig. 29. Typical relationships between τ and IoU for different labels. In(c) and (d), IoU is shown on the y axis and τ is on the x axis, and everyconcept in Broden which maximizes IoU for some τ is shown. For loosethresholds, the same general concept “brown color” maximizes IoU forboth units even though the units have remarkable distinctive selectivity attighter thresholds.
[43] O. Russakovsky, J. Deng, H. Su, J. Krause, S. Satheesh, S. Ma, Z. Huang,A. Karpathy, A. Khosla, M. Bernstein et al., “Imagenet large scale visualrecognition challenge,” Int’l Journal of Computer Vision, 2015.
[44] B. Zhou, A. Lapedriza, A. Khosla, A. Oliva, and A. Torralba, “Places: A10 million image database for scene recognition,” IEEE Transactions onPattern Analysis and Machine Intelligence, 2017.
[45] P. Diaconis, “What is a random matrix?” Notices of the AMS, vol. 52,no. 11, pp. 1348–1349, 2005.
[46] I. Mikjjsra, C. L. Zitnick, and M. Hebert, “Shuffle and learn: unsupervisedlearning using temporal order verification,” in Proc. ECCV, 2016.
[47] R. Gao, D. Jayaraman, and K. Grauman, “Object-centric representationlearning from unlabeled videos,” arXiv:1612.00500, 2016.
[48] D. Pathak, P. Krahenbuhl, J. Donahue, T. Darrell, and A. A. Efros,“Context encoders: Feature learning by inpainting,” in Proc. CVPR, 2016.
[49] X. Wang, K. He, and A. Gupta, “Transitive invariance for self-supervisedvisual representation learning,” arXiv preprint arXiv:1708.02901, 2017.
[50] T.-Y. Lin, M. Maire, S. Belongie, J. Hays, P. Perona, D. Ramanan, P. Dollar,and C. L. Zitnick, “Microsoft coco: Common objects in context,” inEuropean conference on computer vision. Springer, 2014, pp. 740–755.
[51] O. Vinyals, A. Toshev, S. Bengio, and D. Erhan, “Show and tell: A neural
image caption generator,” in Proceedings of the IEEE conference oncomputer vision and pattern recognition, 2015, pp. 3156–3164.
[52] S. Zagoruyko and N. Komodakis, “Wide residual networks,”arXiv:1605.07146, 2016.
[53] A. Quattoni and A. Torralba, “Recognizing indoor scenes,” in Proc. CVPR,2009.
[54] J. Xiao, J. Hays, K. A. Ehinger, A. Oliva, and A. Torralba, “Sun database:Large-scale scene recognition from abbey to zoo,” in Proc. CVPR, 2010.
[55] G. Griffin, A. Holub, and P. Perona, “Caltech-256 object category dataset,”California Institute of Technology, Tech. Rep. 7694, 2007. [Online].Available: http://authors.library.caltech.edu/7694
[56] B. Zhou, A. Khosla, A. Lapedriza, A. Oliva, and A. Torralba, “Learningdeep features for discriminative localization,” in Proc. CVPR, 2016.
[57] B. Yao, X. Jiang, A. Khosla, A. L. Lin, L. Guibas, and L. Fei-Fei, “Humanaction recognition by learning bases of action attributes and parts,” inProc. ICCV, 2011.
Bolei Zhou is a Ph.D. Candidate in ComputerScience and Artificial Intelligence Lab (CSAIL)at the Massachusetts Institute of Technology. Hereceived M.Phil. degree in Information Engineer-ing from the Chinese University of Hong Kongand B.Eng. degree in Biomedical Engineeringfrom Shanghai Jiao Tong University in 2010.His research interests are computer vision andmachine learning. He is an award recipient ofFacebook Fellowship, Microsoft Research AsiaFellowship, and MIT Greater China Fellowship.
David Bau is a PhD student at the MIT ComputerScience and Artificial Intelligence Laboratory(CSAIL). He received an A.B. in Mathematicsfrom Harvard in 1992 and an M.S. in ComputerScience from Cornell in 1994. He coauthored atextbook on numerical linear algebra. He was asoftware engineer at Microsoft and Google anddeveloped ranking algorithms for Google ImageSearch. His research interest is interpretablemachine learning.
Aude Oliva is a Principal Research Scientistat the MIT Computer Science and Artificial In-telligence Laboratory. After a baccalaureate inPhysics and Mathematics, she received M.Scand Ph.D degrees in Cognitive Sciences fromthe Institut National Polytechnique of Grenoble,France. She received the 2006 National ScienceFoundation Career award, the 2014 Guggenheimand the 2016 Vannevar Bush awards. Her re-search spans cognitive science, neuroscienceand computer vision.
Antonio Torralba received the degree intelecommunications engineering from TelecomBCN, Spain, in 1994 and the Ph.D. degreein signal, image, and speech processing fromthe Institut National Polytechnique de Grenoble,France, in 2000. From 2000 to 2005, he spentpostdoctoral training at the Brain and CognitiveScience Department and the Computer Scienceand Artificial Intelligence Laboratory, MIT. He isnow a Professor of Electrical Engineering andComputer Science at the Massachusetts Institute
of Technology (MIT). Prof. Torralba is an Associate Editor of the Interna-tional Journal in Computer Vision, and has served as program chair forthe Computer Vision and Pattern Recognition conference in 2015. Hereceived the 2008 National Science Foundation (NSF) Career award, thebest student paper award at the IEEE Conference on Computer Visionand Pattern Recognition (CVPR) in 2009, and the 2010 J. K. AggarwalPrize from the International Association for Pattern Recognition (IAPR).