1 n ational a gricultural s tatistics s ervice washington, d.c. practical considerations in...
TRANSCRIPT

1National Agricultural Statistics ServiceWashington, D.C.
Practical Considerations in
Selecting Statistical Disclosure
Methodology for Tabular DataBTS Confidentiality Seminar Series, March 2003
2
Examples in the Presentation are Based on Actual
Occurrences
National Agricultural Statistics ServiceWashington, D.C.

3
Data have been changed to protect
the innocent
National Agricultural Statistics ServiceWashington, D.C.

4
Goals:
•Discuss Decision Factors•Discuss Alternatives•Present Illustrations•Provide a Perspective for
Future Decisions
National Agricultural Statistics ServiceWashington, D.C.

5
DECISION FACTORS - 1
What is your data structure?
Household, establishment, opinion, census data, sample results, etc…
National Agricultural Statistics ServiceWashington, D.C.

6
DECISION FACTORS - 2
National Agricultural Statistics ServiceWashington, D.C.
What are your population characteristics?
Limited variation, extremely clustered, highly skewed,
etc…
7
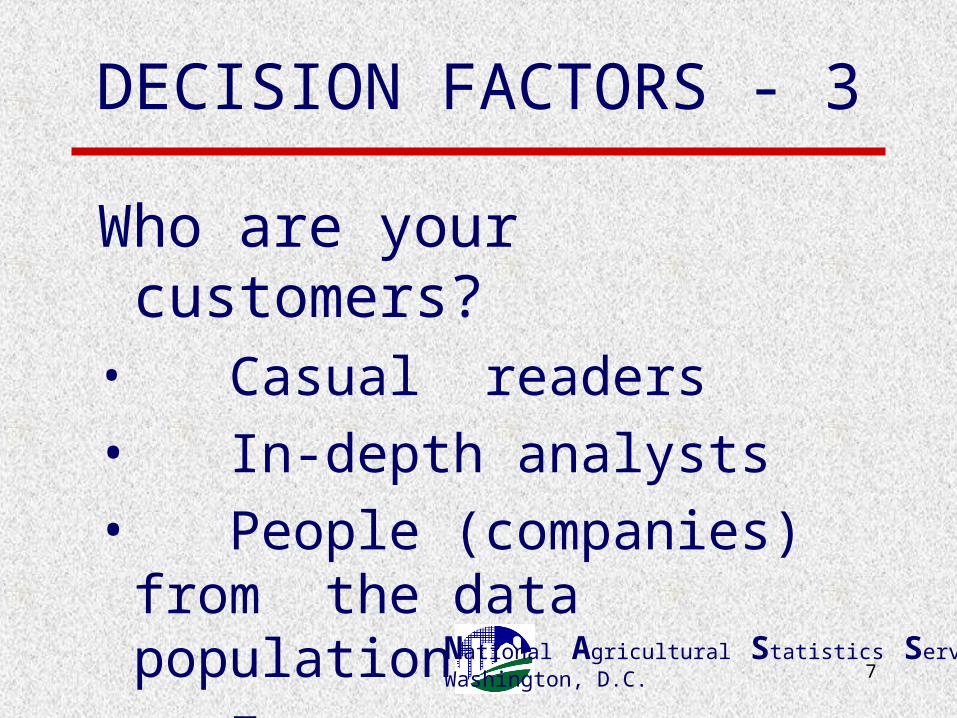
DECISION FACTORS - 3
National Agricultural Statistics ServiceWashington, D.C.
Who are your customers?• Casual readers• In-depth analysts• People (companies)
from the data population• Etc…
8
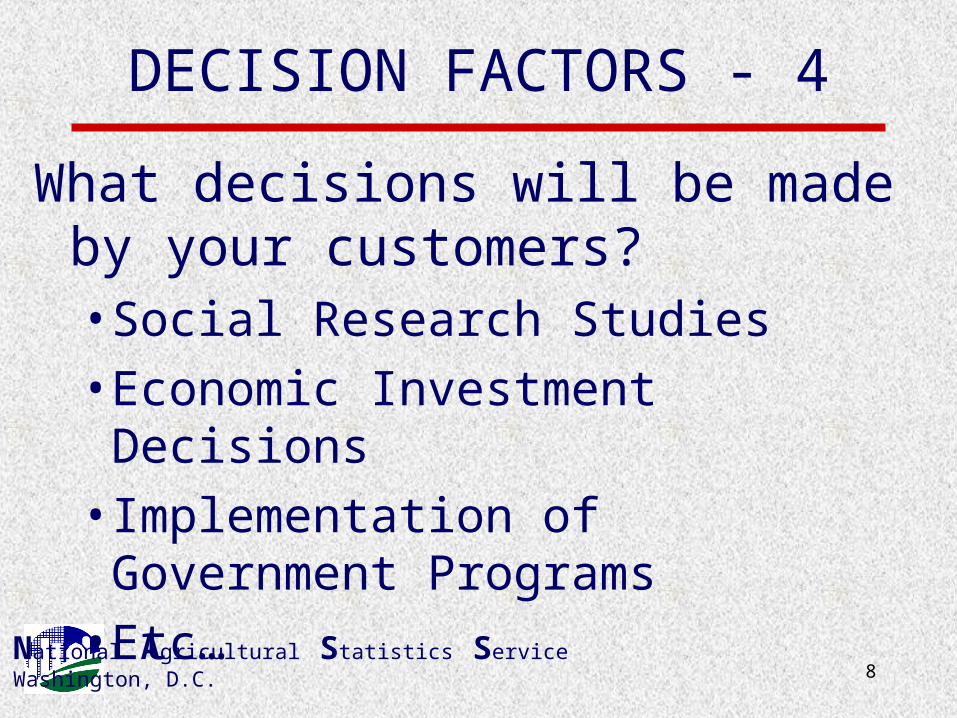
DECISION FACTORS - 4
National Agricultural Statistics ServiceWashington, D.C.
What decisions will be made by your customers?•Social Research Studies•Economic Investment Decisions•Implementation of Government Programs
•Etc…

9
BASIC SUPPRESSION APPROACHES
•(n, p) Rules•(p, k) Rules•(n, p, t) Rules
National Agricultural Statistics ServiceWashington, D.C.

10
Should You Publish Your Suppression Rule?
•Conventional wisdom says NO!
•It might be essential for certain situations
National Agricultural Statistics ServiceWashington, D.C.

11
BASIC NASS APPROACHES
•(p, k) Rule for Ag Census •(n, p) Rule for Periodic
Surveys•Special Techniques
National Agricultural Statistics ServiceWashington, D.C.
12
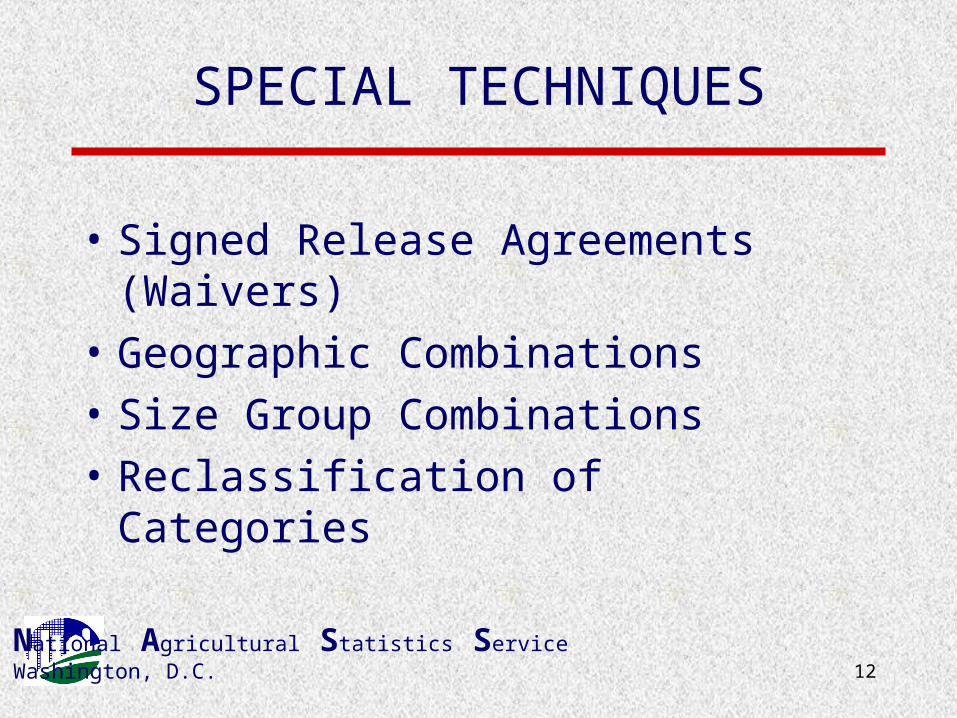
SPECIAL TECHNIQUES
• Signed Release Agreements (Waivers)
• Geographic Combinations• Size Group Combinations• Reclassification of Categories
National Agricultural Statistics ServiceWashington, D.C.

13
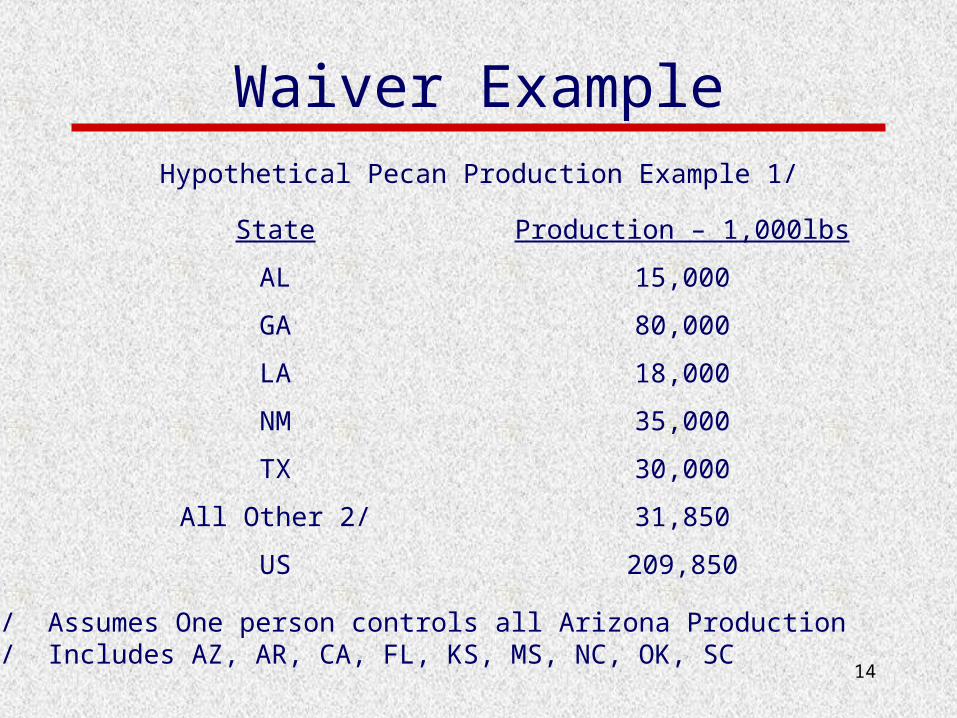
WAIVERS
• Large Operations• Permission to Publish is Requested• Must Agree in Writing• Updated Annually
National Agricultural Statistics ServiceWashington, D.C.
14
Waiver ExampleHypothetical Pecan Production Example 1/
State Production – 1,000lbs
AL 15,000
GA 80,000
LA 18,000
NM 35,000
TX 30,000
All Other 2/ 31,850
US 209,850
1/ Assumes One person controls all Arizona Production2/ Includes AZ, AR, CA, FL, KS, MS, NC, OK, SC

15
Waiver ExamplePecan Production Example, Actual Results
State 2000 Production/1,000lbs
AL 15,000
AZ 14,500
AR 900
CA 3,400
FL 3,300
GA 80,000
KS 550
LA 18,000
MS 3,500
NM 35,000
NC 1,600
OK 2,500
SC 1,600
TX 30,000
US 209,850

16
Geographic Combinations
National Agricultural Statistics ServiceWashington, D.C.
Hypothetical Olive Acreage
States Growers Acres
CA 1,363 37,714
FL 2 2
U.S. Total 1,365 37,716
Traditional Approach
CA 1,363 (D)
FL 2 (D)
U.S. Total 1,365 (D)
(D) Withheld to avoid disclosing data for individual farms.

17
Geographic Combinations
National Agricultural Statistics ServiceWashington, D.C.
Handling hypothetical Olive data
Situation by moving Florida Olives to “Other”
Olive Acreage
States Growers Acres
CA 1363 37,714
U.S. Total 1363 37,714

18
Size Group Example
Percent of Farms, by Economic Sales Class, U.S. 2001
Economic Sales Class Percent of Total Farms
$1,000 - $2,499 25.3
$2,500 - $4,999 15.3
$5,000 - $9,999 13.4
$10,000 - $24,999 12.5
$25,000 - $49,999 8.7
$50,000 - $99,999 8.6
$100,000 - $249,999 8.9
$250,000 - $499,999 4.1
$500,000 - $999,999 2.0
$1,000,000+ 1.2
Total 100.0

19
Size Group ExampleNumber of Farms: Economic Sales Class by State and Region,
2001
State and Region
Economic Sales Class
$1,000 - $9,999 $10,000 - $99,999 $100,000 & Over
Number Number Number
Northeast
CT 2,450
ME 4,200
MA 3,200
NH 2,100
NJ 6,400
NY 17,800 11,000 8,700
PA 32,800 16,500 9,700
RI 350
VT 3,500
Other States 10,600 3,800
Total 72,800 38,100 22,200

20
Reclassification Example
Hypothetical Potato Variety Data, 1 State
Fall Potatoes: Percent of Major Varieties Planted,
State and Varieties Percent of Planted Acres
R Burbank 71.0
Ranger R 12.0
R Norkotah 7.5
Shepody 3.4
Silverton R 2.4
De Wolf 1.0
Other 2.7
TOTAL 100.0
However, assume that deWolf is a new variety planted only on one large farms

21
Reclassification Example
Actual Potato Variety Data, 1 State
Fall Potatoes: Percent of Major Varieties Planted,
State and Varieties Percent of Planted Acres
R Burbank 71.0
Ranger R 12.0
R Norkotah 7.5
Shepody 3.4
Silverton R 2.4
Other 3.7
TOTAL 100.0

22
CASE STUDY
Agricultural Marketing Service implementation of mandatory price
reporting law illustrates basic decision factor principles.
National Agricultural Statistics ServiceWashington, D.C.
23
OUTLINE
• Define the problem• Explain the approach• Describe the solution• Present some results
National Agricultural Statistics ServiceWashington, D.C.
24
Large meat packers must report details of
all purchase transactions.
National Agricultural Statistics ServiceWashington, D.C.
25
Data must be reported by fixed times each day.
ANDSummaries published
an hour later.
National Agricultural Statistics ServiceWashington, D.C.

26
AMS must protect confidentiality in
issuing summaries.
National Agricultural Statistics ServiceWashington, D.C.

27
90% of slaughteris in 114 plants,
owned by 65 companies.
National Agricultural Statistics ServiceWashington, D.C.

28
4 Companies:
•80% of fed cattle•80% of fed lambs•55% of all hogs
National Agricultural Statistics ServiceWashington, D.C.

29
AMS adopted a 3/60 standard for each
data cell.
National Agricultural Statistics ServiceWashington, D.C.

30
At least three companies and no
company exceeding 60%.
National Agricultural Statistics ServiceWashington, D.C.

31
AMS never identified how many companies were in an aggregate.
National Agricultural Statistics ServiceWashington, D.C.
32
AMS did not distinguish
blank cells from suppressed cells.
National Agricultural Statistics ServiceWashington, D.C.
33
Many (24 %) daily reports were
suppressed plus many cells in released
reports.
National Agricultural Statistics ServiceWashington, D.C.
34
Some observers calculated 90% suppression.
National Agricultural Statistics ServiceWashington, D.C.
35
When in Doubt – Examine the Data!
National Agricultural Statistics ServiceWashington, D.C.

36
Plant
1 2 3 4 5 6 7 8 9 10 11 12
A X X X X X X X
B X
C X X X X X X X X X X X
D X X X X X X X
E X X X
F X X X X X X X X X X X
G X X X X X X X
H X X X X X X X X X X X
I X
SEQUENCE DAY
National Agricultural Statistics ServiceWashington, D.C.

37
When are proprietary data
not unique?
National Agricultural Statistics ServiceWashington, D.C.

38
National Agricultural Statistics ServiceWashington, D.C.
A new 3/70/20 confidentiality
standard based on 60-days of data.

39
National Agricultural Statistics ServiceWashington, D.C.
At least 3 companies
operated 50% of the time.

40
National Agricultural Statistics ServiceWashington, D.C.
No company had more than 70 percent of the
volume.

41
National Agricultural Statistics ServiceWashington, D.C.
No company would be exposed more than 20% of the
time.

42
Nearly all cattle daily reports and all cells
now released.
National Agricultural Statistics ServiceWashington, D.C.

43
EXAMPLE TALLY Cattle Open Market, One Region, Daily
National Agricultural Statistics ServiceWashington, D.C.
3 or more
68%
Concen. 47%
Exposure
2%

44
EXAMPLE TALLYCattle Forward Contracts, National, Daily
National Agricultural Statistics ServiceWashington, D.C.
3 or more 41%
Concen. 51%
Exposure 6%

45
Modification 1
National Agricultural Statistics ServiceWashington, D.C.
Cattle forward contracts are now published weekly

46
Modification 2
National Agricultural Statistics ServiceWashington, D.C.
All swine packer sales alternatives weighted together
daily.

47
Modification 3
National Agricultural Statistics ServiceWashington, D.C.
Lamb purchases accumulated until
the 3/70/20 is reached.

48
Author Contact Information
• Rich Allen• Deputy Administrator, NASS• Room 5905 South Building• 1400 Independence Ave., S.W.• Washington, D.C. 20250-2001• 202-690-8141 Fax 202-690-1311• [email protected]
National Agricultural Statistics ServiceWashington, D.C.