1 november 11, 2009 sony pictures entertainment mid range plan
TRANSCRIPT
1
November 11, 2009
SONY PICTURES ENTERTAINMENT
MID RANGE PLAN
2
Agenda
• Executive Summary• State of the Business
• SPE Divisional Details
o Motion Pictures o Home Entertainmento Domestic Televisiono International Televisiono Digital Production
• Financial Summary
• Closing
• Q & A

3
Executive Summary
4
Executive Summary
• Demand for our core product remains high
o 2009 YTD domestic box office revenues are up 5.3% from the same period in 2008
o U.S. Home Entertainment transactions are up 4% for the first half of 2009 vs. 2008
• Furthermore, we are still on track to meet our FYE10 EBIT target of $480 million
o However, $285 million of FYE10 EBIT is forecasted to come from asset sales
o This excludes approximately $66 million of incremental restructuring costs related to an in-process overhead reduction initiative
5
Executive Summary
• FYE10 has been subject to a number of challenges
o A decline in DVD sales due to the shift from sell thru to rental
o An adverse economic climate
o Lack of TV product in Syndication
o Continued investment in SPA – steady state not reached until FYE12
o Significantly lower margins and increased competition for direct-to-video product

6
Executive Summary
• Unfortunately, these challenges will continue to impact us throughout the MRP period, and most significantly in FYE11
• Our EBIT target for FYE11 is $300 million, excluding $15 million of restructuring costs
o If not for significant cost savings initiatives our EBIT for FYE11 would be closer to break-even
• Our Net Cash Flow target for FYE11 is break-even
o This cash flow target is very aggressive due to significant production spending for upcoming tentpole films in Columbia such as Spider-Man 4 and Men in Black III, the ramp-up of films within Sony Pictures Animation and higher spending per title for Screen Gems films
7
Executive Summary
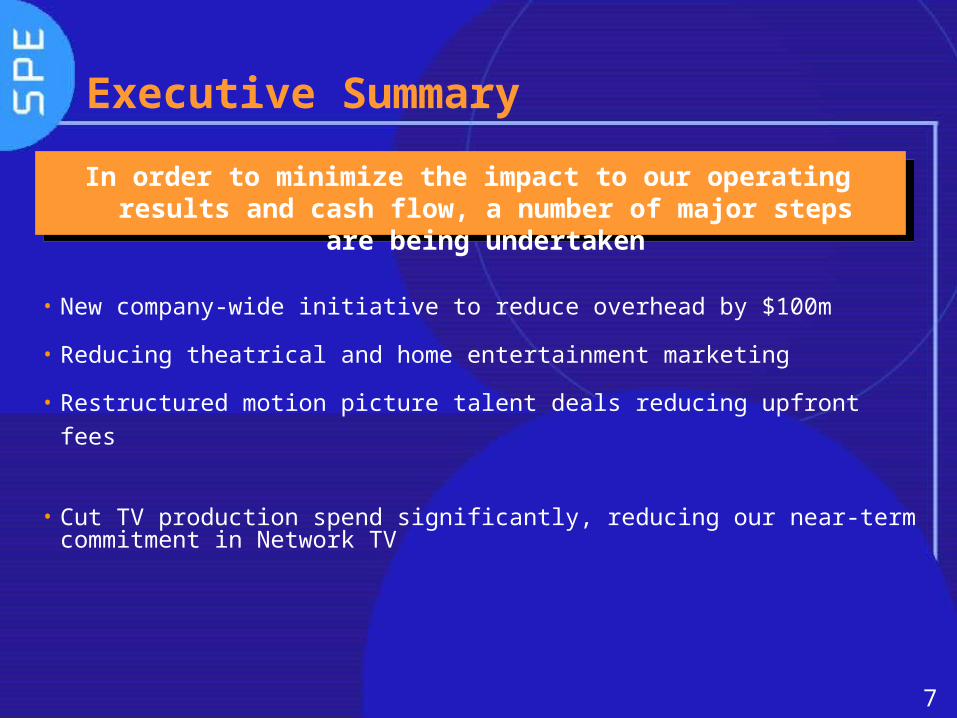
• New company-wide initiative to reduce overhead by $100m
• Reducing theatrical and home entertainment marketing
• Restructured motion picture talent deals reducing upfront fees
• Cut TV production spend significantly, reducing our near-term commitment in Network TV
In order to minimize the impact to our operating results and cash flow, a number of major steps are
being undertaken
8
Executive Summary
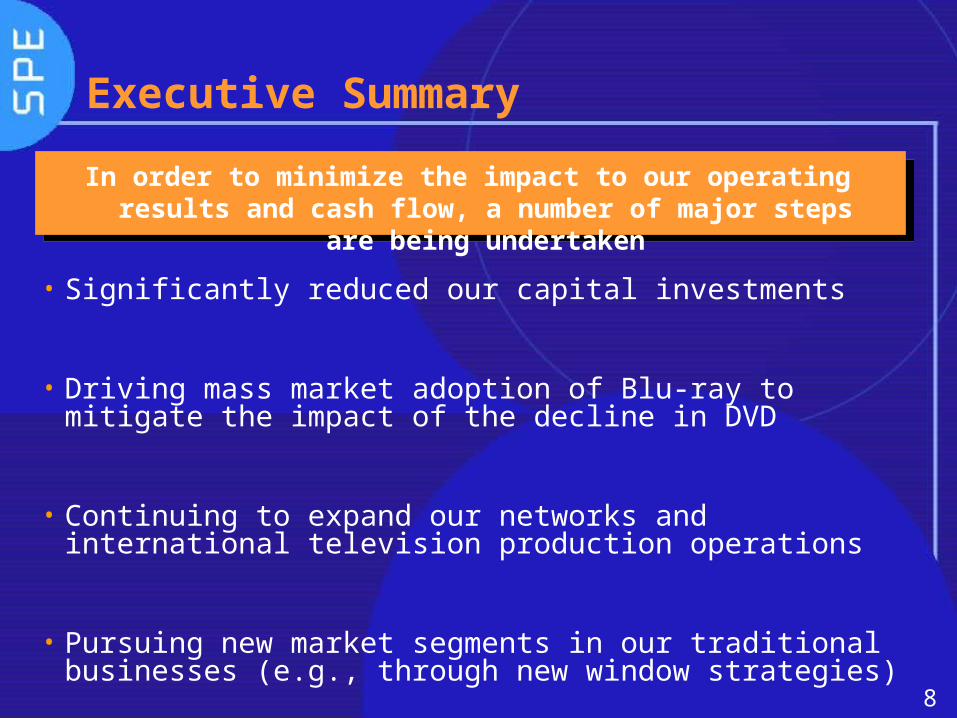
• Significantly reduced our capital investments
• Driving mass market adoption of Blu-ray to mitigate the impact of the decline in DVD
• Continuing to expand our networks and international television production operations
• Pursuing new market segments in our traditional businesses (e.g., through new window strategies)
In order to minimize the impact to our operating results and cash flow, a number of major steps are
being undertaken

9
State of the Business
10
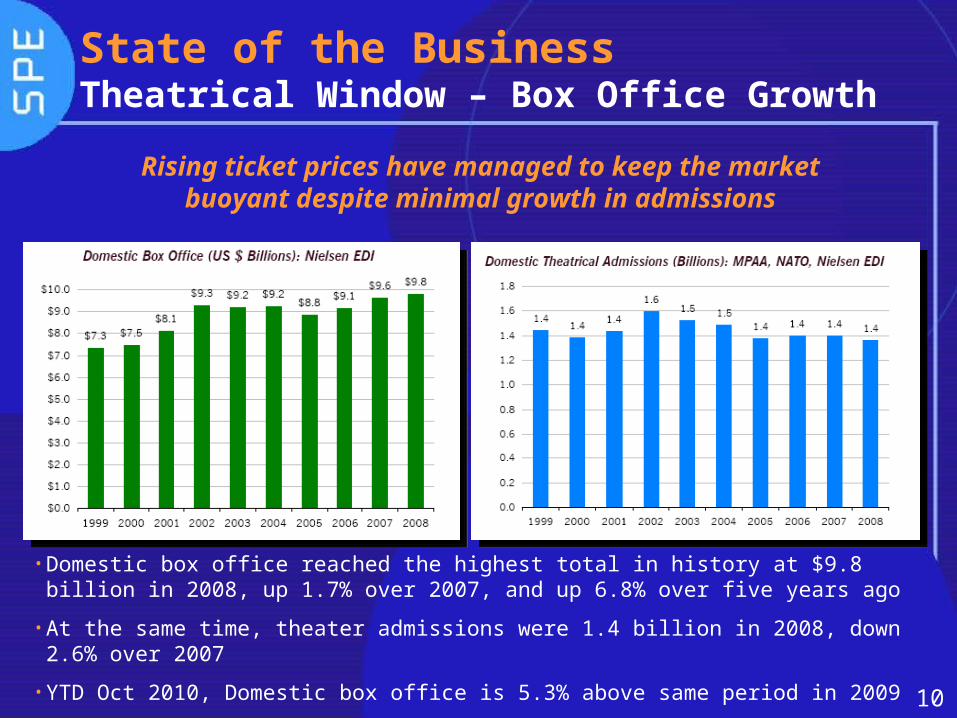
State of the BusinessTheatrical Window – Box Office Growth
Rising ticket prices have managed to keep the market buoyant despite minimal growth in
admissions
•Domestic box office reached the highest total in history at $9.8 billion in 2008, up 1.7% over 2007, and up 6.8% over five years ago
•At the same time, theater admissions were 1.4 billion in 2008, down 2.6% over 2007
•YTD Oct 2010, Domestic box office is 5.3% above same period in 2009
11
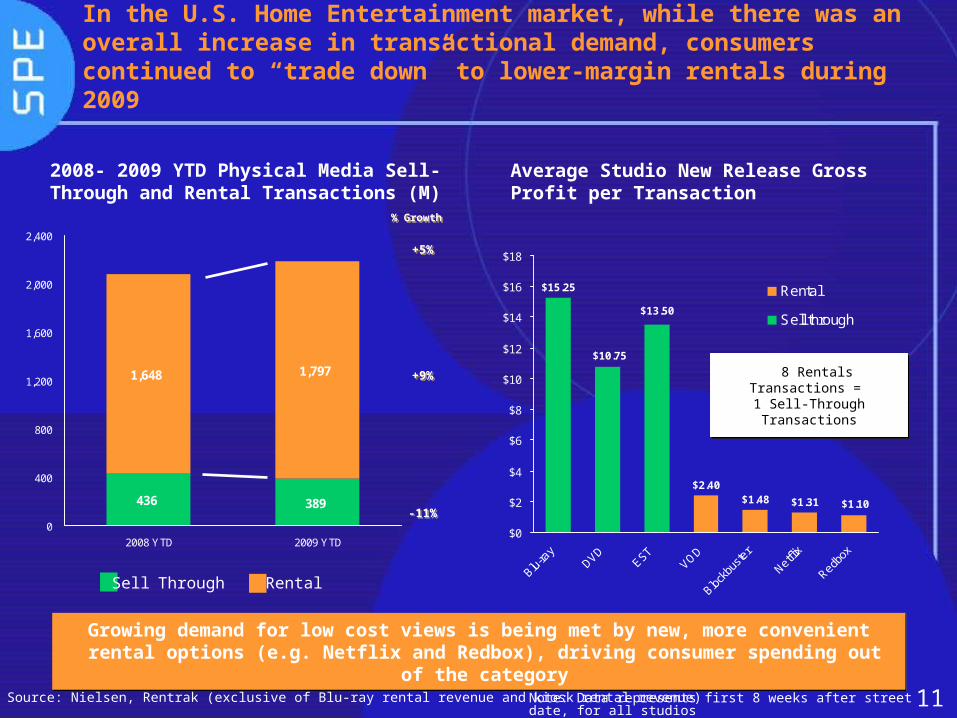
In the U.S. Home Entertainment market, while there was an overall increase in transactional demand, consumers continued to “trade down” to lower-margin rentals during 2009
Source: Nielsen, Rentrak (exclusive of Blu-ray rental revenue and kiosk rental revenue)
% Growth
% Growth
+5%+5%
+9%+9%
-11%-11%
2008- 2009 YTD Physical Media Sell-Through and Rental Transactions (M)
Growing demand for low cost views is being met by new, more convenient rental options (e.g. Netflix and Redbox), driving consumer spending out of
the category
Growing demand for low cost views is being met by new, more convenient rental options (e.g. Netflix and Redbox), driving consumer spending out of
the category
$15.25
$10.75
$13.50
$1.10$1.31$1.48$2.40
$0
$2
$4
$6
$8
$10
$12
$14
$16
$18
Blu-ra
yDVD
ESTVOD
Blockb
uste
r
Netflix
Redbox
Rental
Sell through
Average Studio New Release Gross Profit per Transaction
8 Rentals Transactions = 1 Sell-Through Transactions
8 Rentals Transactions = 1 Sell-Through Transactions
Sell Through Rental
Note: Data represents first 8 weeks after street date, for all studios
436 389
1,7971,648
0
400
800
1,200
1,600
2,000
2,400
2008 YTD 2009 YTD
12
1%3%
8%
-8% -8% -8%
-18%-19%
-26%
-33%
-37%
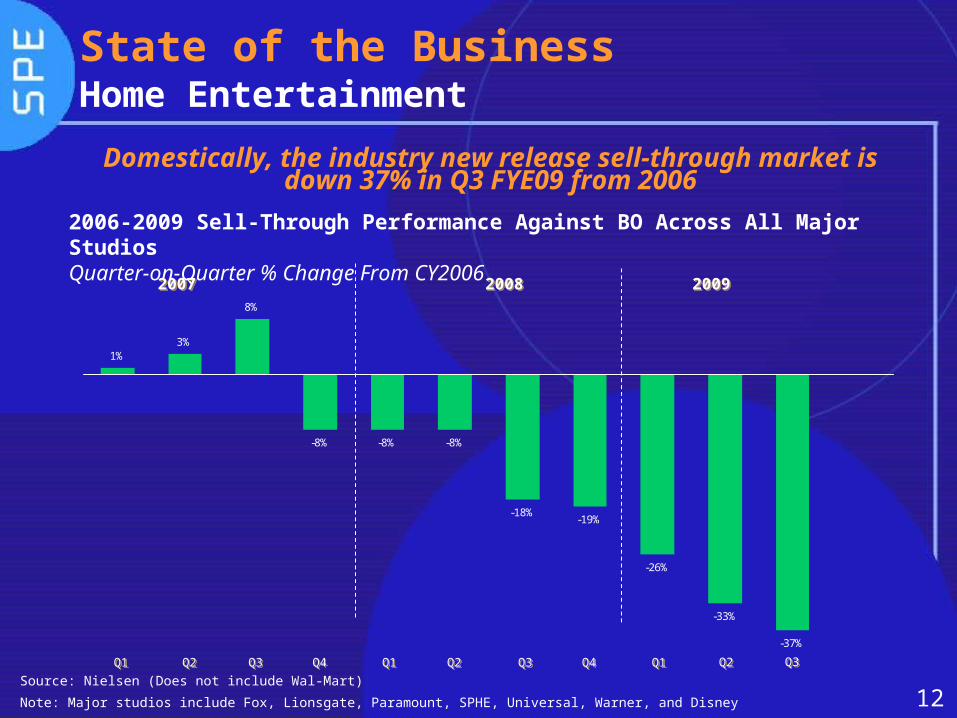
State of the BusinessHome Entertainment
2006-2009 Sell-Through Performance Against BO Across All Major StudiosQuarter-on-Quarter % Change From CY2006
20072007 20082008 20092009
Source: Nielsen (Does not include Wal-Mart)
Note: Major studios include Fox, Lionsgate, Paramount, SPHE, Universal, Warner, and Disney
Domestically, the industry new release sell-through market is down 37% in Q3 FYE09 from 2006
Q1Q1 Q3Q3 Q4Q4 Q1Q1 Q2Q2 Q3Q3 Q4Q4 Q1Q1Q2Q2 Q2Q2 Q3Q3
13
3%
-51%
-8%
-42%
-14%
13%
-16%
-43%-46%
-37%
-29%
-19%
-60%
-50%
-40%
-30%
-20%
-10%
0%
10%
20%
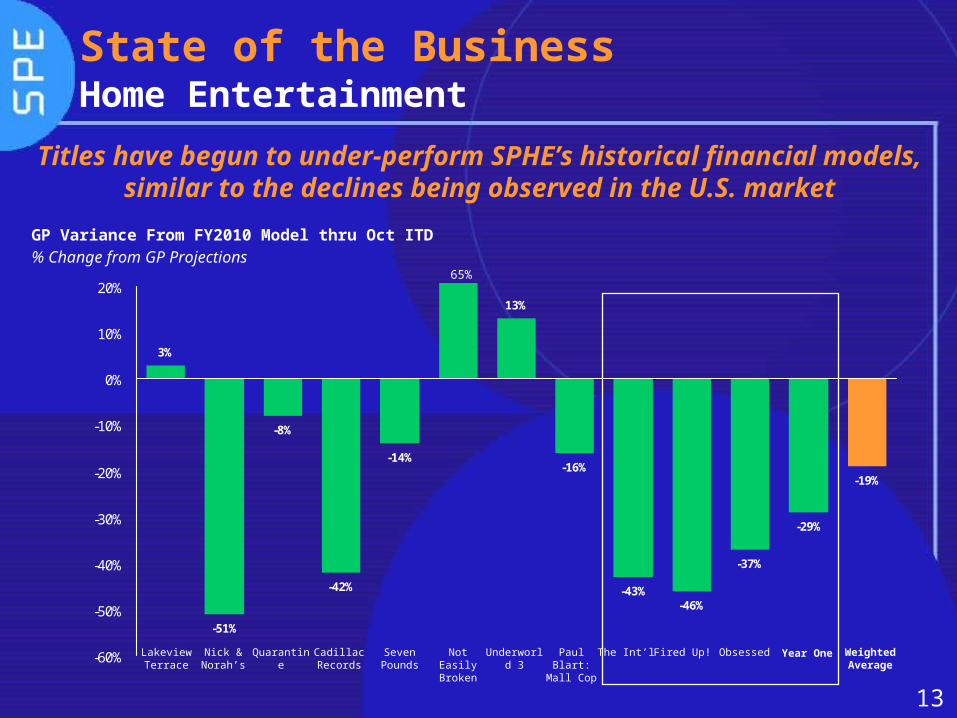
State of the BusinessHome Entertainment
Titles have begun to under-perform SPHE’s historical financial models, similar to the declines being observed in
the U.S. marketGP Variance From FY2010 Model thru Oct ITD% Change from GP Projections
Lakeview Terrace
Nick & Norah’s
Quarantine Cadillac Records
Seven Pounds
Not Easily Broken
Underworld 3
Paul Blart: Mall Cop
The Int’l Fired Up! Obsessed WeightedAverage
65%
Year One
14
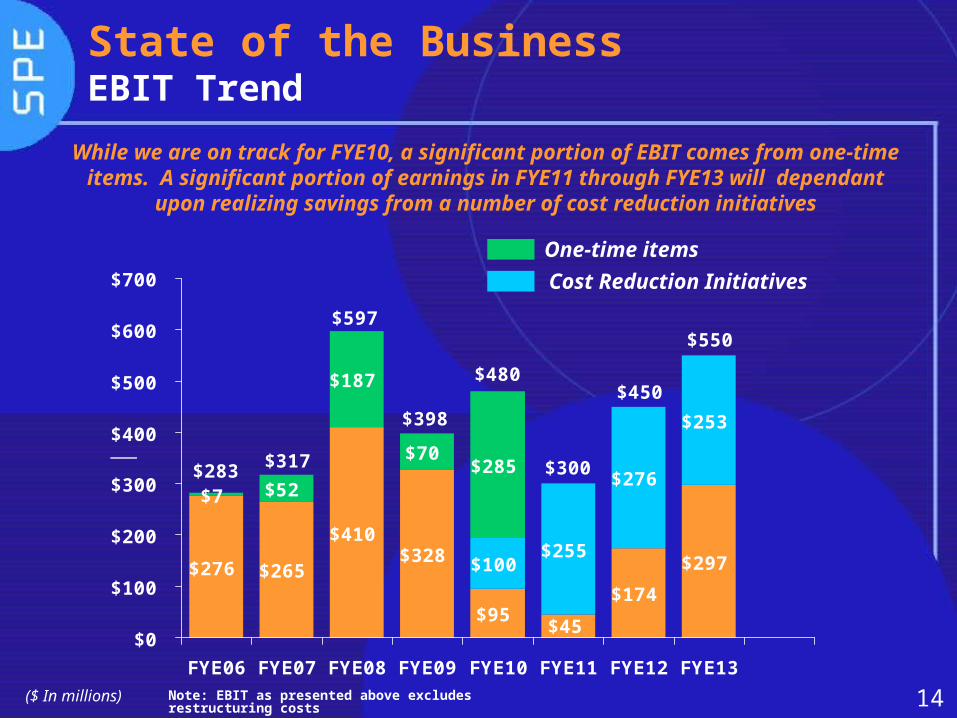
State of the BusinessEBIT Trend
$276 $265
$410$328
$95$174
$297$100$255
$276
$253
$7 $52
$187
$70$285
$45
$550
$450
$300
$480
$398
$597
$317$283
$0
$100
$200
$300
$400
$500
$600
$700
FYE06 FYE07 FYE08 FYE09 FYE10 FYE11 FYE12 FYE13
($ In millions)
One-time items
Cost Reduction Initiatives
While we are on track for FYE10, a significant portion of EBIT comes from one-time items. A significant portion of earnings in FYE11
through FYE13 will dependant upon realizing savings from a number of cost reduction initiatives
Note: EBIT as presented above excludes restructuring costs
15
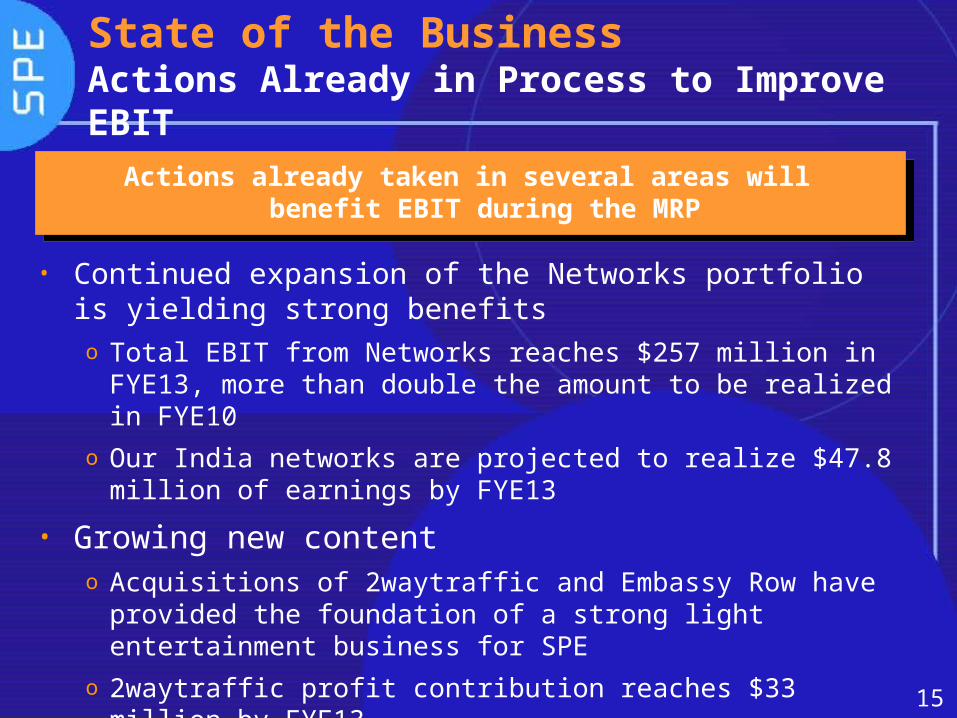
State of the BusinessActions Already in Process to Improve EBITActions already taken in several areas will benefit
EBIT during the MRP
• Continued expansion of the Networks portfolio is yielding strong benefitso Total EBIT from Networks reaches $257 million in FYE13,
more than double the amount to be realized in FYE10o Our India networks are projected to realize $47.8 million of
earnings by FYE13
• Growing new contento Acquisitions of 2waytraffic and Embassy Row have
provided the foundation of a strong light entertainment business for SPE
o 2waytraffic profit contribution reaches $33 million by FYE13

16
State of the BusinessCost Reduction Initiatives
FYE11 includes $255 million of cost savings resulting from a number of initiatives
• New Company-wide initiative to reduce overhead by $100 milliono Initiative will focus on the reduction of headcount (both
filled and open positions), reduction of temporary employee expenses and other controllable costs
• $115 million reduction of marketing expense
o $100 million of theatrical marketing ($25 million not yet allocated to specific titles)
o $15 million of home entertainment marketing
• $40 million cost savings within Domestic Television
17
Light Entertainment
Light Entertainment
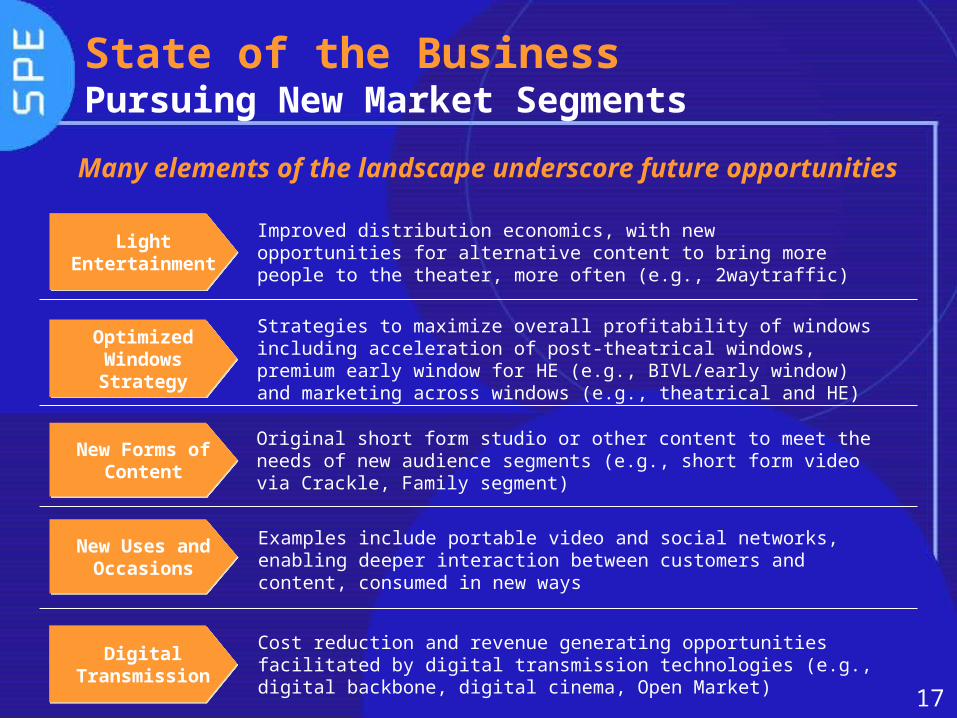
Improved distribution economics, with new opportunities for alternative content to bring more people to the theater, more often (e.g., 2waytraffic)
Strategies to maximize overall profitability of windows including acceleration of post-theatrical windows, premium early window for HE (e.g., BIVL/early window) and marketing across windows (e.g., theatrical and HE)
Optimized Windows Strategy
Optimized Windows Strategy
Original short form studio or other content to meet the needs of new audience segments (e.g., short form video via Crackle, Family segment)
New Forms of Content
New Forms of Content
Examples include portable video and social networks, enabling deeper interaction between customers and content, consumed in new ways
New Uses and Occasions
New Uses and Occasions
State of the BusinessPursuing New Market Segments
Cost reduction and revenue generating opportunities facilitated by digital transmission technologies (e.g., digital backbone, digital cinema, Open Market)
Digital Transmission
Digital Transmission
Many elements of the landscape underscore future opportunities
18
• Joint sales and marketing opportunities for Digital Cinema
oContent filmed with Sony cameras, distributed by Sony Pictures Releasing and projected over Sony 4K projectors
oPromotion of Sony Music artists through Hot Ticket
• Develop new window for PS3 Network and BIVL
• Develop original short form Internet content for distribution on PS3 Networks and BIVL (already distributing on Crackle on BIVL)
• Drive incremental consumption of SPE product on PSP
• Digital Backbone
State of the BusinessSony United
Continued pursuit of Sony United Collaboration

19
Divisional DetailsMotion PicturesMotion Pictures
20
Improve Economics of Existing Businesses
• Focus on genre and production cost mix
o Tentpoles and low budgets with upside at Columbia
o Genres films (e.g., Thriller, Comedy, Sci-Fi) and low cost/high thrill Action films at Screen Gems
o Emphasis on global appeal
• Reduce production and marketing costs
• Adjust talent costs, i.e., restructure back-end deals
• Pursue film-financing and tax-based incentives
Pursue Growth Opportunities:
• Grow family business
• Increase focus on franchises
• Pursue opportunities in high growth international markets
Motion PicturesKey Strategies
21
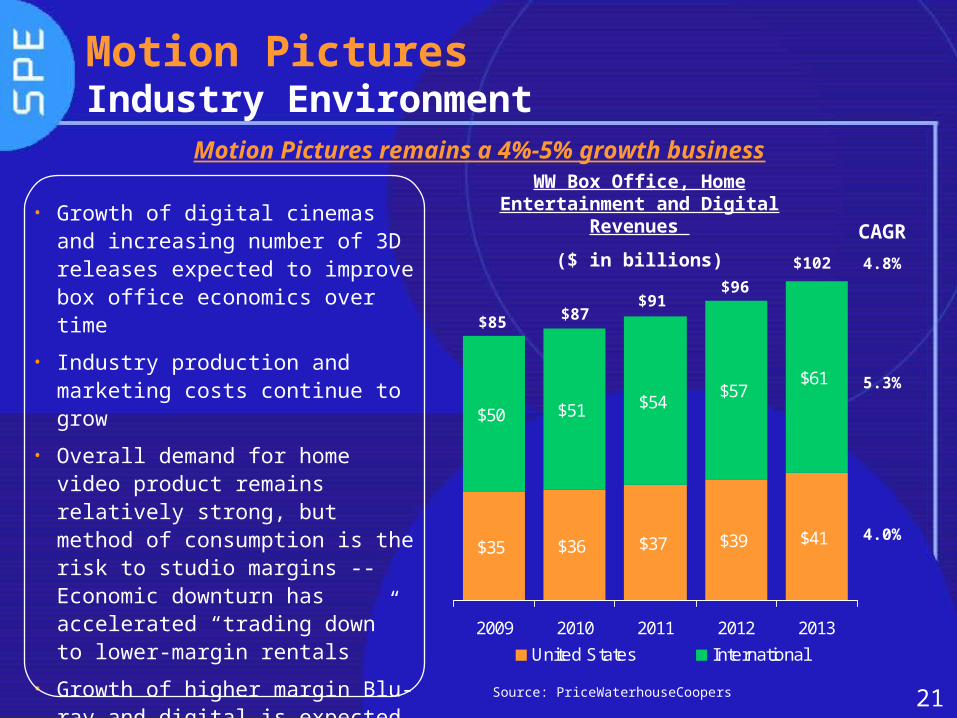
$35 $36 $37 $39 $41
$50 $51 $54$57
$61
2009 2010 2011 2012 2013
United States International
Motion PicturesIndustry Environment
CAGR
5.3%
4.0%
4.8%$102
$96$91
$87$85
WW Box Office, Home Entertainment and Digital
Revenues
($ in billions)
Source: PriceWaterhouseCoopers
• Growth of digital cinemas and increasing number of 3D releases expected to improve box office economics over time
• Industry production and marketing costs continue to grow
• Overall demand for home video product remains relatively strong, but method of consumption is the risk to studio margins -- Economic downturn has accelerated “trading down” to lower-margin rentals
• Growth of higher margin Blu-ray and digital is expected to only partially offset economic erosion from the decline of DVD
Motion Pictures remains a 4%-5% growth business
22
Motion PicturesFilm Slate Strategy
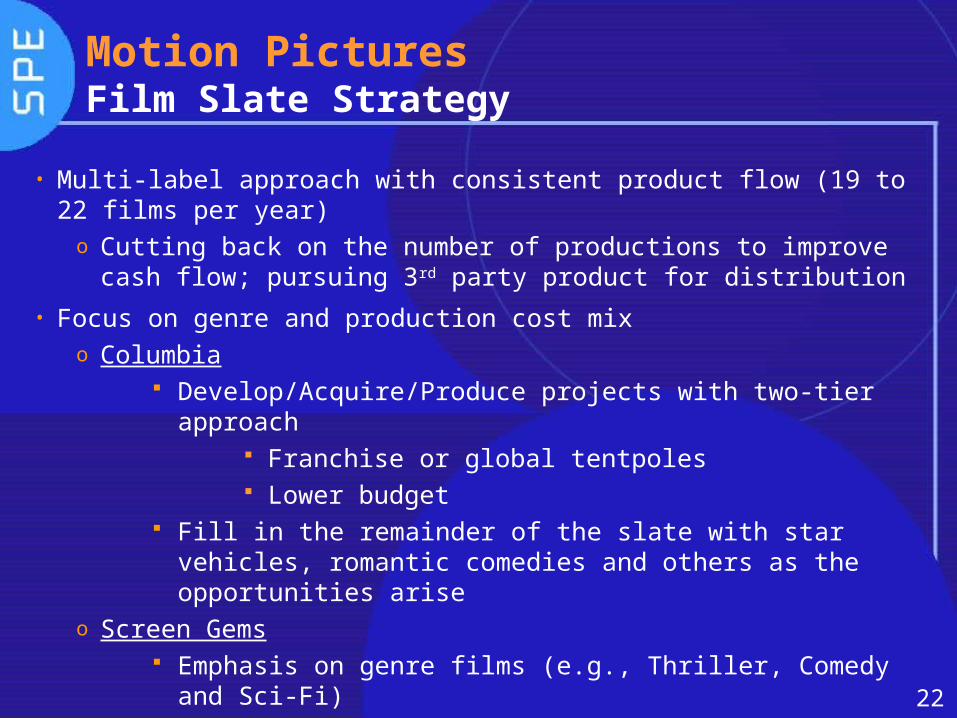
• Multi-label approach with consistent product flow (19 to 22 films per year)
o Cutting back on the number of productions to improve cash flow; pursuing 3rd party product for distribution
• Focus on genre and production cost mixo Columbia
Develop/Acquire/Produce projects with two-tier approach Franchise or global tentpoles Lower budget
Fill in the remainder of the slate with star vehicles, romantic comedies and others as the opportunities arise
o Screen Gems Emphasis on genre films (e.g., Thriller, Comedy and Sci-
Fi) Produce budget sensitive films (e.g., contained action,
lower talent deals) to maximize profitability

23
Motion PicturesFranchise Opportunities
• Numerous titles are in negotiation or active development with an eye toward production in the next few years
Masters of the Universe Spider-Man Men in Black Venom Ghostbusters Total Recall Goosebumps Bad Boys Ultraman Sinbad XXX Zombieland Mall Cop Pineapple Express
• “Talent Franchises/Brands” such as Will Smith and Adam Sandler offer additional opportunities
24
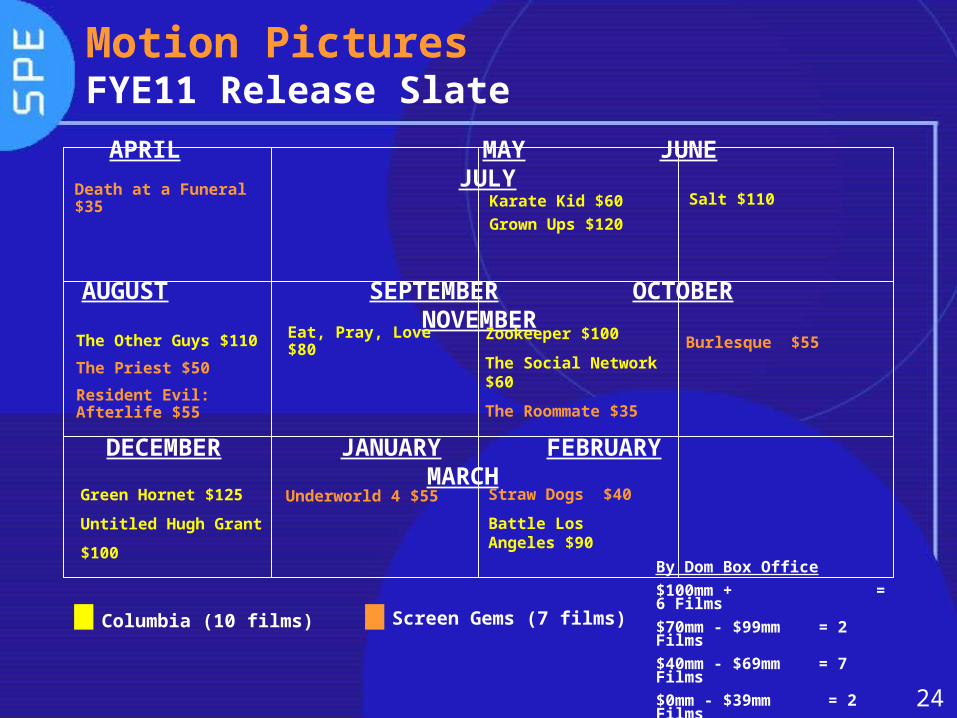
APRIL MAY JUNE JULY
DECEMBER JANUARY FEBRUARY MARCH
AUGUST SEPTEMBER OCTOBER NOVEMBER
Zookeeper $100
The Social Network $60
The Roommate $35
Karate Kid $60
Grown Ups $120
Salt $110
The Other Guys $110
The Priest $50
Resident Evil: Afterlife $55
Green Hornet $125
Untitled Hugh Grant
$100By Dom Box Office
$100mm + = 6 Films
$70mm - $99mm = 2 Films
$40mm - $69mm = 7 Films
$0mm - $39mm = 2 Films
Motion PicturesFYE11 Release Slate
Straw Dogs $40
Battle Los Angeles $90
Death at a Funeral $35
Screen Gems (7 films)
Underworld 4 $55
Burlesque $55Eat, Pray, Love $80
Columbia (10 films)
25
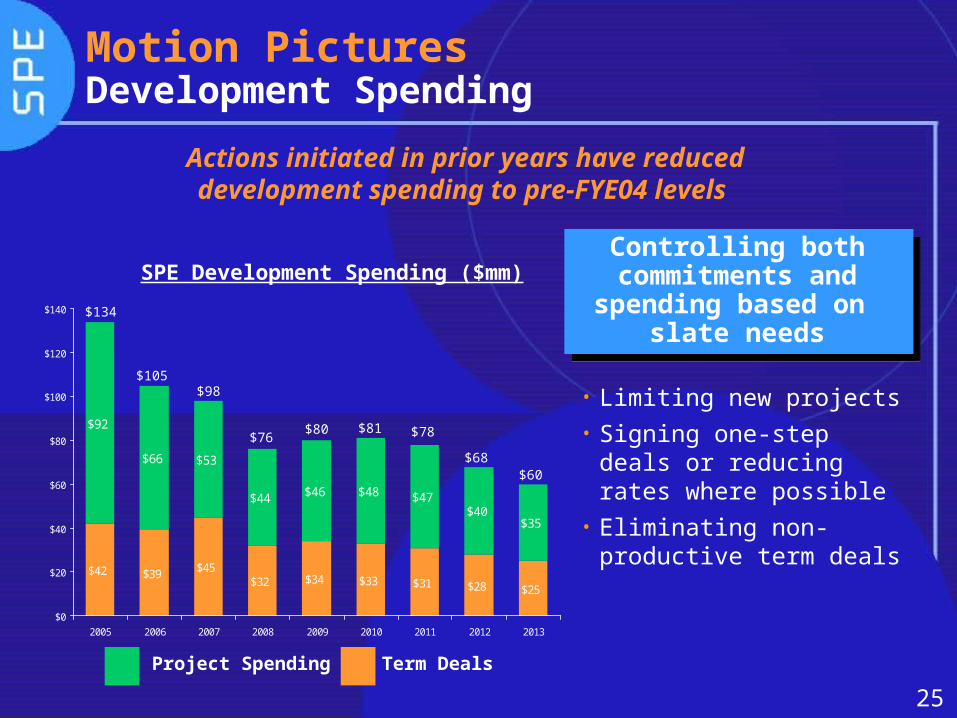
$42 $39 $45$32 $34 $33 $31 $28 $25
$92
$66 $53
$44 $46 $48 $47$40
$35
$0
$20
$40
$60
$80
$100
$120
$140
2005 2006 2007 2008 2009 2010 2011 2012 2013
Motion PicturesDevelopment Spending
Project Spending Term Deals
• Limiting new projects• Signing one-step deals or
reducing rates where possible
• Eliminating non-productive term deals
Controlling both commitments and
spending based on slate needs
SPE Development Spending ($mm)
$98
$134
$76
$105
$80 $81 $78
Actions initiated in prior years have reduceddevelopment spending to pre-FYE04 levels
$68$60
26
Motion PicturesReduce Production Costs
• Negotiating post break back-end deals and reduced upfront fees for talent
o All 6 films committed in FYE10 have been post cash break deals
o Have successfully reduced upfront compensation and renegotiated backend deals prior to starting principal photography (e.g., Spider-Man 4, How Do You Know, Green Hornet)
• Monitoring global incentives to capitalize on the opportunities to lower production cost
• Exploitation of tax-based incentives on a worldwide basis will save approximately $87mm on FYE11 releases
o All but 3 films on FYE11 calendar will receive a tax incentive of some sort
• Work closely with Physical Production to generate cost efficiencies and minimize cost overruns
27
MEDIA• Continuing to capitalize on global economic downturn and market softness to achieve greater media cost savings
•Upfront negotiations varied by outlets, yielding a 4% average rate reduction
•Adjusted Sony Media Mix to maximize exposure to our target audiences using less advertising dollars
• Maintained integrity of added value promotions with significantly reduced dollar volume
Motion PicturesMarketing and Distribution Spend
Strategy for Achieving Cost Savings
28
BASICS•Eliminate teaser campaigns where possible
•Negotiate flat fee deals with creative vendors
•Consolidate vendors globally to reduce production / distribution costs
•Expand digital distribution of TV spots, eliminating production and shipping of thousands of tapes
•Eliminate large premieres; have smaller parties when we do have these events, and limit travel expenses
•Eliminate junkets where possible and collaborate with other studios for shared junkets to reduce costs
Motion PicturesMarketing and Distribution Spend
Strategy for Achieving Cost Savings
29
• Target 5 to 6 lower budget titles per year
• 2 action/thrillers, 2 thriller/horrors, 2 comedies or other
• Producing films which are budget sensitive (e.g., contained action, lower talent deals) to maximize profitability
• Target audiences from the outset (e.g., young, urban, wide-appeal with an name cast or international appeal)
• Continue to opportunistically co-produce films with strategic partners (e.g., Constantin, Lakeshore, Vertigo and others)
• Continue to produce existing franchises (e.g., Underworld and Resident Evil) along with creating new franchises (e.g., Legion, Priest, and Skank Robbers)
• Explore full slate co-financing opportunities
Motion PicturesScreen Gems
Improve margins on new releases through a continued emphasis
on genre films coupled with a new focus on action films
30
MRP Assumptions
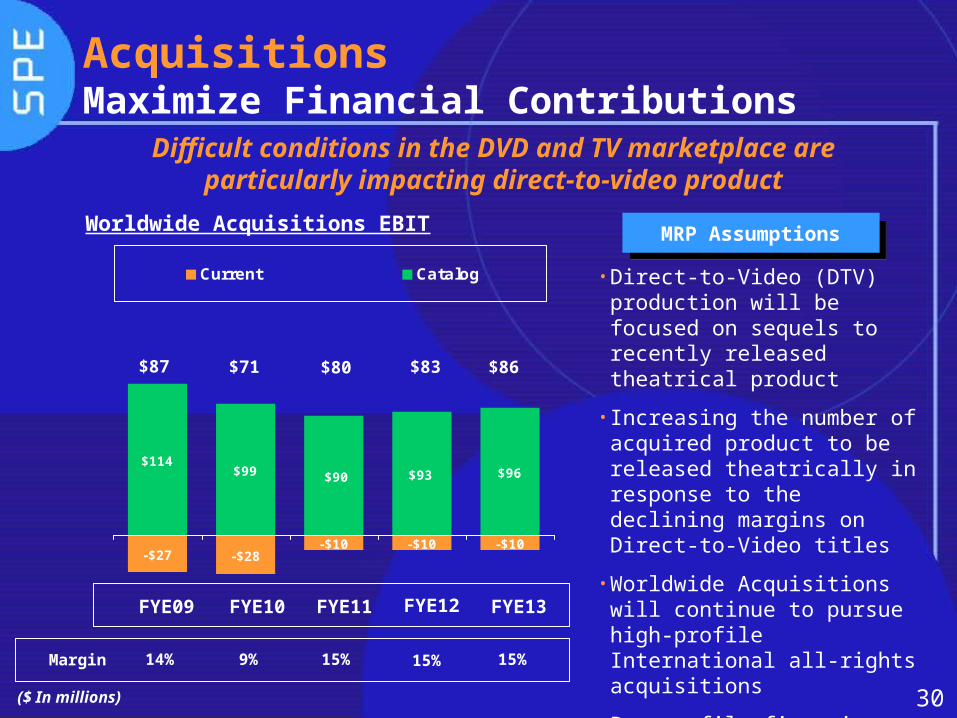
AcquisitionsMaximize Financial Contributions
•Direct-to-Video (DTV) production will be focused on sequels to recently released theatrical product
• Increasing the number of acquired product to be released theatrically in response to the declining margins on Direct-to-Video titles
•Worldwide Acquisitions will continue to pursue high-profile International all-rights acquisitions
•Pursue film financing opportunities
Difficult conditions in the DVD and TV marketplace are particularly impacting direct-to-video product
-$27 -$28-$10 -$10 -$10
$114$99 $96$93$90
Current Catalog
Worldwide Acquisitions EBIT
$86$80$71$87 $83
FYE09 FYE10 FYE11 FYE13FYE12
($ In millions)
Margin 14% 9% 15% 15%15%
31
Motion Pictures Digital Cinema
Rollout Update• 14,000 digital screens estimated to be installed worldwide by
the end of 2010 with 21,000 projected by 2011
• Tighter access to capital has made it difficult for deployment entities to gain financing for the installation of the digital screens; accordingly, exhibitors worldwide have begun to explore self-financing for the deployment of digital equipment
• The push for 3D content continues to drive the rollout of digital installations
• Digital 3D is now the standard of at least 14 3D feature releases from Hollywood slated for next year (SPE will be releasing Resident Evil 4 in August 2010)

32
Divisional DetailsHome EntertainmentHome Entertainment

33
Improve Economics of Existing Business• Blu-ray: Drive mass market adoption to encourage consumers
to “trade up” to HD• Organization: Rationalize global organizational structure
Pursue Growth Opportunities• Retail Expansion: Maximize channel placement to create
impulse occasions • Product Innovation: Lead industry in new video formats and
releasing strategies
Pursue Sony United Collaboration• Commercial: Continue collaboration with SEL & SCE on
sales/marketing initiatives• Back Office: Consolidate operations across Sony divisions,
e.g., SPHE, SME, DADC
Home EntertainmentKey Strategies
34
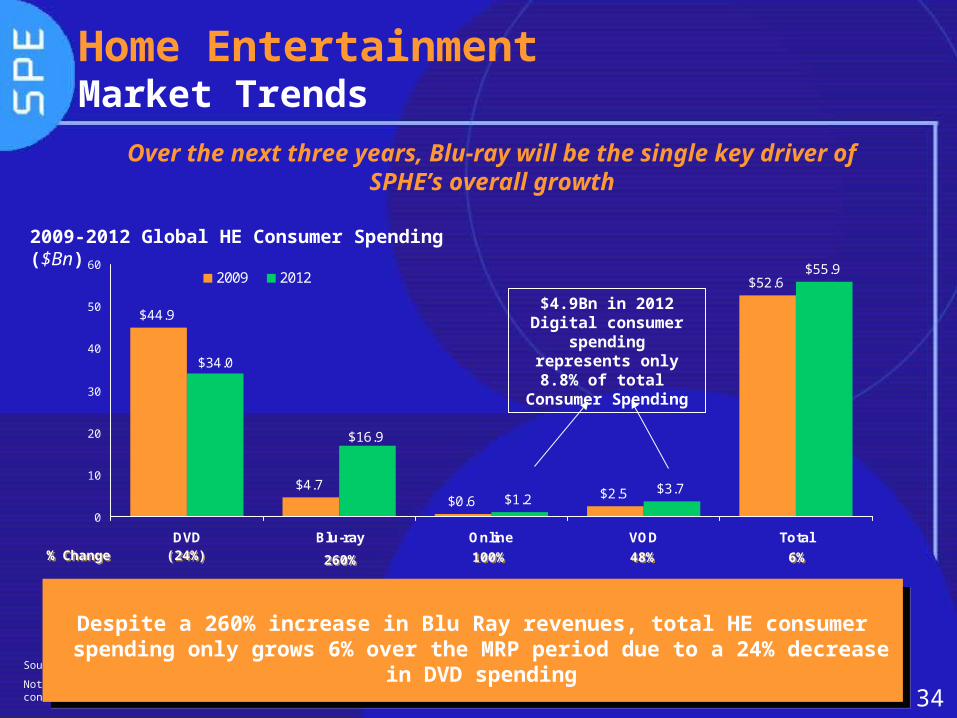
Over the next three years, Blu-ray will be the single key driver of SPHE’s overall growth
$44.9
$4.7$0.6
$2.5
$52.6
$1.2$3.7
$55.9
$16.9
$34.0
0
10
20
30
40
50
60
DVD Blu-ray Online VOD Total
2009 2012
2009-2012 Global HE Consumer Spending ($Bn)
% Change% Change (24%)(24%) 260%260% 100%100% 48%48% 6%6%
Source: Screen Digest,( July 2009)
Notes: VOD/PPV - total on-demand movie consumer revenues / On-line - transactional movie retail and rental download consumer revenues
Despite a 260% increase in Blu Ray revenues, total HE consumer spending only grows 6% over the MRP period due to a 24% decrease
in DVD spending
Despite a 260% increase in Blu Ray revenues, total HE consumer spending only grows 6% over the MRP period due to a 24% decrease
in DVD spending
Home EntertainmentMarket Trends
$4.9Bn in 2012 Digital consumer
spending represents only 8.8% of total
Consumer Spending
35
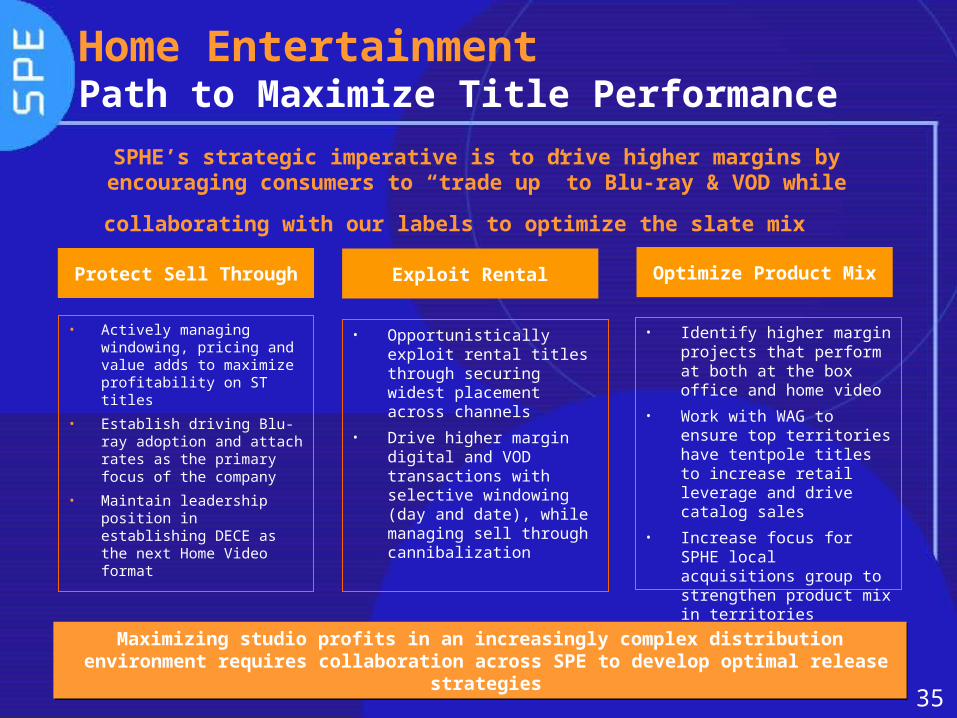
Protect Sell Through Exploit Rental Optimize Product Mix
SPHE’s strategic imperative is to drive higher margins by encouraging consumers to “trade up” to Blu-ray & VOD while
collaborating with our labels to optimize the slate mix
• Opportunistically exploit rental titles through securing widest placement across channels
• Drive higher margin digital and VOD transactions with selective windowing (day and date), while managing sell through cannibalization
• Actively managing windowing, pricing and value adds to maximize profitability on ST titles
• Establish driving Blu-ray adoption and attach rates as the primary focus of the company
• Maintain leadership position in establishing DECE as the next Home Video format
• Identify higher margin projects that perform at both at the box office and home video
• Work with WAG to ensure top territories have tentpole titles to increase retail leverage and drive catalog sales
• Increase focus for SPHE local acquisitions group to strengthen product mix in territories
Maximizing studio profits in an increasingly complex distribution environment requires collaboration across SPE to develop optimal release strategies
Maximizing studio profits in an increasingly complex distribution environment requires collaboration across SPE to develop optimal release strategies
Home EntertainmentPath to Maximize Title Performance

36
Home EntertainmentSummary of Home Entertainment Contribution
Actions
$830 $826$1,041
$1,141
$206 $248
$261 $173
$215$219
$53$46
$41
$245$255
$40
FYE10 FYE11 FYE12 FYE13
New & Recent Flow / Library Acq TV
$1,655$1,542
Worldwide HE Contribution
($ In millions)
$1,293$1,350
Aggressive steps must be taken to grow contributions in the current market
• HE is projecting to grow Flow/Library during the MRP period at a 7.4% CAGR despite retail space constraints and pricing pressures
o Flow/Library year-over-year growth is projected at 20% in FYE10/FYE11 driven by digital and blu-ray
o Digital Flow/Library is expected to grow by 64%, 29% and 17% in FYE11, FYE12 and FYE13, respectively; Blu-ray Flow/Library is expected to grow by 63%, 9% and 15% in FYE11, FYE12, and FYE13, respectively
• The $215m increase in New & Recent in FYE12 is driven by Spider-Man 4
37
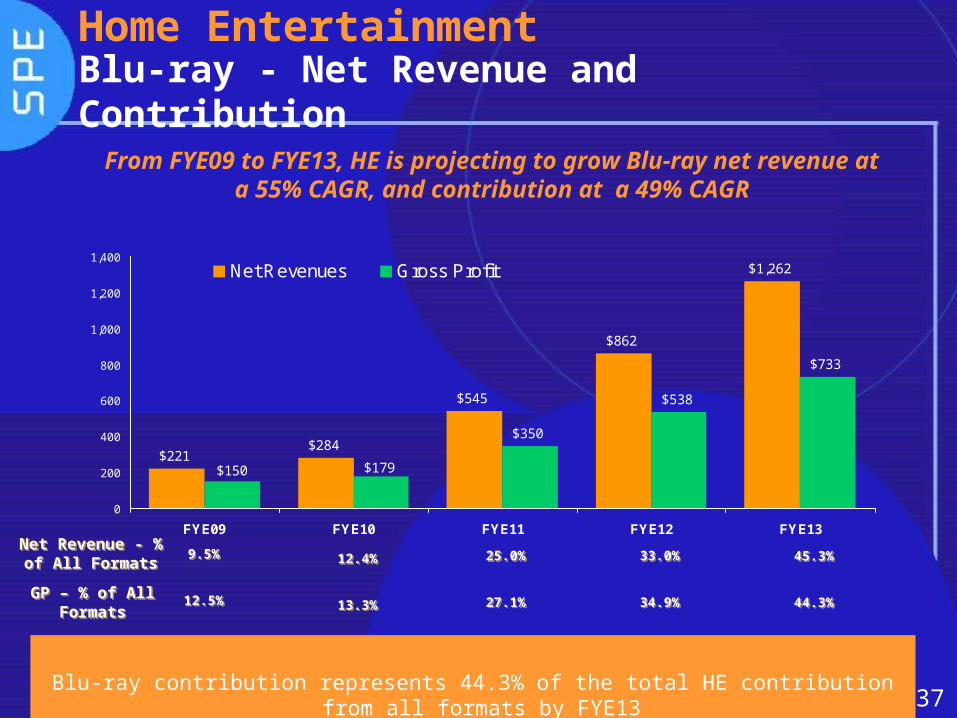
From FYE09 to FYE13, HE is projecting to grow Blu-ray net revenue at a 55% CAGR, and contribution at a 49%
CAGR
$221$284
$545
$862
$1,262
$350
$538
$733
$179$150
0
200
400
600
800
1,000
1,200
1,400
FYE09 FYE10 FYE11 FYE12 FYE13
Net Revenues Gross Profit
GP – % of All Formats
GP – % of All Formats
12.5%12.5% 13.3%13.3% 27.1%27.1% 34.9%34.9% 44.3%44.3%
Blu-ray contribution represents 44.3% of the total HE contribution from all formats by FYE13
Home EntertainmentBlu-ray - Net Revenue and Contribution
Net Revenue - % of All Formats
Net Revenue - % of All Formats 9.5%9.5% 12.4%12.4% 25.0%25.0% 33.0%33.0% 45.3%45.3%

38
Divisional DetailsTelevisionTelevision
39
Improve Economics of Existing Businesses
• Reduce scripted new series investment and development spending by becoming more targeted and focused on development efforts, including worldwide format strategies
• Improve SET India’s rating and financial position, facilitate minority partner change
• Broaden Animax brand and reinvigorate the SET brand in Latin America
Pursue Growth Opportunities
• Develop additional programs with Harpo utilizing The Oprah Winfrey Show and The Dr. Oz Show as launch platforms
• Accelerate or create new windows (e.g. Day/Date with DVD release)
• Continue to invest and expand in key and emerging markets with our branded networks, TV series development and production capabilities, and distribution sales
• Grow MSM India IPL Cricket ad sales season-over-season
Pursue Sony United Collaboration
• Become the primary ad sales organization across Sony brand and platforms
• Utilize development, production and programming expertise to create content for PS3
TelevisionKey Strategies
40
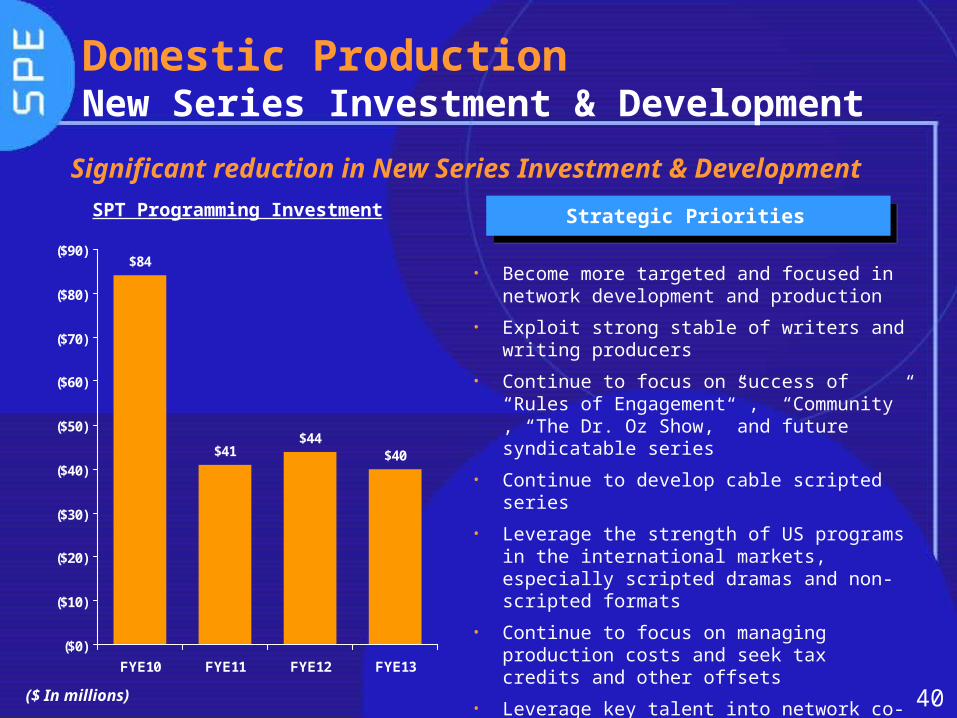
Domestic ProductionNew Series Investment & Development
• Become more targeted and focused in network development and production
• Exploit strong stable of writers and writing producers
• Continue to focus on success of “Rules of Engagement” , “Community” , “The Dr. Oz Show,” and future syndicatable series
• Continue to develop cable scripted series
• Leverage the strength of US programs in the international markets, especially scripted dramas and non-scripted formats
• Continue to focus on managing production costs and seek tax credits and other offsets
• Leverage key talent into network co-productions from the development stage
• Launch future shows with Harpo
SPT Programming Investment
($ In millions)
Strategic Priorities
$84
$41$44
$40
($0)
($10)
($20)
($30)
($40)
($50)
($60)
($70)
($80)
($90)
FYE10 FYE11 FYE12 FYE13
Significant reduction in New Series Investment & Development
41
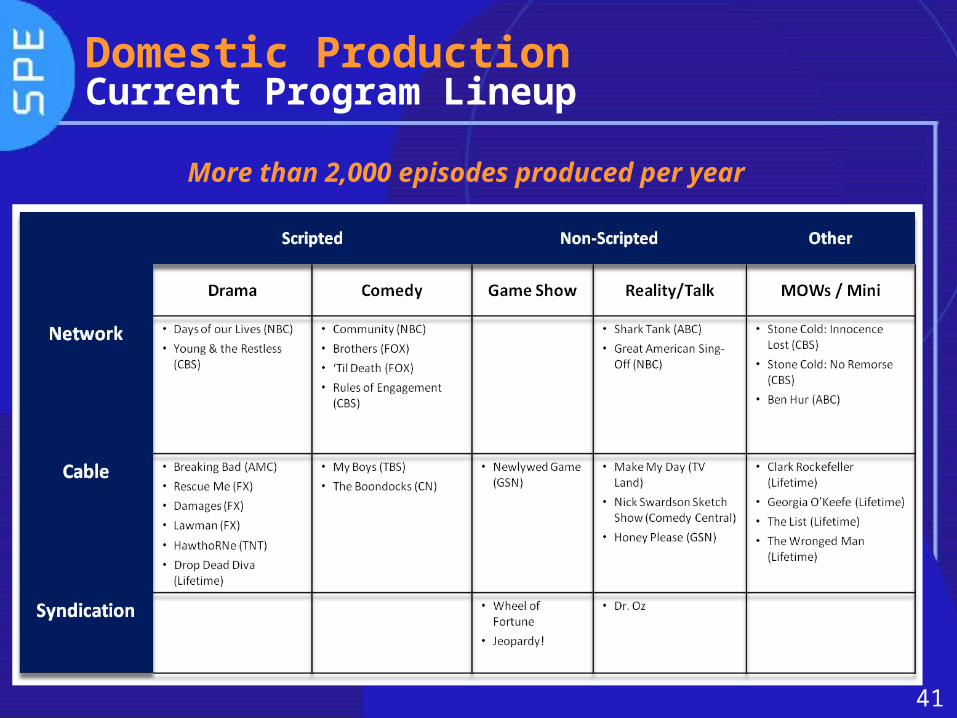
Domestic ProductionCurrent Program Lineup
More than 2,000 episodes produced per year
42
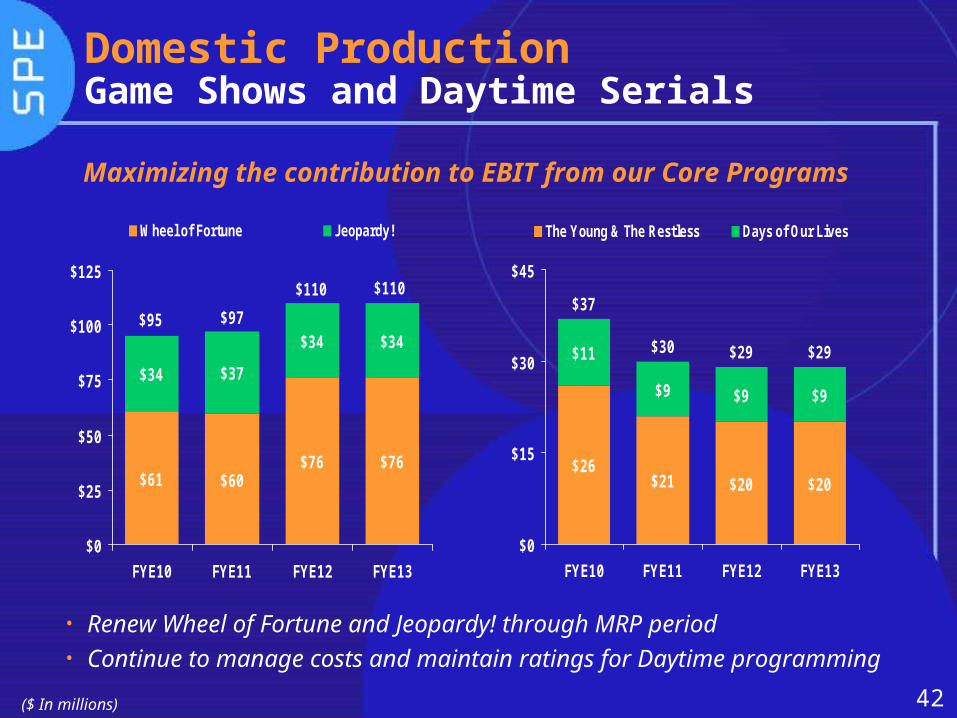
• Renew Wheel of Fortune and Jeopardy! through MRP period• Continue to manage costs and maintain ratings for Daytime
programming
Domestic ProductionGame Shows and Daytime Serials
($ In millions)
$26$21 $20 $20
$11
$9 $9 $9
$37
$30 $29 $29
$0
$15
$30
$45
FYE10 FYE11 FYE12 FYE13
The Young & The Restless Days of Our Lives
$61 $60$76 $76
$37
$34 $34
$34
$110 $110
$97 $95
$0
$25
$50
$75
$100
$125
FYE10 FYE11 FYE12 FYE13
Wheel of Fortune Jeopardy!
Maximizing the contribution to EBIT from our Core Programs
43
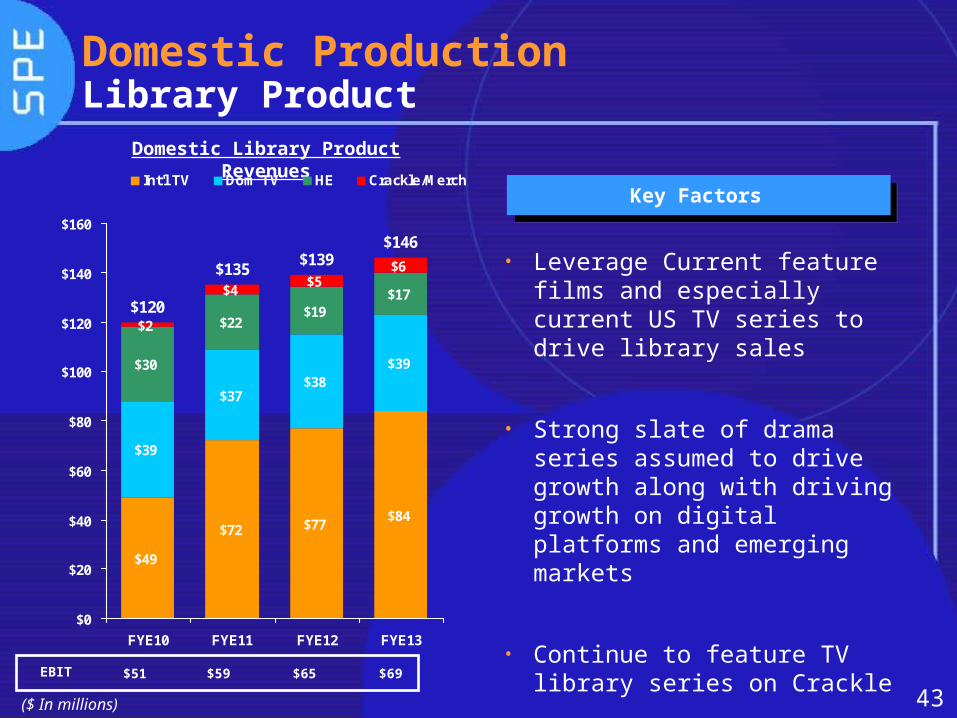
Domestic ProductionLibrary Product
• Leverage Current feature films and especially current US TV series to drive library sales
• Strong slate of drama series assumed to drive growth along with driving growth on digital platforms and emerging markets
• Continue to feature TV library series on Crackle
Domestic Library Product Revenues
($ In millions)
Key Factors
$51 $59 $65 $69EBIT
$49
$72 $77$84
$39
$37$38
$39$30
$22$19
$17
$2
$4$5
$6
$120
$135$139
$146
$0
$20
$40
$60
$80
$100
$120
$140
$160
FYE10 FYE11 FYE12 FYE13
Int'l TV Dom TV HE Crackle/Merch
44
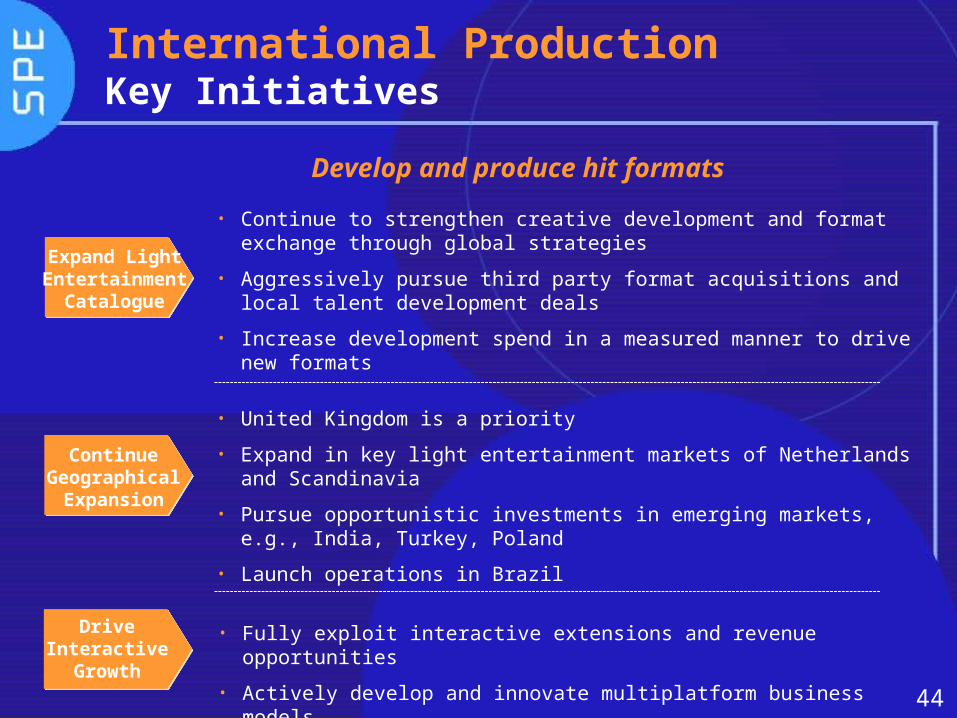
Expand Light Entertainment
Catalogue
International ProductionKey Initiatives
Continue Geographical
Expansion
Drive Interactive
Growth
• Continue to strengthen creative development and format exchange through global strategies
• Aggressively pursue third party format acquisitions and local talent development deals
• Increase development spend in a measured manner to drive new formats
• United Kingdom is a priority
• Expand in key light entertainment markets of Netherlands and Scandinavia
• Pursue opportunistic investments in emerging markets, e.g., India, Turkey, Poland
• Launch operations in Brazil
• Fully exploit interactive extensions and revenue opportunities
• Actively develop and innovate multiplatform business models
Develop and produce hit formats
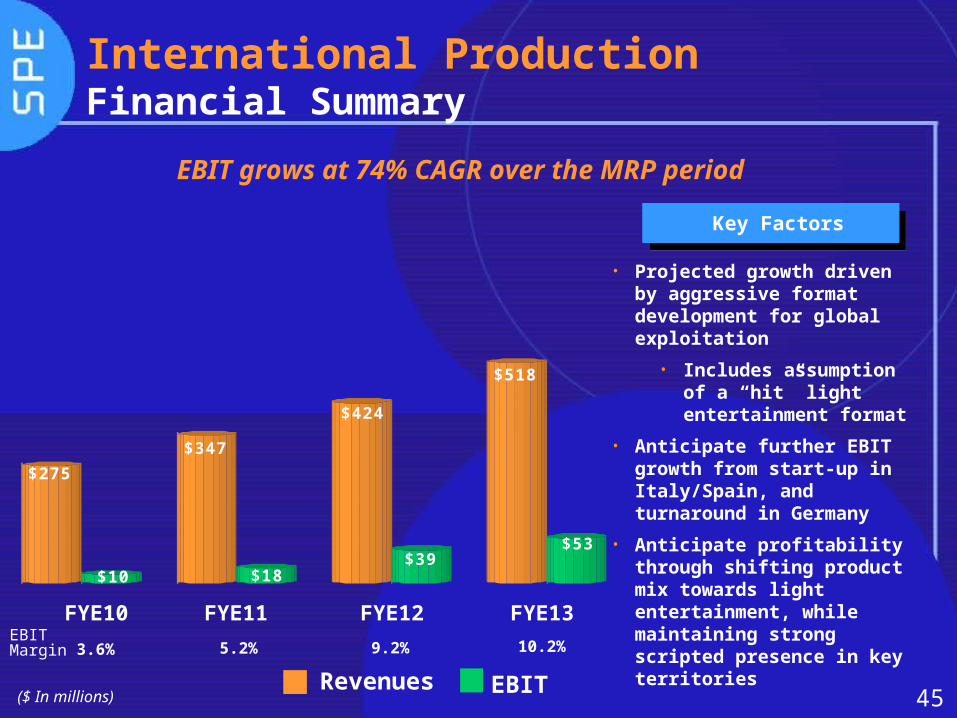
45EBITRevenues
FYE11 FYE12 FYE13FYE10
($ In millions)
International ProductionFinancial Summary
• Projected growth driven by aggressive format development for global exploitation
• Includes assumption of a “hit” light entertainment format
• Anticipate further EBIT growth from start-up in Italy/Spain, and turnaround in Germany
• Anticipate profitability through shifting product mix towards light entertainment, while maintaining strong scripted presence in key territories
Key Factors
$275
$10
$347
$18
$424
$39
$518
$53
EBIT grows at 74% CAGR over the MRP period
3.6% 5.2% 9.2% 10.2%EBIT Margin

46($ In millions)
International Production2waytraffic - Financial Summary
Revenues grow at 40% CAGR over the MRP
$24$36
$46
$196
$162
$111
$72
$18$33
$22$7$1
FYE10 FYE11 FYE12 FYE13
Revenues
Profit Contribution
EBITDA
• Although financial performance is less than expected, the structure of the purchase of 2waytraffic has allowed expected investment returns to remain very near originally expected
• The acquisitions of 2waytraffic and Embassy Row have provided the foundation of a strong light entertainment business for SPE
• 2waytraffic owns one of the most successful game show formats, “Who Wants to Be a Millionaire” on which the President of Embassy Row serves as Executive Producer
• Embassy Row and 2waytraffic are co-developing SPE’s library formats as well as formats acquired or created by the other (e.g. Make My Day, Newlywed Game, Sing Off, Shark Tank)
47
Domestic Distribution / Ad SalesMarket Environment
Distribution -
• Market conditions create an opportunity to expand our first-run business
o Although local stations are facing economic challenges, they still have an appetite for quality programming
o Competitive product in the marketplace has declined
• Cable networks increasingly shifting programming dollars to original content, creating downward pressure on prices for acquired film and TV product
• Cable and Satellite are requiring day-and-date commitments to secure premium shelf space and marketing
Ad Sales -
• Recessionary economy is contributing to a weaker advertising market
• 09/10 season upfront sales experienced price declines and lower volume, future seasons expected to slowly rebound
• Digital ad market continues to grow; however, rate of growth slows through future years
48
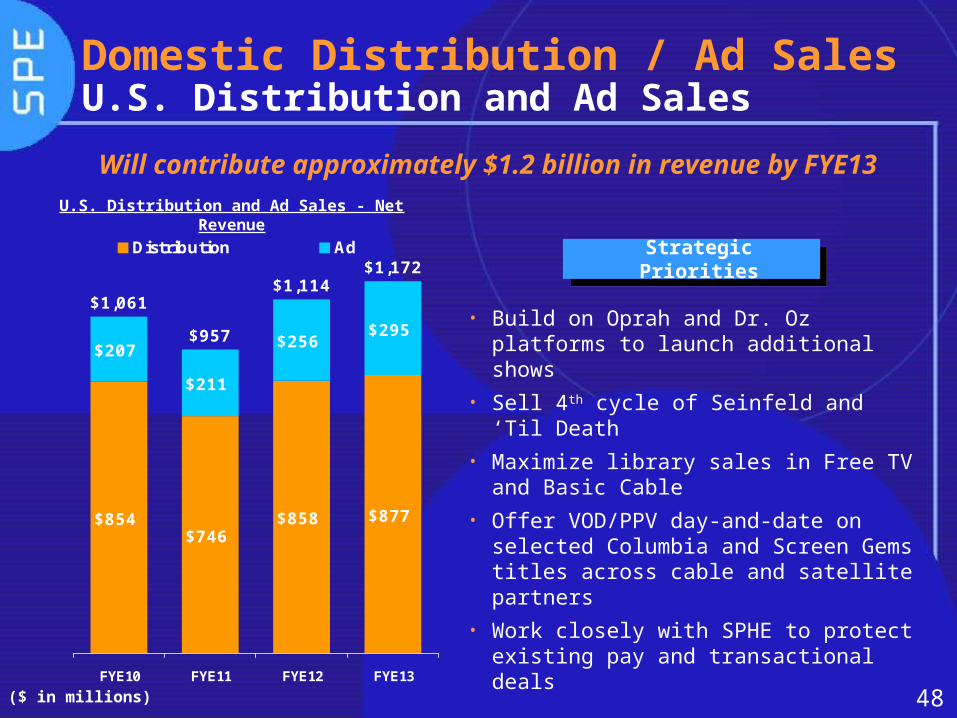
• Build on Oprah and Dr. Oz platforms to launch additional shows
• Sell 4th cycle of Seinfeld and ‘Til Death• Maximize library sales in Free TV and
Basic Cable• Offer VOD/PPV day-and-date on
selected Columbia and Screen Gems titles across cable and satellite partners
• Work closely with SPHE to protect existing pay and transactional deals
($ in millions)
Domestic Distribution / Ad SalesU.S. Distribution and Ad Sales
Will contribute approximately $1.2 billion in revenue by FYE13
U.S. Distribution and Ad Sales - Net Revenue
$854$746
$858 $877
$207
$211
$256$295
$1,061
$957
$1,114$1,172
FYE10 FYE11 FYE12 FYE13
Distribution AdStrategic Priorities
49
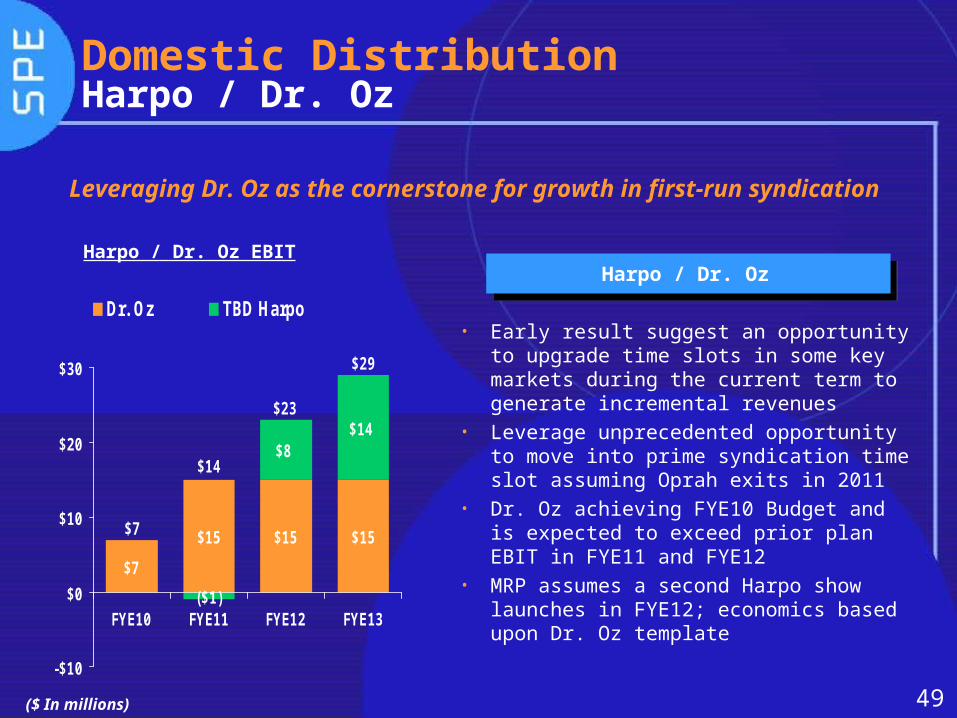
Leveraging Dr. Oz as the cornerstone for growth in first-run syndication
Domestic DistributionHarpo / Dr. Oz
• Early result suggest an opportunity to upgrade time slots in some key markets during the current term to generate incremental revenues
• Leverage unprecedented opportunity to move into prime syndication time slot assuming Oprah exits in 2011
• Dr. Oz achieving FYE10 Budget and is expected to exceed prior plan EBIT in FYE11 and FYE12
• MRP assumes a second Harpo show launches in FYE12; economics based upon Dr. Oz template
Harpo / Dr. Oz
($ In millions)
Harpo / Dr. Oz EBIT
$15 $15
($1)
$8$14
$15
$7
$29
$23
$14
$7
-$10
$0
$10
$20
$30
FYE10 FYE11 FYE12 FYE13
Dr. Oz TBD Harpo
50
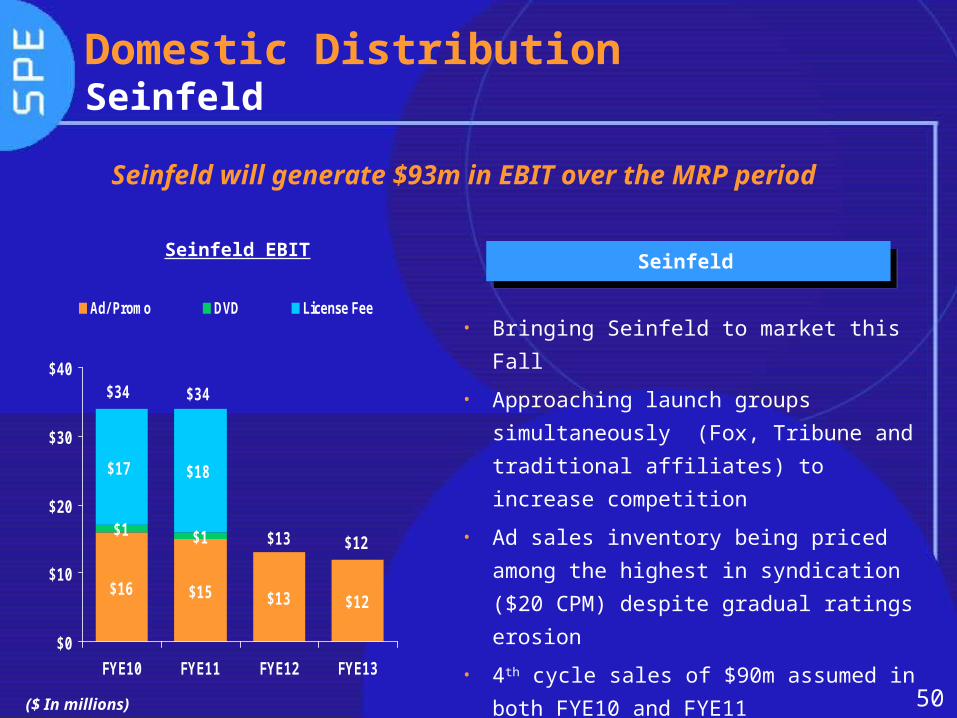
Seinfeld will generate $93m in EBIT over the MRP period
Domestic DistributionSeinfeld
• Bringing Seinfeld to market this Fall
• Approaching launch groups
simultaneously (Fox, Tribune and
traditional affiliates) to increase
competition
• Ad sales inventory being priced among
the highest in syndication ($20 CPM)
despite gradual ratings erosion
• 4th cycle sales of $90m assumed in both
FYE10 and FYE11
Seinfeld
($ In millions)
Seinfeld EBIT
$16 $15 $13 $12
$1 $1
$18$17
$12$13
$34$34
$0
$10
$20
$30
$40
FYE10 FYE11 FYE12 FYE13
Ad/ Promo DVD License Fee
51
International DistributionMarket Environment
• More cautious and targeted investments by broadcasters due to global recessionary environment
• One-hour dramas have become key differentiator for studios to secure top dollar feature film and TV output deals
• Local language products are growth drivers (e.g., telenovelas for Latin America, TV dramas, local sitcoms and soaps for Russia/CIS and Asian features)
• Proliferation of channels across an increasingly fragmented customer base diminishes ability to drive large deals
• Low single digit growth (2-3%) is expected in key markets in the next year(1), with some economic recovery increasing growth modestly starting in FYE12
(1) Source: Price Waterhouse Coopers 2009-2013 Global Entertainment and Media report.
52
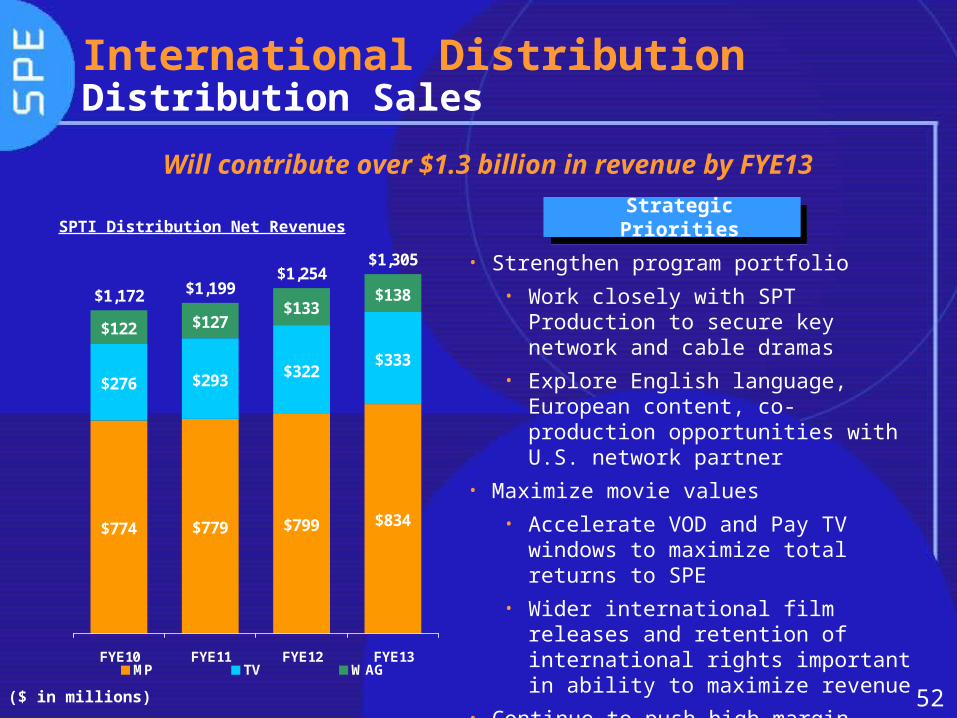
• Strengthen program portfolio• Work closely with SPT Production to
secure key network and cable dramas
• Explore English language, European content, co-production opportunities with U.S. network partner
• Maximize movie values• Accelerate VOD and Pay TV
windows to maximize total returns to SPE
• Wider international film releases and retention of international rights important in ability to maximize revenue
• Continue to push high-margin library sales
• Expand SPT’s presence in select emerging markets, e.g., Middle East, Africa
($ in millions)
International DistributionDistribution Sales
Will contribute over $1.3 billion in revenue by FYE13
SPTI Distribution Net Revenues
$834 $799$779 $774
$333$322 $293$276
$138$133
$127 $122
$1,172 $1,199$1,254
$1,305
FYE10 FYE11 FYE12 FYE13MP TV WAG
Strategic Priorities
53
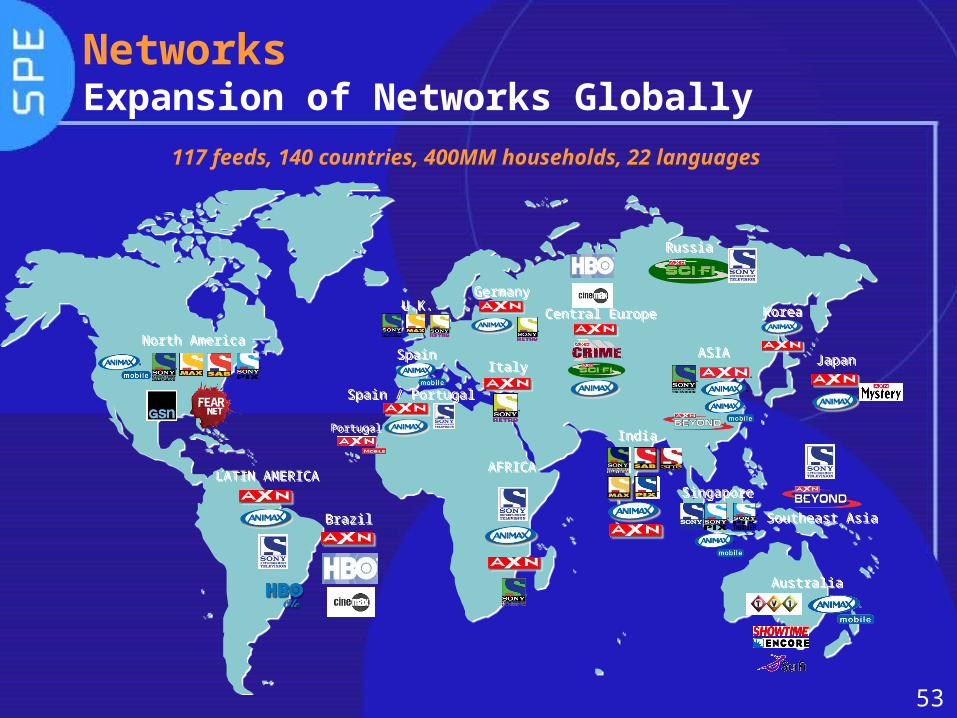
NetworksExpansion of Networks Globally
KoreaKorea
LATIN AMERICALATIN AMERICA
Central EuropeCentral Europe
North AmericaNorth America
BrazilBrazil
SpainSpain
Spain / PortugalSpain / Portugal
RussiaRussia
SingaporeSingapore
AFRICAAFRICA
Southeast AsiaSoutheast Asia
JapanJapanASIAASIA
AustraliaAustralia
U.K.U.K.
IndiaIndia
GermanyGermany
ItalyItaly
PortugalPortugal
117 feeds, 140 countries, 400MM households, 22 languages
54
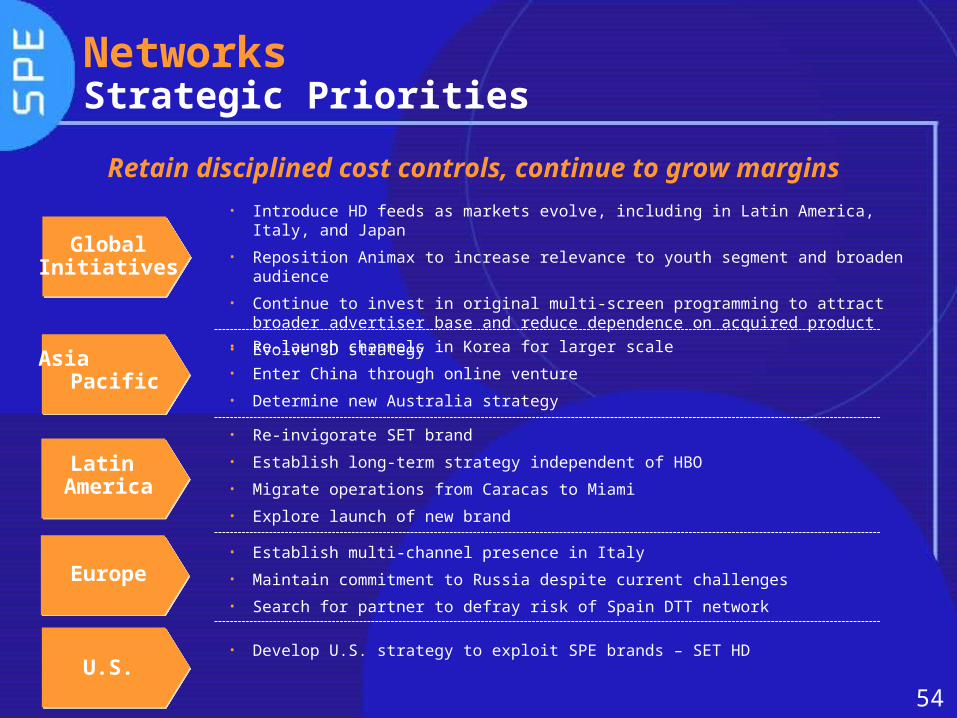
Global Initiatives
Latin America
Europe
U.S.
• Re-launch channels in Korea for larger scale
• Enter China through online venture
• Determine new Australia strategy
• Re-invigorate SET brand
• Establish long-term strategy independent of HBO
• Migrate operations from Caracas to Miami
• Explore launch of new brand
• Establish multi-channel presence in Italy
• Maintain commitment to Russia despite current challenges
• Search for partner to defray risk of Spain DTT network
• Develop U.S. strategy to exploit SPE brands – SET HD
Asia Pacific
• Introduce HD feeds as markets evolve, including in Latin America, Italy, and Japan
• Reposition Animax to increase relevance to youth segment and broaden audience
• Continue to invest in original multi-screen programming to attract broader advertiser base and reduce dependence on acquired product
• Evolve 3D strategy
Retain disciplined cost controls, continue to grow margins
NetworksStrategic Priorities
55
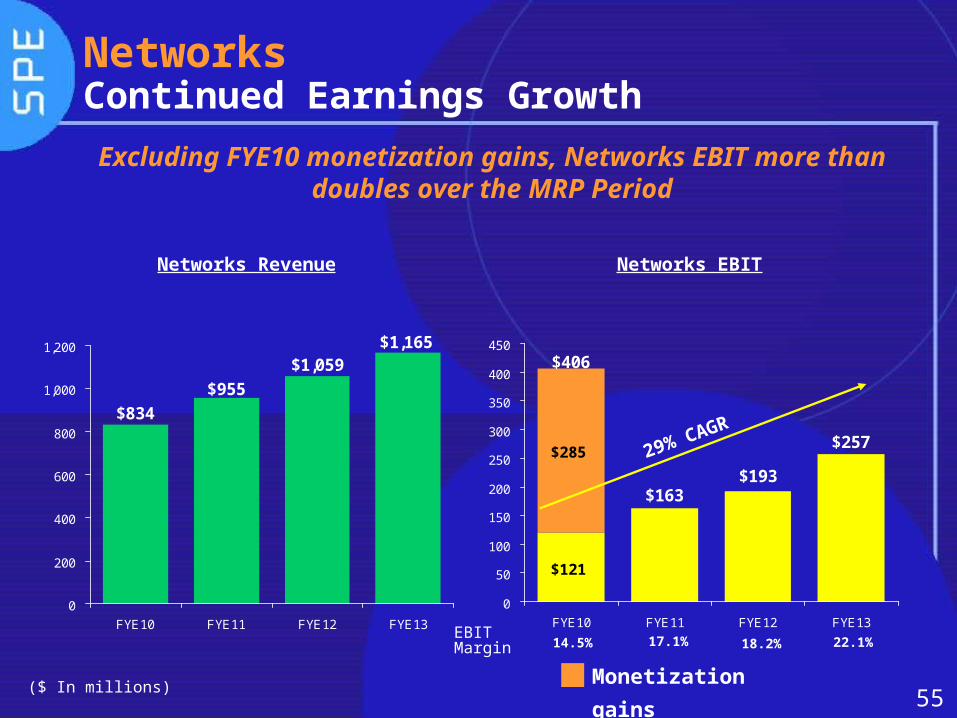
NetworksContinued Earnings Growth
Excluding FYE10 monetization gains, Networks EBIT more than doubles over the MRP Period
($ In millions)
Networks Revenue Networks EBIT
Monetization
gains
$1,165$1,059
$955
$834
0
200
400
600
800
1,000
1,200
FYE10 FYE11 FYE12 FYE13
$121
$285$257
$193$163
$406
0
50
100
150
200
250
300
350
400
450
FYE10 FYE11 FYE12 FYE13
29% CAGR
14.5% 17.1% 18.2% 22.1%EBIT Margin
56
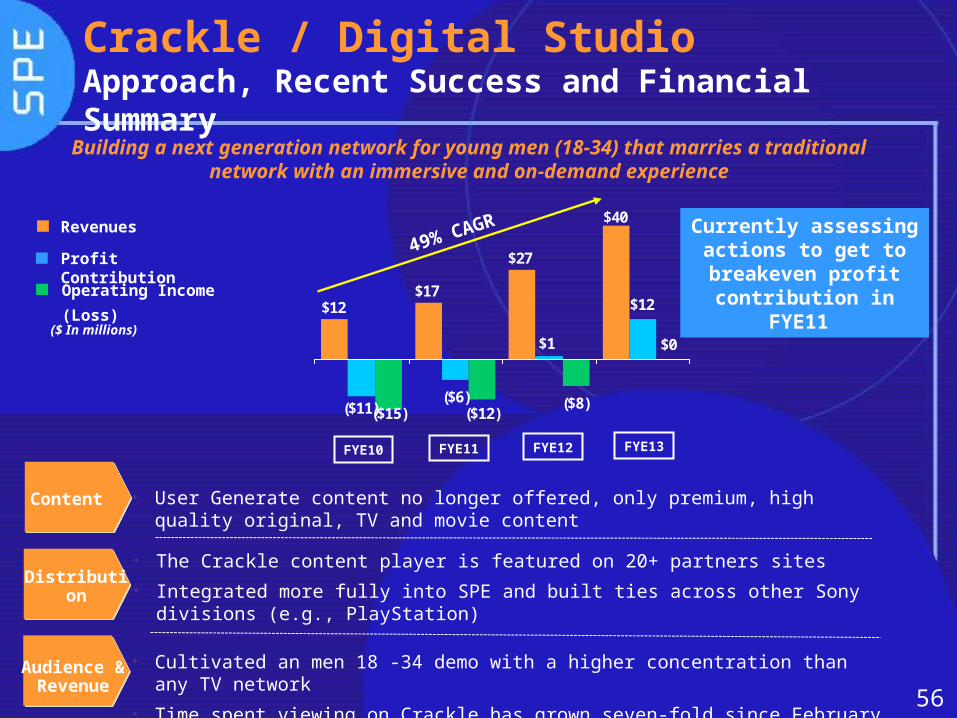
$12$17
$27
$40
($11)($6)
$1
$12
($15) ($12)($8)
$0($ In millions)
Crackle / Digital StudioApproach, Recent Success and Financial Summary
FYE11 FYE12 FYE13FYE10
Audience & Revenue
Distribution
• User Generate content no longer offered, only premium, high quality original, TV and movie content
• The Crackle content player is featured on 20+ partners sites
• Integrated more fully into SPE and built ties across other Sony divisions (e.g., PlayStation)
• Cultivated an men 18 -34 demo with a higher concentration than any TV network
• Time spent viewing on Crackle has grown seven-fold since February ‘09
Content
Building a next generation network for young men (18-34) that marries a traditional network with an immersive and on-demand experience
Revenues
Operating Income
(Loss)
Profit Contribution
49% CAGR Currently assessing
actions to get to breakeven profit contribution in
FYE11
57
Divisional DetailsDigital ProductionDigital Production
58
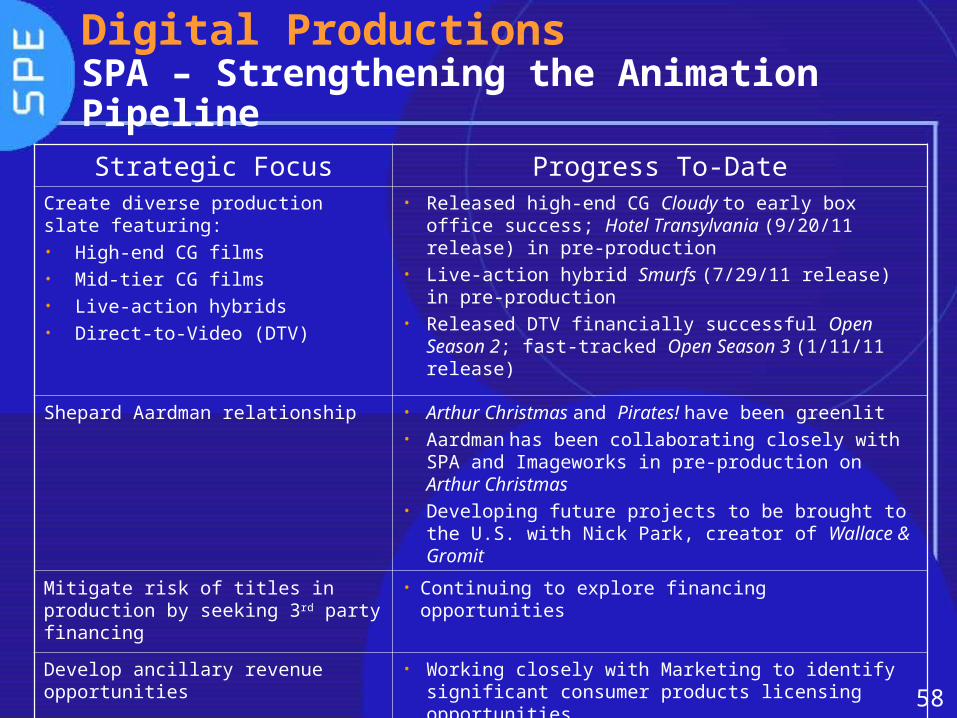
Strategic Focus Progress To-DateCreate diverse production slate featuring:• High-end CG films• Mid-tier CG films• Live-action hybrids• Direct-to-Video (DTV)
• Released high-end CG Cloudy to early box office success; Hotel Transylvania (9/20/11 release) in pre-production
• Live-action hybrid Smurfs (7/29/11 release) in pre-production
• Released DTV financially successful Open Season 2; fast-tracked Open Season 3 (1/11/11 release)
Shepard Aardman relationship • Arthur Christmas and Pirates! have been greenlit• Aardman has been collaborating closely with SPA
and Imageworks in pre-production on Arthur Christmas
• Developing future projects to be brought to the U.S. with Nick Park, creator of Wallace & Gromit
Mitigate risk of titles in production by seeking 3rd party financing
• Continuing to explore financing opportunities
Develop ancillary revenue opportunities
• Working closely with Marketing to identify significant consumer products licensing opportunities
Digital ProductionsSPA – Strengthening the Animation Pipeline

59
Digital ProductionsSPA - Capitalizing on Franchise Opportunities
• Even modestly successful theatrical CG animated films can become profitable franchises
• As a result of the strong performance of the direct-to-video (DTV) release of Open Season 2, profitability of the Open Season franchise is approximately $40m (10% margin)
o An additional $8m of gross profit anticipated from the from the DTV release of Open Season 3 in January 2011
• DTVs can also be opportunistically released theatrically overseas, which also enhances their home entertainment performance
• Cloudy with a Chance of Meatballs is the next property to be considered for DTV or theatrical release
60
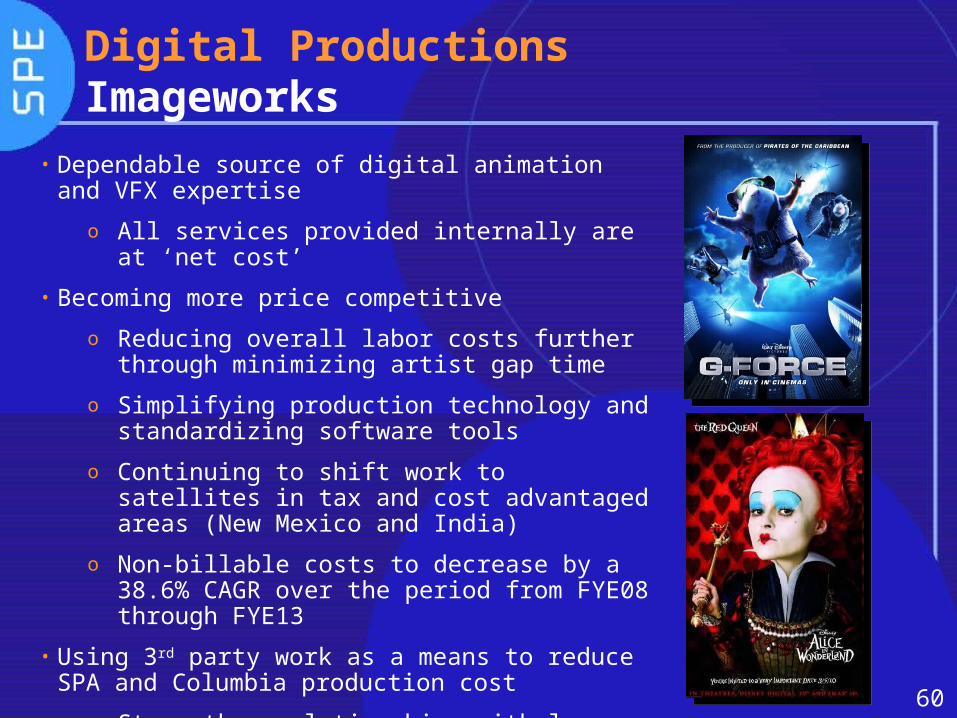
Digital ProductionsImageworks
• Dependable source of digital animation and VFX expertise
o All services provided internally are at ‘net cost’
• Becoming more price competitive
o Reducing overall labor costs further through minimizing artist gap time
o Simplifying production technology and standardizing software tools
o Continuing to shift work to satellites in tax and cost advantaged areas (New Mexico and India)
o Non-billable costs to decrease by a 38.6% CAGR over the period from FYE08 through FYE13
• Using 3rd party work as a means to reduce SPA and Columbia production cost
o Strengthen relationships with large studio clients – Disney and Warner Bros.

61
Financial Summary

62
Financial SummaryOverview
• EBIT, excluding restructuring costs and FYE10 asset sales, grows to $550m by FYE13, a 41% CAGR, despite
o Lower contribution from the Home Entertainment marketo Continued margin pressures on acquisition producto Overall recessionary environment
• EBIT margin improves to 6.1% by FYE13• $255m of cost reduction initiatives included in FYE11• Breakeven Net Cash Flow currently assumed for FYE11
o Will require a significant reduction in motion picture production spending as well as other action items that are currently being evaluated
o Excludes $15m of incremental restructuring costs for overhead reductions initiatives
• Net Cash flow improves to $100m and $200m in FYE12 and FYE13, respectively
63
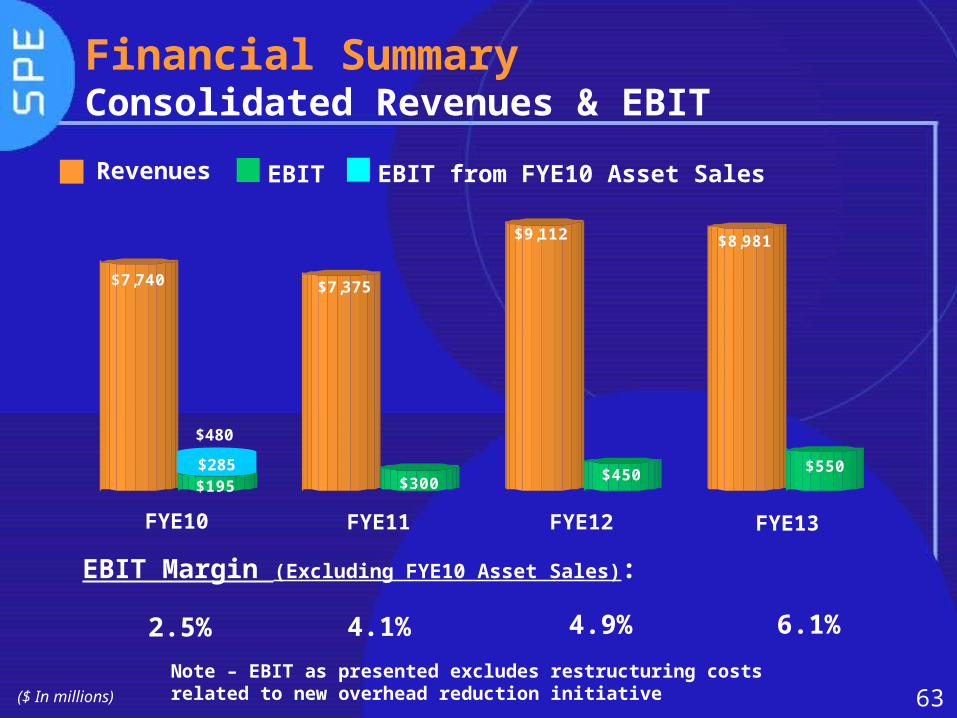
Financial SummaryConsolidated Revenues & EBIT
($ In millions)
FYE10 FYE11 FYE12 FYE13
EBIT Margin (Excluding FYE10 Asset Sales):
2.5% 4.1% 4.9% 6.1%
$7,740
$195
$7,375
$300
$9,112
$450
$8,981
$550$285
$480
EBITRevenues EBIT from FYE10 Asset Sales
Note – EBIT as presented excludes restructuring costs related to new overhead reduction initiative
64
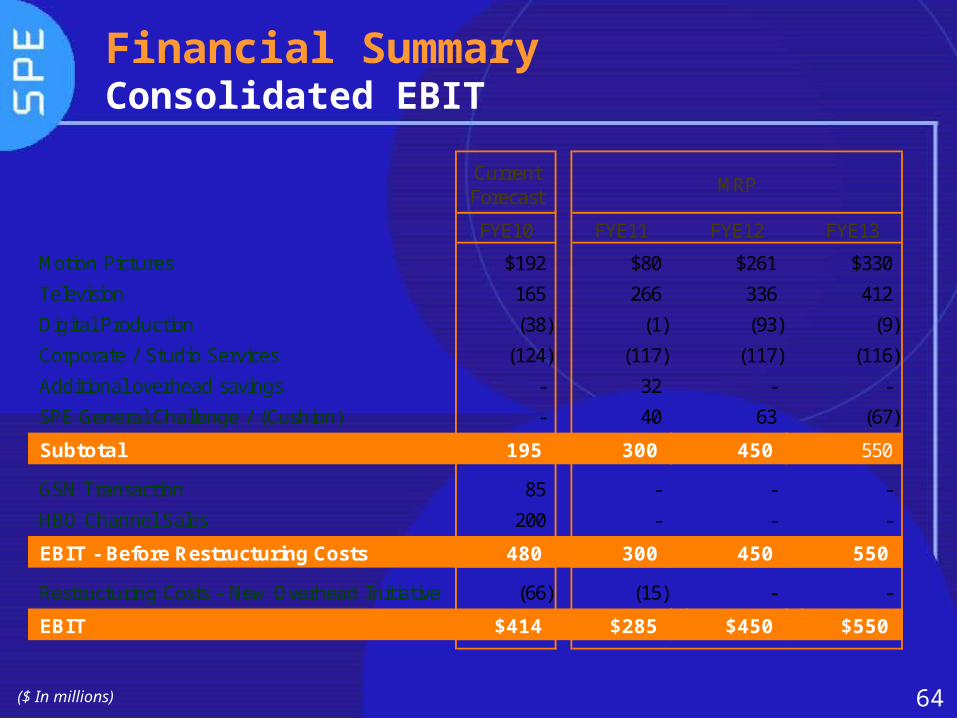
Financial Summary Consolidated EBIT
($ In millions)
Current Forecast
MRP
FYE10 FYE11 FYE12 FYE13
Motion Pictures $192 $80 $261 $330
Television 165 266 336 412
Digital Production (38) (1) (93) (9)
Corporate / Studio Services (124) (117) (117) (116)
Additional overhead savings - 32 - -
SPE General Challenge / (Cushion) - 40 63 (67)
Subtotal 195 300 450 550
GSN Transaction 85 - - -
HBO Channel Sales 200 - - -
EBIT - Before Restructuring Costs 480 300 450 550
Restructuring Costs - New Overhead Initiative (66) (15) - -
EBIT $414 $285 $450 $550
65
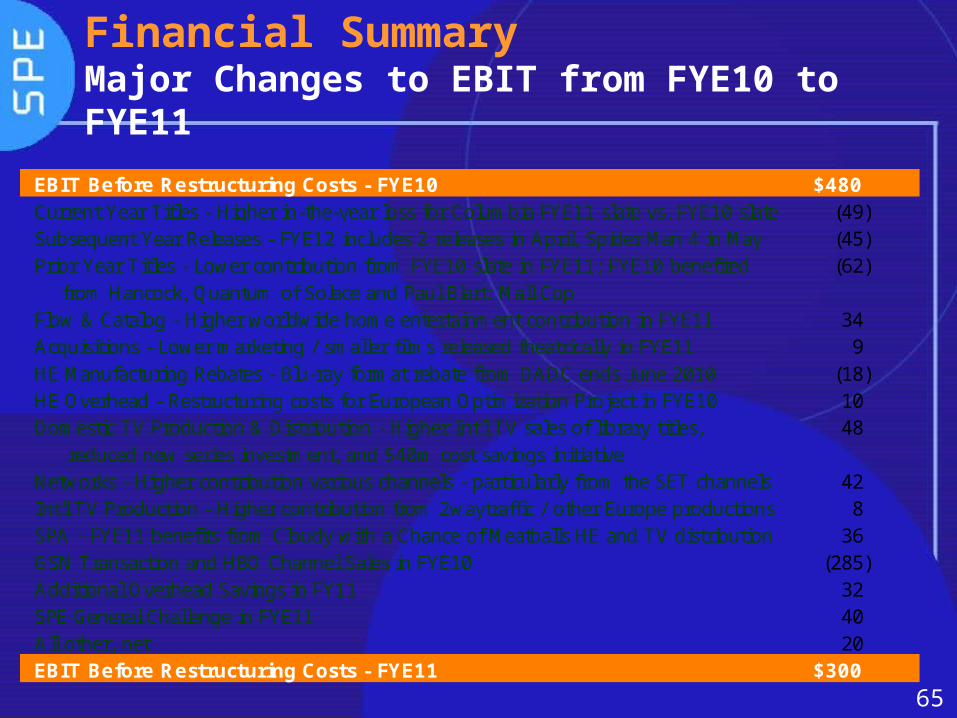
Financial Summary Major Changes to EBIT from FYE10 to FYE11
EBIT Before Restructuring Costs - FYE10 $480Current Year Titles - Higher in-the-year loss for Columbia FYE11 slate vs. FYE10 slate (49) Subsequent Year Releases - FYE12 includes 2 releases in April, Spider Man 4 in May (45) Prior Year Titles - Lower contribution from FYE10 slate in FYE11; FYE10 benefited (62)
from Hancock, Quantum of Solace and Paul Blart: Mall CopFlow & Catalog - Higher worldwide home entertainment contribution in FYE11 34 Acquisitions - Lower marketing / smaller films released theatrically in FYE11 9 HE Manufacturing Rebates - Blu-ray format rebate from DADC ends June 2010 (18) HE Overhead - Restructuring costs for European Optimization Project in FYE10 10 Domestic TV Production & Distribution - Higher Int'l TV sales of library titles, 48
reduced new series investment, and $40m cost savings initiativeNetworks - Higher contribution various channels - particularly from the SET channels 42 Int'l TV Production - Higher contribution from 2waytraffic / other Europe productions 8 SPA - FYE11 benefits from Cloudy with a Chance of Meatballs HE and TV distribution 36 GSN Transaction and HBO Channel Sales in FYE10 (285) Additional Overhead Savings in FY11 32 SPE General Challenge in FYE11 40 All other, net 20 EBIT Before Restructuring Costs - FYE11 $300
66
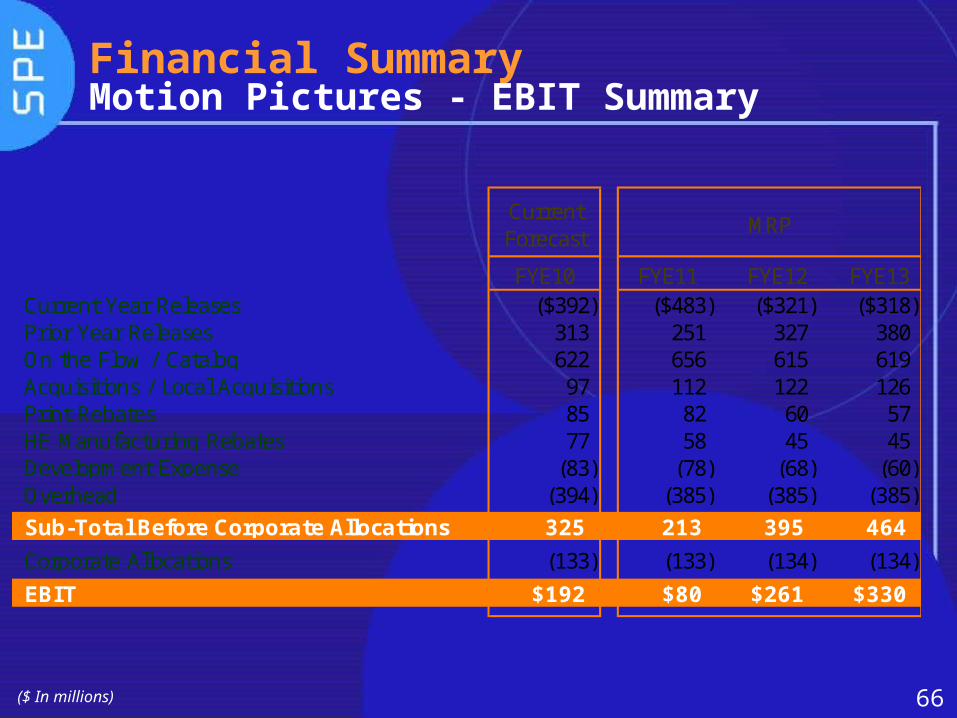
Financial SummaryMotion Pictures - EBIT Summary
($ In millions)
Current Forecast
MRP
FYE10 FYE11 FYE12 FYE13Current Year Releases ($392) ($483) ($321) ($318)Prior Year Releases 313 251 327 380 On the Flow / Catalog 622 656 615 619 Acquisitions / Local Acquisitions 97 112 122 126 Print Rebates 85 82 60 57 HE Manufacturing Rebates 77 58 45 45 Development Expense (83) (78) (68) (60) Overhead (394) (385) (385) (385)
Sub-Total Before Corporate Allocations 325 213 395 464
Corporate Allocations (133) (133) (134) (134)
EBIT $192 $80 $261 $330

67
Financial SummaryTelevision - EBIT Summary
($ In millions)
Current Forecast
MRP
FYE10 FYE11 FYE12 FYE13
Daytime Series / Game Shows $131 $128 $141 $139Third Party Distribution 35 35 15 12 Catalog Product 51 59 65 69Network, Cable & First Run Syndication (1) 6 23 24 Development (29) (25) (25) (25) Crackle / Digital Studio (15) (12) (8) - ENCORE Bonus 48 48 48 48 Earnings challenge 19 40 35 22 Overhead / Other (71) (61) (55) (51)
Domestic TV Production & Distribution 168 218 239 238
Networks 121 163 193 257 International Production 10 18 39 52 International Distribution (54) (53) (54) (54)
Sub-Total Before Corporate Allocations 245 346 417 493
Corporate Allocations (80) (80) (81) (81)
EBIT $165 $266 $336 $412
68
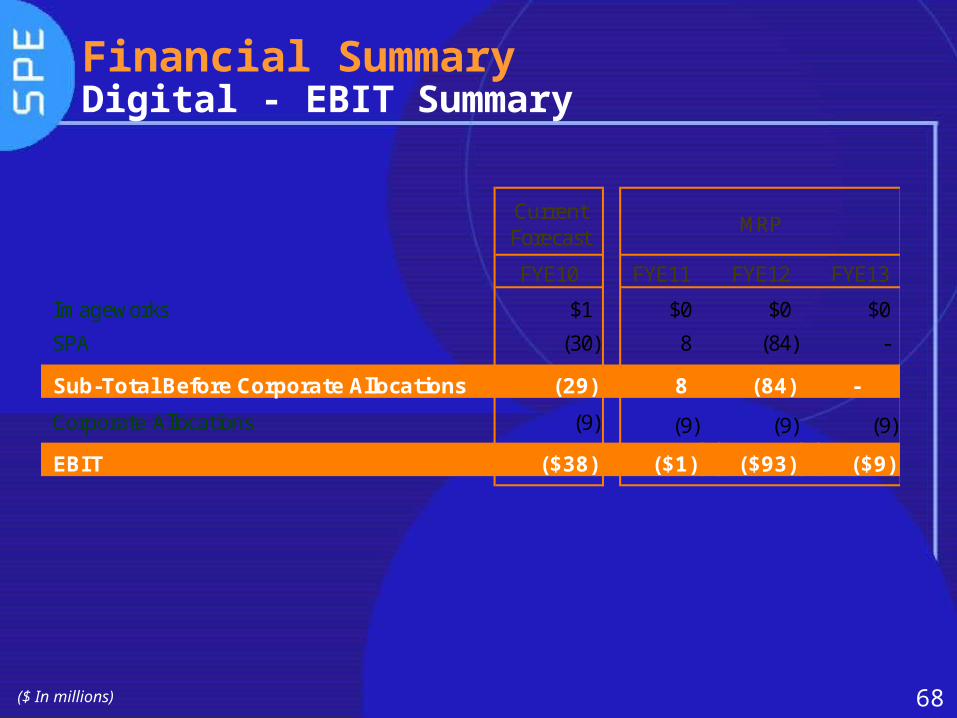
Financial SummaryDigital - EBIT Summary
($ In millions)
Current Forecast
MRP
FYE10 FYE11 FYE12 FYE13
Imageworks $1 $0 $0 $0
SPA (30) 8 (84) -
Sub-Total Before Corporate Allocations (29) 8 (84) -
Corporate Allocations (9) (9) (9) (9)
EBIT ($38) ($1) ($93) ($9)
69
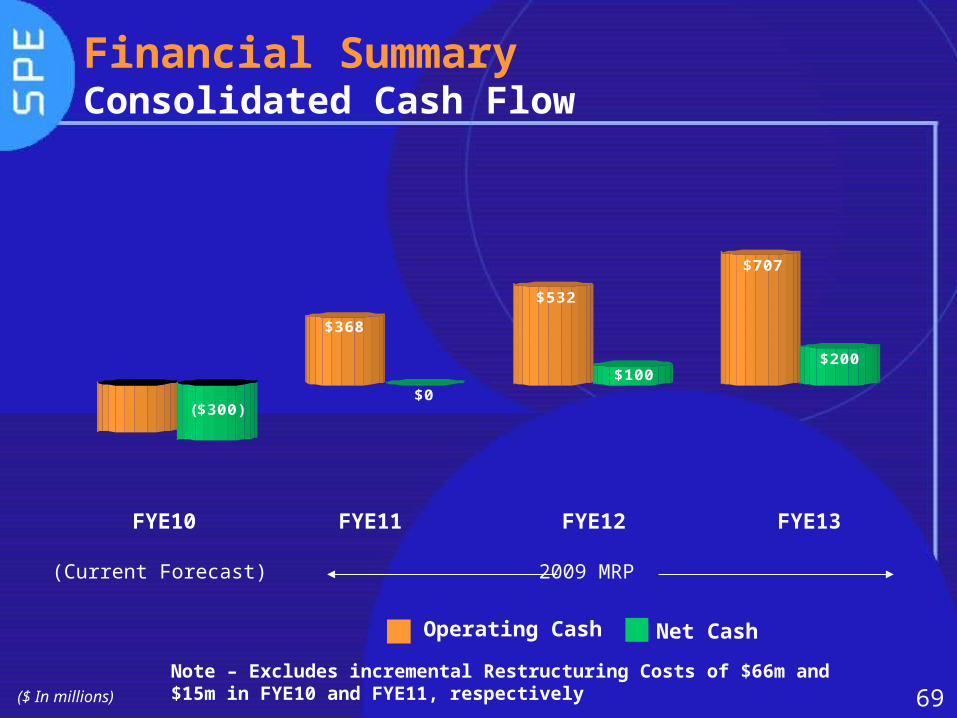
Financial SummaryConsolidated Cash Flow
FYE10 FYE11 FYE12 FYE13
(Current Forecast) 2009 MRP
Operating Cash Net Cash
($ In millions)
($300)
$368
$0
$532
$100
$707
$200
($260)
Note – Excludes incremental Restructuring Costs of $66m and $15m in FYE10 and FYE11, respectively

70
Closing
71
Closing Summary
FYE11 will continue to suffer from the same
challenges we are experiencing in the current
fiscal year. However, we are committed to act
upon the strategies we have outlined for your
today to mitigate the short term impacts while
positioning ourselves for improved profitability and
positive cash flow in FYE12 and FYE13

72