1 of 4 health and human service agencies under the...
TRANSCRIPT

1
FY 2015 Revised, FY 2016 Recommended & Capital Budgets
House Finance Committee May 7, 2015
2
1 of 4 health and human service agencies under the umbrella of OHHS Department of Behavioral Healthcare,
Developmental Disabilities and Hospitals Department of Human Services Division of Elderly Affairs
Department of Children, Youth and Families Department of Health

2
3
Governor appoints the directors of the 4 agencies under the OHHS umbrella
OHHS is responsible for managing and providing strategic leadership and direction to the 4 departments
Directors retain statutory authority
4
Intended to improve the efficiency & coordination of health and human services policy, planning budgeting and financing functions Centralized financial management & legal State Medicaid Agency Medicaid expenses appear in 4 agencies Other Medicaid programs – BHDDH, DCYF &
DHS’ Division of Elderly Affairs

3
Medicaid 26%
Other Spending
74%
5
Medicaid State
Match31%
Other Spending
69%
6

4
OHHS 81.9%
BHDDH14.6%
DCYF2.1%
DHS1.3%
DOH0.1%
7
(millions) Enacted Gov. Rec ChgeDevelopmental Disabilities
$227.4 $226.7 ($0.7)
Hospital & CommRehab
113.7 111.6 (2.1)
Behavioral Health 19.0 21.1 2.1Hosp & CommSupport
3.9 3.9 -
Central Mgt 1.5 1.6 0.04Total $365.5 $364.8 ($0.7)
8

5
(millions) Enacted Gov. Rev. Change General Revenues
$167.5 $168.7 $1.3
Federal Funds 181.2 181.2 -
Restricted Receipts
9.6 8.8 (0.8)
RICAP 7.2 6.1 (1.1)Total $365.5 $364.8 ($0.7)FTE 1,422.4 1,421.4 (1.0)
9
Change to Enacted Gen Rev All Funds
Reappropriation $250,000 $250,000
DOJ Consent Decree 875,000 875,000Cost Allocation Plan Items* 0.6 0.6Corrective Action Plan* (0.9) (1.8)
All Other Changes* 0.4 (0.7)
Total $1.3 ($0.7)(*millions)
10

6
Corrective Action Plan Items Gen Rev All Funds
Electronic Visit Verification ($0.3) ($0.6)
Dispensing Unit (0.2) (0.4)
Staffing Patterns/Attrition (0.2) (0.4)
Cost of Care Collection (0.1) (0.2)
Close Southwick Home (0.1) (0.2)Total (millions) ($0.9) ($1.8)
11
Full-Time Equivalent Positions
Full-Time Positions FTEs Chg. To Enacted
Enacted Authorized 1,422.4 -FY 2016 Request 1,421.4 (1.0)FY 2016 Governor 1,421.4 (1.0)FY 2014 Average Filled 1,298.5 (123.9)Filled as of April 18 1,266.8 (155.6)Filled to FY 2014 Avg (31.7)
12

7
(millions) Enacted Gov. Rec Change Gen Revenues $167.5 $170.4 $2.9
Federal Funds 181.2 180.6 (0.6)
Rest. Receipts 9.6 9.2 (0.4)
RICAP 7.2 6.7 (0.5)Total $365.5 $366.9 $1.4FTE 1,422.4 1,421.4 (1.0)
13
(millions) Enacted Gov. ChgeDevelopmental Disabilities
$227.4 $230.9 $3.5
Behavioral Health 19.0 19.3 0.3Hospital & CommRehab
113.7 112.3 (1.4)
Hosp & Comm Support 3.9 2.8 (1.1)
Central Mgt 1.5 1.6 0.1Total $365.5 $366.9 $1.4
14

8
(millions) Enacted Gov. Rec. Change Salaries & Benefits
$132.4 $134.8 $2.4
Contracted 1.3 3.4 2.1
Operating 13.5 14.3 0.8
Grants & Benefits
210.8 207.4 (3.3)
Capital 7.5 6.9 (0.6)
Total $365.5 $366.9 $1.415
16
Budget Office provided a general revenue target of $159.2 million Current service adjustments of $4.6 million 7.5% reduction of $12.9 million
Request is $0.4 million above target Governor’s recommendation is $11.4
million above

9
General Revenues
47%
Federal Funds 49%
RICAP2%
Res Rec 2%
17
Behavioral Health 5.3%
Eleanor Slater Hospital
30.9%
Developmental Disabiities
62.6%
Central Management
0.4%
Hospital & Comm Support
0.8%
18

10
Salaries & Benefits 36.7%
Contracted Services
0.9%Capital 1.9%
Operating3.9%
Asst. & Grants56.5%
19
20
The Governor signed Executive Order 15-08, Establishing the Working Group to Reinvent Medicaid, on 2/26/2015
Medicaid stakeholders who will conduct a comprehensive review of the Medicaid program & make recommendations for short & long-term plans to transform the program

11
Governor’s Budget Completed Task Force Themes Gen. Rev. All Funds Gen Rev. All FundsEfficiencies/Oversight ($9.5) ($19.2) ($8.0) ($16.1)Program Administration - - (1.5) (3.0)LTC Supports Transition (8.9) (17.9) - -Hospital Supports Transition
(27.9) (55.2) (15.0) (30.2)
Addressing High Utilizers - - (18.5) (37.2)Behavioral Healthcare Needs -Coordinated Care
- - (3.0) (6.0)
Total ($46.2) ($92.3) ($46.0) ($92.6)
21
22
Findings and Recommendations for Consideration in the Fiscal Year 2016 Budget was released May 1, 2015
Governor will submit an amendment with her changes
BHDDH has $2.0 million included in its budget tied to the workgroup
May 1 report identifies proposals

12
# Proposals Gen Rev All Funds6 Coordinated Care – SPMI $3.3 $6.512 Alternate settings - ESH residents 1.0 $2.0 14 Fund STOP program 0.5 1.016 Electronic Visit Verification 2.6 5.222 RICLAS to private sector– 1/2016 2.0 4.023 Streamline Medicaid eligibility 1.5 -
25 Operational Efficiencies – OHHS 1.1 2.3
33 Close 2 group homes 0.4 0.934 Consolidate services at ESH 0.3 0.6
23
Private System State System

13
25
RI chooses to provide services under its 1115 Extension Waiver: Residential Support Day Programs/Supported Employment Community Supports Home Health Care Respite
26
Statewide network of community support for adults with disabilities Privately operated
Publicly operated services Rhode Island Community Living and
Supports (RICLAS)
14
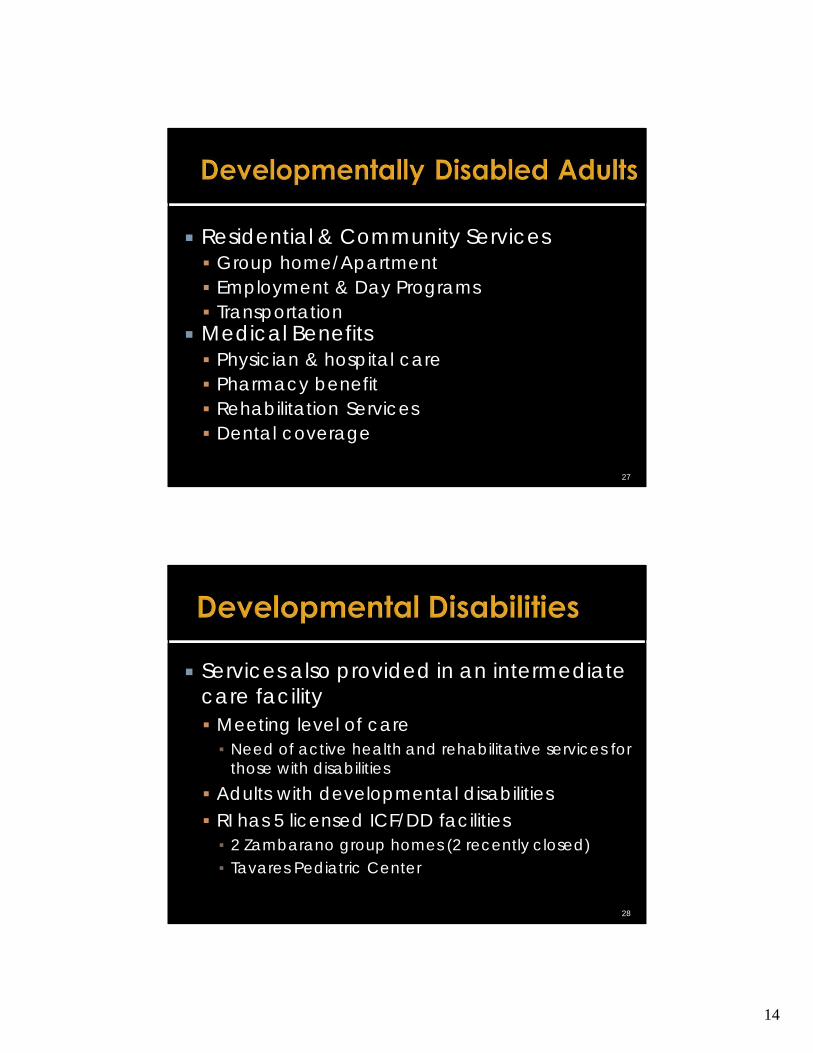
Residential & Community Services Group home/Apartment Employment & Day Programs Transportation
Medical Benefits Physician & hospital care Pharmacy benefit Rehabilitation Services Dental coverage
27
Services also provided in an intermediate care facility Meeting level of care▪ Need of active health and rehabilitative services for
those with disabilities Adults with developmental disabilities RI has 5 licensed ICF/DD facilities▪ 2 Zambarano group homes (2 recently closed)▪ Tavares Pediatric Center
28

15
29
Individuals with developmental disabilities State has option to use one or both federal
eligibility thresholds. RI statute has both: First if a person’s IQ is 70 or below, they are
eligible for servicesRI does not use this definitionEligibility standard for Massachusetts and
ConnecticutMedicaid Working group report references
evaluating eligibility criteria and if materially differs from other NE states (Item 23)
Individuals with developmental disabilities 2nd: person w/ severe, chronic disability
that: “Results in substantial functional limitation in
3 or more areas of a major life activity: self care, receptive and expressive language, learning, mobility, self-direction, capacity for independent living and economic self-sufficiency” Further defined by the Department
30
16
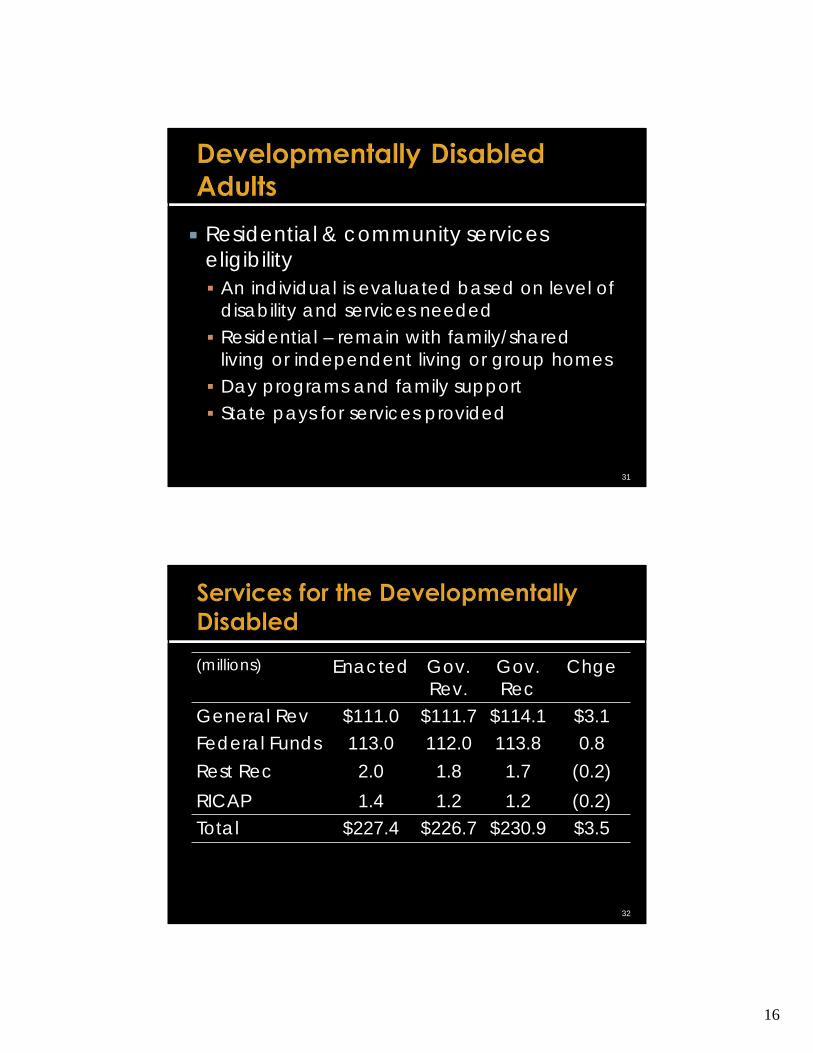
Residential & community services eligibility An individual is evaluated based on level of
disability and services needed Residential – remain with family/shared
living or independent living or group homes Day programs and family support State pays for services provided
31
32
(millions) Enacted Gov. Rev.
Gov. Rec
Chge
General Rev $111.0 $111.7 $114.1 $3.1Federal Funds 113.0 112.0 113.8 0.8Rest Rec 2.0 1.8 1.7 (0.2)RICAP 1.4 1.2 1.2 (0.2)Total $227.4 $226.7 $230.9 $3.5

17
33
(millions) Enacted Gov. Rev. Gov. Rec Change Salaries & Benefits
$39.1 $39.1 $40.2 $1.1
Operating 2.8 2.7 2.7 (0.2)Contracted Services
0.5 2.0 2.5 1.9
Grants 183.5 181.7 184.4 0.9Capital 1.4 1.2 1.2 (0.2)Total $227.4 $226.7 $230.9 $3.5FTE 448.4 448.0 448.0 (0.4)
Proposal General Revenues
AllFunds
GovRec
Bundled Rate –Day Services
($3.3) ($6.7) No
Reduce # of RICLAS Homes
($0.2) ($0.4) No
Close Special Needs Facility
($0.9) ($1.9) No
Reduce State Funded Services
($0.5) ($0.5) No
34

18
35
State funding supports staff in both systems
Residents receive monthly check $760.92 SSI check or other disability
payments (Social Security/Pension/SSDI) Pays for room and board Supports daily living expenses▪ Rent/utilities/food
Eligibility Definition Income Categorically Meet the federal
definition of disability and income limits - SSI
Up to $760.92
Medically Needy - must meetmedically needy income limit (MNIL)
Do not meet definition for categorically needy. May have income - pension check, Social Security Disability Income or other resources
Not to exceed$922. If it does–individual pay a portion of services until meet monthly limit.
36

19
37
Currently 863 medically needy individuals receiving services Owe $2.0 million annually to offset costs
Cost of care ranges from a low of less than $1 to $3,850 a month
Department is collecting approx. ½ of what is owed monthly
Proposal to correct this
Examples MNIL Income Cost of CareMonthly Annual Monthly Annual
#1 $922 $4,742 $56,904 $3,820 $45,840
#2 $922 $3,422 $41,064 $2,500 $30,000
#3 $922 $2,422 $29,064 $1,500 $18,000
#4 $922 $923 $11,076 $1 $12
38

20
39
Medical Benefits Medicaid Only▪ Rhody Health Partners - OHHS’ budgetMedicare (dual eligible) ▪ Rhody Health Options▪ Other services through OHHS budget
MedicalBenefits Program
EnrollmentProcess
# of Persons
ReturnedMail
Opt-Out
Rhody Health Options
Passive 1,645 19 12
Rhody HealthPartners
Mandatory 850 n/a n/a
Remain in Fee for Service
Automatic 1,162
Total 3,657 19 12
40

21
FY Total (Millions)
Change Caseload Change PerPerson
2014 $229.4 1.7% 4,074 (0.4%) $54,2062013 $225.5 4.1% 4,232 (0.5%) $53,2762012 $216.5 (10.7%) 4,254 (0.5%) $50,8972011 $242.6 (1.0%) 4,232 (2.9%) $57,1372010 $244.0 (1.7%) 4,358 (0.9%) $55,9952009 $248.2 (4.6%) 4,398 0.4% $55,9212008 $260.2 2.6% 4,381 2.5% $59,3962007 $253.7 4.1% 4,274 2.4% $59,356
41
FY Total(Millions)
Change Caseload Change Per Person
2014 $36.7 5.8% 199 (7.2%) $184,8902013 $34.8 5.1% 214 (1.4%) $153,8482012 $34.1 2.4% 217 (1.8%) $159,9212011 $33.8 (2.7%) 221 (4.3%) $153,2502010 $34.8 (11.7%) 231 (5.7%) $150,5442009 $39.4 (10.0%) 245 (9.2%) $160,6952008 $43.8 (1.4%) 270 (5.9%) $162,0612007 $44.4 1.3% 287 - $154,583
42
22
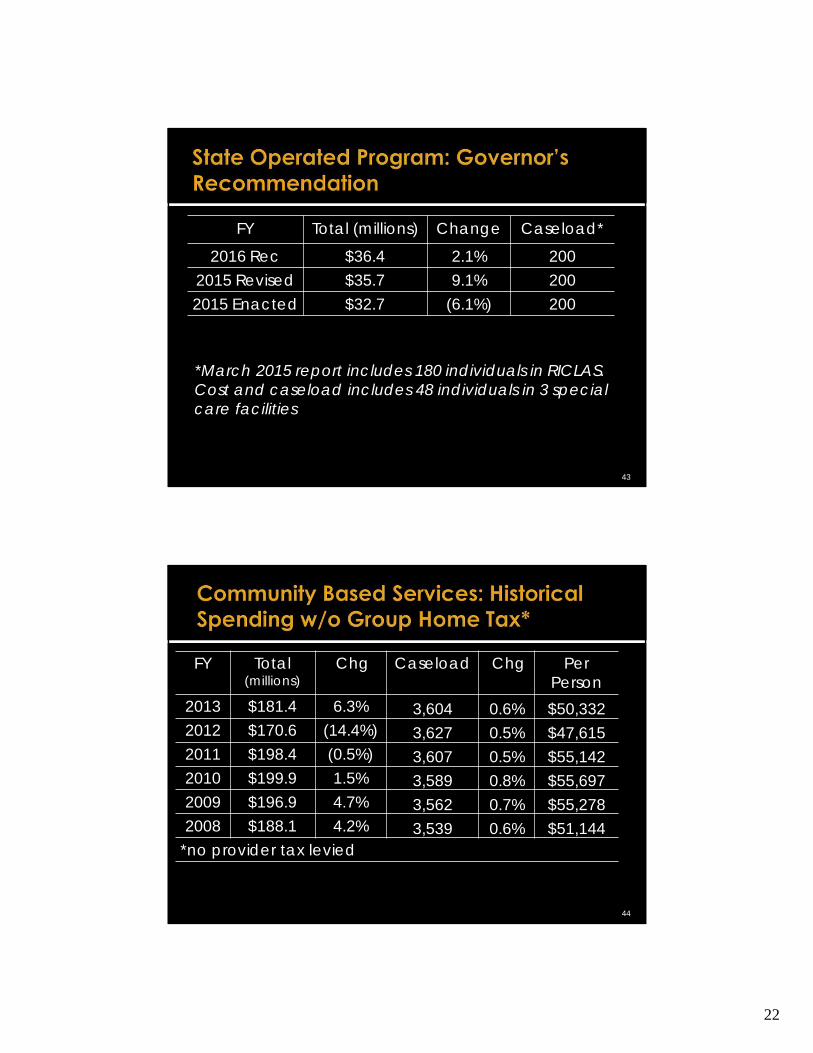
*March 2015 report includes 180 individuals in RICLAS. Cost and caseload includes 48 individuals in 3 special care facilities
FY Total (millions) Change Caseload*
2016 Rec $36.4 2.1% 2002015 Revised $35.7 9.1% 2002015 Enacted $32.7 (6.1%) 200
43
FY Total (millions)
Chg Caseload Chg Per Person
2013 $181.4 6.3% 3,604 0.6% $50,3322012 $170.6 (14.4%) 3,627 0.5% $47,6152011 $198.4 (0.5%) 3,607 0.5% $55,1422010 $199.9 1.5% 3,589 0.8% $55,6972009 $196.9 4.7% 3,562 0.7% $55,2782008 $188.1 4.2% 3,539 0.6% $51,144
*no provider tax levied
44

23
FY Total (millions)
Chge Caseload Per person
2016 Rec $181.6 0.2% 3,689 $49,8352015 Rev $181.2 - 3,644 $49,716
2015 Enacted $181.1 (1.6%) 3,644 $49,0962014 $184.1 1.7%
(millions)
45
Age # of Individuals Percent of Total 29 or younger 1,113 28.3%Age 30-39 729 18.6%Age 40-49 708 18.0%Age 50-64 996 25.4%Age 65 & Older 383 9.7%Total 3,929 100%
46

24
Age # of Individuals Percent of Total 29 or younger 11 6.1%Age 30-39 10 5.6%Age 40-49 12 6.7%Age 50-64 79 44.1%Age 65-101 67 37.4Total 179 100%
47
48
FY 2009: 4.7% rate reduction Taken on residential and day programs –
savings of $8.0 million from all funds FY 2010 : RI no longer allowed to tax
group homes - $8.0 million savings FY 2011 Rev: Eliminated “per diem” or
“legacy” rates FY 2012 : Implemented Project
Sustainability

25
49
FY 2014 – increase direct care labor rate from $11.30 to $11.55 starting January 1, 2014
Savings from SIS assessments resulted in Department raising rates
50
35 community agencies providing services
Rates received CMS approval Residential is approved for 365 days Day programs approved for min. 6
hours a day Pay for services provided & at a
consistent rate Transparency and accountability

26
51
SIS Assessments Department has assessed 4,321 current
clients as of 1/30/2015 for first SIS 1,425 clients have had an anniversary
SIS (second SIS) 182 have had a change in situation SIS Applies to new applicants Reviewed every 3 years or if have a life
changing event
52
Provider must bill in units More administratively time consuming Previously received monthly payments ▪No separate billings Administrative reimbursement at 10%▪ Some providers costs are above that
threshold
27
53
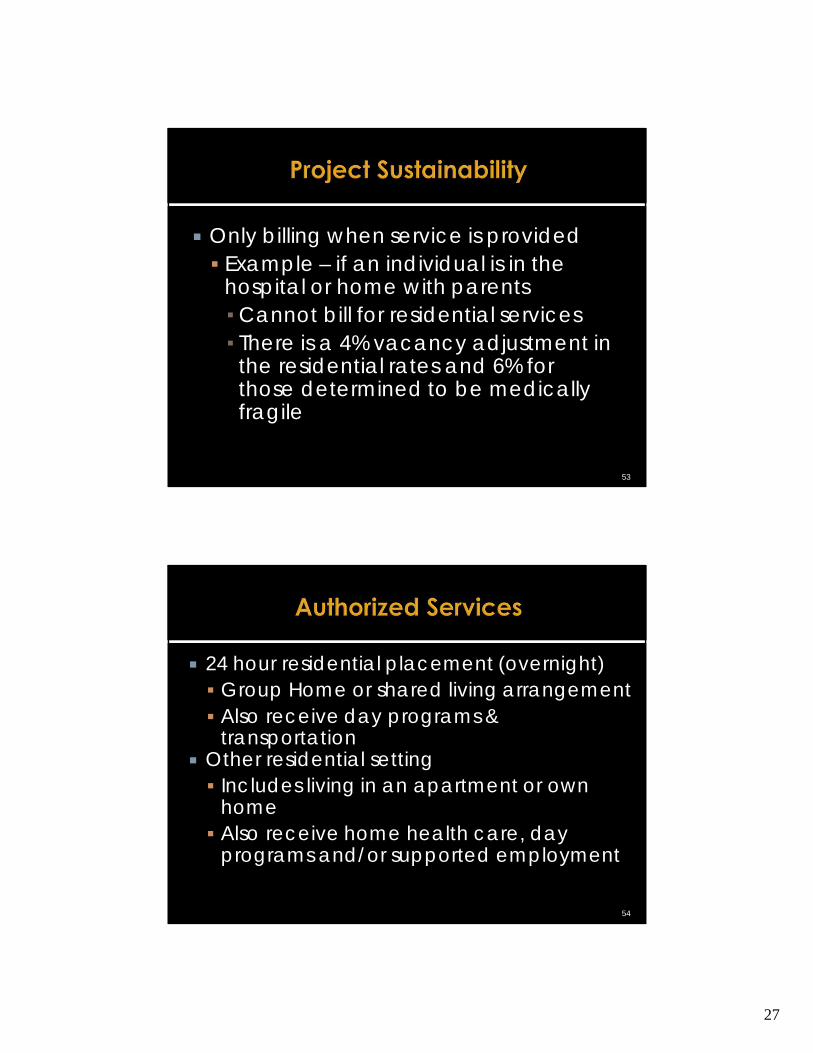
Only billing when service is provided Example – if an individual is in the
hospital or home with parents▪Cannot bill for residential services ▪ There is a 4% vacancy adjustment in
the residential rates and 6% for those determined to be medically fragile
54
24 hour residential placement (overnight) Group Home or shared living arrangement Also receive day programs &
transportation Other residential setting Includes living in an apartment or own
home Also receive home health care, day
programs and/or supported employment

28
55
Those who live with a parent/relative Day programs/supported employment Supported coordination and support
facilitation Home health services Community support and/or respite Transportation services
Setting # of Individualsas of March
2015 Tier Center Based Community
BasedHome
A 1 Staff: 10 Participants
1 Staff: 5 Participants
1 Staff: 10 Participants
605
B 1:8 1:5 1:8 827
C 1:5 1:2 1:5 1,411
D 1:3 1:1 1:2 508
E 1:1 1:1 1:1 282Total 3,633
56

29
57
As of March 2015 Report 3,986 individuals▪ 3,477 receiving services in privately operated
system▪ 329 receiving case management services ▪ 180 in RICLAS ▪ 108 attending community based day programs ▪ 3 individuals in out-of-state placements
2014 Assembly passed Sect. 2 of Article 18 to require an out-of-state provider to apply for & be approved to participate in the Rhode Island Medicaid program
Approved: Berkshire Hills Music Academy, & Latham Academy One person lives at Latham and attends
Transitions Academy for day services Riverbrook & Transitions Academy (MA) –
have not applied 58

30
FY 2013 (millions) Claims %Res* $102.8 97.3Day 21.7 85.3Trans 5.6 78.3Total $130.1 94.1*Group Home or Shared Living
FY 2014Auth Claims %
$103.2 $102.0 98.931.1 25.6 82.47.6 5.9 77.1
$141.9 $133.5 94.1%
59
FY 2013(millions) Claims %Res* $17.9 73.9Day 17.6 65.4Trans 4.0 57.7Other 10.0 85.5Total $49.5 70.9Either in an apartment/ own
FY 2014Auth Claims %$31.7 $20.8 65.521.7 15.1 69.75.4 3.4 63.8
12.3 10.1 81.7$69.8 $49.5 69.5
home or with a relative
60

31
Services FY 2013 % FY 2014 %24-hr residential $103.4 57.2 $102.0 54.2Other Residential 18.1 10.0 20.8 11.0
Subtotal $121.5 67.2% $122.8 65.2%Day Program 39.5 21.9 40.7 23.8Transportation 9.8 5.5 10.2 5.5
All Other 9.2 5.2 7.0 5.4Total (millions) $180.7 100% $188.1 100%
61
62
Finding against the City of Providence and the State of Rhode Island Operating a “sheltered workshop”- Training
Thru Placement 90 individuals receiving services through TTP State hired an outside consultant to assist
with transition to employment activities

32
63
State signed agreement with DOJ Convert services provided in the
sheltered workshops to employment supported activities
Contracted with Fed Cap prior to the signing of the consent decree Ended 12/31/2013
Center for Excellence and Advocacy Ended 12/31/2014
64
Budget Office estimated $1.1 million would be needed from general revenues
Governor adds another $5.1 million, $2.5 million from general revenues for services
Any rate change or change methodology may require a category II change under the Medicaid waiver
Requires General Assembly approval No specific legislation in the Governor’s budget
for a change

33
Activity FY 2015 FY 2016 Trust Fund $400,000 $400,000Monitor & SettlementAgreement
475,000* 275,000
Sherlock Workshop Institute
125,000 250,000
Total $1,000,000 $925,000*$125,000 included in the Dept. of Elementary and Secondary Education
65
66
Four separate populations: RI Sheltered Workshop Target Population ▪ Those who received services in sheltered workshop
setting – state had 9 ▪ Training Thru Placement – closed▪ Community Works Services are primary
employment services provider for those who attended TTP

34
67
Four populations (continued): RI Day Target Population▪ Receive or have received day services in a facility
based setting in the previous year RI Youth Transition Target Population ▪ Transition-age according to RIGL & attend high school
RI Youth Exit Target Population ▪ Transition youth who have exited or will exit high school
during: the 2014/2015 and 2016 school year (SY)
Date Youth Exit ShelteredWorkshop
Day Programs
Minimum # added to comply with consent decree1/1/2015 50 - SY 2014 - -6/1/2015 Remaining
SY - 2014 & 2015- -
1/1/2016 1/1/2016 50 25
6/1/2016 SY 2016 - -
1/1/2017 - 50 251/1/2018 - 50 50
1/1/2019 - 50 50
68

35
Date Youth Exit Sheltered Workshop Day ProgramsMinimum # added to comply with consent decree
1/1/2020 - 100 75
1/1/2021 - 100 100
1/1/2022 - 100 200
6/1/2023 - 100 200
1/1/2024 - 100 225
69
70
Vocational & Related Services Job development, job coaching, job
shadowing, benefits counseling & transportation Environmental modifications, behavioral skills
training and supports, self exploration, career exploration, career planning, job customization, soft skill development and time management training & personal care services

36
71
Allow individuals with disabilities to interact with those who do not in an employment setting to the fullest extent possible
Offers the same opportunities for both groups
Decree indicates that the state will reallocate resources – funding “follow the person”
72
Prevocational Training – 483 Job Coaching – 762 Job Retention – 52 Job Development – 353 Business Partners: Chelo’s, Gregg’s, Panera
& Rhody Joe’s, Hampton Inn, Turnpike and Bridge Authority, TJX, Automated Business Solutions, City of Pawtucket & City of Cranston

37
Example: Individuals Meeting State StatuteAnnualCost/person
Prior to the Decree After the DecreeEmployed Not Employed Employed Not Employed
Job Related
- - $9,144 $12,836
Day $13,068 $13,122 17,224 20,112Other Activities
1,268 1,152 1,268 1,268
Total $14,336 $14,264 $27,636 $34,216
Residential remains the same under each scenario
73
74
Aging Populations Is it still an appropriate placement? Should an individual be placed in a
nursing home? Annual Cost is approximately $70,000
Under Project Sustainability Up to $100,000 to support medically
fragile individual in a residential setting

38
75
Younger population Potential caseload increase resulting
from those on the autism spectrum Residential Services Community Supports▪Day programs and family supports
Program(millions)
FY 2015 Rev
FY 2016Rec
# of Clients
Day Services -CNOM
$0.7 $0.7 125
Rehab Option $1.2 $1.2 100
State Only $0.7 $0.7 70
76

39
Behavioral Healthcare Services
78
Monitoring & development of mental health & substance abuse services: Community support and recovery programs General outpatient & residential programs Housing and vocational programs Prevention activities Detoxification programs

40
79
(millions)Enacted Gov.
Rev. Gov. Rec.
Chge
Gen Rev $2.0 $2.3 $2.3 $0.3
Fed Funds 15.6 17.4 15.6 -
Restricted Receipts
0.1 0.1 0.1 -
RICAP 1.3 1.3 1.3 -Total $19.0 $21.1 $19.3 $0.3
80
(millions) Enacted Gov. Rev. Gov. Rec Change Salaries & Benefits
$3.0 $3.2 $3.4 $0.4
Operating 0.2 0.2 0.2 -Contracted Services
0.1 0.1 0.1 -
Grants 14.5 16.3 14.3 (0.2)Capital 1.3 1.3 1.3 -Total $19.0 $21.1 $19.3 $0.3FTE 29.0 32.0 33.0 4.0
41
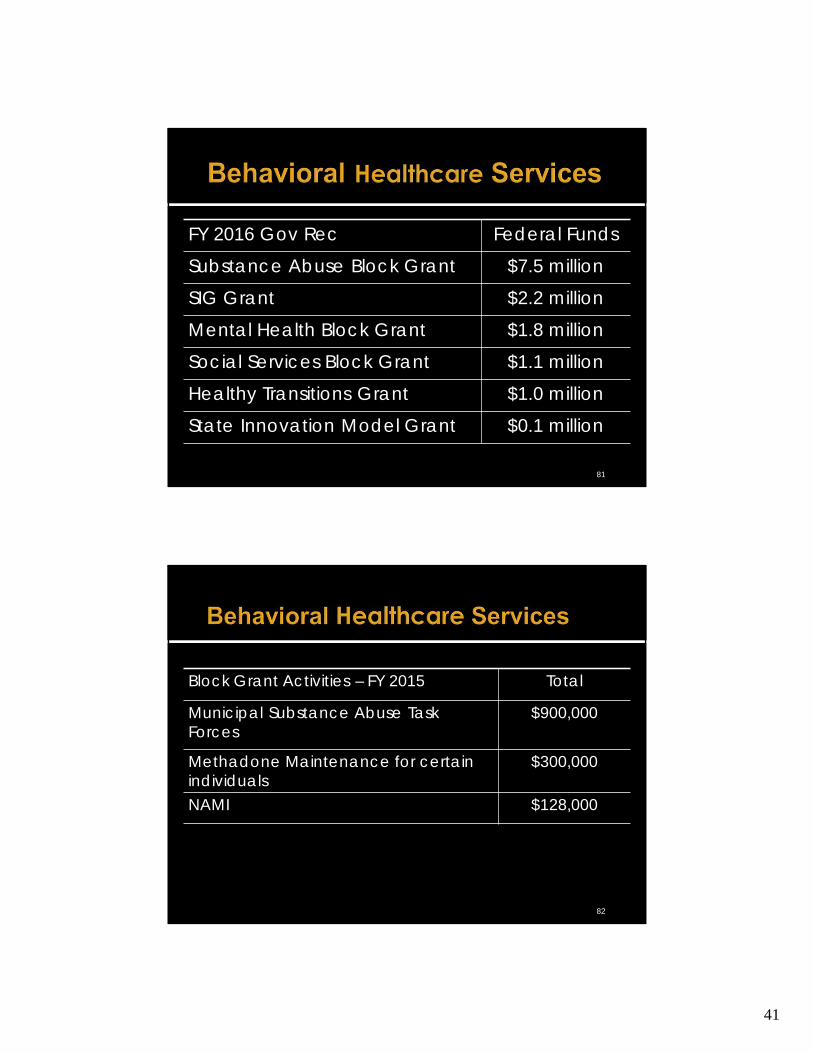
81
FY 2016 Gov Rec Federal Funds
Substance Abuse Block Grant $7.5 million
SIG Grant $2.2 million
Mental Health Block Grant $1.8 million
Social Services Block Grant $1.1 million
Healthy Transitions Grant $1.0 million
State Innovation Model Grant $0.1 million
82
Block Grant Activities – FY 2015 Total
Municipal Substance Abuse Task Forces
$900,000
Methadone Maintenance for certain individuals
$300,000
NAMI $128,000

42
83
Pilot program to address the overuse of emergency rooms by individuals with substance abuse issues – STOP Program
RFP is for a 3 year contract w/1 year of available funding
2013 Assembly provided one-time funding of $250,000 from general revenues
Recommendation of Medicaid Working Group to continue program Located at Emmanuel House – Item #14
84
The Providence Center In Partnership with Care New England
Gateway Healthcare Services Owned by Lifespan
Both involved with adolescents and parents

43
Eleanor Slater Hospital System
86
2 campuses Pastore Center – Cranston▪ Regan – 3 units with medical and psychiatric
patients ▪ Adolph Meyer – adult psychiatric▪ Philippe Pinel – forensic unit
Zambarano - Burrillville ▪ medical patients

44
Unit # ofpatients
Admission Criteria
Zambarano 109 Hospital level of care Regan 35 Hospital level of care Adolph Meyer 99 Court ordered and
voluntary placements Philippe Pinel 38 Court ordered Total 281
87
88
Enacted GovRev.
Gov. Rec
Change
General Revenues
$52.0 $51.3 $51.5 ($0.4)
Federal Funds 52.0 51.5 50.6 (1.4)
Rest Receipts 6.6 6.7 6.6 -
RICAP Funds 3.1 2.2 3.6 0.5
Total (millions) $113.7 $111.6 $112.3 ($1.4)FTE 908.0 906.4 906.4 (1.6)

45
89
(millions) Enacted Gov. Rev. Gov. Rec Change Salaries & Benefits
$86.6 $85.0 $87.6 $1.0
Operating 10.4 10.6 11.3 0.9Contracted Services
0.6 0.8 0.8 0.2
Grants 12.8 12.7 8.8 (4.1)Capital 3.3 2.5 3.9 0.5Total $113.7 $111.6 $112.3 ($1.4)
90
Patient Census Daily Rate
FY 2003 392 $783FY 2004 381 $798FY 2005 363 $838FY 2006 358 $911FY 2007 352 $933FY 2008 313 $1,014FY 2009 284 $1,022

46
91
Patient Census Daily Rate FY 2010 270 $993FY 2011 270 $1,038FY 2012 281 $987FY 2013 275 $1,003FY 2014 275 $979FY 2015 275 $1,002
Proposal General Revenues
All Funds GovRec
Downsize Operations
($6.1) ($12.2) No
Close Group Homes
($0.4) ($0.9) Yes
Food Services*
($150,000) ($300,000) Yes
* Not included in the Department’s request
92

47
93
Governor includes $3.2 million from Rhode Island Capital Plan funds Pay architectural and other expenses
through FY 2015 Does not include funding in the FY 2016
through FY 2020 capital plan Indicates the need for further study by
the current administration
Hospital & Community System SupportsCentral Management

48
95
Operational support to both the hospital & community patient care system
Financial Management Facilities and Maintenance Human Resource Management
96
(millions) Enacted Gov. Rev.
Gov. Rec Change
Salaries & Benefits
$2.4 $2.4 $2.1 ($0.3)
All Other Operating
0.1 0.1 0.1 -
Capital 1.4 1.4 0.6 (0.8)
Total $3.9 $3.9 $2.8 ($1.1)
FTE 26.0 23.0 23.0 (0.3)

49
97
Department administration Constituent affairs Policy administration Strategic Planning
98
Enacted Gov Rev. Gov. Rec Rec to Enacted
Sal/Ben $1,377,385 $1,429,210 $1,486,156 $108,771
Contract Services
2,842 4,451 4,451 1,609
Operating 129,858 124,768 125,345 (4,513)
Total $1,510,085 $1,558,429 $1,615,952 $105,867
FTE 11.0 11.0 11.0 -

50
99
100
13 Projects totaling $65.0 million Mixed Funding RICAP Funds: $61.8 million Federal Funds: $3.2 million
$28.2 million in FY 2016 through FY 2020 RICAP Funds: $27.6 million Federal Funds: $0.6 million

51
101
Project Status Cost* FundsEquipment New $1.5 RICPHospital Consolidation
Revised $3.2 RICP
Administrative Buildings
Revised $8.0 RICP
Pastore – AP Ongoing $7.8 RICPZambarano – AP Ongoing $2.2 RICP*millions
102
Project Status Cost* FundsGroup Homes Revised $8.2 RICPRes Support Revised $7.0 RICPRes Fire Code Revised $5.5 RICP/FFReg Centers-AP Ongoing $4.6 RICP*millions

52
103
Project Status Cost* FundsResidences Revised $8.3 RICPMH Asset Protection Ongoing $4.1 RICPComm Fac Fire Code Upgrades
Ongoing $3.8 RICP
SA Asset Protection Ongoing $1.0 RICP*millions
FY 2015 Revised, FY 2016 Recommended & Capital Budgets
House Finance Committee May 7, 2015