staff presentation to the house finance committee...
TRANSCRIPT

Staff Presentation to the House Finance
Committee
February 2, 2017

2
January 17 - Governor’s State of the State address
January 19 - Budget Due 2017- H 5175 introduced and referred to
Finance

3
December 6 – Budget Status
Jan 24, 31 – Budget at a Glance
February 2 – Governor’s Budget
Overview
House Fiscal Staff Budget Analysis
February 7 – Article hearings begin
House Fiscal Staff Budget Analysis
Early May – Consensus Revenue and
Caseload Estimating Conference

4
Finance Committee Review Briefing - Overview
Article hearings through March
24 separate articles some with multiple
sections affecting different issues
Subcommittee review of individual
agency budgets – February and March
Governor’s requested amendments
and other issues of interest

5
Materials are on line on the Assembly
website - http://www.rilin.state.ri.us
under House Fiscal Reports
Tabs for 2017 session
Links to OMB/Budget Office
Includes items prepared by House
Fiscal Staff that may be helpful
Hearings available “on demand” on
Assembly website

6
FY 2016 Audited Closing FY 2017 Revised Budget
FY 2018 Revenue-Expenditure Gap
Governor’s Recommended Solution
Operating Budget Overview
Capital Budget Overview
Outyears

FY 2017 budget counted on surplus
from FY 2016 to help fund expenses for
which there were no current revenues
Preliminary FY 2016 data showed $43.9
million gain to that assumption
Audited data showed $44.5 million gain
▪ Part of RIBCO cola impact shifted from FY 2017
▪ Additional $6.1 million Medicaid savings
7

Enacted Current Diff.
Opening $ 174.9 174.9 $ 0.0
Revenues 3,635.0 3,663.6 28.6
Rainy Day (114.1) (114.9) (0.9)
Expenditures (3,572.6) (3,547.9) 24.7
Closing Surplus 123.3 175.7 52.4
Reappropriation - (7.8) (7.8)
Free Surplus $ 123.3 $167.8 $ 44.5
8

General revenue spending $24.7
million (0.7%) below budgeted
amounts – but areas of overspending
Appropriation lines overspent even if
agency totals were not
Over 20% of general revenue lines were
overspent… Ongoing pattern
9

Spending $24.7 million below:
$7.8 million unspent & re-appropriated
$3.5 million DOA – utilities, staffing
$16.2 million Medicaid savings
$1.4 million administrative savings - EOHHS
$0.9 million overspent in BHDDH
$0.3 million overspent in Corrections before
$5.5 million RIBCO COLA impact
<$100 in Judiciary10

$16.2 million less for Medicaid -1.8 %
$9.1 million less for managed care programs
from claiming enhanced Medicaid match &
higher rebates
$2.7 million less for long term care
$4.4 million less for other programs
▪ Pharmacy, hospital & other medical services
11

BHDDH - $0.9 million overspend
$0.8 million more for privately provided
services in Division of Dev Disabilities
$0.1 million more for RICLAS
▪ Above $1.6 million added back for unachieved
initiative to move people to less intensive setting
$1.0 million in unachieved cost shift
$1.0 million less at state hospital
▪ $0.2 million less from all sources/shift to Medicaid
12

13
FY 2016 Audited Closing
FY 2017 Revised Budget FY 2018 Revenue-Expenditure Gap
Governor’s Recommended Solution
Operating Budget Overview
Capital Budget Overview
Outyears
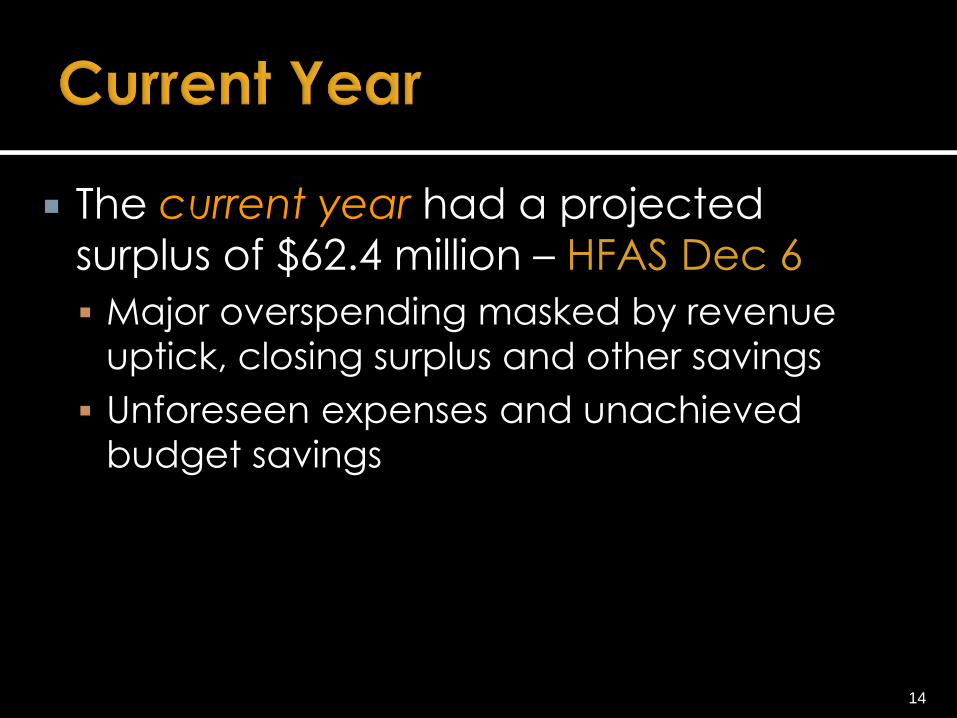
The current year had a projected
surplus of $62.4 million – HFAS Dec 6
Major overspending masked by revenue
uptick, closing surplus and other savings
Unforeseen expenses and unachieved
budget savings
14

Enacted Current Diff.
Opening $ 123.3 $175.1 $51.8*
Revenues 3,674.7 3,719.6 44.8
Rainy Day (113.9) (116.6) (2.7)
Expenditures (3,683.7) (3,715.7)* 32.0
Total FY 2017 $ 0.4 $62.4 $62.0
*Includes $7.8 million reappropriation
15

Reappropriation $ 7.8
Legislature* (1.3)
OHHS: Caseload Conference 4.7
OHHS: Other Programs 11.2
RIBCO Arbitration 9.4
Courts* 1.8
Other * (1.6)
Total $32.0* Items different than Budget Office Q1 estimates
16

17 agencies were projecting to spend
more than authorized in FY 2017
Some included new items that may
overstate actual overspend
17

Revenues are up by $44.8 million
Added resources increase rainy day
transfer by $2.7 million
Expenditures appear up by $19.4 million net
of re-appropriations and November
Caseload increase
Closing surplus up by $62.0 million
Governor’s FY 2017 revised ends with $78.0
million balance for use in FY 2018
18

19
Dec 6 HFAS est. Additional Surplus $62.0
Debt Service/Audit Adjustments 12.3
Judiciary 1.3
Clean Diesel Delay 2.0
State Police Contract (1.0)
Post CEC Medicare Part B Adjustment 1.5
License Plate shift to 2018 - Net 2.0
Other Adjustments (2.5)
Total Gov. additional Surplus $77.6

20
FY 2016 Audited Closing
FY 2017 Revised Budget
FY 2018 Revenue-Expenditure Gap Governor’s Recommended Solution
Operating Budget Overview
Capital Budget Overview
Outyears

There are budget year and out-year
problems
FY 2018 was estimated in July to have a
gap of approximately $182 million
Budget Office estimated higher gap of
$185 million
▪ Revenue projection differences and other
adjustments to long term savings
Revenue and expenditure trends
through Q1 reduced that to $112 million
21

22
FY 2016 Audited Closing
FY 2017 Revised Budget
FY 2018 Revenue-Expenditure Gap
Governor’s Recommended Solution Operating Budget Overview
Capital Budget Overview
Outyears

23
FY 2017 extra surplus $77.6
Revenues 59.6
Medicaid & EOHHS Agencies 45.8
Locals 0.6
Commerce (36.3)
Higher Education (10.5)
Debt and Shifts 8.4
Other Issues, Initiatives & Adjustments (33.3)
Total Governor Solution $112

24
Revenues
Medicaid/EOHHS
Locals
Commerce
Departments and Agencies
Higher Ed
Initiatives
Debt and Other

Revenues - $59.6 million Tax Changes - $8.7 million
Enhanced Collections - $36.3 million
Scoops/Transfers - $14.0 million
Other – $0.6 million
25

Tax Changes - $8.7 million
Cigarettes: up 50 cents per pack $8.7
Additional language proposed to clarify
existing law on what is taxable to aid
enforcement
Also enhances the penalties for
noncompliance
No direct revenues assumed
26

Enhanced Collections* - $36.3 million
Remote Sellers $34.7
Revenue Agents/Data Analysts $1.6
*net of costs
Also new enforcement powers and
penalties proposed
Scope of sales tax enforcement
expanded
No direct revenues assumed27

Scoops/Transfers - $14.0 million
Infrastructure Bank $1.0
Resource Recovery $6.0
RI Health & Educational Bldg. Corp $1.2
Turnpike and Bridge $2.6
Narragansett Bay Commission $2.5
Medical Marijuana Excess Receipts $0.7
28

Other - $0.6 million
Apprentice fees $(0.05)
Employee misclassifications $0.1
Electrical trades violations $0.1
Employer wage & hour violations $0.15
Failure to maintain payroll records $0.3
Increase rent charge to PUC $0.16
Eisenhower House rent to RR $(0.15)
29

30
Revenues
Medicaid/EOHHS
Locals
Commerce
Departments and Agencies
Higher Ed
Debt and Other
Initiatives

Medicaid Solution: $45.8 million
OHHS - $39.0 million in savings
Net of $1.6 million revenue loss
BHDDH - $1.4 million in savings
DCYF - $6.4 million in savings
DHS - $1.0 million add
31

Changes to Medicaid program
Wage increases and program
expansions
Increases are offset by changes to
current programs and way the state
delivers some benefits
32

Changes to enrollment options & rates
Healthy Aging in the Community Proposal
▪ Modifying Rhody Health Options Program aka
Integrated Care Initiative to exclude those who
are not considered “long term stay” in a nursing
facility
▪ Over 90 days
▪ Impacts Neighborhood Health Plan of RI, nursing
homes and home & community care providers
33

34
Healthy Aging in the
Community (HA)
GR All
Integrated Care Initiative – Exclude
longer term NH residents from
managed care
$7.9 $16.2
NH – Acuity Rate Reduction 5.2 10.7
NH - Census Reduction – 2.5% 2.5 5.1
Home & Comm. Care Expansion (3.3) (6.8)
Total $12.3 $25.2

Proposals also impact
Payments to managed care plans,
hospitals, and long term care providers
Community based providers for adults
w/developmental disabilities in BHDDH
State employees in RICLAS and at the
state hospital also at BHDDH
35

36
Impact to: GR All
Managed Care Plans $18.7 $36.3
Hospitals 12.1 29.5
LTC – Nursing Facilities 9.4 19.4
LTC – Home & Community Care (5.2) (10.7)
Insurers & Others 5.6 4.2
Developmental Disabilities (3.5) (7.1)
Eleanor Slater Hospital 4.9 8.1
Total $42.0 $79.7

37
Impact: Managed Care Plans GR All
HA – Exclude Longer Term Residents $11.7 $24.1
Administrative Rates 0.8 2.2
Provider Incentive Program &
Performance Goal Program
3.8 4.7
FQHC Payment 1.2 3.0
Patient Liability & Residency Req. 1.1 2.2
Total $18.6 $36.2

Impact: Hospitals GR All
Freeze at FY 2017 Rates $4.3 $12.5
1% Rate Reduction – 1/1/2018 0.9 2.6
UPL Payment – Reduce by 50% 4.0 9.9
Eliminate GME Payment 2.0 2.0
Behavioral Healthcare Inpatient
Rates
1.0 2.5
Total $12.2 $29.5
38

Impact: Nursing Facilities GR All
HA – Longer Term Residents from
Managed Care
($3.9) ($7.9)
HA- Acuity Payment Adjustment 5.2 10.7
HA -Nursing Home Utilization –
2.5% reduction in census
2.5 5.1
Freeze Rates at FY 2017 level 5.6 11.5
Total ($9.4) ($19.4)
39

Impact: Home & Community
Care
GR All
HA – Expansion ($3.3) ($6.8)
Increase Home Care Rates (2.5) (5.2)
Patient Liability Collections 0.6 1.2
Total ($5.2) ($10.7)
40

Impact: Insurers & Others GR All
Insurers - Children’s Health
Account
$3.6 -
Benefit coordination w/ Medicare
& Veterans Admin.
0.3 0.5
Estate Recoveries 0.3 0.5
Medicare Part B Payment 1.5 3.2
Total $5.6 $4.2
41

42
Dev. Disabilities Program GR All
Current Spending & Caseload ($4.8) ($9.8)
Direct Care Workers (3.0) (6.2)
Residential Placements 2.1 4.2
Approvals & Review Process 2.3 4.7
SIS Resource Levels 0.8 1.7
RICLAS (0.9) (1.8)
Total ($3.5) ($7.1)

43
Hospital Reorganization GR All
Close Pinel & move patients to
DCYF Youth Assessment Center
$2.1 $4.0
Transfer patients to lower cost non-
hospital setting
0.6 0.8
Privatize Lab & Non-patient Laundry 0.5 1.0
Close 1 Intermediate Care Fac. 0.7 1.0
Staffing & Other Medical Changes 1.0 1.3
Total $4.9 $8.1

Impact: Other GR All
DCYF – Caseload $6.4 $6.4
DHS - Subsidized Child Care (1.0) (1.0)
Total $5.4 $5.4
44

Other Issues
Article 12 - seeks approval for new
programs not funded in budget
Asthma Treatment Program ▪ DOH pilot program using federal funds
▪ State would pay for services
Opioid Treatment Centers for Excellence
▪ Using BHDDH federal funds for start-up
▪ State would have to pay for services
45

Other Issues
Unachieved savings from FY 2017
appear as new savings in FY 2018
Patient Liability
▪ Change included in FY 2017 budget to increase
collections
▪ No new system change to increase recoveries
Residency Requirements:
▪ Verifying that a recipient lives in RI
46

Other Issues
Reinventing Medicaid
Estate Recoveries
▪ No statutory language for any changes to expand
scope
Coordination of Benefits with Medicare
&Veterans Administration
▪ Guarantee that the state is the payor of last resort
47

48
Revenues
Medicaid/EOHHS
Locals
Commerce
Departments and Agencies
Higher Ed
Corrections
Initiatives
Debt and Other

Locals $0.6 million less
Education Aid - $3.9 million less
Formula education aid
Policy Choices and law changes
Local Aid - $3.3 million more
PILOT full funding – $3.2 million more
Library Construction - $0.1 million more
49

Funds 7th year of formula
Adds $40.0 million based on updated data
Adds $4.1 million in stabilization funding to
Central Falls, Davies and Met
$0.7 million less for group home aid
Distributions calculated by Dept. based
on transition guidance in law
Gaining communities fully phased in
Subject to change with March data
50

$25.0 million for categorical aid
Most categorical funds at enacted level
$4.5 million for High Cost Special Ed
$4.5 million for Career & Tech
$6.4 million for Transportation
Out years assumed growth
Lack of increase part of budget solve
New out year estimates hold flat
51

Early Childhood
$6.2 million, $1.1 million more
With matching federal money will add 4
classrooms from 56 to 60
Density Aid: Year 2 of a 3-year program
$0.9 million, $0.6 million less
6 districts eligible for $100 per student
enrolled in charter or state school
▪ District must have at least 5% of students enrolled
at school of choice
52
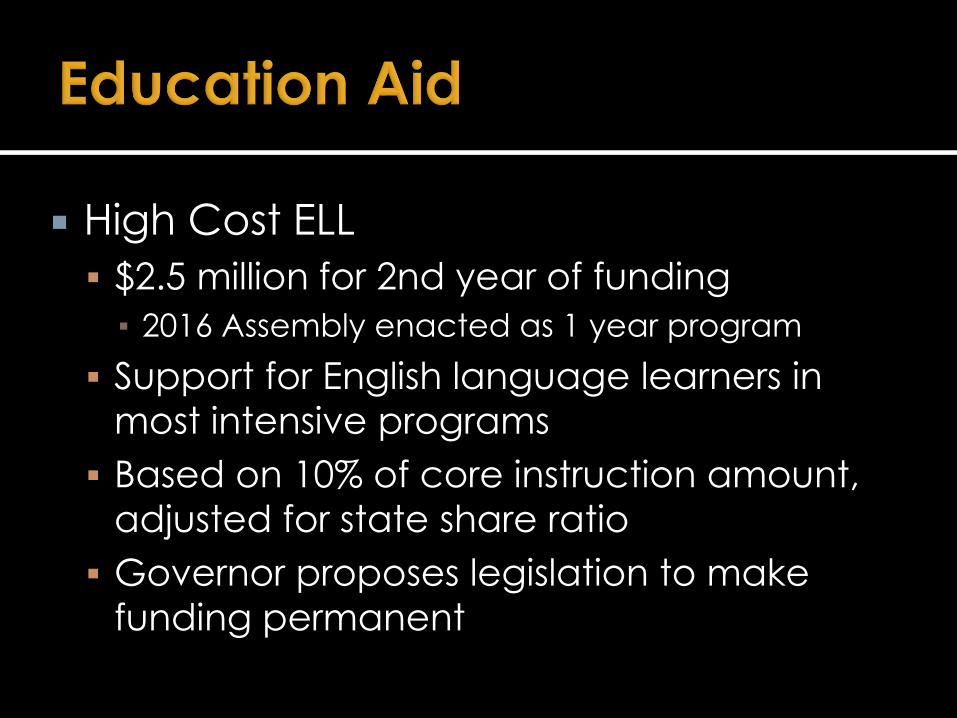
High Cost ELL
$2.5 million for 2nd year of funding
▪ 2016 Assembly enacted as 1 year program
Support for English language learners in
most intensive programs
Based on 10% of core instruction amount,
adjusted for state share ratio
Governor proposes legislation to make
funding permanent
53

Recovery High School
For students recovering from a substance
abuse disorder
$500,000 for 2nd year of funding
2016 Assembly enacted for 1 year only
Change to current law would be required
Teacher Retirement
$100.7 million, $1.6 million more
54

Traditional School Construction Aid
$70.9 million
New School Building Authority Fund
$9.1 million
Same as enacted but final split will be
based on costs for traditional program
Current law requires traditional aid be
transferred to Fund
55

(in millions)
FY 2017
Enacted
FY 2017
Revised
FY 2018
Rec.
Dist. Communities $ 12.4 $ 12.4 $ 12.4
PILOT 42.0 42.0 45.2
Motor Vehicle Excise 10.0 10.0 10.0
Total $ 64.4 $ 64.4 $ 67.6
56

(in millions)
FY 2017
Enacted
FY 2017
Revised
FY 2018
Rec.
Library Resource* $ 9.4 $ 9.4 $ 9.4
Library Construction 2.2 2.2 2.3
Property Revaluation 0.6 0.6 0.9
Oversight Reimburse. 0.2 0.1 0.1
Total $ 12.3 $ 12.3 $ 12.7
57
*Includes Reference Library Resource Grant to Providence

Distressed
Communities -
$12.4 million
Same as enacted
Redistribution
among
communities
based on data
7 qualify Johnston receives 50%
transition payment for entry
Central Falls
North Providence
Pawtucket Providence
West Warwick
Woonsocket
Cranston receives 50%
transition payment out
58

PILOT - $45.2 million
Full funding – 27% of the value
$3.2 million more than FY 2017
Car Tax Phase-Out - $10 million
Enacted level
FY 2017 and FY 2018 distributions still
pending updates
Budget proposes change for FY 2019
59

Library Resource Aid - $9.4 million
22.8 % of eligible expenses
Law allows up to 25%
FY 2018 same as FY 2017
Library Construction Aid - $ 2.3 million
Full funding
60

Property Valuation Reimbursements -
FY 2017 - $0.8 million
FY 2018 - $0.9 million
Reimbursements to 7 communities in each
year
61

62
Revenues
Medicaid/EOHHS
Locals
Commerce
Departments and Agencies
Higher Ed
Corrections
Initiatives
Debt and Other

63
2015 Assembly enacted 15 programs as
part of the FY 2016 budget in support of
the Governor’s economic strategy
5 tax incentive programs
10 other programs, investments & initiatives
Partially funded from debt restructuring
2016 Assembly added 1 more program
and revised others

64
FY 2018 Budget increases funding for
commerce programs by $36.3 million
above levels assumed in FY 2018
projections
Adds funding to established funds
Mix of one-time and ongoing programs
Changes to approved programs

65
Current Programs 2016 2017 2017R 2018
Closing Fund $ 5.0 $ 7.0 $8.5 $ -
I-195 Redevelopment 25.0 - - 10.1
Rebuild RI Tax Credits 1.0 25.0 25.0 20.0
Wavemaker Fellowships 1.8 5.0 3.5 1.6
Anchor Institution 0.8 0.7 0.7 -
Streetscape Improvement 1.0 1.0 1.0 1.0

66
Current Programs 2016 2017 2018
Industry Cluster Grants $ 0.8 $ 0.5 $ -
Innovation Initiative 2.0 1.5 2.5
P-Tech 0.9 1.2 1.2
Small Biz Innovative
Research
1.0 1.0 1.0

67
Proposed Programs 2018
Manufacturing Investment Tax Credit $ 3.25
Job Training Tax Credit 2.0
Municipal Technical Assistance 0.25
Total $5.5

68
Extends existing tax credits to more
entities and makes them refundable
Manufacturing Investment Tax Credit
Job Training Tax Credit
Municipal Technical Assistance
evaluate and streamline zoning, planning
and permitting

69
Expands Support to Polaris
Adds $300,000 to provide $550,000 total
Technical assistance to RI manufacturers
National Security Infrastructure
$200,000 for grants and loans
Support national security infrastructure
Strategies to repurpose surplus defense
facilities and properties

70
Revenues
Medicaid/EOHHS
Locals
Commerce
Departments and Agencies
Higher Ed
Corrections
Initiatives
Debt and Other
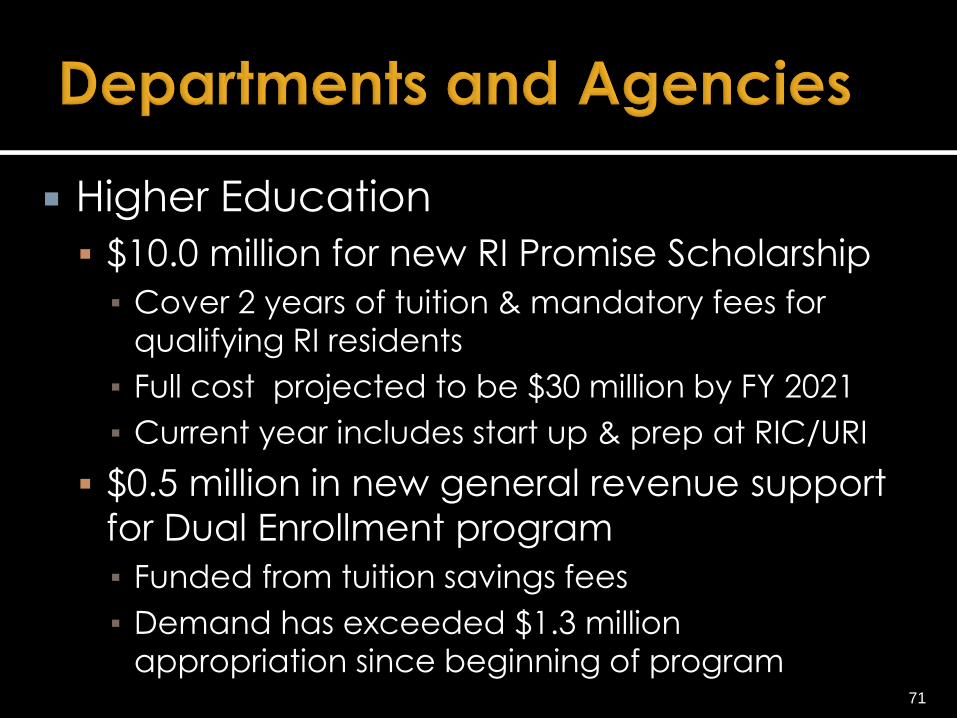
Higher Education
$10.0 million for new RI Promise Scholarship
▪ Cover 2 years of tuition & mandatory fees for
qualifying RI residents
▪ Full cost projected to be $30 million by FY 2021
▪ Current year includes start up & prep at RIC/URI
$0.5 million in new general revenue support
for Dual Enrollment program
▪ Funded from tuition savings fees
▪ Demand has exceeded $1.3 million
appropriation since beginning of program71
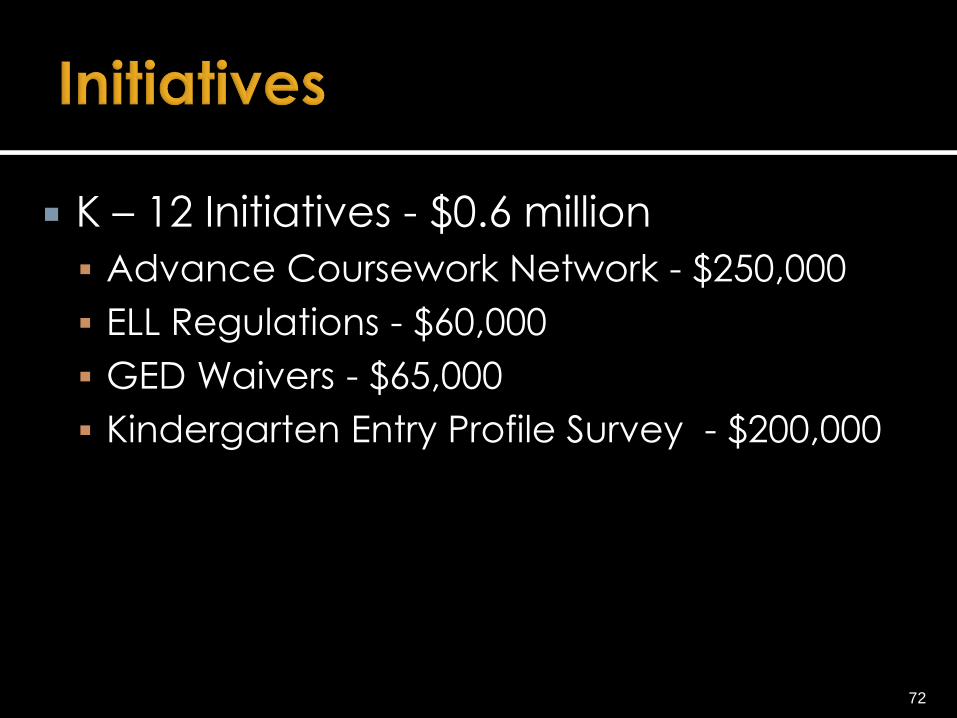
K – 12 Initiatives - $0.6 million
Advance Coursework Network - $250,000
ELL Regulations - $60,000
GED Waivers - $65,000
Kindergarten Entry Profile Survey - $200,000
72

Justice Reinvestment - $0.5 million
Pre-Arrest Diversion Program - $0.2 million
▪Mental health program in Public Defender’s
budget
Batterers’ Intervention – $0.1 million
▪ Support for domestic violence intervention
programs
Recovery Houses - $0.2 million
73

Public Safety Personnel - $3.3 million
New Department of Public Safety
personnel - $1.8 million
▪ Includes new commissioner and support staff
▪Other civilian employees
EMA merged and new FTE
Contract settlements- $1.3 million
74

Environment - $3.1 million
Outdoor recreation investment - $2.5 million
Electric vehicle rebate - $0.3 million
Local Ag. & Seafood grants- $0.1 million
▪ Provides total of $0.2 million
Conservation district grants - $50,000
75

Other noteworthy items
Division of Taxation computer system
support - $1.0 million
Support for Volvo Ocean Race - $0.8 million
Minimum Wage Increase to $10.50
Changes to program administration
▪ Lead
▪Health Care Utilization
76

Health & Human Services - $1.9 million
Bus Passes- $0.3 million for elderly/disabled
Head Start - $0.4 million
Health Care Innovation - $0.3 million
▪ Spending and Trend Analysis
Tobacco Control - $0.5 million
DOC Mental Health Initiatives – $0.4 million
77

Debt and Other $8.4 million
$12.5 million from impact of 38 studios
settlement
Next payment likely due in FY 2020/21
Delay of License plate reissuance
78

79
Fraud and Waste - $3.5 million
Extension of current year initiative not
implemented yet
Workers Compensation - $1.3 million
Outsource administration
E- Procurement - $0.4 million

80
FY 2017 extra surplus $77.6
Revenues 59.6
Medicaid & EOHHS Agencies 45.8
Locals 0.6
Commerce (36.3)
Higher Education (10.5)
Debt and Shifts 8.4
Other Issues, Initiatives & Adjustments (33.3)
Total Governor Solution $112

81
FY 2016 Audited Closing
FY 2017 Revised Budget
FY 2018 Revenue-Expenditure Gap
Governor’s Recommended Solution
Operating Budget Overview Capital Budget Overview
Outyears

82
Enacted Budget Change
Gen. Rev. $3,683.7 $3,792.7 $109.0
Federal 2,957.1 3,081.8 124.8
Restricted 257.0 273.8 16.8
Other 2,040.9 2,099.7 58.8
Total $8,938.7 $9,248.1 $309.3

$0 $500 $1,000 $1,500 $2,000 $2,500 $3,000
Federal GrantsPersonal Income
SalesUniversity & College
Misc. OtherBusiness TaxesDepartmental
LotteryUI and TDIRestricted
Other TaxesGas Tax
83

Gen. Govt.
17.5%
Human
Svcs. 40.6%
Education
28.4%
Public
Safety 6.4%
Nat. Res.
1.4%
Transp.
6.3%
84

Personnel &
Operating
31.0%
Local Aid
14.7%
Asst.,
Grants,
Benefits
44.6%
Capital 7.8%
Operating
Xfers 1.9%
85

Gen. Govt.
13.3%
Human
Svcs. 36.7%
Education
36.6%
Public
Safety 12.2%
Nat. Res.
1.2%
86

Personnel &
Operating
29.4%
Local Aid
31.4%
Asst., Grants,
Benefits
33.0%Capital 4.9%
Operating
Xfers 1.3%
87

88
Salaries and Benefits
Increase of 2.2% from enacted
General revenues increase 2.7%
Reflects updated benefit rates
Adds $24 million to fill 200+ new positions
Some are for revenue enhancements
Many replace positions that will be held
vacant or eliminated
FTE authorization increases by 114.8

Classification Issues
FY 2017 and FY 2018 include total of $0.9
million from general revenues for
classification and compensation study
▪ Completion – Summer 2017 – more than a year
later than last year’s estimate
Continues work begun with 2013 study
and review of the personnel system
89

Administrative Changes
Repeals Assembly notification in determining
cabinet directors’ salaries
Limits rights for certain staff to return to prior
positions after probation dismissal
Adds more positions to unclassified service
90

91
Regular 3rd Party Total
FY 2016 Avg. 13,097.9 591.7 13,689.6
FY 2017 Enacted 14,206.8 745.8 14,952.6
FY 2017 Rev. 14,289.1 745.8 15,034.9
Governor FY 18 14,321.6 745.8 15,067.4
Jan 7 Filled 13,184.4 613.4 13,797.8
Diff from Enacted (1,022.4) (132.4) (1,154.8)
Diff from Gov. (1,137.2) (132.4) (1,269.6)

Transparency issues
Staffing authorizations for appointing
authorities increasingly separate from
funding allocations
▪ Governor’s office “charging” agencies for
several staff members based on policy area of
responsibility
▪ Centralizes 90 new positions into EOHHS as
required under current law
▪ Funding is left in sending agencies; FTE count in EOHHS
92

93
Contracted Services
Decreases 14.7% from enacted
▪ Primarily related to UHIP
▪ General revenues decrease 5.5%
In prior sessions Assembly required state
agencies to be held more accountable
for contract services they purchase
▪ Revised requirements for easier compliance
▪ Reports still not posted

94
Contracted Services
General Assembly requirements:
▪ list privatization contracts
▪ quarterly reports of non-state employee
expenditures for legal and other services
▪ 5.5% assessment to be paid to the retirement
system - Pension Reform

95
Operating Costs
Increase 3.3% from enacted
▪ Nearly half of the increase relates to how lottery
activity is accounted for
▪ Another 38% is related to Higher Education sources
3.4% decrease from general revenues
Largely reflects savings initiatives noted earlier

96
FY 2016 Audited Closing
FY 2017 Revised Budget
FY 2018 Revenue-Expenditure Gap
Governor’s Recommended Solution
Operating Budget Overview
Capital Budget Overview Outyears

FY 2018 – FY 2022
$4.7 billion outlays
Average $946.4 million per year
$987.7 million from financing $3,744.1
million from current revenue
97

Pay-go,
79.1%
Debt
Funding,
20.9%
98

1990 Assembly set up the “rainy day”
fund to ensure adequate cash and
budget reserves
Voter referendum in November 1992
Largest source of state funded pay-go
State spending limited to 97.0% of
general revenues
FY 2013 was end of 5-year move from
98.0%
99

Remainder goes to Budget Stabilization
& Cash Reserve Account
When that reaches 5.0%, excess flows
to the capital account
Previously used mostly to pay debt
Voters amended constitution in 2006 to
limit use for projects only
Dedication of pay-go sources to
capital lessens need to issue debt
100

$0$20$40$60$80
$100$120$140$160$180$200
Projects Debt Service
101

102
Resources in the Fund have grown
over time
Being used for its intended purpose:
lowering the state’s borrowing needs
Annual $27.2 million is being used in lieu of
borrowing to match federal transportation
funds

$650.9 million for FY 2018 – FY 2022
Approximately $130 million annually
30% for Transportation
22% for Higher Education
103

Improvements for state buildings
Courts, prisons, hospitals
State facilities
Dams, piers, parks
Designed to extend the life of facilities
Prevent the need for costly replacements
104

105
Appropriate Pay-Go (Articles 1 & 10) Approve General Obligation Bond
Referenda Voters approve or reject
Debt service automatic
Other Financing (Kushner) Approve or reject resolution
Generally appropriate debt service

Project and Debt TypeAmount
Borrowed
Annual
Debt Source
Certificates of Participation
Info. Tech. Improvements $16.2 $2.1 Gen. Rev.
Energy Improv. State Facilities 12.0 1.7Energy savings
Confined Aquatic Dredged
Material Disposal Cells10.5 1.4
Users fees,
Gen. Rev.
URI Energy Performance -
Phase III11.6 1.1 Energy savings
Revenue Bonds
URI White Horn Brook
Apartments88.8 5.9
Dorm fees,
tuition, Gen.
Rev.
Total $139.1 $12.1
106

107
State’s overall debt structure
Net tax supported debt would decrease
by $414.0 million to $1,521.1 million
Had dropped to $1.3 billion in FY 2003
after use of tobacco bonds to defease
debt
Past practice indicates it will be higher as
more projects are added

Debt as a percent of personal income
would increase from 3.1% in FY 2017 to
3.4% into FY 2018
Refunding of state debt
Would then drop to 2.2% in FY 2022, but
likely to be higher based on projects
being added
Does not assume any new referenda will
go before voters in November 2018 or 2020
▪ Departure from past practice108

Fiscal
Year
Net Tax
Supported
Debt Service*
Pct. of
Revenues
2017 $197.7 5.3%
2018 $227.8 5.9%
2019 $231.9 5.9%
2020 $253.4 6.3%
2021 $252.6 6.2%
2022 $238.3 5.7%*Millions
109

0.0%
1.0%
2.0%
3.0%
4.0%
5.0%
6.0%
7.0%
FY 2017 FY 2018 FY 2019 FY 2020 FY 2021 FY 2022
Current Debt Service New Debt Service
110

Five-year forecast required by statutes
FY 2019 gap One-time items in the resolution of the
current budget gap Use of Surplus
Scoops
Programs not reflected in FY 2018
Tiverton Casino assumed to mitigate MA
gaming losses in prior forecasts
Sales tax growth stronger based on remote
sales initiative111

112
EstimatedShare Useable
Revenues
FY 2019 $(150.0) 4.0%
FY 2020 $(184.1) 4.8%
FY 2021 $(192.6) 4.9%
FY 2022 $(194.1) 4.8%
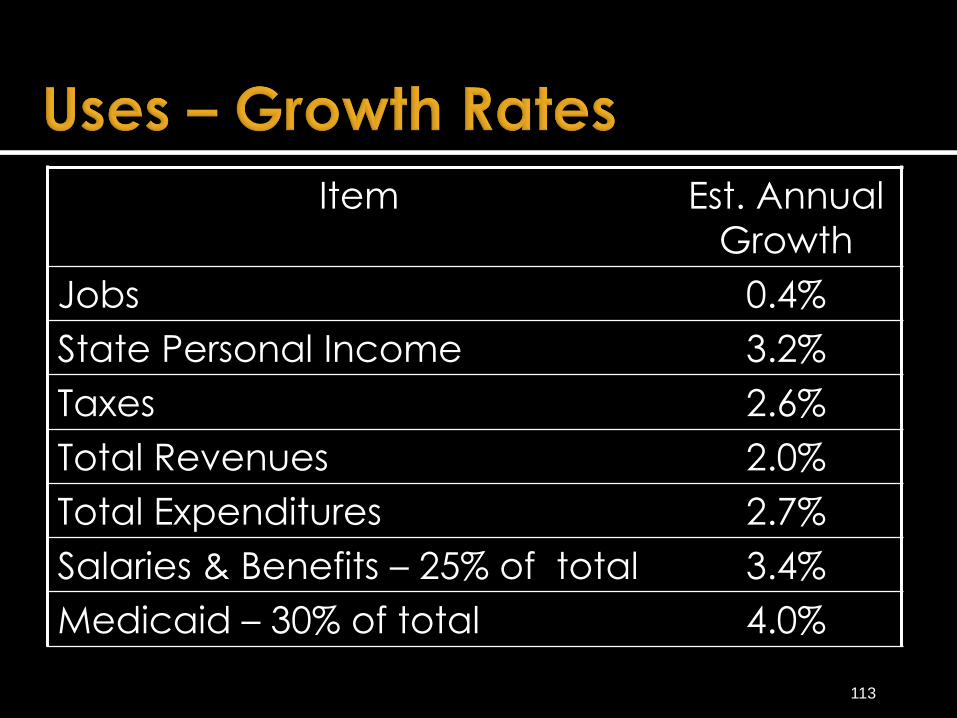
Item Est. Annual
Growth
Jobs 0.4%
State Personal Income 3.2%
Taxes 2.6%
Total Revenues 2.0%
Total Expenditures 2.7%
Salaries & Benefits – 25% of total 3.4%
Medicaid – 30% of total 4.0%
113

Medicaid savings and caseloads
UHIP impacts
Future federal action
Control of current year spending
Revised budget assumes success of
certain initiatives
DMV computer system
Potential for cyclical economic event
Demographic issues
114

Staff Presentation to the
House Finance Committee
February 2 , 2017