1 of 5© boardworks ltd 2011 drawing and analysing graphs
TRANSCRIPT

1 of 5 © Boardworks Ltd 2011
Drawing and Analysing Graphs

2 of 5 © Boardworks Ltd 2011
Links to the new 2011 specifications
AQAGCSE Science A
SA4.4.2 b) drawing charts and graphsSA4.4.2 c) choosing the most appropriate form of presentationSA4.5.3 a) describing the relationship between two variables
EdexcelGCSE in Science
Unit SCAPart B – Observations: Primary evidence and recordingPart C – Conclusions: Processing evidence; Conclusions based on evidence
OCRGCSE in Science A21st Century Science Suite
5.2.3Ideas about Science 1.6Ideas about Science 2.3Ideas about Science 2.4
OCRGCSE in Science BGateway Science Suite
5.3.2Part 2 – Planning and collecting primary dataPart 3 – Analysis and evaluation

3 of 5 © Boardworks Ltd 2011
As part of your GCSE Science course you will be assessed on your ability to plan, carry out, analyse the results of and evaluate investigations.
Planning an investigation
You will be expected to present and analyse results in order to reach a clear conclusion.
What should you consider when analysing your results and coming to a conclusion?

4 of 5 © Boardworks Ltd 2011
Drawing a graph makes it easier to spot trends and patterns in results. However, it must be neat, clear and easy to interpret.
Label the axes with the names of the independent and dependent variables and any units.
Put the independent variable on the horizontal axis unless you are told otherwise.
Choose scales that let your graph fill the paper. You do not need to start at zero.
Presenting results: graphs
Don’t forget to add a title that shows what the graph is about.
5 of 5 © Boardworks Ltd 2011
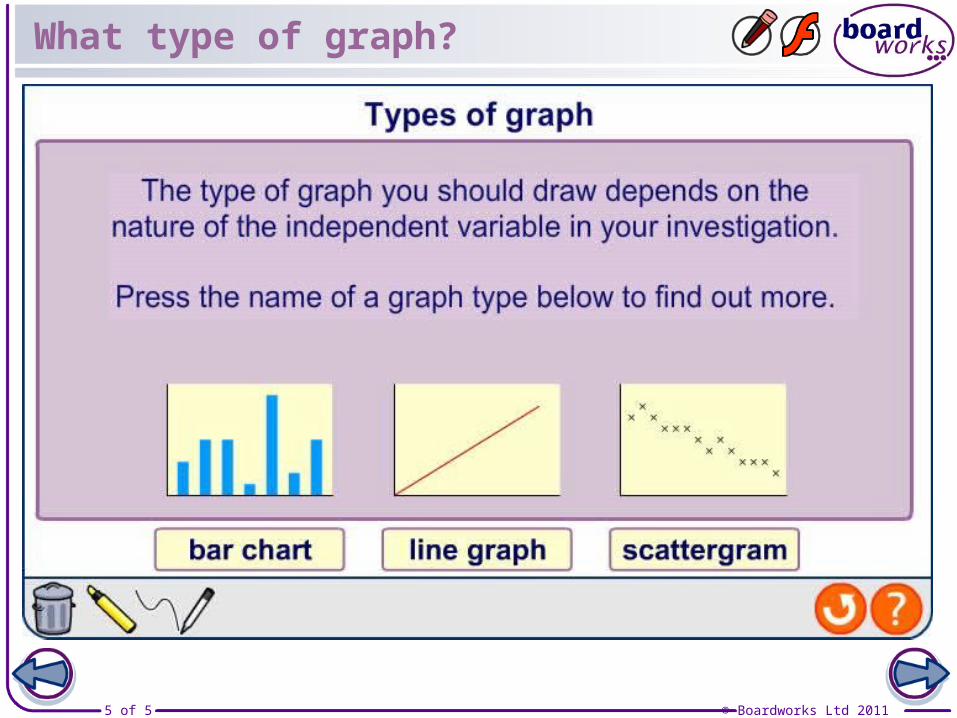
What type of graph?