1. performance for the fiscal period ended october … · ninth fiscal period has been assumed for...
TRANSCRIPT
KENEDIX OFFICE INVESTMENT CORPORATION (8972)
Translation of Japanese Original
FINANCIAL REPORT FOR THE FISCAL PERIOD ENDED October 31, 2018 (REIT)
(May 1, 2018 to October 31, 2018) December 12, 2018
Kenedix Office Investment Corporation is listed on the Tokyo Stock Exchange with the securities code number 8972.
Representative: Jiro Takeda, Executive Director
Asset Management Company: Kenedix Real Estate Fund Management, Inc.
Representative: Masahiko Tajima, President & CEO
Inquiries: Hiroaki Momoi, Head of Planning Division, Office REIT Department
TEL +81-3-5157-6010
Planned submission of semiannual securities report: January 30, 2019 Planned start of distribution payments: January 21, 2019
Preparing presentation material: Yes・No
Hold a financial brief meeting: Yes・No (for institutional investors and analysts)
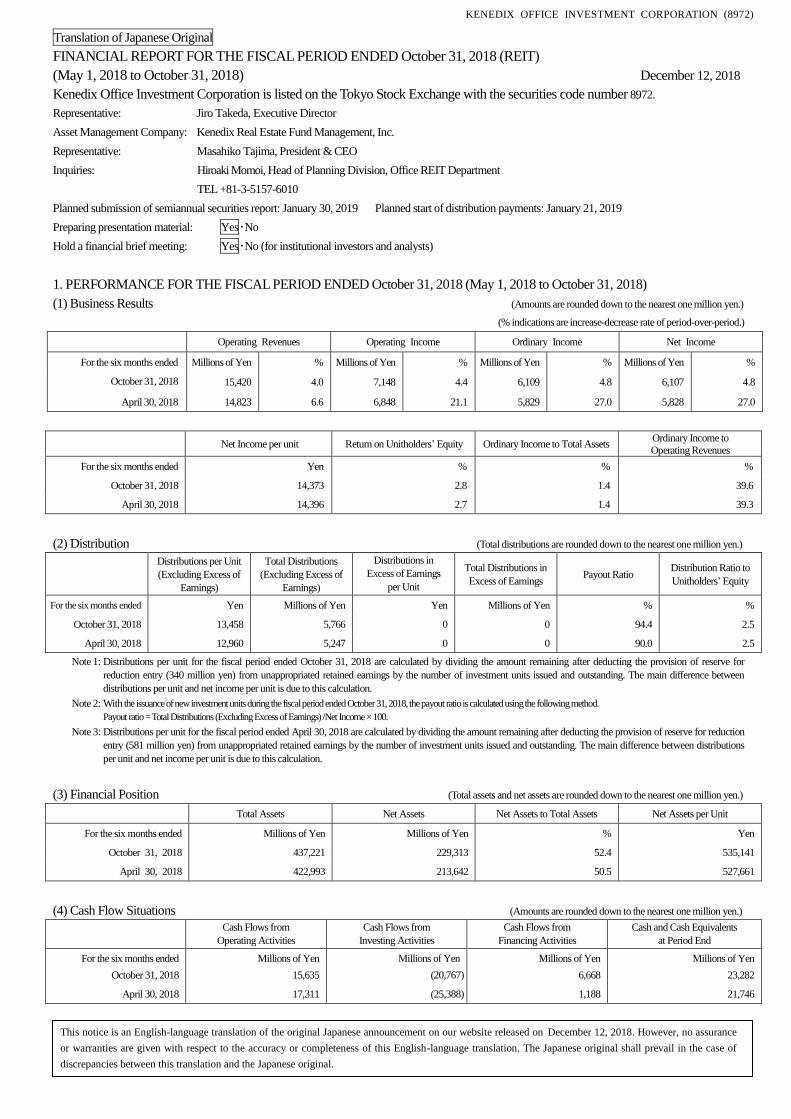
1. PERFORMANCE FOR THE FISCAL PERIOD ENDED October 31, 2018 (May 1, 2018 to October 31, 2018)
(1) Business Results (Amounts are rounded down to the nearest one million yen.)
(% indications are increase-decrease rate of period-over-period.)
Operating Revenues Operating Income Ordinary Income Net Income
For the six months ended Millions of Yen % Millions of Yen % Millions of Yen % Millions of Yen %
October 31, 2018 15,420 4.0 7,148 4.4 6,109 4.8 6,107 4.8
April 30, 2018 14,823 6.6 6,848 21.1 5,829 27.0 5,828 27.0
Net Income per unit Return on Unitholders’ Equity Ordinary Income to Total Assets Ordinary Income to
Operating Revenues
For the six months ended Yen % % %
October 31, 2018 14,373 2.8 1.4 39.6
April 30, 2018 14,396 2.7 1.4 39.3
(2) Distribution (Total distributions are rounded down to the nearest one million yen.)
Distributions per Unit
(Excluding Excess of
Earnings)
Total Distributions
(Excluding Excess of
Earnings)
Distributions in
Excess of Earnings
per Unit
Total Distributions in
Excess of Earnings Payout Ratio
Distribution Ratio to
Unitholders’ Equity
For the six months ended Yen Millions of Yen Yen Millions of Yen % %
October 31, 2018 13,458 5,766 0 0 94.4 2.5
April 30, 2018 12,960 5,247 0 0 90.0 2.5
Note 1: Distributions per unit for the fiscal period ended October 31, 2018 are calculated by dividing the amount remaining after deducting the provision of reserve for
reduction entry (340 million yen) from unappropriated retained earnings by the number of investment units issued and outstanding. The main difference between
distributions per unit and net income per unit is due to this calculation.
Note 2: With the issuance of new investment units during the fiscal period ended October 31, 2018, the payout ratio is calculated using the following method.
Payout ratio = Total Distributions (Excluding Excess of Earnings) /Net Income × 100.
Note 3: Distributions per unit for the fiscal period ended April 30, 2018 are calculated by dividing the amount remaining after deducting the provision of reserve for reduction
entry (581 million yen) from unappropriated retained earnings by the number of investment units issued and outstanding. The main difference between distributions
per unit and net income per unit is due to this calculation.
(3) Financial Position (Total assets and net assets are rounded down to the nearest one million yen.)
Total Assets Net Assets Net Assets to Total Assets Net Assets per Unit
For the six months ended Millions of Yen Millions of Yen % Yen
October 31, 2018 437,221 229,313 52.4 535,141
April 30, 2018 422,993 213,642 50.5 527,661
(4) Cash Flow Situations (Amounts are rounded down to the nearest one million yen.)
Cash Flows from
Operating Activities
Cash Flows from
Investing Activities
Cash Flows from
Financing Activities
Cash and Cash Equivalents
at Period End
For the six months ended Millions of Yen Millions of Yen Millions of Yen Millions of Yen
October 31, 2018 15,635 (20,767) 6,668 23,282
April 30, 2018 17,311 (25,388) 1,188 21,746
This notice is an English-language translation of the original Japanese announcement on our website released on December 12, 2018. However, no assurance
or warranties are given with respect to the accuracy or completeness of this English-language translation. The Japanese original shall prevail in the case of
discrepancies between this translation and the Japanese original.
KENEDIX OFFICE INVESTMENT CORPORATION (8972)
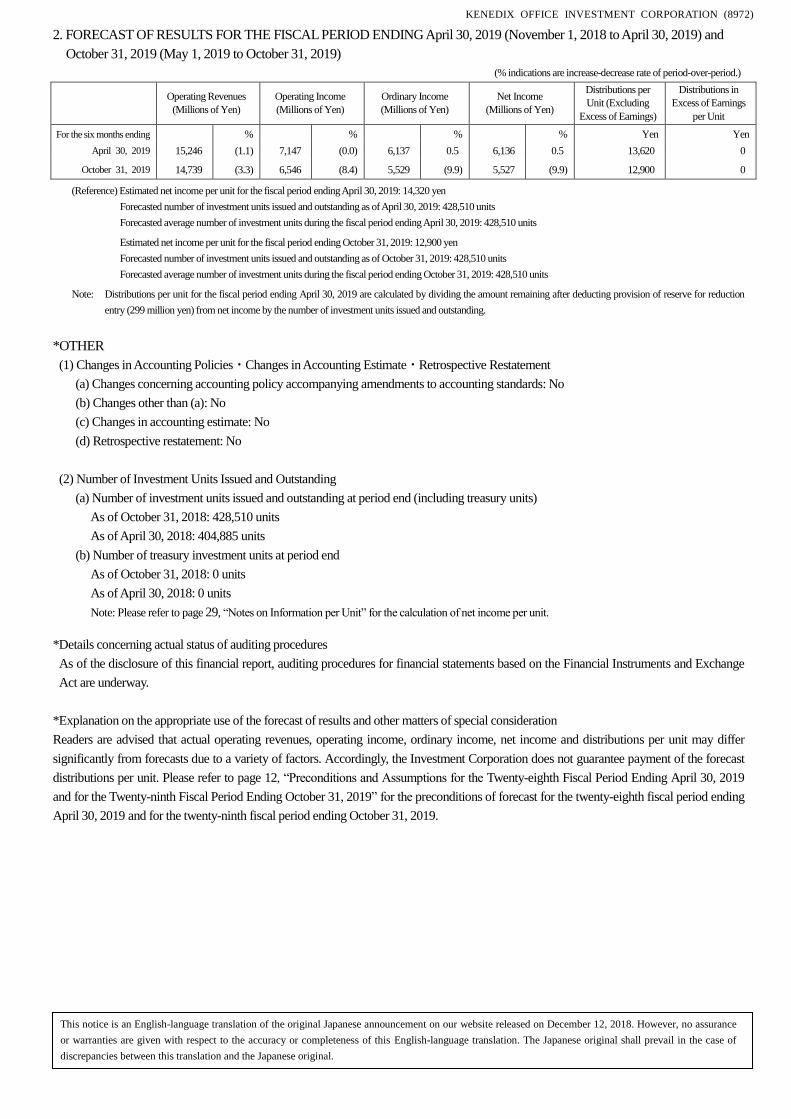
2. FORECAST OF RESULTS FOR THE FISCAL PERIOD ENDING April 30, 2019 (November 1, 2018 to April 30, 2019) and
October 31, 2019 (May 1, 2019 to October 31, 2019)
(% indications are increase-decrease rate of period-over-period.)
Operating Revenues
(Millions of Yen)
Operating Income
(Millions of Yen)
Ordinary Income
(Millions of Yen)
Net Income
(Millions of Yen)
Distributions per
Unit (Excluding
Excess of Earnings)
Distributions in
Excess of Earnings
per Unit
For the six months ending % % % % Yen Yen
April 30, 2019 15,246 (1.1) 7,147 (0.0) 6,137 0.5 6,136 0.5 13,620 0
October 31, 2019 14,739 (3.3) 6,546 (8.4) 5,529 (9.9) 5,527 (9.9) 12,900 0
(Reference) Estimated net income per unit for the fiscal period ending April 30, 2019: 14,320 yen
Forecasted number of investment units issued and outstanding as of April 30, 2019: 428,510 units
Forecasted average number of investment units during the fiscal period ending April 30, 2019: 428,510 units
Estimated net income per unit for the fiscal period ending October 31, 2019: 12,900 yen
Forecasted number of investment units issued and outstanding as of October 31, 2019: 428,510 units
Forecasted average number of investment units during the fiscal period ending October 31, 2019: 428,510 units
Note: Distributions per unit for the fiscal period ending April 30, 2019 are calculated by dividing the amount remaining after deducting provision of reserve for reduction
entry (299 million yen) from net income by the number of investment units issued and outstanding.
*OTHER
(1) Changes in Accounting Policies・Changes in Accounting Estimate・Retrospective Restatement
(a) Changes concerning accounting policy accompanying amendments to accounting standards: No
(b) Changes other than (a): No
(c) Changes in accounting estimate: No
(d) Retrospective restatement: No
(2) Number of Investment Units Issued and Outstanding
(a) Number of investment units issued and outstanding at period end (including treasury units)
As of October 31, 2018: 428,510 units
As of April 30, 2018: 404,885 units
(b) Number of treasury investment units at period end
As of October 31, 2018: 0 units
As of April 30, 2018: 0 units
Note: Please refer to page 29, “Notes on Information per Unit” for the calculation of net income per unit.
*Details concerning actual status of auditing procedures
As of the disclosure of this financial report, auditing procedures for financial statements based on the Financial Instruments and Exchange
Act are underway.
*Explanation on the appropriate use of the forecast of results and other matters of special consideration
Readers are advised that actual operating revenues, operating income, ordinary income, net income and distributions per unit may differ
significantly from forecasts due to a variety of factors. Accordingly, the Investment Corporation does not guarantee payment of the forecast
distributions per unit. Please refer to page 12, “Preconditions and Assumptions for the Twenty-eighth Fiscal Period Ending April 30, 2019
and for the Twenty-ninth Fiscal Period Ending October 31, 2019” for the preconditions of forecast for the twenty-eighth fiscal period ending
April 30, 2019 and for the twenty-ninth fiscal period ending October 31, 2019.
This notice is an English-language translation of the original Japanese announcement on our website released on December 12, 2018. However, no assurance
or warranties are given with respect to the accuracy or completeness of this English-language translation. The Japanese original shall prevail in the case of
discrepancies between this translation and the Japanese original.
KENEDIX OFFICE INVESTMENT CORPORATION (8972)
- 1 -
Index
1. Basic Structure — Related Companies of the Investment Corporation ·························································· P02
2. Management Policy and Operating Conditions ····················································································· P03
(1) Management Policy ··········································································································· P03
(2) Operating Conditions ·········································································································· P03
(3) Risk Factors ····················································································································· P09
(4) Outlook ·························································································································· P 11
3. Financial Statements ·················································································································· P 14
(1) Balance Sheets ················································································································ P 14
(2) Statements of Income ········································································································· P 16
(3) Statements of Unitholders’ Equity ·························································································· P 17
(4) Basis for Calculating Cash Distribution ···················································································· P 18
(5) Statements of Cash Flows ···································································································· P 19
(6) Notes on Going Concern ····································································································· P 20
(7) Important Accounting Standards ···························································································· P 20
(8) Notes on Changes in Presentation or Classification ········································································· P 21
(9) Notes on Financial Statements ······························································································ P 21
(10) Changes in the Number of Investment Units Issued and Outstanding ·················································· P 30
4. Resignation/Appointment of the Director ·························································································· P 30
(1) Resignation/Appointment of the Director of the Investment Corporation ············································· P 30
(2) Resignation/Appointment of the Director of the Asset Management Company ······································ P 30
5. Reference Information ················································································································ P 31
(1) Component of Assets ········································································································· P 31
(2) Details of Investment Assets ································································································· P 31
(Reference Information) Status of Income for Individual Properties ······························································· P 43
(Reference Information) Status of Borrowings ······················································································· P 51
KENEDIX OFFICE INVESTMENT CORPORATION (8972)
- 2 -
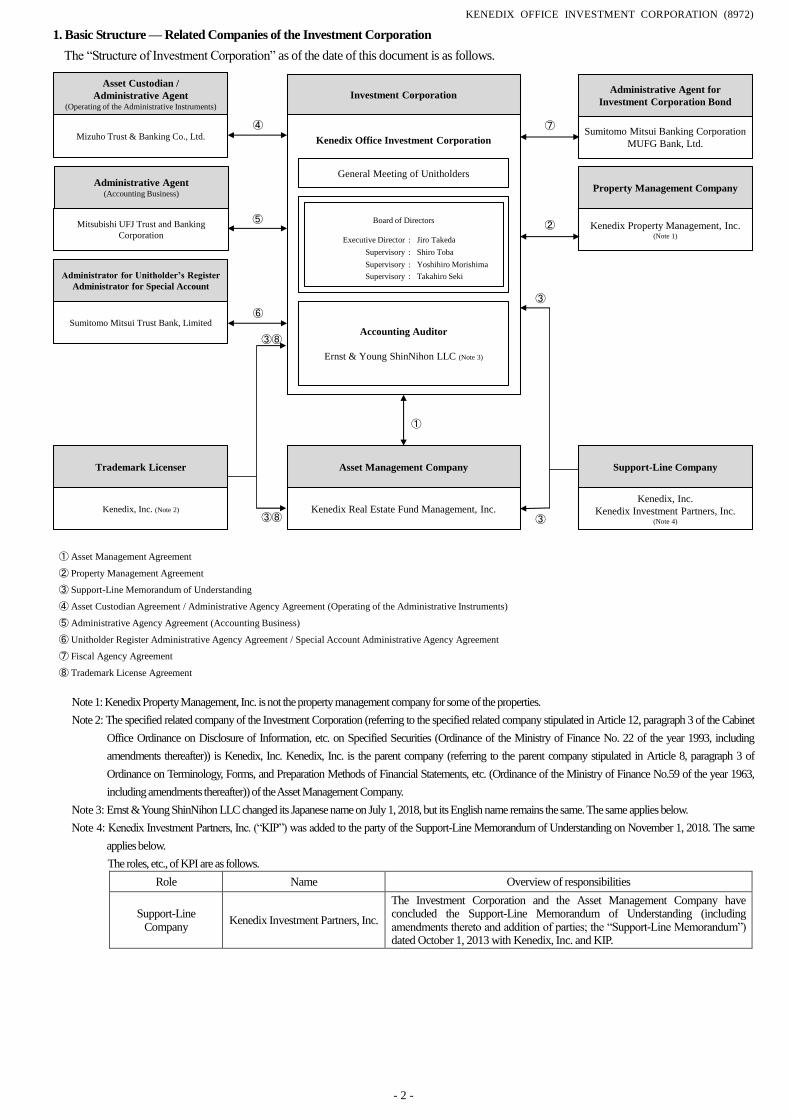
1. Basic Structure — Related Companies of the Investment Corporation
The “Structure of Investment Corporation” as of the date of this document is as follows.
Asset Custodian /
Administrative Agent(Operating of the Administrative Instruments)
Mizuho Trust & Banking Co., Ltd.
Administrative Agent(Accounting Business)
Mitsubishi UFJ Trust and Banking
Corporation
Administrator for Unitholder’s Register
Administrator for Special Account
Sumitomo Mitsui Trust Bank, Limited
Trademark Licenser
Kenedix, Inc. (Note 2)
Asset Management Company
Kenedix Real Estate Fund Management, Inc.
Investment Corporation
Kenedix Office Investment Corporation
Accounting Auditor
Ernst & Young ShinNihon LLC (Note 3)
General Meeting of Unitholders
Support-Line Company
Kenedix, Inc.
Kenedix Investment Partners, Inc.(Note 4)
④
⑤
⑥
①
③
Board of Directors
Executive Director : Jiro Takeda
Supervisory Shiro Toba
Supervisory : Yoshihiro Morishima
Supervisory : Takahiro Seki
:
③
③⑧
③⑧
➆
②
Administrative Agent for
Investment Corporation Bond
Sumitomo Mitsui Banking Corporation
MUFG Bank, Ltd.
Property Management Company
Kenedix Property Management, Inc.(Note 1)
① Asset Management Agreement
② Property Management Agreement
③ Support-Line Memorandum of Understanding
④ Asset Custodian Agreement / Administrative Agency Agreement (Operating of the Administrative Instruments)
⑤ Administrative Agency Agreement (Accounting Business)
⑥ Unitholder Register Administrative Agency Agreement / Special Account Administrative Agency Agreement
⑦ Fiscal Agency Agreement
⑧ Trademark License Agreement
Note 1: Kenedix Property Management, Inc. is not the property management company for some of the properties.
Note 2: The specified related company of the Investment Corporation (referring to the specified related company stipulated in Article 12, paragraph 3 of the Cabinet
Office Ordinance on Disclosure of Information, etc. on Specified Securities (Ordinance of the Ministry of Finance No. 22 of the year 1993, including
amendments thereafter)) is Kenedix, Inc. Kenedix, Inc. is the parent company (referring to the parent company stipulated in Article 8, paragraph 3 of
Ordinance on Terminology, Forms, and Preparation Methods of Financial Statements, etc. (Ordinance of the Ministry of Finance No.59 of the year 1963,
including amendments thereafter)) of the Asset Management Company.
Note 3: Ernst & Young ShinNihon LLC changed its Japanese name on July 1, 2018, but its English name remains the same. The same applies below.
Note 4: Kenedix Investment Partners, Inc. (“KIP”) was added to the party of the Support-Line Memorandum of Understanding on November 1, 2018. The same
applies below.
The roles, etc., of KPI are as follows.
Role Name Overview of responsibilities
Support-Line Company
Kenedix Investment Partners, Inc.
The Investment Corporation and the Asset Management Company have concluded the Support-Line Memorandum of Understanding (including amendments thereto and addition of parties; the “Support-Line Memorandum”) dated October 1, 2013 with Kenedix, Inc. and KIP.
KENEDIX OFFICE INVESTMENT CORPORATION (8972)
- 3 -
2. Management Policy and Operating Conditions
(1) Management Policy
There were no major changes to the “Investment Policy,” “Investment Strategy” and “Distribution Policy” from the most recent
Securities Report (submitted on July 30, 2018), and accordingly this information has been omitted from this document.
(2) Operating Conditions
① Operating Conditions for the fiscal period under review
A. The Investment Corporation
Kenedix Office Investment Corporation (“the Investment Corporation”) was established on May 6, 2005 in accordance with the Act
on Investment Trusts and Investment Corporations (Act No. 198 of the year 1951, including amendments thereafter) (“Investment
Trust Act”). On July 21, 2005, the Investment Corporation was listed on the Real Estate Investment Trust Market of the Tokyo Stock
Exchange, Inc. (“the Tokyo Stock Exchange”) with a total of 75,400 investment units issued and outstanding (Securities Code: 8972).
Subsequently, the Investment Corporation raised funds through public offerings and including seven global offerings. As a result, as
of the end of the fiscal period under review, the number of investment units issued and outstanding totaled 428,510 units.
The Investment Corporation entrusts Kenedix Real Estate Fund Management, Inc. (“the Asset Management Company”) with its
asset management and strives to maximize unitholder profits by securing stable earnings and sustainable growth of investment assets.
To this end, the Investment Corporation adopts the basic policy of conducting flexible and dynamic investment that seeks to respond
to the environment and market trends, and endeavors to ensure a timely response to opportunities.
B. Investment Environment and Management Performance
(a) Investment Environment
During the fiscal period under review (fiscal period ended October 31, 2018), the Japanese economy was impacted by shutdowns of
retail stores and factories as well as disrupted logistics network due to natural disasters which occurred in succession, including the
earthquake in Hokkaido, torrential rain and typhoon, as well as other factors. As a result, the real GDP growth rate for July to
September 2018 (The First Preliminary Estimates) showed an annual decrease of 1.2%.
Although it is necessary to pay close attention to the impact of downward pressure on business sentiment due to external shocks such
as the intensification of trade disputes and increase in consumption tax rate, the impacts from natural disasters are expected to be
temporary and will thus become smaller. In addition, personal consumption has remained steady while the employment environment
continues to be favorable, and capital investment is also expected to remain steady centered on investment for enhancing IT-related
capacities as well as various initiatives for investment to save labor. Therefore, the Japanese economy is expected to remain steady
although the pace of economic recovery will become gradual.
In terms of the office leasing market, demand for relocations for expanded floor area and better location choice continued to be
strong in the five central wards of Tokyo, leading to a continuous decline in the average vacancy rate and rise in the rent level. The
average vacancy rate in Tokyo’s five central wards at the end of October 2018 announced by Miki Shoji Co., Ltd. was 2.20%: down
0.82 points year-on-year and down 0.45 points compared with the end of the previous fiscal period (ended April 30, 2018). In
addition, the average rent in Tokyo’s five central wards (including newly-built office buildings) has also been increasing for 58
consecutive months since January 2014, reaching 20,597 yen per tsubo for the first time since May 2009. Other major cities across
Japan also continued to show a decrease in average vacancy rate and an increase in rent levels.
In the office building transaction market, domestic investors such as listed J-REITs, private REITs and real estate companies, as well
as overseas investors continued to show a strong appetite for property acquisitions. Due partially to the ongoing severe competitive
acquisition environment for prime properties, cap rates remain at continuously low levels and transaction prices remain high.
(b) Management Performance
As of the end of the previous fiscal period (fiscal period ended April 30, 2018), the Investment Corporation owned 97 properties
(with a total acquisition price of 407,235 million yen) and equity interest in a Japanese silent partnership (tokumei kumiai) (“TK”)
(investment amount of 1,107 million yen). During the fiscal period under review (fiscal period ended October 31, 2018), the
Investment Corporation acquired one office building (CROSS PLACE Hamamatsucho: acquisition price of 20,700 million yen) and
sold one office building (KDX Hamamatsucho Dai-2 Building: acquisition price of 2,200 million yen) and one central urban retail
property (Frame Jinnan-zaka (49.0% of quasi co-ownership interest): acquisition price of 4,851 million yen (Note)) (total sale price
of 7,297 million yen).
(Note) The acquisition price is an amount equivalent to 49.0% of quasi co-ownership interest in 9,900 million yen, which is the
acquisition price of the entire building initially acquired.
KENEDIX OFFICE INVESTMENT CORPORATION (8972)
- 4 -
As a result, the number of properties owned as of October 31, 2018 (excluding the TK interest, same applies below.) amounts to 97
(with a total acquisition price of 420,884 million yen). Looking at the portfolio distribution by property types, 98.1% was comprised
of office buildings, 1.2% of central urban retail properties and 0.7% of others property on an acquisition price basis.
The occupancy rate as of the end of the fiscal period under review (ended October 31, 2018) was 99.1% and continuously
maintained a high occupancy rate.
Operation and Management of Existing Properties
The Investment Corporation entrusts property management services for its entire portfolio as of the end of the fiscal period under
review (fiscal period ended October 31, 2018) (excluding ARK Mori Building and Shinjuku 6chome Building (Land)) to Kenedix
Property Management, Inc. By doing so, the Investment Corporation has strived to unify policies, specifications, procedures, points
of contact, etc. for the provision of swift and quality services in the operation and management of properties.
In terms of leasing, in light of the trends of the economy and real estate market, the Investment Corporation proactively attracted new
tenants with its close relationships with brokers and absorbed demands to expand floor space by utilizing the close relationships with
existing tenants. Moreover, in order to maintain and raise the competitiveness of office buildings, repair of common areas, upgrading
of air conditioning systems, renewal of elevators, etc. were implemented according to plan.
Consequently, as of the end of the fiscal period under review (fiscal period ended October 31, 2018), the occupancy rate of office
buildings in the Tokyo Metropolitan Area owned by the Investment Corporation stood at 99.2%, while that for all owned office
buildings as a whole stood at 99.1%, maintaining high occupancy rates as at the end of the previous fiscal period (April 30, 2018).
Stable Management through Large Number of Tenants and Tenant Diversification by Sector
The number of end-tenants for the Investment Corporation’s office buildings was 1,123 (Note 1) (Note 2) as of the end of the fiscal
period under review (fiscal period ended October 31, 2018), diversifying tenant’s stratum further. Furthermore, floor area leased to
the top 10 office end-tenants as a proportion of total leased floor area of the entire portfolio was 10.3%. In addition, tenants of office
buildings are in various sectors. As a result, we believe the impact by a certain end-tenant vacating the property or sluggish
performance in certain sectors would have a relatively limited effect and will be able to maintain stable revenue.
Note 1: When a tenant is leasing more than one property, it is counted as one tenant and the number of tenants is indicated accordingly.
Note 2: The number of end-tenants for the entire portfolio is 1,136 as of the end of the fiscal period (fiscal period ended October 31, 2018).
C. Capital Financing
(a) Issuance of New Investment Units
The Investment Corporation procured funds of 14,067 million yen on May 28, 2018 with additional issuance of investment units
(22,500 units) through public offering, and 703 million yen on June 15, 2018 with additional issuance of investment units (1,125 units)
through third-party allotment.
(b) Status of Borrowings/Investment Corporation Bonds
The Investment Corporation will continue to strive to reduce refinancing risk by diversifying maturity dates for its interest-bearing debt.
During the fiscal period under review (fiscal period ended October 31, 2018), the Investment Corporation undertook new borrowings
of 10,500 million yen and used 1,000 million yen of cash on hand for the repayment of 11,500 million yen that matured during the
fiscal period. In addition, the Investment Corporation redeemed the Fifth Series Unsecured Investment Corporation Bonds (totaling
1,800 million yen and maturing in five years) having reached maturity on September 12, 2018, with cash on hand. The balance of
interest-bearing debt as of October 31, 2018 is 183,050 million yen, comprised of 177,050 million yen in borrowings (6,000 million
yen in short-term borrowings (Note 1) and 171,050 million yen in long-term borrowings (Note 1)) and 6,000 million yen in investment
corporation bonds.
Furthermore, as of the end of fiscal period under review (fiscal period ended October 31, 2018), interest rates for 117,800 million yen
of long-term borrowings with floating interest rates, have been practically fixed by utilizing interest-rate swap agreements, etc. in order
to hedge risk of rise in the interest rate. In addition, the long-term debt ratio (Note 2) was 96.7% and the long-term fixed interest debt
ratio (Note 3) was 96.7%.
As a result of these, the average remaining term of the Investment Corporation’s interest-bearing debt (Note 4) was 5.2 years, the
average interest rate (Note 4) was 1.06% and the interest-bearing debt ratio (Note 5) was 41.9% at the end of fiscal period under review
(fiscal period ended October 31, 2018).
KENEDIX OFFICE INVESTMENT CORPORATION (8972)
- 5 -
Note 1: Short-term borrowings refer to borrowings with a period of less than or equal to one year from the drawdown date to the repayment date.
However, the borrowings whose period until repayment date have surpassed one year because the repayment date one year from the
drawdown date is not a business day and for which the repayment date has been moved to the following business day are included in
short-term borrowings. Long-term borrowings refer to borrowings with a period of more than one year from the drawdown date to the
repayment date. The same classification criteria apply to other borrowings listed below.
Note 2: Long-term debt ratio= (Balance of long-term borrowings + Balance of investment corporation bonds) / (Total borrowings + Balance of
investment corporation bonds) ×100
Long-term debt ratio is rounded to the nearest first decimal place.
Note 3: Long-term fixed interest debt ratio = (Balance of long-term fixed interest rate borrowings + Balance of investment corporation bonds) /
(Total borrowings + Balance of investment corporation bonds) ×100
The balance of long-term fixed interest rate borrowings includes long-term borrowings with floating interest rates effectively fixed by
utilizing interest-rate swap agreements. Long-term fixed interest debt ratio is rounded to the nearest first decimal place.
Note 4: Average remaining terms and average interest rates are the weighted average of the period-end remaining terms and interest rates including
upfront fees based on the balance of interest-bearing debt. Average remaining terms are rounded to the nearest first decimal place and
average interest rates are rounded to the nearest second decimal place respectively.
Note 5: Interest-bearing debt ratio = Balance of Interest-bearing debt at the end of fiscal period / Total assets at the end of fiscal period ×100
Interest-bearing debt ratio is rounded to the nearest first decimal place.
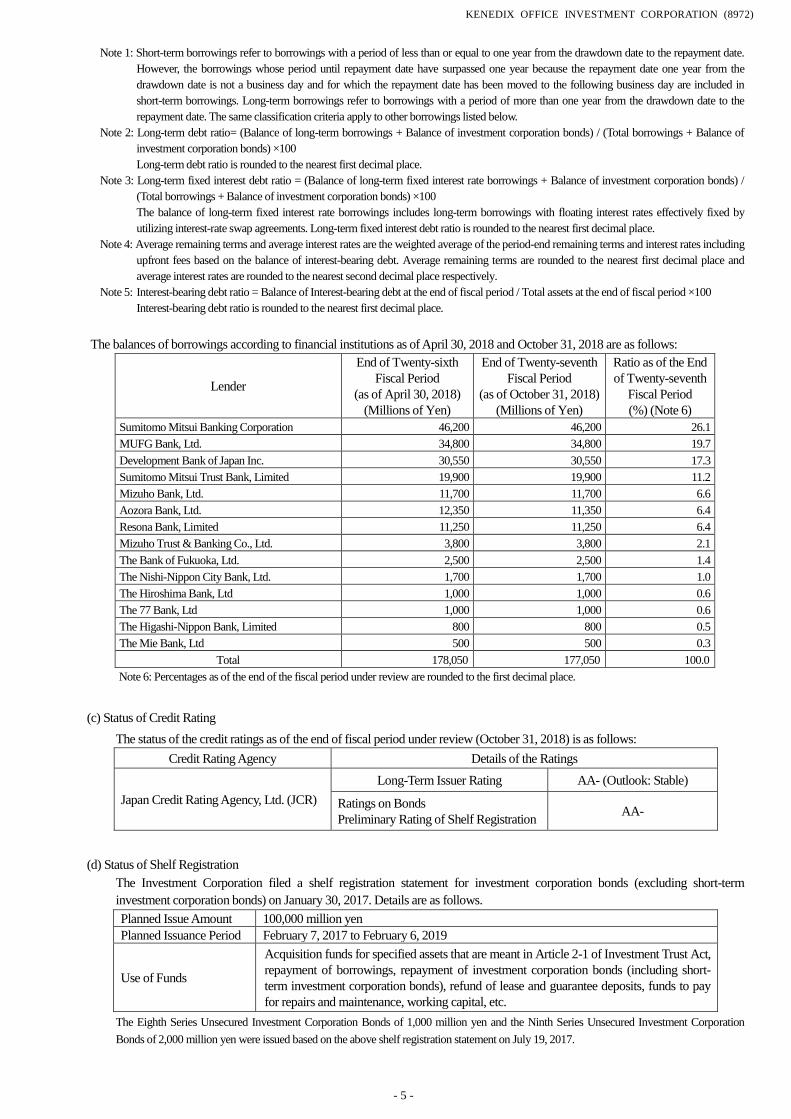
The balances of borrowings according to financial institutions as of April 30, 2018 and October 31, 2018 are as follows:
Lender
End of Twenty-sixth
Fiscal Period
(as of April 30, 2018)
(Millions of Yen)
End of Twenty-seventh
Fiscal Period
(as of October 31, 2018)
(Millions of Yen)
Ratio as of the End
of Twenty-seventh
Fiscal Period
(%) (Note 6)
Sumitomo Mitsui Banking Corporation 46,200 46,200 26.1
MUFG Bank, Ltd. 34,800 34,800 19.7
Development Bank of Japan Inc. 30,550 30,550 17.3
Sumitomo Mitsui Trust Bank, Limited 19,900 19,900 11.2
Mizuho Bank, Ltd. 11,700 11,700 6.6
Aozora Bank, Ltd. 12,350 11,350 6.4
Resona Bank, Limited 11,250 11,250 6.4
Mizuho Trust & Banking Co., Ltd. 3,800 3,800 2.1
The Bank of Fukuoka, Ltd. 2,500 2,500 1.4
The Nishi-Nippon City Bank, Ltd. 1,700 1,700 1.0
The Hiroshima Bank, Ltd 1,000 1,000 0.6
The 77 Bank, Ltd 1,000 1,000 0.6
The Higashi-Nippon Bank, Limited 800 800 0.5
The Mie Bank, Ltd 500 500 0.3
Total 178,050 177,050 100.0
Note 6: Percentages as of the end of the fiscal period under review are rounded to the first decimal place.
(c) Status of Credit Rating
The status of the credit ratings as of the end of fiscal period under review (October 31, 2018) is as follows:
Credit Rating Agency Details of the Ratings
Japan Credit Rating Agency, Ltd. (JCR)
Long-Term Issuer Rating AA- (Outlook: Stable)
Ratings on Bonds
Preliminary Rating of Shelf Registration AA-
(d) Status of Shelf Registration
The Investment Corporation filed a shelf registration statement for investment corporation bonds (excluding short-term
investment corporation bonds) on January 30, 2017. Details are as follows.
Planned Issue Amount 100,000 million yen
Planned Issuance Period February 7, 2017 to February 6, 2019
Use of Funds
Acquisition funds for specified assets that are meant in Article 2-1 of Investment Trust Act,
repayment of borrowings, repayment of investment corporation bonds (including short-
term investment corporation bonds), refund of lease and guarantee deposits, funds to pay
for repairs and maintenance, working capital, etc.
The Eighth Series Unsecured Investment Corporation Bonds of 1,000 million yen and the Ninth Series Unsecured Investment Corporation
Bonds of 2,000 million yen were issued based on the above shelf registration statement on July 19, 2017.
KENEDIX OFFICE INVESTMENT CORPORATION (8972)
- 6 -
D. Operating Results and Cash Distribution
As a result of the aforementioned management performance, the Investment Corporation reported operating revenues of 15,420
million yen, operating income of 7,148 million yen, ordinary income of 6,109 million yen and net income of 6,107 million yen for
the fiscal period under review (fiscal period ended October 31, 2018).
Concerning the cash distributions for the fiscal period under review, special taxation measures for investment corporations (Article
67-15 of the Act on Special Measures Concerning Taxation (Act No. 26 of the year 1957, including amendments thereafter; “the
Special Taxation Measures Act”)) are applied based on the cash distribution policies stipulated in the Articles of Incorporation. In
addition, the Investment Corporation has decided to use a portion of its unappropriated retained earnings booked as a reserve for
reduction entry under internal reserve based on application of the “Special Provisions for Taxation in the Event of Advance
Acquisition of Land, etc. in 2009 and 2010” (Article 66-2 of the Special Taxation Measures Act). Based on this policy, the entire
amount after deducting 340 million yen that applies within both Article 67-15 and Article 66-2 of the Special Taxation Measures
Act as a provision of reserve for reduction entry from unappropriated retained earnings was distributed. Therefore, the distributions
per unit resulted in 13,458 yen.
② Outlook for next fiscal period
A. Investment Environment
Although future Japanese economy is expected to see a slowdown in growth, the growth of the global market and the bullish trend
of domestic demand suggest moderate recovery. On the other hand, careful attention should be paid to uncertainties concerning
overseas economies and politics including the rise of policy interest rate in U.S. and trends in the U.S. administration’s policy
management and such. Even in Japan, it will be necessary to pay close attention to various events such as the impact of the interest
rate hike in the U.S. on domestic interest rates, the trend of the “quantitative and qualitative monetary easing involving control over
long-and short-term interest rates” policy that accompanies negative interest rates, and concerns over geopolitical risks.
Concerning the office leasing market, the average vacancy rate in Tokyo’s five central wards at the end of October 31, 2018
announced by Miki Shoji Co., Ltd. was 2.20%, and therefore the vacancy rate shows a downward trend and the demand remains
steady. Along with the decline in the vacancy rate, the average rent in Tokyo’s five central wards has been on a rising trend.
In the office building transaction market, although some point out the overheated state, the generally intense acquisition market is
forecasted to continue with investors such as listed J-REITs, private REITs, domestic real estate companies and foreign investors
bearing a strong appetite for acquisition, backed by the favorable financing environment owing to continuation of the Bank of
Japan’s monetary easing measures.
On the other hand, the outstanding bank loans for the real estate industry have reached a record high, and careful attention will need
to be paid to changes in bank policies on loans along with future interest rate trends. Although the J-REIT market experienced a
trend where the market price struggled to rise due to deterioration in the supply and demand balance brought by frequent public
offerings since the start of 2018, the inflow of funds from overseas investors who recognize strong real estate market conditions and
stable interest rate levels has been confirmed. However, attention should still be paid to changes in supply and demand trends due to
the increase in public offerings against the backdrop of a strong market environment.
B. Future Management Policies and Pending Issues
The Investment Corporation adopts the basic policy of conducting flexible and dynamic investment stance that seeks to respond to
its environment and market trends, and endeavors to ensure a timely response to opportunities. Based on this policy, the Investment
Corporation creates a property investment strategy, management strategy for existing properties, and financial strategy as set forth
below and implements them in a flexible and dynamic manner.
(a) Investment Strategy for Property Acquisitions and Sales Policy
The Investment Corporation aims for further expansion of its asset size, with the goal of “forming a firm portfolio focusing on mid-
sized office buildings” and to become the “No. 1 J-REIT for mid-sized office buildings.” The Investment Corporation will keep mid-
sized office buildings in the Tokyo Metropolitan Area as its focus, and with regard to central urban retail properties, invest only in
those that have rare value as an alternative to office buildings, are located in busy commercial areas and offer a certain amount of
office space. In addition, the Investment Corporation believes that maintaining an investment strategy which aims for a certain
degree of regional diversification will be a foundation for constructing a superior portfolio and differentiating the Investment
Corporation from others in the business.
KENEDIX OFFICE INVESTMENT CORPORATION (8972)
- 7 -
Moreover, when acquiring assets, the Investment Corporation will aim for the sound and stable growth of the portfolio by securing
continuous opportunities for acquiring properties and flexible acquisition methods in utilizing the networks of the Asset Management
Company and the support line of the Kenedix Group (Note) centering on Kenedix, Inc., a parent company of the Asset Management
Company, through building multiple pipelines. Furthermore, based on the premise that the Investment Corporation can obtain
opportunities for property acquisitions in the future, the Investment Corporation may invest in TK interest, etc., with the Kenedix
Group and others on a conjoint basis. In addition, the Investment Corporation seeks to diversify acquisition methods (direct
acquisition, equity investment and co-acquisition with the Kenedix Group, mutual transaction with a view of asset reshuffle, etc.) to
secure tactful acquisition of properties such as investments in warehousing related TK, etc., in cooperation with the Kenedix Group
with consideration to the timing of funding or the consistency of the investment principles.
In selling properties, the Investment Corporation will examine the sale of properties individually in considering the use of funds for
asset reshuffles through new property acquisition or fund-type investments. Moreover, The Investment Corporation will decide on
the sale individually by considering the revenue and profitability that take into account current and future market trends, building age,
area and property size, among other factors, and also in light of the significance of the property’s presence in the portfolio.
(Note) Kenedix Group refers to the company group consisting of Kenedix, Inc. and its subsidiaries, related companies, etc. The
same applies below.
(b) Management Strategy for Existing Properties
Taking into consideration economic and real estate market trends, the Investment Corporation adopts “a tenant-oriented approach
which will lead to revenue” for its leasing activities with aims of ensuring a timely and flexible response as well as optimizing tenant
satisfaction. Accordingly, the Investment Corporation seeks to aim to maintain / increase cash flow by offering office environments
with high tenant satisfaction. Based on the aim to become “the mid-sized office building of the choice,” the Asset Management
Company undertakes asset management activities as follows:
・Take measures to maintain and raise competitiveness of properties
・Tailor leasing management according to the market environment
・Apply careful control of management and operating costs by taking advantage of portfolio size
・Ensure appropriate response to relevant laws and regulations
・Develop a proactive response to environmental issues
Take measures to maintain and raise competitiveness of properties
The Investment Corporation will implement operation and management in close contact with the actual properties and further
enhance the management level. Some specific examples of the operation and management are the installation of boxes of emergency
kit, automated external defibrillators (AEDs) and service delivery of public wireless LAN in consideration of business continuity
plans (BCP) and its corporate social responsibilities (CSR).
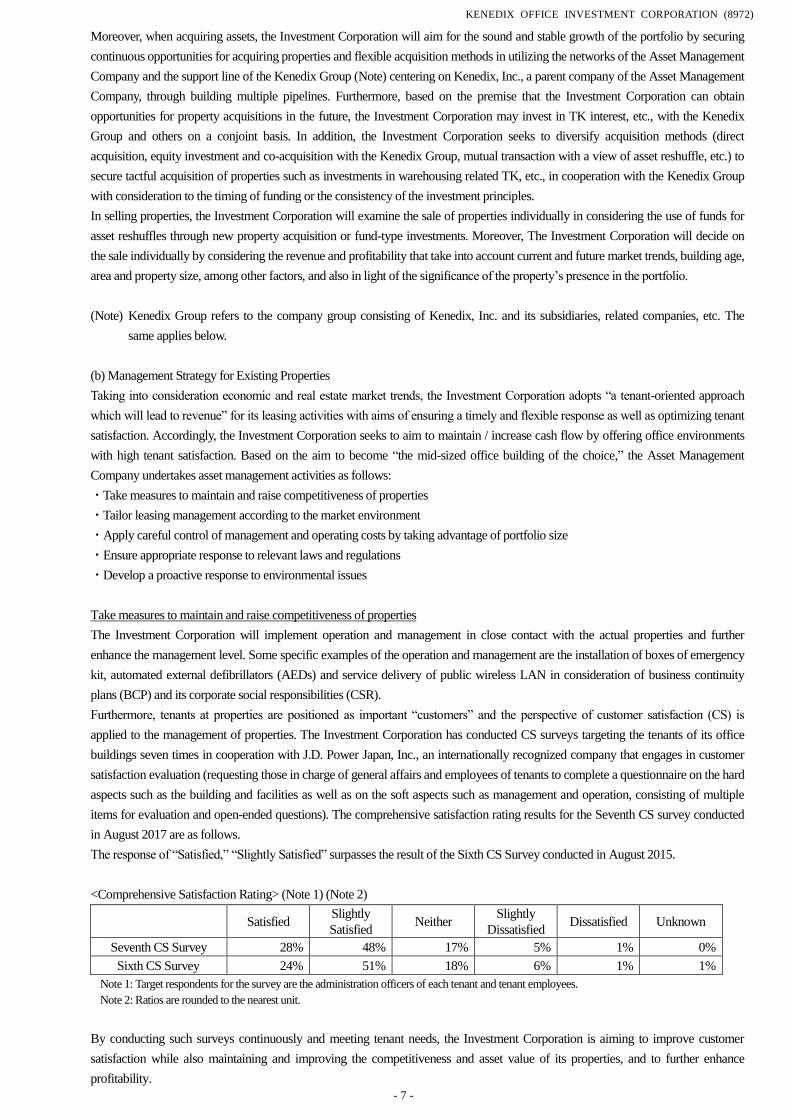
Furthermore, tenants at properties are positioned as important “customers” and the perspective of customer satisfaction (CS) is
applied to the management of properties. The Investment Corporation has conducted CS surveys targeting the tenants of its office
buildings seven times in cooperation with J.D. Power Japan, Inc., an internationally recognized company that engages in customer
satisfaction evaluation (requesting those in charge of general affairs and employees of tenants to complete a questionnaire on the hard
aspects such as the building and facilities as well as on the soft aspects such as management and operation, consisting of multiple
items for evaluation and open-ended questions). The comprehensive satisfaction rating results for the Seventh CS survey conducted
in August 2017 are as follows.
The response of “Satisfied,” “Slightly Satisfied” surpasses the result of the Sixth CS Survey conducted in August 2015.
<Comprehensive Satisfaction Rating> (Note 1) (Note 2)
Satisfied Slightly
Satisfied Neither
Slightly
Dissatisfied Dissatisfied Unknown
Seventh CS Survey 28% 48% 17% 5% 1% 0%
Sixth CS Survey 24% 51% 18% 6% 1% 1%
Note 1: Target respondents for the survey are the administration officers of each tenant and tenant employees.
Note 2: Ratios are rounded to the nearest unit.
By conducting such surveys continuously and meeting tenant needs, the Investment Corporation is aiming to improve customer
satisfaction while also maintaining and improving the competitiveness and asset value of its properties, and to further enhance
profitability.
KENEDIX OFFICE INVESTMENT CORPORATION (8972)
- 8 -
Tailor leasing management according to the market environment
The characteristics of mid-sized office buildings, which are the primary investment target of the Investment Corporation, are that
tenant turnover ratios are relatively high. Therefore, in the leasing aspect, the Investment Corporation implements leasing activities in
a timely and flexible manner by adopting the basic policy of endeavoring to maximize revenues for the medium- to long-term
through maintaining occupancy rate, while taking into account economic and real estate market trends.
Concerning the solicitation of new tenants, the Investment Corporation strives to shorten the period of vacancy and boost the
occupancy rate by implementing flexible and dynamic leasing activities through sharing information closely with leasing brokers,
holding of previews, marketing directly to corporations, utilizing guarantee companies and other measures while closely watching
market conditions and timing of changes going forward.
Apply careful control of management and operating costs by taking advantage of portfolio size
The Investment Corporation will carefully control the quality of property management and reduce building maintenance and
operating costs by taking advantage of the portfolio size through cost reductions of building maintenance, reviews of building
maintenance companies, construction bidding and procurement of facilities and equipment, etc., via bulk orders.
Ensure appropriate responses to relevant laws and regulations
The Investment Corporation will gather information on the Building Standards Act (Act No. 201 of the year 1950, including
amendments thereafter) and other relevant laws and regulations and any future revisions, in a timely manner and will respond as
necessary while considering legal regulations.
Develop a proactive response to environmental issues
The Investment Corporation has established the environmental policies, and promotes environment-friendly investment management
operations through proactively participating in GRESB Real Estate Assessment and using certification and assessment systems by
external institutions such as DBJ Green Building Certification.
In addition, the Investment Corporation is designated as a specified corporation pursuant to the Act on Rationalizing Energy Use.
The Investment Corporation will research on energy saving and environmental friendliness of mid-sized office buildings, develop
medium- to long-term energy saving plans and reduction targets, and proactively institute measures in terms of both hardware
(buildings and facilities) and soft services (operating and management services) in an aim to ensure the simultaneous pursuit of return
on investment and social benefits.
(c) Financial Strategy (Debt Financing)
The Investment Corporation continuously strives to improve the terms and conditions of existing borrowings, and aims for stable
financial management by taking the following measures, etc.
・Reduce refinance risks by diversifying maturities of interest-bearing debts
・Have the procurement ratio of long-term fixed interest borrowings above a certain level
・Control the interest-bearing debt ratio (Note) in a conservative manner (the Investment Corporation will aim to keep the interest-
bearing debt ratio to total assets (LTV) at less than 45% level as a rule. However, it will also remain open to the option of
increasing LTV to the upper 40% level in the event of debt financing conducted for the purpose of acquiring competitive
properties or otherwise.)
Moreover, the Investment Corporation will undertake stable fund procurement based on existing favorable relations with financial
institutions, especially major banks, aiming for more robust financial management. In addition, the Investment Corporation aspires to
pay attention to the share of each bank and consider as appropriate the introduction of transactions with new banks based on
comparison with the conditions with currently transacting banks.
Note: Interest-bearing debt ratio = Balance of interest-bearing debt at the end of fiscal period / Total assets at the end of fiscal period×100
(d) Information Disclosure
Consistent with its basic information disclosure policy, the Investment Corporation proactively engages in IR activities with the aim
of promptly providing a wide range of relevant information to investors, and make revisions to the information disclosure system
when needed. In specific terms, the Investment Corporation provides information through the Timely Disclosure Network System
(TDnet), which is a system operated by the Tokyo Stock Exchange, as well as press releases and its website (URL: https://www.kdo-
reit.com/en/).
KENEDIX OFFICE INVESTMENT CORPORATION (8972)
- 9 -
(e) Measures for Conflict of Interest Transactions
Since the Asset Management Company has been entrusted with asset management of several other investment corporations besides
the Investment Corporation, there is a possibility that those investment corporations will compete for opportunities for acquiring
investment assets. The Asset Management Company has, in order to set an office which prioritizes discussing acquired information
on sales of real estate, etc., established rules on priority rights of consideration based on the type, size, and such of properties, to
determine the order of discussion priority in advance at the Asset Management Company. Furthermore, it has established a Pipeline
Meeting with the Compliance Officer as a member in order to provide asset management services in accordance to said rules, for the
purpose of preventing arbitrary allocation of the information about the sale of real estate, etc., and preventing conflicts of interest
arising between the investment corporations which consign the management business to the Asset Management Company. As
mentioned above, the Asset Management Company is taking appropriate measures for conflict of interest transactions.
(f) Important Subsequent Events after the Closing Date
Not applicable
(Reference Information)
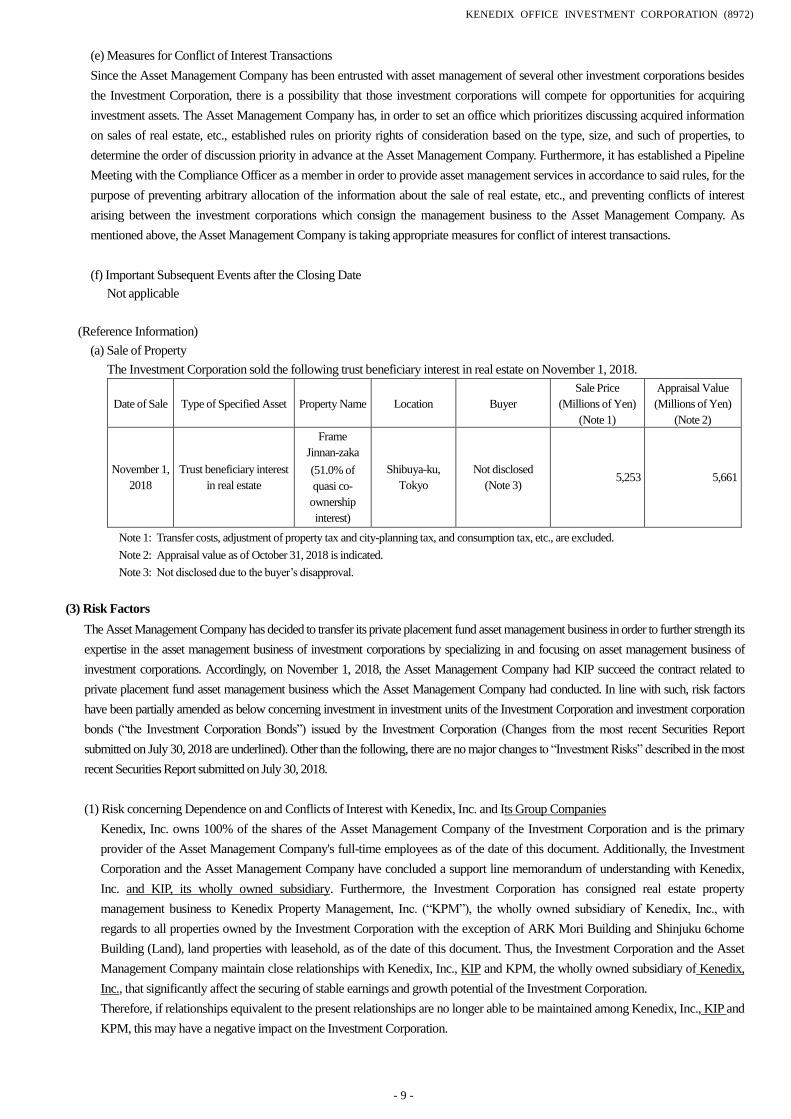
(a) Sale of Property
The Investment Corporation sold the following trust beneficiary interest in real estate on November 1, 2018.
Date of Sale Type of Specified Asset Property Name Location Buyer
Sale Price
(Millions of Yen)
(Note 1)
Appraisal Value
(Millions of Yen)
(Note 2)
November 1,
2018
Trust beneficiary interest
in real estate
Frame
Jinnan-zaka
(51.0% of
quasi co-
ownership
interest)
Shibuya-ku,
Tokyo
Not disclosed
(Note 3) 5,253 5,661
Note 1: Transfer costs, adjustment of property tax and city-planning tax, and consumption tax, etc., are excluded.
Note 2: Appraisal value as of October 31, 2018 is indicated.
Note 3: Not disclosed due to the buyer’s disapproval.
(3) Risk Factors
The Asset Management Company has decided to transfer its private placement fund asset management business in order to further strength its
expertise in the asset management business of investment corporations by specializing in and focusing on asset management business of
investment corporations. Accordingly, on November 1, 2018, the Asset Management Company had KIP succeed the contract related to
private placement fund asset management business which the Asset Management Company had conducted. In line with such, risk factors
have been partially amended as below concerning investment in investment units of the Investment Corporation and investment corporation
bonds (“the Investment Corporation Bonds”) issued by the Investment Corporation (Changes from the most recent Securities Report
submitted on July 30, 2018 are underlined). Other than the following, there are no major changes to “Investment Risks” described in the most
recent Securities Report submitted on July 30, 2018.
(1) Risk concerning Dependence on and Conflicts of Interest with Kenedix, Inc. and Its Group Companies
Kenedix, Inc. owns 100% of the shares of the Asset Management Company of the Investment Corporation and is the primary
provider of the Asset Management Company's full-time employees as of the date of this document. Additionally, the Investment
Corporation and the Asset Management Company have concluded a support line memorandum of understanding with Kenedix,
Inc. and KIP, its wholly owned subsidiary. Furthermore, the Investment Corporation has consigned real estate property
management business to Kenedix Property Management, Inc. (“KPM”), the wholly owned subsidiary of Kenedix, Inc., with
regards to all properties owned by the Investment Corporation with the exception of ARK Mori Building and Shinjuku 6chome
Building (Land), land properties with leasehold, as of the date of this document. Thus, the Investment Corporation and the Asset
Management Company maintain close relationships with Kenedix, Inc., KIP and KPM, the wholly owned subsidiary of Kenedix,
Inc., that significantly affect the securing of stable earnings and growth potential of the Investment Corporation.
Therefore, if relationships equivalent to the present relationships are no longer able to be maintained among Kenedix, Inc., KIP and
KPM, this may have a negative impact on the Investment Corporation.
KENEDIX OFFICE INVESTMENT CORPORATION (8972)
- 10 -
Furthermore, in the event that the Investment Corporation or the Asset Management Company conducts a transaction with
Kenedix, Inc. or one of the funds that KIP manages or provides advice for through asset management activities or the like, acts
which conflict with the profit of the Investment Corporation's unitholders or creditors may occur in order to secure profit for
Kenedix, Inc. or a fund that KIP manages or provides advice for. In such a case, the interests of the Investment Corporation's
unitholders or creditors may be damaged.
(2) Risk concerning the Asset Management Company being Entrusted with Asset Management of Multiple Investment Corporations, etc.
An asset management company is not prohibited from being entrusted with asset management of multiple investment corporations, etc.
under the Financial Instruments and Exchange Act, and the Asset Management Company is being entrusted with the asset management of
Kenedix Residential Next Investment Corporation, Kenedix Retail REIT Corporation and Kenedix Private Investment Corporation in
addition to the Investment Corporation.
As the Investment Corporation targets investment in office buildings, central urban retail properties, etc., the investment targets are in
competition with the investment corporations.
Therefore, the Asset Management Company has established a Pipeline Meeting and adopted rules on "preferential rights to study property
information" along with prohibiting concurrently holding positions as a Head of Departments that manage the investment corporations as
of the date of this document. This was done to establish rules to decide which investment corporations shall preferentially consider an
acquisition when information on the sale of real estate, etc., is obtained by the Asset Management Company and has stipulated that it shall
conduct management in accordance with the concerned rules.
The Investment Corporation and the Asset Management Company expect that there will be only limited instances of competition actually
arising over requests for property acquisitions due to the difference in scale of main investment targets between the Investment
Corporation and the investment corporations as well as the differences in nature of fund procurement, financial strategies and investment
return sought by the investors. However, in cases when competition actually arises over requests for property acquisitions beyond such
expectations, the investment corporations may preferentially consider property acquisitions according to the abovementioned rules. In
addition, the possibility of considering property acquisitions that go against such rules cannot be denied. Furthermore, such rules are
subject to change and the Investment Corporation may not be able to secure the same property acquisition opportunities as of the date of
this document due to the concerned changes. In that case, there is a possibility that the building of a portfolio that is considered to be
desirable for the Investment Corporation may be difficult to be realized due to a decrease in its property acquisition opportunities and other
factors, and, as a result, this may adversely impact profitability or the asset status of the Investment Corporation.
(3) Risk concerning Quasi Co-ownership of Beneficiary Interests in Trust
In cases where the investment assets are real estate beneficiary interests in trusts that are owned under quasi co-ownership with third
parties, there may arise various problems regarding their preservation, use and disposal, etc. that are absent when they are owned
independently.
First, management of quasi co-owned interests shall be conducted by a majority of the quasi co-owners in accordance with the value of the
interests they own, except if otherwise agreed among such quasi co-owners (Article 252 and 264 of the Civil Code). Therefore, in cases
where the Investment Corporation does not own a majority of the quasi co-ownership interests, the Investment Corporation may not be
able to reflect its intentions in the directions by the trust beneficiaries with regard to the management and operations of the real estate. Such
other quasi co-owners may possibly be Kenedix, Inc. or investment corporations or other funds for which KIP or the Asset Management
Company conducts asset management or provides advice. Even so, if such investment corporations or other funds have different
intentions (including management policies) from the Investment Corporation regarding management and operation of the real estate,
Kenedix, Inc., KIP or the Asset Management Company may be influenced in effect by such intentions or bound by contractual or legal
obligations in terms of the relationship with such other investment corporations or funds. As a result, there is a possibility that the
Investment Corporation's intentions cannot be reflected in the directions by the trust beneficiaries with regard to the management and
operation of the relevant real estate.
Moreover, the general interpretation is that quasi co-ownership can be disposed of freely in the same manner as solely owned real estate
but there are cases where a quasi co-owner bears an obligation to provide other quasi co-owners with preferential rights to purchase its
quasi co-ownership interest when selling it to a third party. This is done by agreeing to a preferential purchase right for the quasi co-owned
portion to be disposed among the quasi co-owners.
Furthermore, the general interpretation is that the right to demand the trust's principal of the quasi co-owners of trust beneficiary interests in
real estate over the real estate trustees is an indivisible credit and that their obligation to pay trust expenses, etc. to the real estate trustees is
an indivisible obligation. Therefore, a quasi co-owner is subject to possible impact from the credit risk of other quasi co-owners.

KENEDIX OFFICE INVESTMENT CORPORATION (8972)
- 11 -
In addition, among the quasi co-owners, there are cases where protocols, etc. are concluded among them, agreement is reached among
them on the preferential purchase right of quasi co-ownership interests, agreement is reached that the right to demand for sale or purchase
will arise under certain conditions, or agreement is reached on the method to make decisions, etc. (content of such is varied) as
beneficiaries. In cases when these agreements are made, there is a possibility that disposal of the quasi co-ownership interests owned by
the Investment Corporation is restricted, that the Investment Corporation is forced to acquire or transfer quasi co-ownership interests at an
unexpected time, or that, regardless of the percentage of its interests, the Investment Corporation's intentions cannot be reflected in the
directions by the trust beneficiaries with regard to management and operation of the real estate.
Such restrictions and risks as stated above exist when real estate beneficiary interests in trust are quasi co-owned with third parties, in
contrast to cases where they are owned independently. Accordingly, there is a possibility that more time and expenses are required for
acquisition and sale of such interests or that factors causing a decrease in prices will increase.
As stated above, even when other quasi co-owners are Kenedix, Inc. or investment corporations or other funds for which KIP or the Asset
Management Company conducts asset management or provides advice, if the investment corporations or other funds have intentions that
are different from the Investment Corporation's, Kenedix, Inc., KIP or the Asset Management Company may be influenced in effect by
such intentions or bound by contractual or legal obligations in terms of the relationship with such other investment corporation or fund.
Therefore, such restrictions and risks as stated above that exist when the real estate beneficiary interests in trust are quasi co-owned with
third parties cannot necessarily be dissolved or mitigated.
(4) Outlook
Forecasts for the twenty-eighth fiscal period (November 1, 2018 to April 30, 2019) and for the twenty-ninth fiscal period (May 1,
2019 to October 31, 2019) are presented as follows.
Twenty-eighth fiscal period (November 1, 2018 to April 30, 2019)
Operating Revenues 15,246 million yen
Operating Income 7,147 million yen
Ordinary Income 6,137 million yen
Net Income 6,136 million yen
Distributions per Unit 13,620 yen
Excess of Earnings - yen
Twenty-ninth fiscal period (May 1, 2019 to October 31, 2019)
Operating Revenues 14,739 million yen
Operating Income 6,546 million yen
Ordinary Income 5,529 million yen
Net Income 5,527 million yen
Distributions per Unit 12,900 yen
Excess of Earnings - yen
For preconditions and assumptions of the outlook, please refer to the following “Preconditions and Assumptions for the Twenty-eighth
Fiscal Period Ending April 30, 2019 and for the Twenty-ninth Fiscal Period Ending October 31, 2019.”
Note: Forecast figures above are calculated based on certain assumptions. Readers are advised that actual operating revenues, net income and
distributions per unit may differ significantly from forecasts due to a variety of reasons. Accordingly, the Investment Corporation does not
guarantee payment of the forecasted distributions per unit.
KENEDIX OFFICE INVESTMENT CORPORATION (8972)
- 12 -
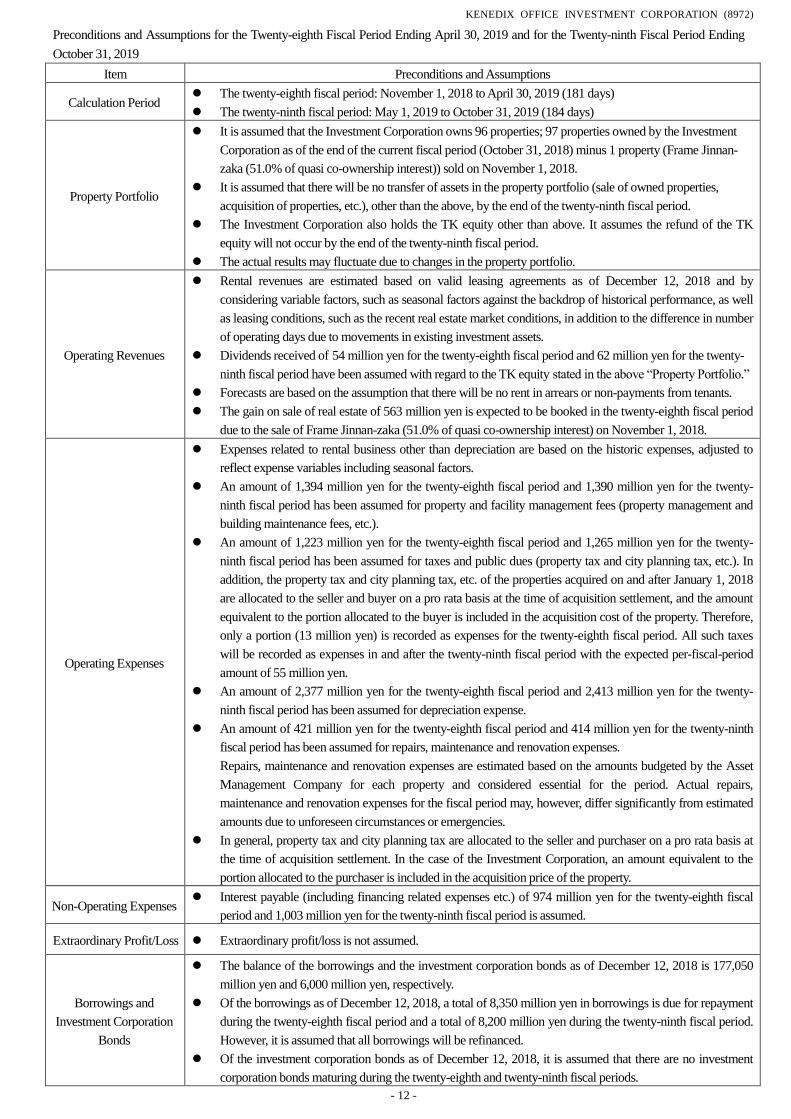
Preconditions and Assumptions for the Twenty-eighth Fiscal Period Ending April 30, 2019 and for the Twenty-ninth Fiscal Period Ending
October 31, 2019
Item Preconditions and Assumptions
Calculation Period ⚫ The twenty-eighth fiscal period: November 1, 2018 to April 30, 2019 (181 days)
⚫ The twenty-ninth fiscal period: May 1, 2019 to October 31, 2019 (184 days)
Property Portfolio
⚫ It is assumed that the Investment Corporation owns 96 properties; 97 properties owned by the Investment
Corporation as of the end of the current fiscal period (October 31, 2018) minus 1 property (Frame Jinnan-
zaka (51.0% of quasi co-ownership interest)) sold on November 1, 2018.
⚫ It is assumed that there will be no transfer of assets in the property portfolio (sale of owned properties,
acquisition of properties, etc.), other than the above, by the end of the twenty-ninth fiscal period.
⚫ The Investment Corporation also holds the TK equity other than above. It assumes the refund of the TK
equity will not occur by the end of the twenty-ninth fiscal period.
⚫ The actual results may fluctuate due to changes in the property portfolio.
Operating Revenues
⚫ Rental revenues are estimated based on valid leasing agreements as of December 12, 2018 and by
considering variable factors, such as seasonal factors against the backdrop of historical performance, as well
as leasing conditions, such as the recent real estate market conditions, in addition to the difference in number
of operating days due to movements in existing investment assets.
⚫ Dividends received of 54 million yen for the twenty-eighth fiscal period and 62 million yen for the twenty-
ninth fiscal period have been assumed with regard to the TK equity stated in the above “Property Portfolio.”
⚫ Forecasts are based on the assumption that there will be no rent in arrears or non-payments from tenants.
⚫ The gain on sale of real estate of 563 million yen is expected to be booked in the twenty-eighth fiscal period
due to the sale of Frame Jinnan-zaka (51.0% of quasi co-ownership interest) on November 1, 2018.
Operating Expenses
⚫ Expenses related to rental business other than depreciation are based on the historic expenses, adjusted to
reflect expense variables including seasonal factors.
⚫ An amount of 1,394 million yen for the twenty-eighth fiscal period and 1,390 million yen for the twenty-
ninth fiscal period has been assumed for property and facility management fees (property management and
building maintenance fees, etc.).
⚫ An amount of 1,223 million yen for the twenty-eighth fiscal period and 1,265 million yen for the twenty-
ninth fiscal period has been assumed for taxes and public dues (property tax and city planning tax, etc.). In
addition, the property tax and city planning tax, etc. of the properties acquired on and after January 1, 2018
are allocated to the seller and buyer on a pro rata basis at the time of acquisition settlement, and the amount
equivalent to the portion allocated to the buyer is included in the acquisition cost of the property. Therefore,
only a portion (13 million yen) is recorded as expenses for the twenty-eighth fiscal period. All such taxes
will be recorded as expenses in and after the twenty-ninth fiscal period with the expected per-fiscal-period
amount of 55 million yen.
⚫ An amount of 2,377 million yen for the twenty-eighth fiscal period and 2,413 million yen for the twenty-
ninth fiscal period has been assumed for depreciation expense.
⚫ An amount of 421 million yen for the twenty-eighth fiscal period and 414 million yen for the twenty-ninth
fiscal period has been assumed for repairs, maintenance and renovation expenses.
Repairs, maintenance and renovation expenses are estimated based on the amounts budgeted by the Asset
Management Company for each property and considered essential for the period. Actual repairs,
maintenance and renovation expenses for the fiscal period may, however, differ significantly from estimated
amounts due to unforeseen circumstances or emergencies.
⚫ In general, property tax and city planning tax are allocated to the seller and purchaser on a pro rata basis at
the time of acquisition settlement. In the case of the Investment Corporation, an amount equivalent to the
portion allocated to the purchaser is included in the acquisition price of the property.
Non-Operating Expenses ⚫ Interest payable (including financing related expenses etc.) of 974 million yen for the twenty-eighth fiscal
period and 1,003 million yen for the twenty-ninth fiscal period is assumed.
Extraordinary Profit/Loss ⚫ Extraordinary profit/loss is not assumed.
Borrowings and
Investment Corporation
Bonds
⚫ The balance of the borrowings and the investment corporation bonds as of December 12, 2018 is 177,050
million yen and 6,000 million yen, respectively.
⚫ Of the borrowings as of December 12, 2018, a total of 8,350 million yen in borrowings is due for repayment
during the twenty-eighth fiscal period and a total of 8,200 million yen during the twenty-ninth fiscal period.
However, it is assumed that all borrowings will be refinanced.
⚫ Of the investment corporation bonds as of December 12, 2018, it is assumed that there are no investment
corporation bonds maturing during the twenty-eighth and twenty-ninth fiscal periods.
KENEDIX OFFICE INVESTMENT CORPORATION (8972)
- 13 -
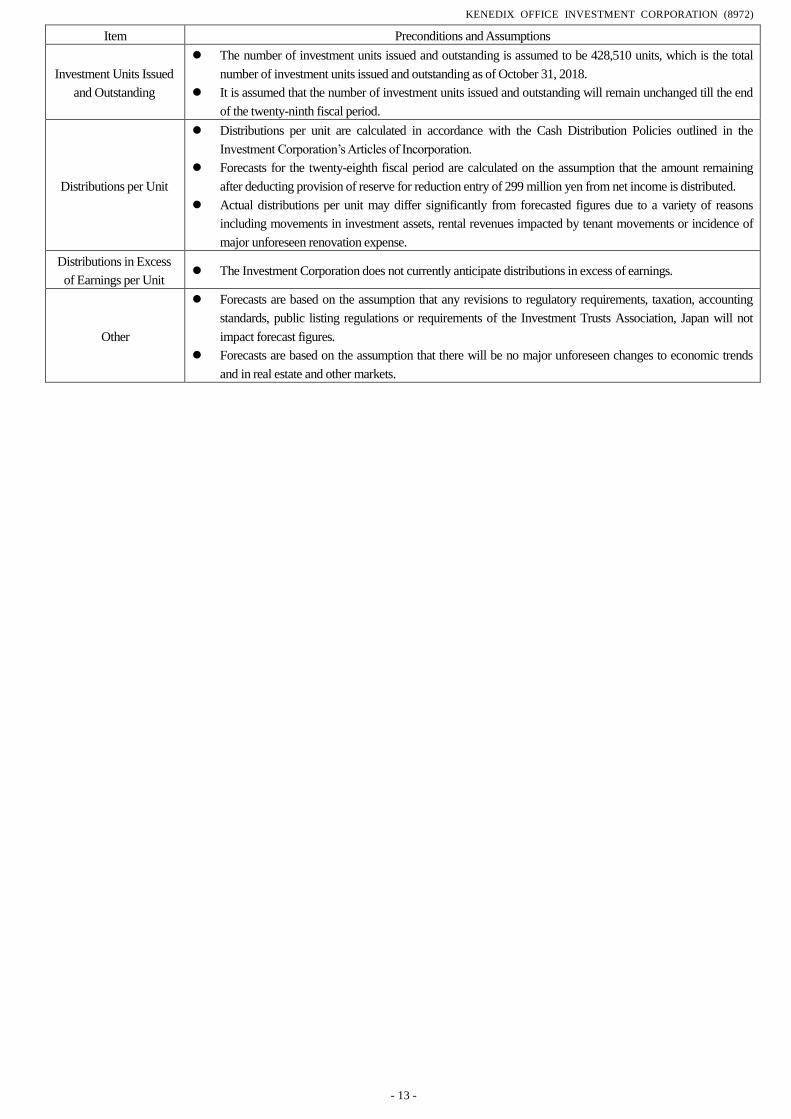
Item Preconditions and Assumptions
Investment Units Issued
and Outstanding
⚫ The number of investment units issued and outstanding is assumed to be 428,510 units, which is the total
number of investment units issued and outstanding as of October 31, 2018.
⚫ It is assumed that the number of investment units issued and outstanding will remain unchanged till the end
of the twenty-ninth fiscal period.
Distributions per Unit
⚫ Distributions per unit are calculated in accordance with the Cash Distribution Policies outlined in the
Investment Corporation’s Articles of Incorporation.
⚫ Forecasts for the twenty-eighth fiscal period are calculated on the assumption that the amount remaining
after deducting provision of reserve for reduction entry of 299 million yen from net income is distributed.
⚫ Actual distributions per unit may differ significantly from forecasted figures due to a variety of reasons
including movements in investment assets, rental revenues impacted by tenant movements or incidence of
major unforeseen renovation expense.
Distributions in Excess
of Earnings per Unit ⚫ The Investment Corporation does not currently anticipate distributions in excess of earnings.
Other
⚫ Forecasts are based on the assumption that any revisions to regulatory requirements, taxation, accounting
standards, public listing regulations or requirements of the Investment Trusts Association, Japan will not
impact forecast figures.
⚫ Forecasts are based on the assumption that there will be no major unforeseen changes to economic trends
and in real estate and other markets.
KENEDIX OFFICE INVESTMENT CORPORATION (8972)
- 14 -
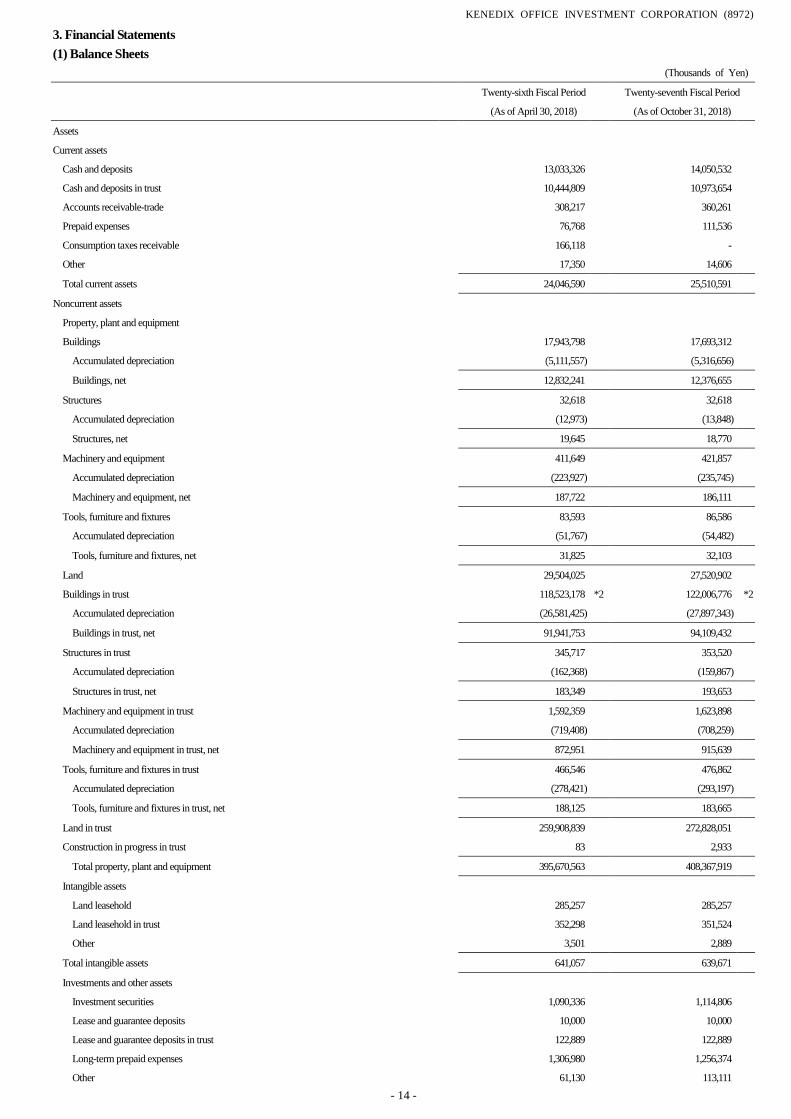
3. Financial Statements
(1) Balance Sheets (Thousands of Yen)
Twenty-sixth Fiscal Period Twenty-seventh Fiscal Period
(As of April 30, 2018) (As of October 31, 2018)
Assets
Current assets
Cash and deposits 13,033,326
14,050,532
Cash and deposits in trust 10,444,809
10,973,654
Accounts receivable-trade 308,217
360,261
Prepaid expenses 76,768
111,536
Consumption taxes receivable 166,118 -
Other 17,350
14,606
Total current assets 24,046,590 25,510,591
Noncurrent assets
Property, plant and equipment
Buildings 17,943,798
17,693,312
Accumulated depreciation (5,111,557)
(5,316,656)
Buildings, net 12,832,241 12,376,655
Structures 32,618
32,618
Accumulated depreciation (12,973)
(13,848)
Structures, net 19,645 18,770
Machinery and equipment 411,649
421,857
Accumulated depreciation (223,927)
(235,745)
Machinery and equipment, net 187,722 186,111
Tools, furniture and fixtures 83,593
86,586
Accumulated depreciation (51,767)
(54,482)
Tools, furniture and fixtures, net 31,825 32,103
Land 29,504,025
27,520,902
Buildings in trust 118,523,178 *2 122,006,776 *2
Accumulated depreciation (26,581,425)
(27,897,343)
Buildings in trust, net 91,941,753 94,109,432
Structures in trust 345,717
353,520
Accumulated depreciation (162,368)
(159,867)
Structures in trust, net 183,349 193,653
Machinery and equipment in trust 1,592,359
1,623,898
Accumulated depreciation (719,408)
(708,259)
Machinery and equipment in trust, net 872,951 915,639
Tools, furniture and fixtures in trust 466,546
476,862
Accumulated depreciation (278,421)
(293,197)
Tools, furniture and fixtures in trust, net 188,125 183,665
Land in trust 259,908,839
272,828,051
Construction in progress in trust 83 2,933
Total property, plant and equipment 395,670,563 408,367,919
Intangible assets
Land leasehold 285,257
285,257
Land leasehold in trust 352,298
351,524
Other 3,501 2,889
Total intangible assets 641,057 639,671
Investments and other assets
Investment securities 1,090,336
1,114,806
Lease and guarantee deposits 10,000
10,000
Lease and guarantee deposits in trust 122,889
122,889
Long-term prepaid expenses 1,306,980
1,256,374
Other 61,130
113,111
KENEDIX OFFICE INVESTMENT CORPORATION (8972)
- 15 -
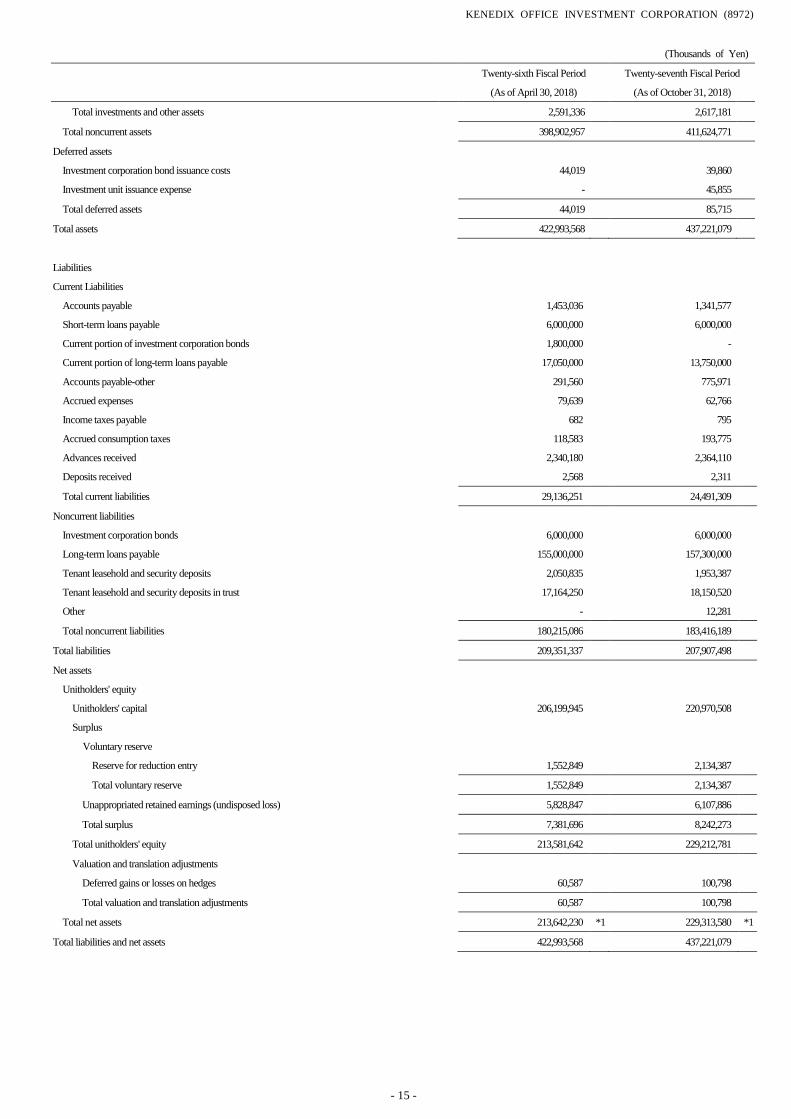
(Thousands of Yen)
Twenty-sixth Fiscal Period Twenty-seventh Fiscal Period
(As of April 30, 2018) (As of October 31, 2018)
Total investments and other assets 2,591,336 2,617,181
Total noncurrent assets 398,902,957 411,624,771
Deferred assets
Investment corporation bond issuance costs 44,019
39,860
Investment unit issuance expense - 45,855
Total deferred assets 44,019 85,715
Total assets 422,993,568 437,221,079
Liabilities
Current Liabilities
Accounts payable 1,453,036
1,341,577
Short-term loans payable 6,000,000
6,000,000
Current portion of investment corporation bonds 1,800,000 -
Current portion of long-term loans payable 17,050,000
13,750,000
Accounts payable-other 291,560
775,971
Accrued expenses 79,639
62,766
Income taxes payable 682
795
Accrued consumption taxes 118,583
193,775
Advances received 2,340,180
2,364,110
Deposits received 2,568
2,311
Total current liabilities 29,136,251 24,491,309
Noncurrent liabilities
Investment corporation bonds 6,000,000
6,000,000
Long-term loans payable 155,000,000
157,300,000
Tenant leasehold and security deposits 2,050,835
1,953,387
Tenant leasehold and security deposits in trust 17,164,250
18,150,520
Other - 12,281
Total noncurrent liabilities 180,215,086 183,416,189
Total liabilities 209,351,337 207,907,498
Net assets
Unitholders' equity
Unitholders' capital 206,199,945
220,970,508
Surplus
Voluntary reserve
Reserve for reduction entry 1,552,849
2,134,387
Total voluntary reserve 1,552,849 2,134,387
Unappropriated retained earnings (undisposed loss) 5,828,847 6,107,886
Total surplus 7,381,696 8,242,273
Total unitholders' equity 213,581,642 229,212,781
Valuation and translation adjustments
Deferred gains or losses on hedges 60,587 100,798
Total valuation and translation adjustments 60,587 100,798
Total net assets 213,642,230 *1 229,313,580 *1
Total liabilities and net assets 422,993,568 437,221,079
KENEDIX OFFICE INVESTMENT CORPORATION (8972)
- 16 -
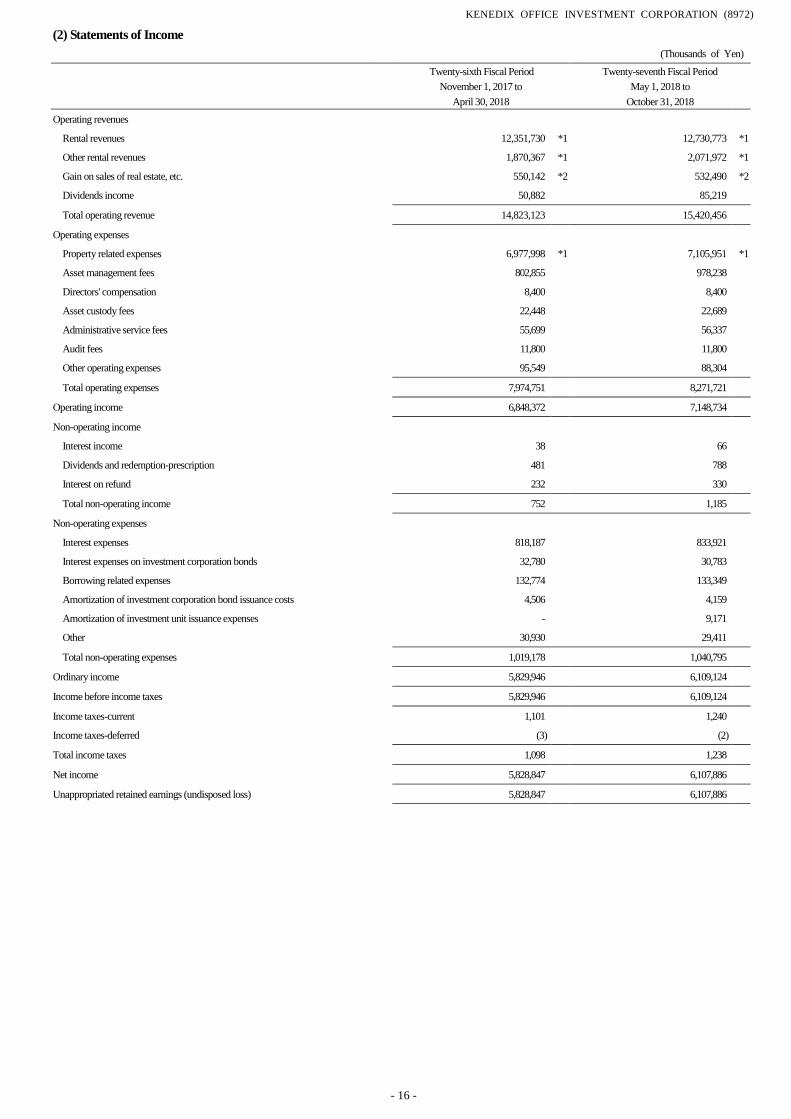
(2) Statements of Income
(Thousands of Yen)
Twenty-sixth Fiscal Period Twenty-seventh Fiscal Period November 1, 2017 to May 1, 2018 to
April 30, 2018 October 31, 2018
Operating revenues
Rental revenues 12,351,730 *1 12,730,773 *1
Other rental revenues 1,870,367 *1 2,071,972 *1
Gain on sales of real estate, etc. 550,142 *2 532,490 *2
Dividends income 50,882
85,219
Total operating revenue 14,823,123 15,420,456
Operating expenses
Property related expenses 6,977,998 *1 7,105,951 *1
Asset management fees 802,855
978,238
Directors' compensation 8,400
8,400
Asset custody fees 22,448
22,689
Administrative service fees 55,699
56,337
Audit fees 11,800
11,800
Other operating expenses 95,549
88,304
Total operating expenses 7,974,751 8,271,721
Operating income 6,848,372 7,148,734
Non-operating income
Interest income
38
66
Dividends and redemption-prescription
481
788
Interest on refund
232
330
Total non-operating income
752 1,185
Non-operating expenses
Interest expenses
818,187
833,921
Interest expenses on investment corporation bonds
32,780
30,783
Borrowing related expenses
132,774
133,349
Amortization of investment corporation bond issuance costs 4,506
4,159
Amortization of investment unit issuance expenses
-
9,171
Other
30,930
29,411
Total non-operating expenses
1,019,178 1,040,795
Ordinary income
5,829,946 6,109,124
Income before income taxes
5,829,946 6,109,124
Income taxes-current
1,101
1,240
Income taxes-deferred
(3)
(2)
Total income taxes
1,098 1,238
Net income
5,828,847 6,107,886
Unappropriated retained earnings (undisposed loss)
5,828,847 6,107,886
KENEDIX OFFICE INVESTMENT CORPORATION (8972)
- 17 -
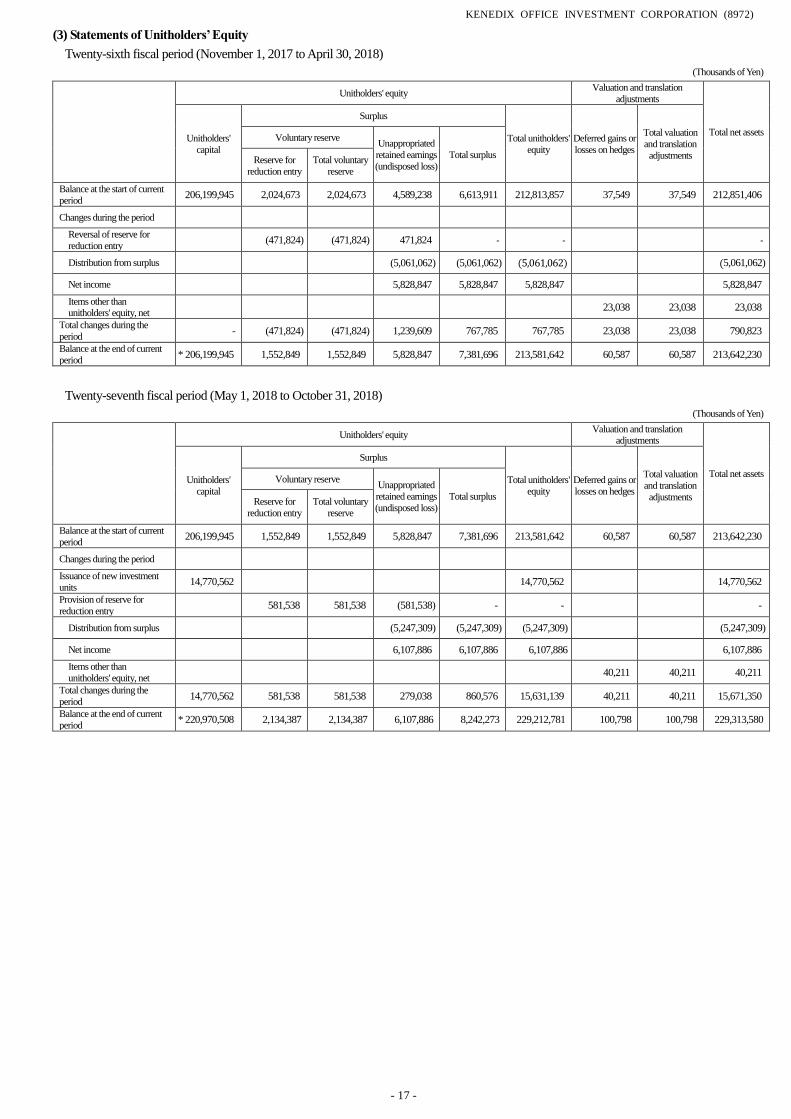
(3) Statements of Unitholders’ Equity
Twenty-sixth fiscal period (November 1, 2017 to April 30, 2018)
(Thousands of Yen)
Unitholders' equity Valuation and translation
adjustments
Total net assets Unitholders'
capital
Surplus
Total unitholders'
equity
Deferred gains or
losses on hedges
Total valuation
and translation
adjustments
Voluntary reserve Unappropriated
retained earnings
(undisposed loss)
Total surplus Reserve for
reduction entry
Total voluntary
reserve
Balance at the start of current
period 206,199,945 2,024,673 2,024,673 4,589,238 6,613,911 212,813,857 37,549 37,549 212,851,406
Changes during the period
Reversal of reserve for
reduction entry (471,824) (471,824) 471,824 - - -
Distribution from surplus (5,061,062) (5,061,062) (5,061,062) (5,061,062)
Net income 5,828,847 5,828,847 5,828,847 5,828,847
Items other than unitholders' equity, net
23,038 23,038 23,038
Total changes during the
period - (471,824) (471,824) 1,239,609 767,785 767,785 23,038 23,038 790,823
Balance at the end of current
period * 206,199,945 1,552,849 1,552,849 5,828,847 7,381,696 213,581,642 60,587 60,587 213,642,230
Twenty-seventh fiscal period (May 1, 2018 to October 31, 2018)
(Thousands of Yen)
Unitholders' equity Valuation and translation
adjustments
Total net assets Unitholders'
capital
Surplus
Total unitholders'
equity
Deferred gains or
losses on hedges
Total valuation
and translation
adjustments
Voluntary reserve Unappropriated
retained earnings
(undisposed loss)
Total surplus Reserve for
reduction entry
Total voluntary
reserve
Balance at the start of current
period 206,199,945 1,552,849 1,552,849 5,828,847 7,381,696 213,581,642 60,587 60,587 213,642,230
Changes during the period
Issuance of new investment
units 14,770,562 14,770,562 14,770,562
Provision of reserve for
reduction entry 581,538 581,538 (581,538) - - -
Distribution from surplus (5,247,309) (5,247,309) (5,247,309) (5,247,309)
Net income 6,107,886 6,107,886 6,107,886 6,107,886
Items other than
unitholders' equity, net 40,211 40,211 40,211
Total changes during the
period 14,770,562 581,538 581,538 279,038 860,576 15,631,139 40,211 40,211 15,671,350
Balance at the end of current
period * 220,970,508 2,134,387 2,134,387 6,107,886 8,242,273 229,212,781 100,798 100,798 229,313,580
KENEDIX OFFICE INVESTMENT CORPORATION (8972)
- 18 -
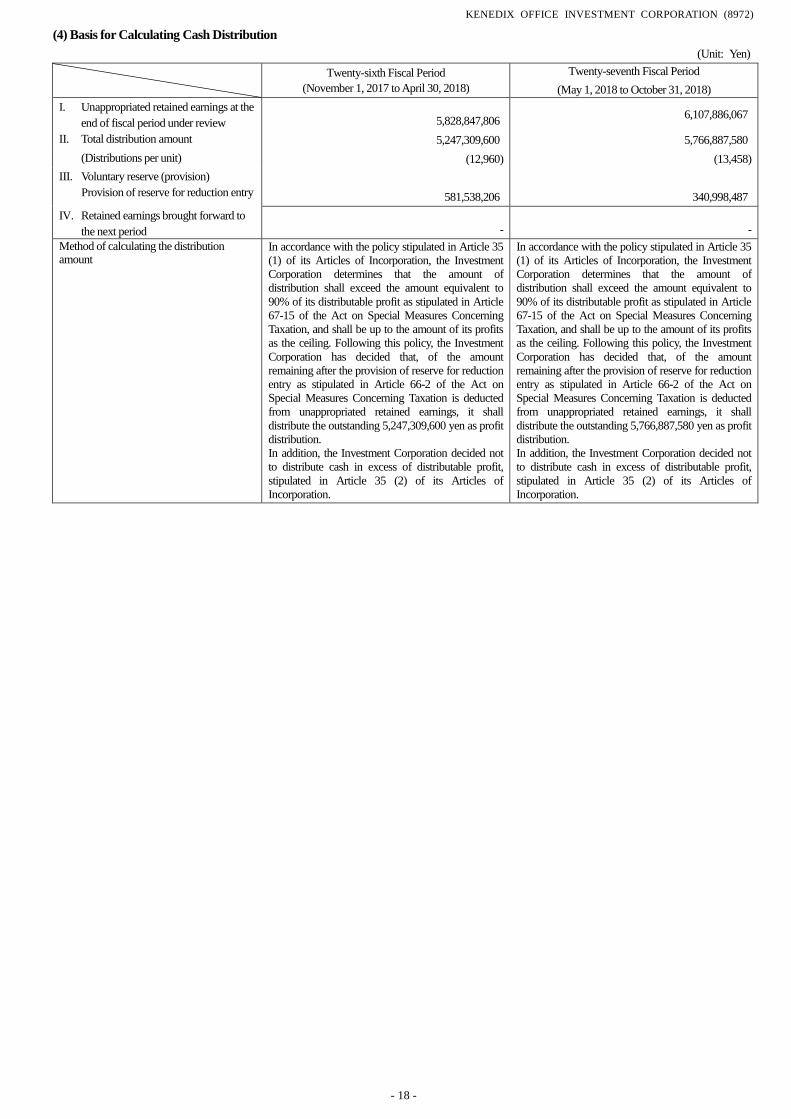
(4) Basis for Calculating Cash Distribution
(Unit: Yen)
Twenty-sixth Fiscal Period
(November 1, 2017 to April 30, 2018)
Twenty-seventh Fiscal Period
(May 1, 2018 to October 31, 2018)
I. Unappropriated retained earnings at the
end of fiscal period under review 5,828,847,806 6,107,886,067
II. Total distribution amount 5,247,309,600 5,766,887,580
(Distributions per unit) (12,960)
581,538,206
(13,458)
340,998,487
III. Voluntary reserve (provision)
Provision of reserve for reduction entry
IV. Retained earnings brought forward to
the next period - -
Method of calculating the distribution amount
In accordance with the policy stipulated in Article 35
(1) of its Articles of Incorporation, the Investment
Corporation determines that the amount of
distribution shall exceed the amount equivalent to
90% of its distributable profit as stipulated in Article
67-15 of the Act on Special Measures Concerning
Taxation, and shall be up to the amount of its profits
as the ceiling. Following this policy, the Investment
Corporation has decided that, of the amount
remaining after the provision of reserve for reduction
entry as stipulated in Article 66-2 of the Act on
Special Measures Concerning Taxation is deducted
from unappropriated retained earnings, it shall
distribute the outstanding 5,247,309,600 yen as profit
distribution.
In addition, the Investment Corporation decided not
to distribute cash in excess of distributable profit, stipulated in Article 35 (2) of its Articles of
Incorporation.
In accordance with the policy stipulated in Article 35
(1) of its Articles of Incorporation, the Investment
Corporation determines that the amount of
distribution shall exceed the amount equivalent to
90% of its distributable profit as stipulated in Article
67-15 of the Act on Special Measures Concerning
Taxation, and shall be up to the amount of its profits
as the ceiling. Following this policy, the Investment
Corporation has decided that, of the amount
remaining after the provision of reserve for reduction
entry as stipulated in Article 66-2 of the Act on
Special Measures Concerning Taxation is deducted
from unappropriated retained earnings, it shall
distribute the outstanding 5,766,887,580 yen as profit
distribution.
In addition, the Investment Corporation decided not
to distribute cash in excess of distributable profit, stipulated in Article 35 (2) of its Articles of
Incorporation.
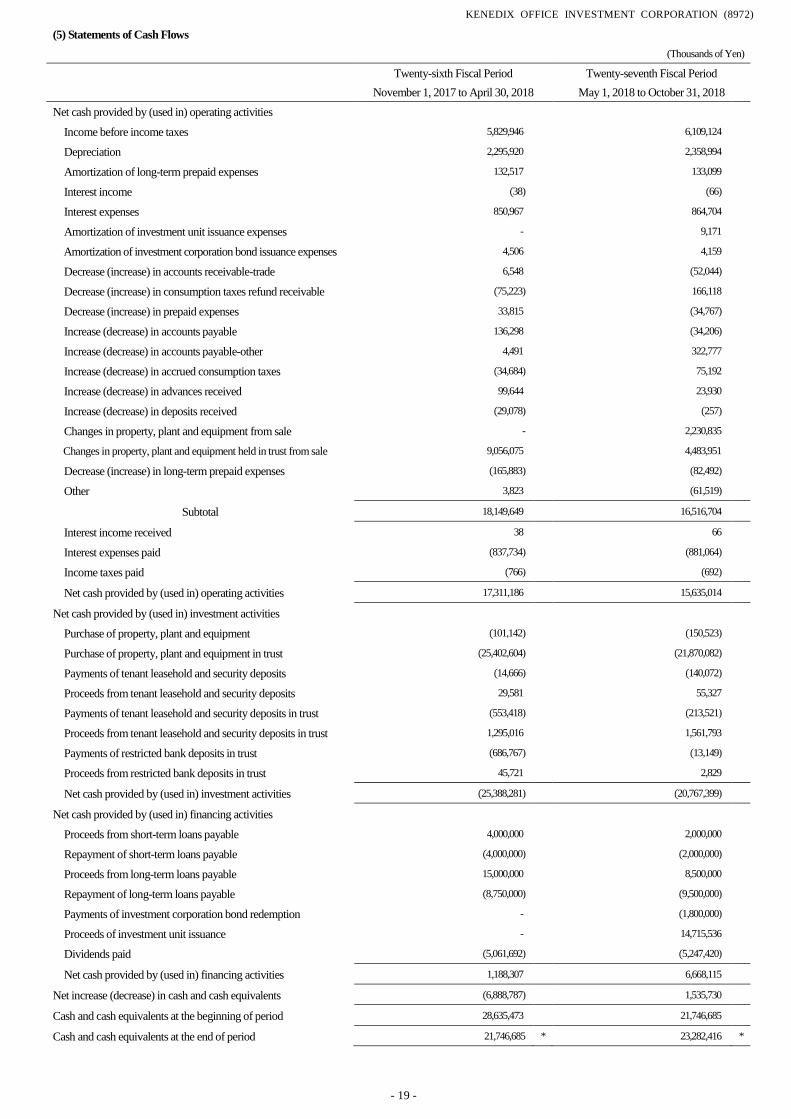
KENEDIX OFFICE INVESTMENT CORPORATION (8972)
- 19 -
(5) Statements of Cash Flows
(Thousands of Yen)
Twenty-sixth Fiscal Period
November 1, 2017 to April 30, 2018
Twenty-seventh Fiscal Period
May 1, 2018 to October 31, 2018
Net cash provided by (used in) operating activities
Income before income taxes 5,829,946 6,109,124
Depreciation 2,295,920 2,358,994
Amortization of long-term prepaid expenses 132,517 133,099
Interest income (38) (66)
Interest expenses 850,967 864,704
Amortization of investment unit issuance expenses - 9,171
Amortization of investment corporation bond issuance expenses 4,506 4,159
Decrease (increase) in accounts receivable-trade 6,548 (52,044)
Decrease (increase) in consumption taxes refund receivable (75,223) 166,118
Decrease (increase) in prepaid expenses 33,815 (34,767)
Increase (decrease) in accounts payable 136,298 (34,206)
Increase (decrease) in accounts payable-other 4,491 322,777
Increase (decrease) in accrued consumption taxes (34,684) 75,192
Increase (decrease) in advances received 99,644 23,930
Increase (decrease) in deposits received (29,078) (257)
Changes in property, plant and equipment from sale - 2,230,835
Changes in property, plant and equipment held in trust from sale 9,056,075 4,483,951
Decrease (increase) in long-term prepaid expenses (165,883) (82,492)
Other 3,823 (61,519)
Subtotal 18,149,649 16,516,704
Interest income received 38 66
Interest expenses paid (837,734) (881,064)
Income taxes paid (766) (692)
Net cash provided by (used in) operating activities 17,311,186 15,635,014
Net cash provided by (used in) investment activities
Purchase of property, plant and equipment (101,142) (150,523)
Purchase of property, plant and equipment in trust (25,402,604) (21,870,082)
Payments of tenant leasehold and security deposits (14,666) (140,072)
Proceeds from tenant leasehold and security deposits 29,581 55,327
Payments of tenant leasehold and security deposits in trust (553,418) (213,521)
Proceeds from tenant leasehold and security deposits in trust 1,295,016 1,561,793
Payments of restricted bank deposits in trust (686,767) (13,149)
Proceeds from restricted bank deposits in trust 45,721 2,829
Net cash provided by (used in) investment activities (25,388,281) (20,767,399)
Net cash provided by (used in) financing activities
Proceeds from short-term loans payable 4,000,000 2,000,000
Repayment of short-term loans payable (4,000,000) (2,000,000)
Proceeds from long-term loans payable 15,000,000 8,500,000
Repayment of long-term loans payable (8,750,000) (9,500,000)
Payments of investment corporation bond redemption - (1,800,000)
Proceeds of investment unit issuance - 14,715,536
Dividends paid (5,061,692) (5,247,420)
Net cash provided by (used in) financing activities 1,188,307 6,668,115
Net increase (decrease) in cash and cash equivalents (6,888,787) 1,535,730
Cash and cash equivalents at the beginning of period 28,635,473 21,746,685
Cash and cash equivalents at the end of period 21,746,685 * 23,282,416 *
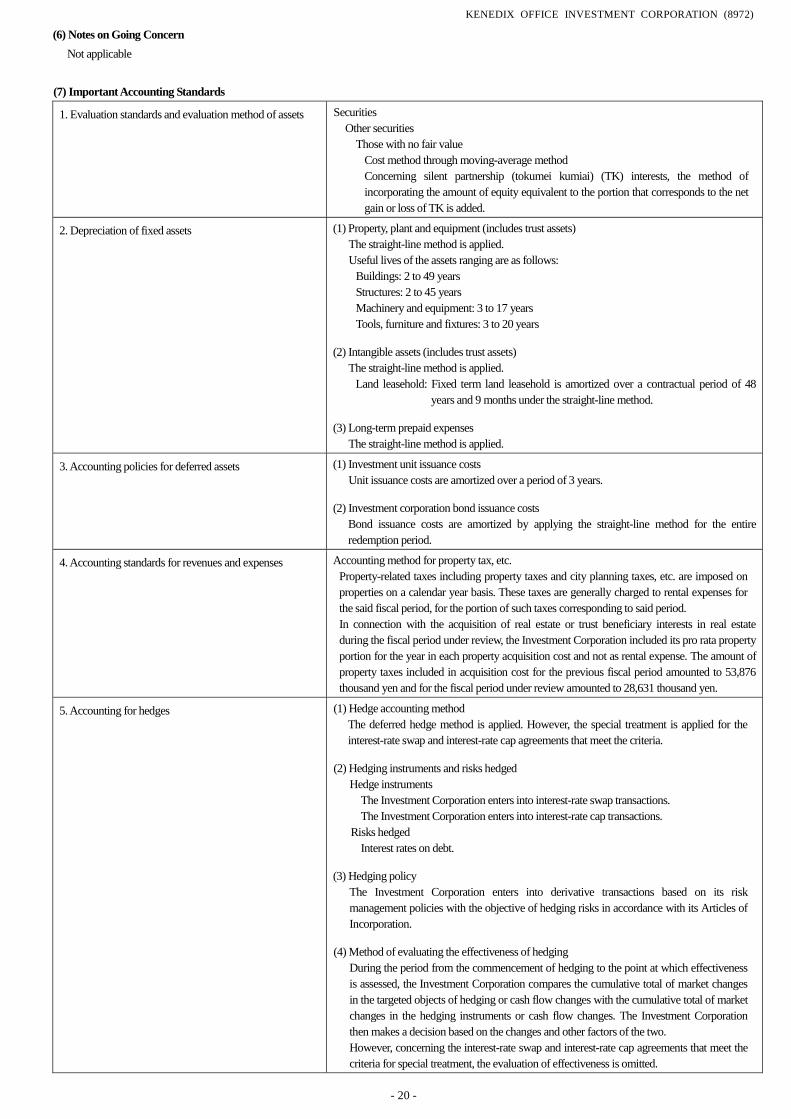
KENEDIX OFFICE INVESTMENT CORPORATION (8972)
- 20 -
(6) Notes on Going Concern
Not applicable
(7) Important Accounting Standards
1. Evaluation standards and evaluation method of assets Securities
Other securities
Those with no fair value
Cost method through moving-average method
Concerning silent partnership (tokumei kumiai) (TK) interests, the method of
incorporating the amount of equity equivalent to the portion that corresponds to the net
gain or loss of TK is added.
2. Depreciation of fixed assets
(1) Property, plant and equipment (includes trust assets)
The straight-line method is applied.
Useful lives of the assets ranging are as follows:
Buildings: 2 to 49 years
Structures: 2 to 45 years
Machinery and equipment: 3 to 17 years
Tools, furniture and fixtures: 3 to 20 years
(2) Intangible assets (includes trust assets)
The straight-line method is applied.
Land leasehold: Fixed term land leasehold is amortized over a contractual period of 48
years and 9 months under the straight-line method.
(3) Long-term prepaid expenses
The straight-line method is applied.
3. Accounting policies for deferred assets
(1) Investment unit issuance costs
Unit issuance costs are amortized over a period of 3 years.
(2) Investment corporation bond issuance costs
Bond issuance costs are amortized by applying the straight-line method for the entire
redemption period.
4. Accounting standards for revenues and expenses
Accounting method for property tax, etc.
Property-related taxes including property taxes and city planning taxes, etc. are imposed on
properties on a calendar year basis. These taxes are generally charged to rental expenses for
the said fiscal period, for the portion of such taxes corresponding to said period.
In connection with the acquisition of real estate or trust beneficiary interests in real estate
during the fiscal period under review, the Investment Corporation included its pro rata property
portion for the year in each property acquisition cost and not as rental expense. The amount of
property taxes included in acquisition cost for the previous fiscal period amounted to 53,876
thousand yen and for the fiscal period under review amounted to 28,631 thousand yen.
5. Accounting for hedges
(1) Hedge accounting method
The deferred hedge method is applied. However, the special treatment is applied for the
interest-rate swap and interest-rate cap agreements that meet the criteria.
(2) Hedging instruments and risks hedged
Hedge instruments
The Investment Corporation enters into interest-rate swap transactions.
The Investment Corporation enters into interest-rate cap transactions.
Risks hedged
Interest rates on debt.
(3) Hedging policy
The Investment Corporation enters into derivative transactions based on its risk
management policies with the objective of hedging risks in accordance with its Articles of
Incorporation.
(4) Method of evaluating the effectiveness of hedging
During the period from the commencement of hedging to the point at which effectiveness
is assessed, the Investment Corporation compares the cumulative total of market changes
in the targeted objects of hedging or cash flow changes with the cumulative total of market
changes in the hedging instruments or cash flow changes. The Investment Corporation
then makes a decision based on the changes and other factors of the two.
However, concerning the interest-rate swap and interest-rate cap agreements that meet the
criteria for special treatment, the evaluation of effectiveness is omitted.
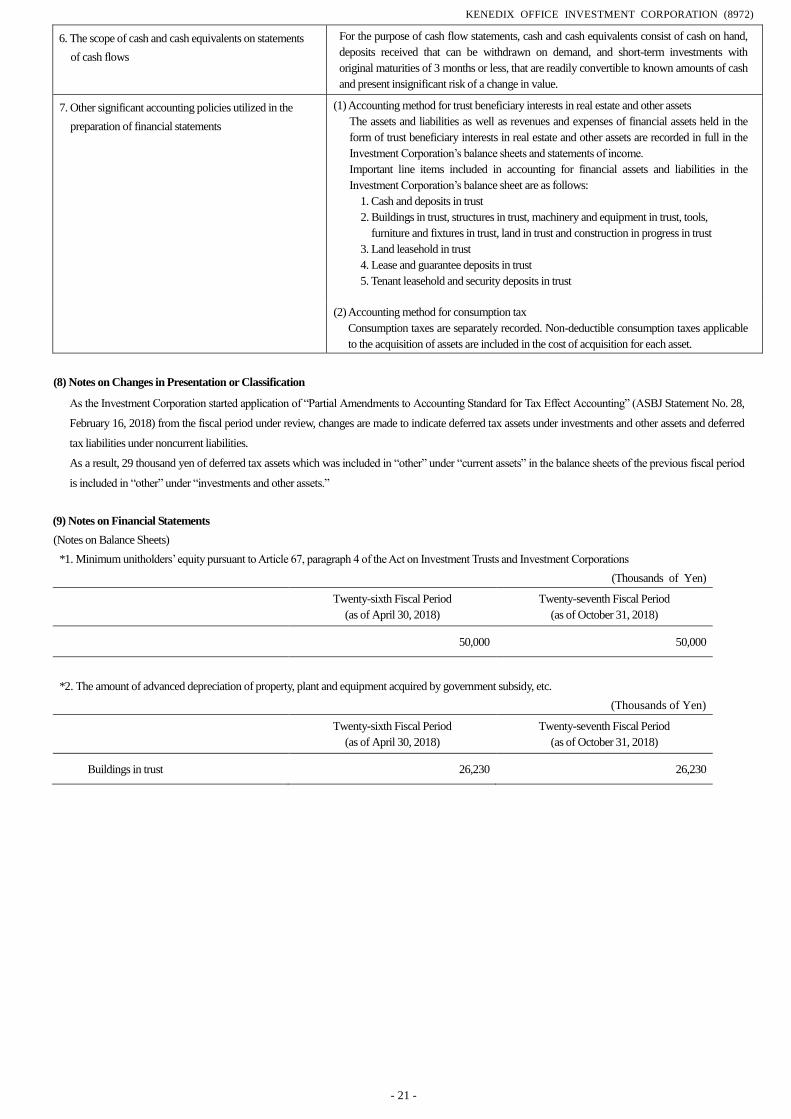
KENEDIX OFFICE INVESTMENT CORPORATION (8972)
- 21 -
6. The scope of cash and cash equivalents on statements
of cash flows
For the purpose of cash flow statements, cash and cash equivalents consist of cash on hand,
deposits received that can be withdrawn on demand, and short-term investments with
original maturities of 3 months or less, that are readily convertible to known amounts of cash
and present insignificant risk of a change in value.
7. Other significant accounting policies utilized in the
preparation of financial statements
(1) Accounting method for trust beneficiary interests in real estate and other assets
The assets and liabilities as well as revenues and expenses of financial assets held in the
form of trust beneficiary interests in real estate and other assets are recorded in full in the
Investment Corporation’s balance sheets and statements of income.
Important line items included in accounting for financial assets and liabilities in the
Investment Corporation’s balance sheet are as follows:
1. Cash and deposits in trust
2. Buildings in trust, structures in trust, machinery and equipment in trust, tools,
furniture and fixtures in trust, land in trust and construction in progress in trust
3. Land leasehold in trust
4. Lease and guarantee deposits in trust
5. Tenant leasehold and security deposits in trust
(2) Accounting method for consumption tax
Consumption taxes are separately recorded. Non-deductible consumption taxes applicable
to the acquisition of assets are included in the cost of acquisition for each asset.
(8) Notes on Changes in Presentation or Classification
As the Investment Corporation started application of “Partial Amendments to Accounting Standard for Tax Effect Accounting” (ASBJ Statement No. 28,
February 16, 2018) from the fiscal period under review, changes are made to indicate deferred tax assets under investments and other assets and deferred
tax liabilities under noncurrent liabilities.
As a result, 29 thousand yen of deferred tax assets which was included in “other” under “current assets” in the balance sheets of the previous fiscal period
is included in “other” under “investments and other assets.”
(9) Notes on Financial Statements
(Notes on Balance Sheets)
*1. Minimum unitholders’ equity pursuant to Article 67, paragraph 4 of the Act on Investment Trusts and Investment Corporations
(Thousands of Yen)
Twenty-sixth Fiscal Period
(as of April 30, 2018)
Twenty-seventh Fiscal Period
(as of October 31, 2018)
50,000 50,000
*2. The amount of advanced depreciation of property, plant and equipment acquired by government subsidy, etc.
(Thousands of Yen)
Twenty-sixth Fiscal Period
(as of April 30, 2018)
Twenty-seventh Fiscal Period
(as of October 31, 2018)
Buildings in trust 26,230 26,230
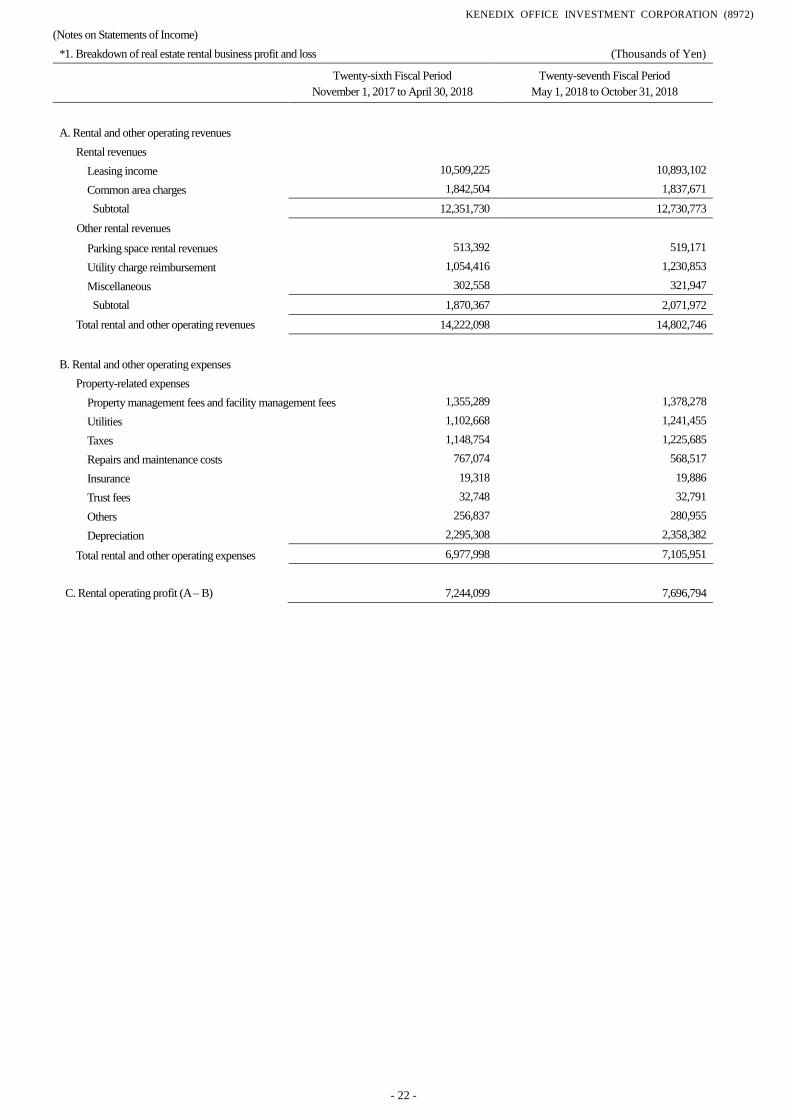
KENEDIX OFFICE INVESTMENT CORPORATION (8972)
- 22 -
(Notes on Statements of Income)
*1. Breakdown of real estate rental business profit and loss (Thousands of Yen)
Twenty-sixth Fiscal Period
November 1, 2017 to April 30, 2018
Twenty-seventh Fiscal Period
May 1, 2018 to October 31, 2018
A. Rental and other operating revenues
Rental revenues
Leasing income 10,509,225 10,893,102
Common area charges 1,842,504 1,837,671
Subtotal 12,351,730 12,730,773
Other rental revenues
Parking space rental revenues 513,392 519,171
Utility charge reimbursement 1,054,416 1,230,853
Miscellaneous 302,558 321,947
Subtotal 1,870,367 2,071,972
Total rental and other operating revenues 14,222,098 14,802,746
B. Rental and other operating expenses
Property-related expenses
Property management fees and facility management fees 1,355,289 1,378,278
Utilities 1,102,668 1,241,455
Taxes 1,148,754 1,225,685
Repairs and maintenance costs 767,074 568,517
Insurance 19,318 19,886
Trust fees 32,748 32,791
Others 256,837 280,955
Depreciation 2,295,308 2,358,382
Total rental and other operating expenses 6,977,998 7,105,951
C. Rental operating profit (A – B) 7,244,099 7,696,794
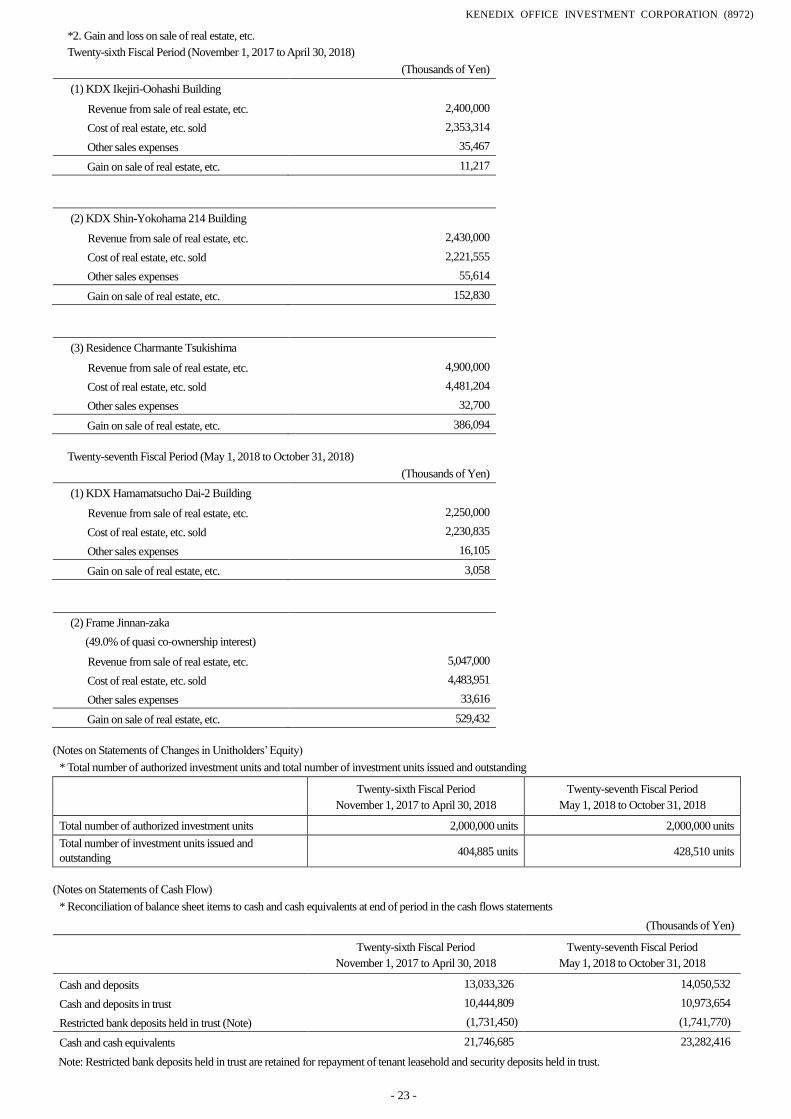
KENEDIX OFFICE INVESTMENT CORPORATION (8972)
- 23 -
*2. Gain and loss on sale of real estate, etc.
Twenty-sixth Fiscal Period (November 1, 2017 to April 30, 2018)
(Thousands of Yen)
(1) KDX Ikejiri-Oohashi Building
Revenue from sale of real estate, etc. 2,400,000
Cost of real estate, etc. sold 2,353,314
Other sales expenses 35,467
Gain on sale of real estate, etc. 11,217
(2) KDX Shin-Yokohama 214 Building
Revenue from sale of real estate, etc. 2,430,000
Cost of real estate, etc. sold 2,221,555
Other sales expenses 55,614
Gain on sale of real estate, etc. 152,830
(3) Residence Charmante Tsukishima
Revenue from sale of real estate, etc. 4,900,000
Cost of real estate, etc. sold 4,481,204
Other sales expenses 32,700
Gain on sale of real estate, etc. 386,094
Twenty-seventh Fiscal Period (May 1, 2018 to October 31, 2018)
(Thousands of Yen)
(1) KDX Hamamatsucho Dai-2 Building
Revenue from sale of real estate, etc. 2,250,000
Cost of real estate, etc. sold 2,230,835
Other sales expenses 16,105
Gain on sale of real estate, etc. 3,058
(2) Frame Jinnan-zaka
(49.0% of quasi co-ownership interest)
Revenue from sale of real estate, etc. 5,047,000
Cost of real estate, etc. sold 4,483,951
Other sales expenses 33,616
Gain on sale of real estate, etc. 529,432
(Notes on Statements of Changes in Unitholders’ Equity)
* Total number of authorized investment units and total number of investment units issued and outstanding
Twenty-sixth Fiscal Period
November 1, 2017 to April 30, 2018
Twenty-seventh Fiscal Period
May 1, 2018 to October 31, 2018
Total number of authorized investment units 2,000,000 units 2,000,000 units
Total number of investment units issued and
outstanding 404,885 units 428,510 units
(Notes on Statements of Cash Flow)
* Reconciliation of balance sheet items to cash and cash equivalents at end of period in the cash flows statements
(Thousands of Yen)
Twenty-sixth Fiscal Period
November 1, 2017 to April 30, 2018
Twenty-seventh Fiscal Period
May 1, 2018 to October 31, 2018
Cash and deposits 13,033,326 14,050,532
Cash and deposits in trust 10,444,809 10,973,654
Restricted bank deposits held in trust (Note) (1,731,450) (1,741,770)
Cash and cash equivalents 21,746,685 23,282,416
Note: Restricted bank deposits held in trust are retained for repayment of tenant leasehold and security deposits held in trust.

KENEDIX OFFICE INVESTMENT CORPORATION (8972)
- 24 -
(Notes on Lease Transactions)
Operating lease transactions
(Lessor) (Thousands of Yen)
Twenty-sixth Fiscal Period
(as of April 30, 2018)
Twenty-seventh Fiscal Period
(as of October 31, 2018)
Unearned lease payments
Due within one year 1,446,246 1,621,774
Due after one year 5,943,183 5,956,433
Total 7,389,430 7,578,208
(Notes on Financial Instruments)
1. Items with Regard to the Current Status of Financial Instruments
(1) Action Policy with Regard to Financial Instruments
The Investment Corporation procures essential funds for acquiring properties and undertaking the repayment of loans primarily through bank loans and
the issuance of investment corporation bonds and new investment units. The Investment Corporation makes use of derivative instruments primarily as a
risk hedge against interest rate fluctuations and to lessen interest-rate payments. In addition, it is company policy to not conduct speculative derivative
transactions. Management of surplus funds is undertaken in a prudent manner that considers fully such factors as safety, liquidity, interest rate
conditions and cash flows.
(2) Financial Instruments and Respective Risks
Investment securities are TK interests, which are subject to credit risk of the issuer and risk of fluctuation of value of real estate, etc.
Loans and investment corporation bonds are used primarily for procuring funds necessary for the acquisition of properties and have a redemption date
of a maximum of about 10 years following the closing date. Although a certain portion of said liabilities are subject to interest rate fluctuation risks, the
Investment Corporation utilizes derivative instruments (interest-rate swap transactions, etc.) in order to hedge against such risks.
Derivative instruments are interest-rate swap and interest-rate cap transactions that are used to hedge against interest rate fluctuation risks. Utilizing
interest-rate swap transactions, the Investment Corporation fixed its interest payments for funds procured on a floating interest rate basis or minimizing
the risk of interest rate increase. With regard to hedge accounting methods, hedging instruments and hedged items, hedge policy, and the method of
evaluation of hedge effectiveness, please refer to “5. Accounting for hedges in notes concerning Important Accounting Standards.”
(3) Risk Management Structure with Regard to Financial Instruments
A. Management of Market Risk (Risk Associated with Fluctuations in Interest Rates and Others)
The Investment Corporation uses interest-rate swap etc., in order to minimize risks associated with interest payment rate fluctuations on funds
procured.
The Investment Corporation will periodically grasp the value of real estate, etc. and financial condition, etc. of the issuer with regard to investment
securities.
B. Management of Liquidity Risk (Risk of Defaulting on Payments by the Due Date) Associated with Funds Procurement
Although loans and other liabilities are subject to liquidity risks, the Investment Corporation reduces such risks by spreading out payment due dates
and by using diversified fund procurement methods. Liquidity risk is also managed by such means as regularly checking the balance of cash
reserves.
(4) Supplemental Explanation of Items with Regard to Fair Value of Financial Instruments
Included in the fair value of financial products are market prices, or, in the event market prices are not available, prices that are calculated on a
rational basis. Because the factors incorporated into the calculation of these prices are subject to change, differing assumptions are adopted which
may alter fair value. Moreover, the contract amounts, etc. of derivative transactions in “2. Items with Regard to Fair Value of Financial Instruments”
do not indicate the market risk of derivative transactions.
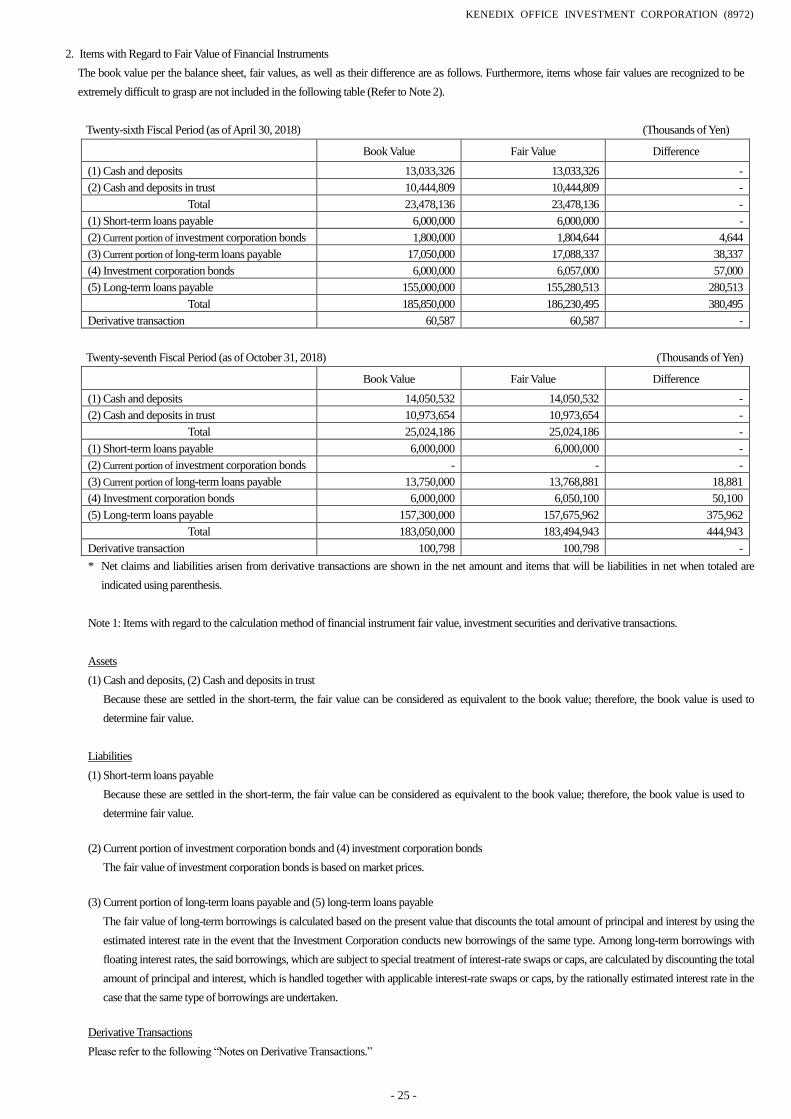
KENEDIX OFFICE INVESTMENT CORPORATION (8972)
- 25 -
2. Items with Regard to Fair Value of Financial Instruments
The book value per the balance sheet, fair values, as well as their difference are as follows. Furthermore, items whose fair values are recognized to be
extremely difficult to grasp are not included in the following table (Refer to Note 2).
Twenty-sixth Fiscal Period (as of April 30, 2018) (Thousands of Yen)
Book Value Fair Value Difference
(1) Cash and deposits 13,033,326 13,033,326 -
(2) Cash and deposits in trust 10,444,809 10,444,809 -
Total 23,478,136 23,478,136 -
(1) Short-term loans payable 6,000,000 6,000,000 -
(2) Current portion of investment corporation bonds 1,800,000 1,804,644 4,644
(3) Current portion of long-term loans payable 17,050,000 17,088,337 38,337
(4) Investment corporation bonds 6,000,000 6,057,000 57,000
(5) Long-term loans payable 155,000,000 155,280,513 280,513
Total 185,850,000 186,230,495 380,495
Derivative transaction 60,587 60,587 -
Twenty-seventh Fiscal Period (as of October 31, 2018) (Thousands of Yen)
Book Value Fair Value Difference
(1) Cash and deposits 14,050,532 14,050,532 -
(2) Cash and deposits in trust 10,973,654 10,973,654 -
Total 25,024,186 25,024,186 -
(1) Short-term loans payable 6,000,000 6,000,000 -
(2) Current portion of investment corporation bonds - - -
(3) Current portion of long-term loans payable 13,750,000 13,768,881 18,881
(4) Investment corporation bonds 6,000,000 6,050,100 50,100
(5) Long-term loans payable 157,300,000 157,675,962 375,962
Total 183,050,000 183,494,943 444,943
Derivative transaction 100,798 100,798 -
* Net claims and liabilities arisen from derivative transactions are shown in the net amount and items that will be liabilities in net when totaled are
indicated using parenthesis.
Note 1: Items with regard to the calculation method of financial instrument fair value, investment securities and derivative transactions.
Assets
(1) Cash and deposits, (2) Cash and deposits in trust
Because these are settled in the short-term, the fair value can be considered as equivalent to the book value; therefore, the book value is used to
determine fair value.
Liabilities
(1) Short-term loans payable
Because these are settled in the short-term, the fair value can be considered as equivalent to the book value; therefore, the book value is used to
determine fair value.
(2) Current portion of investment corporation bonds and (4) investment corporation bonds
The fair value of investment corporation bonds is based on market prices.
(3) Current portion of long-term loans payable and (5) long-term loans payable
The fair value of long-term borrowings is calculated based on the present value that discounts the total amount of principal and interest by using the
estimated interest rate in the event that the Investment Corporation conducts new borrowings of the same type. Among long-term borrowings with
floating interest rates, the said borrowings, which are subject to special treatment of interest-rate swaps or caps, are calculated by discounting the total
amount of principal and interest, which is handled together with applicable interest-rate swaps or caps, by the rationally estimated interest rate in the
case that the same type of borrowings are undertaken.
Derivative Transactions
Please refer to the following “Notes on Derivative Transactions.”
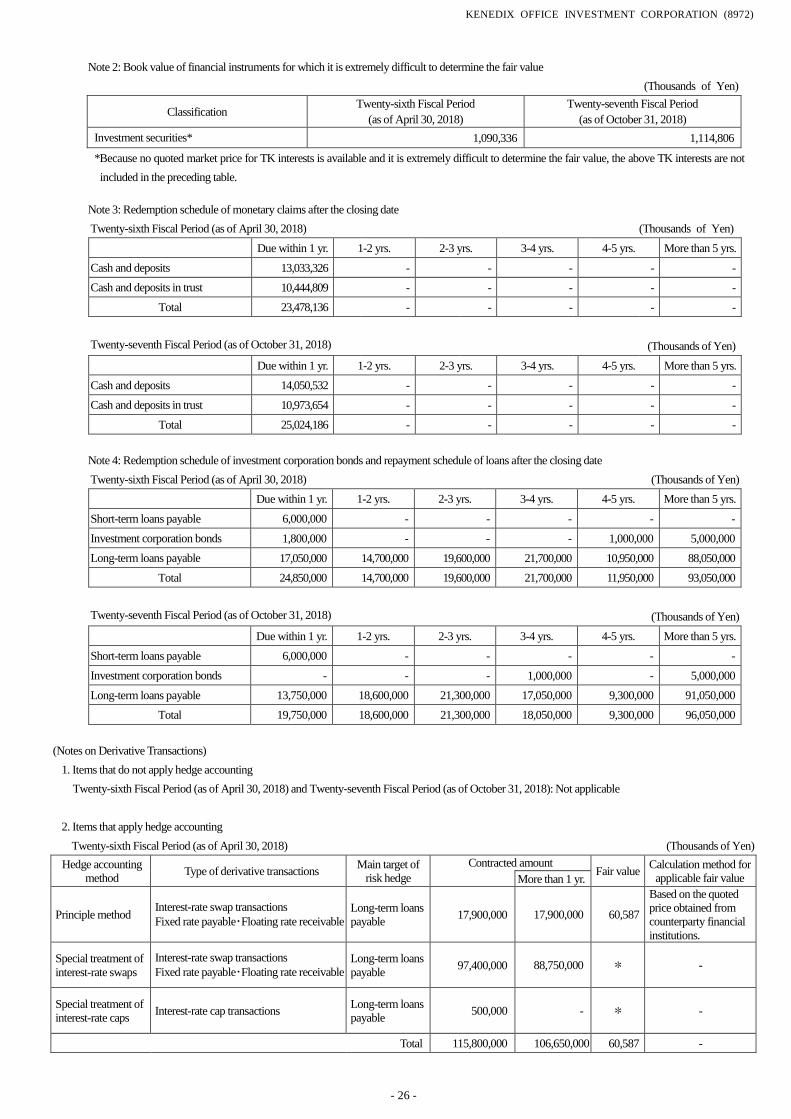
KENEDIX OFFICE INVESTMENT CORPORATION (8972)
- 26 -
Note 2: Book value of financial instruments for which it is extremely difficult to determine the fair value
(Thousands of Yen)
Classification Twenty-sixth Fiscal Period
(as of April 30, 2018)
Twenty-seventh Fiscal Period
(as of October 31, 2018)
Investment securities* 1,090,336 1,114,806
*Because no quoted market price for TK interests is available and it is extremely difficult to determine the fair value, the above TK interests are not
included in the preceding table.
Note 3: Redemption schedule of monetary claims after the closing date
Twenty-sixth Fiscal Period (as of April 30, 2018) (Thousands of Yen)
Due within 1 yr. 1-2 yrs. 2-3 yrs. 3-4 yrs. 4-5 yrs. More than 5 yrs.
Cash and deposits 13,033,326 - - - - -
Cash and deposits in trust 10,444,809 - - - - -
Total 23,478,136 - - - - -
Twenty-seventh Fiscal Period (as of October 31, 2018)
(Thousands of Yen)
Due within 1 yr. 1-2 yrs. 2-3 yrs. 3-4 yrs. 4-5 yrs. More than 5 yrs.
Cash and deposits 14,050,532 - - - - -
Cash and deposits in trust 10,973,654 - - - - -
Total 25,024,186 - - - - -
Note 4: Redemption schedule of investment corporation bonds and repayment schedule of loans after the closing date
Twenty-sixth Fiscal Period (as of April 30, 2018) (Thousands of Yen)
Due within 1 yr. 1-2 yrs. 2-3 yrs. 3-4 yrs. 4-5 yrs. More than 5 yrs.
Short-term loans payable 6,000,000 - - - - -
Investment corporation bonds 1,800,000 - - - 1,000,000 5,000,000
Long-term loans payable 17,050,000 14,700,000 19,600,000 21,700,000 10,950,000 88,050,000
Total 24,850,000 14,700,000 19,600,000 21,700,000 11,950,000 93,050,000
Twenty-seventh Fiscal Period (as of October 31, 2018)
(Thousands of Yen)
Due within 1 yr. 1-2 yrs. 2-3 yrs. 3-4 yrs. 4-5 yrs. More than 5 yrs.
Short-term loans payable 6,000,000 - - - - -
Investment corporation bonds - - - 1,000,000 - 5,000,000
Long-term loans payable 13,750,000 18,600,000 21,300,000 17,050,000 9,300,000 91,050,000
Total 19,750,000 18,600,000 21,300,000 18,050,000 9,300,000 96,050,000
(Notes on Derivative Transactions)
1. Items that do not apply hedge accounting
Twenty-sixth Fiscal Period (as of April 30, 2018) and Twenty-seventh Fiscal Period (as of October 31, 2018): Not applicable
2. Items that apply hedge accounting
Twenty-sixth Fiscal Period (as of April 30, 2018) (Thousands of Yen)
Hedge accounting
method Type of derivative transactions
Main target of
risk hedge
Contracted amount Fair value
Calculation method for
applicable fair value More than 1 yr.
Principle method Interest-rate swap transactions
Fixed rate payable・Floating rate receivable
Long-term loans
payable 17,900,000 17,900,000 60,587
Based on the quoted
price obtained from
counterparty financial
institutions.
Special treatment of
interest-rate swaps
Interest-rate swap transactions
Fixed rate payable・Floating rate receivable
Long-term loans
payable 97,400,000 88,750,000 * -
Special treatment of
interest-rate caps Interest-rate cap transactions
Long-term loans
payable 500,000 - * -
Total 115,800,000 106,650,000 60,587 -
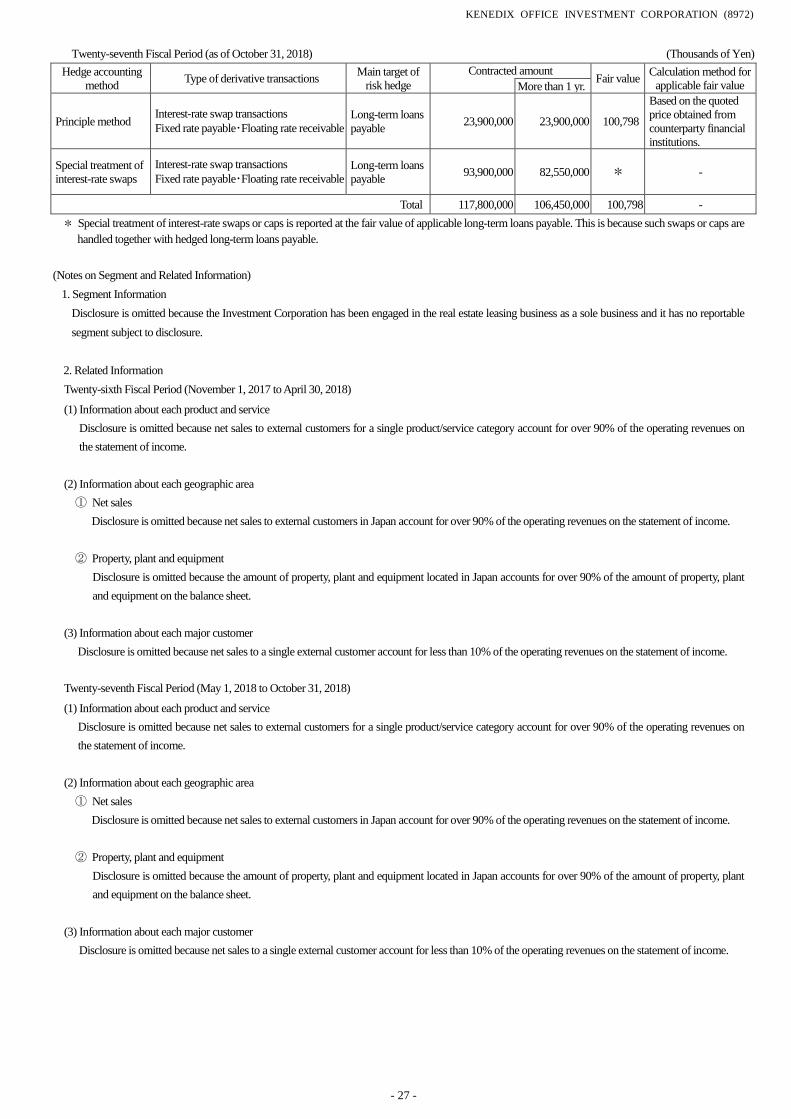
KENEDIX OFFICE INVESTMENT CORPORATION (8972)
- 27 -
Twenty-seventh Fiscal Period (as of October 31, 2018) (Thousands of Yen)
Hedge accounting
method Type of derivative transactions
Main target of
risk hedge
Contracted amount Fair value
Calculation method for
applicable fair value More than 1 yr.
Principle method Interest-rate swap transactions
Fixed rate payable・Floating rate receivable
Long-term loans
payable 23,900,000 23,900,000 100,798
Based on the quoted
price obtained from
counterparty financial
institutions.
Special treatment of
interest-rate swaps
Interest-rate swap transactions
Fixed rate payable・Floating rate receivable Long-term loans
payable 93,900,000 82,550,000 * -
Total 117,800,000 106,450,000 100,798 -
* Special treatment of interest-rate swaps or caps is reported at the fair value of applicable long-term loans payable. This is because such swaps or caps are
handled together with hedged long-term loans payable.
(Notes on Segment and Related Information)
1. Segment Information
Disclosure is omitted because the Investment Corporation has been engaged in the real estate leasing business as a sole business and it has no reportable
segment subject to disclosure.
2. Related Information
Twenty-sixth Fiscal Period (November 1, 2017 to April 30, 2018)
(1) Information about each product and service
Disclosure is omitted because net sales to external customers for a single product/service category account for over 90% of the operating revenues on
the statement of income.
(2) Information about each geographic area
① Net sales
Disclosure is omitted because net sales to external customers in Japan account for over 90% of the operating revenues on the statement of income.
② Property, plant and equipment
Disclosure is omitted because the amount of property, plant and equipment located in Japan accounts for over 90% of the amount of property, plant
and equipment on the balance sheet.
(3) Information about each major customer
Disclosure is omitted because net sales to a single external customer account for less than 10% of the operating revenues on the statement of income.
Twenty-seventh Fiscal Period (May 1, 2018 to October 31, 2018)
(1) Information about each product and service
Disclosure is omitted because net sales to external customers for a single product/service category account for over 90% of the operating revenues on
the statement of income.
(2) Information about each geographic area
① Net sales
Disclosure is omitted because net sales to external customers in Japan account for over 90% of the operating revenues on the statement of income.
② Property, plant and equipment
Disclosure is omitted because the amount of property, plant and equipment located in Japan accounts for over 90% of the amount of property, plant
and equipment on the balance sheet.
(3) Information about each major customer
Disclosure is omitted because net sales to a single external customer account for less than 10% of the operating revenues on the statement of income.
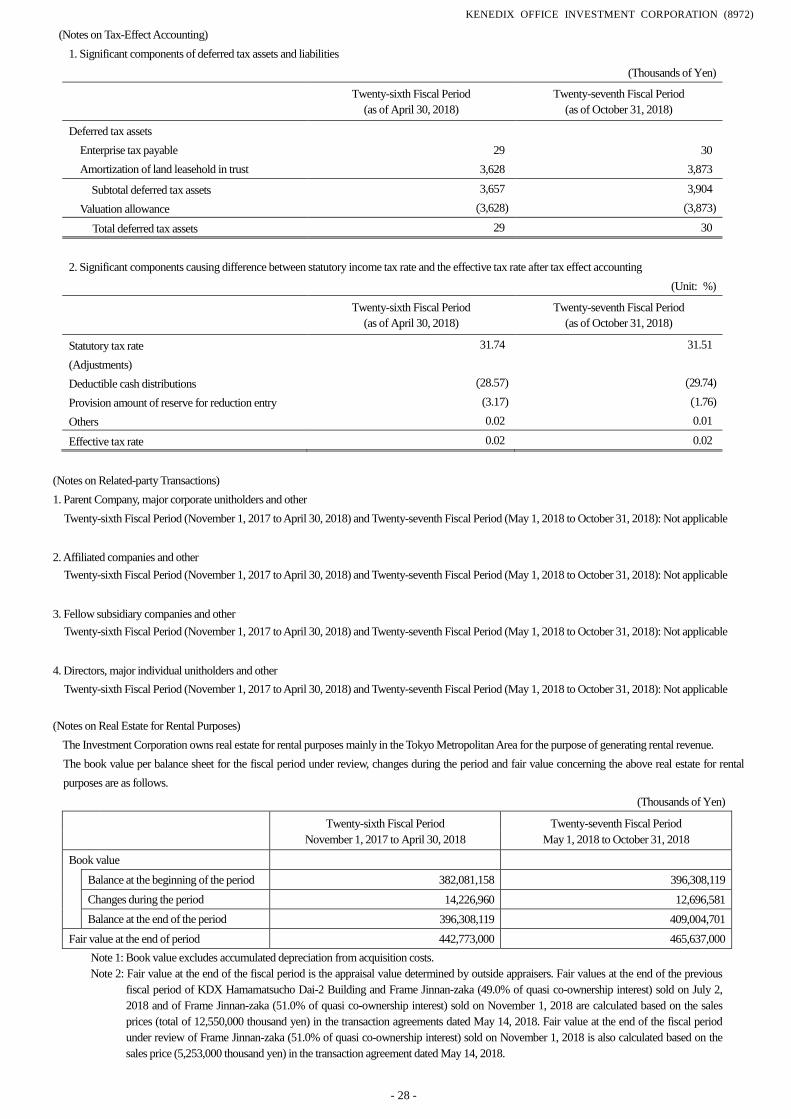
KENEDIX OFFICE INVESTMENT CORPORATION (8972)
- 28 -
(Notes on Tax-Effect Accounting)
1. Significant components of deferred tax assets and liabilities
(Thousands of Yen)
Twenty-sixth Fiscal Period
(as of April 30, 2018)
Twenty-seventh Fiscal Period
(as of October 31, 2018)
Deferred tax assets
Enterprise tax payable 29 30
Amortization of land leasehold in trust 3,628 3,873
Subtotal deferred tax assets 3,657 3,904
Valuation allowance (3,628) (3,873)
Total deferred tax assets 29 30
2. Significant components causing difference between statutory income tax rate and the effective tax rate after tax effect accounting
(Unit: %)
Twenty-sixth Fiscal Period
(as of April 30, 2018)
Twenty-seventh Fiscal Period
(as of October 31, 2018)
Statutory tax rate 31.74 31.51
(Adjustments)
Deductible cash distributions (28.57) (29.74)
Provision amount of reserve for reduction entry (3.17) (1.76)
Others 0.02 0.01
Effective tax rate 0.02 0.02
(Notes on Related-party Transactions)
1. Parent Company, major corporate unitholders and other
Twenty-sixth Fiscal Period (November 1, 2017 to April 30, 2018) and Twenty-seventh Fiscal Period (May 1, 2018 to October 31, 2018): Not applicable
2. Affiliated companies and other
Twenty-sixth Fiscal Period (November 1, 2017 to April 30, 2018) and Twenty-seventh Fiscal Period (May 1, 2018 to October 31, 2018): Not applicable
3. Fellow subsidiary companies and other
Twenty-sixth Fiscal Period (November 1, 2017 to April 30, 2018) and Twenty-seventh Fiscal Period (May 1, 2018 to October 31, 2018): Not applicable
4. Directors, major individual unitholders and other
Twenty-sixth Fiscal Period (November 1, 2017 to April 30, 2018) and Twenty-seventh Fiscal Period (May 1, 2018 to October 31, 2018): Not applicable
(Notes on Real Estate for Rental Purposes)
The Investment Corporation owns real estate for rental purposes mainly in the Tokyo Metropolitan Area for the purpose of generating rental revenue.
The book value per balance sheet for the fiscal period under review, changes during the period and fair value concerning the above real estate for rental
purposes are as follows.
(Thousands of Yen)
Twenty-sixth Fiscal Period
November 1, 2017 to April 30, 2018
Twenty-seventh Fiscal Period
May 1, 2018 to October 31, 2018
Book value
Balance at the beginning of the period 382,081,158 396,308,119
Changes during the period 14,226,960 12,696,581
Balance at the end of the period 396,308,119 409,004,701
Fair value at the end of period 442,773,000 465,637,000
Note 1: Book value excludes accumulated depreciation from acquisition costs.
Note 2: Fair value at the end of the fiscal period is the appraisal value determined by outside appraisers. Fair values at the end of the previous
fiscal period of KDX Hamamatsucho Dai-2 Building and Frame Jinnan-zaka (49.0% of quasi co-ownership interest) sold on July 2,
2018 and of Frame Jinnan-zaka (51.0% of quasi co-ownership interest) sold on November 1, 2018 are calculated based on the sales
prices (total of 12,550,000 thousand yen) in the transaction agreements dated May 14, 2018. Fair value at the end of the fiscal period
under review of Frame Jinnan-zaka (51.0% of quasi co-ownership interest) sold on November 1, 2018 is also calculated based on the
sales price (5,253,000 thousand yen) in the transaction agreement dated May 14, 2018.
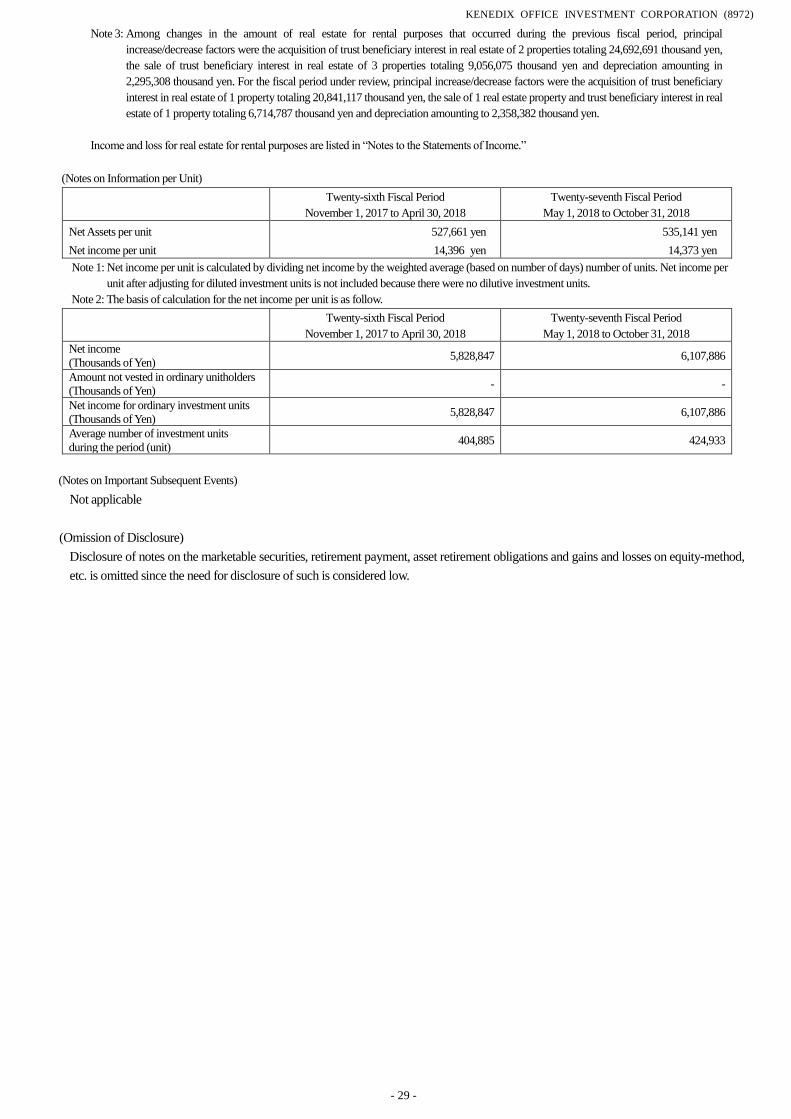
KENEDIX OFFICE INVESTMENT CORPORATION (8972)
- 29 -
Note 3: Among changes in the amount of real estate for rental purposes that occurred during the previous fiscal period, principal
increase/decrease factors were the acquisition of trust beneficiary interest in real estate of 2 properties totaling 24,692,691 thousand yen,
the sale of trust beneficiary interest in real estate of 3 properties totaling 9,056,075 thousand yen and depreciation amounting in
2,295,308 thousand yen. For the fiscal period under review, principal increase/decrease factors were the acquisition of trust beneficiary
interest in real estate of 1 property totaling 20,841,117 thousand yen, the sale of 1 real estate property and trust beneficiary interest in real
estate of 1 property totaling 6,714,787 thousand yen and depreciation amounting to 2,358,382 thousand yen.
Income and loss for real estate for rental purposes are listed in “Notes to the Statements of Income.”
(Notes on Information per Unit)
Twenty-sixth Fiscal Period
November 1, 2017 to April 30, 2018
Twenty-seventh Fiscal Period
May 1, 2018 to October 31, 2018
Net Assets per unit 527,661 yen 535,141 yen
Net income per unit 14,396 yen 14,373 yen
Note 1: Net income per unit is calculated by dividing net income by the weighted average (based on number of days) number of units. Net income per
unit after adjusting for diluted investment units is not included because there were no dilutive investment units.
Note 2: The basis of calculation for the net income per unit is as follow.
Twenty-sixth Fiscal Period
November 1, 2017 to April 30, 2018
Twenty-seventh Fiscal Period
May 1, 2018 to October 31, 2018
Net income
(Thousands of Yen) 5,828,847 6,107,886
Amount not vested in ordinary unitholders
(Thousands of Yen) - -
Net income for ordinary investment units
(Thousands of Yen) 5,828,847 6,107,886
Average number of investment units
during the period (unit) 404,885 424,933
(Notes on Important Subsequent Events)
Not applicable
(Omission of Disclosure)
Disclosure of notes on the marketable securities, retirement payment, asset retirement obligations and gains and losses on equity-method,
etc. is omitted since the need for disclosure of such is considered low.
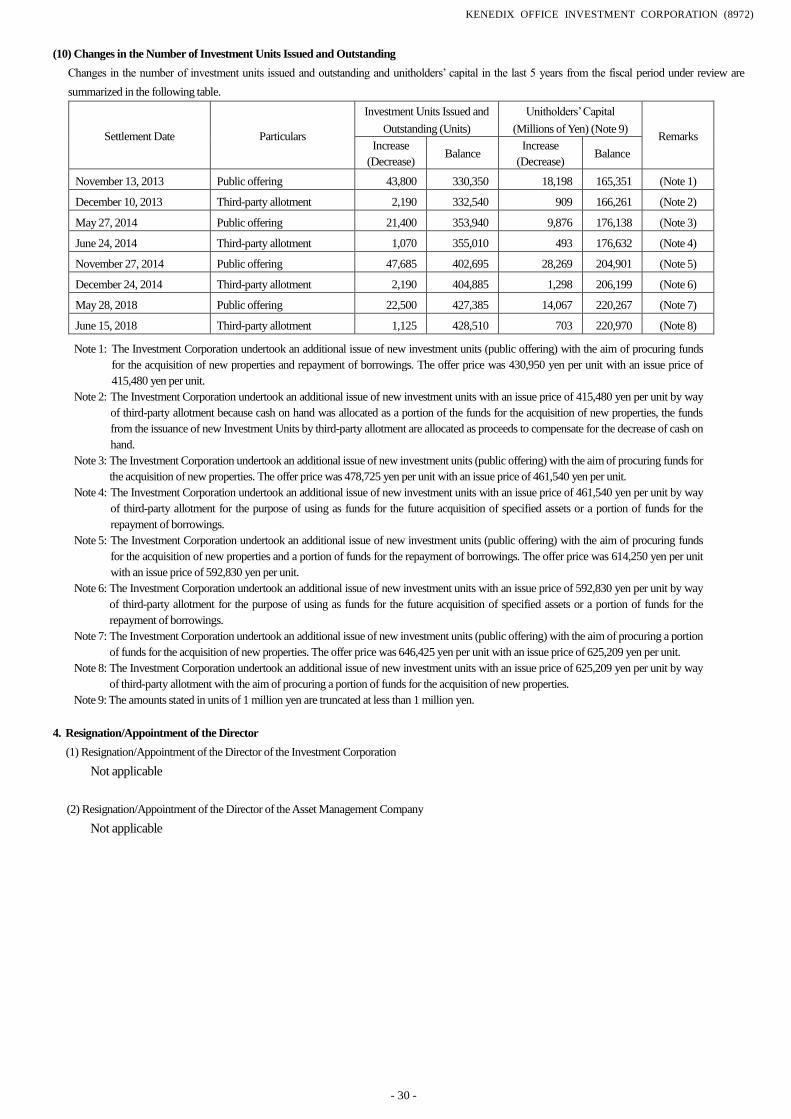
KENEDIX OFFICE INVESTMENT CORPORATION (8972)
- 30 -
(10) Changes in the Number of Investment Units Issued and Outstanding
Changes in the number of investment units issued and outstanding and unitholders’ capital in the last 5 years from the fiscal period under review are
summarized in the following table.
Settlement Date Particulars
Investment Units Issued and
Outstanding (Units)
Unitholders’ Capital
(Millions of Yen) (Note 9) Remarks
Increase
(Decrease) Balance
Increase
(Decrease) Balance
November 13, 2013 Public offering 43,800 330,350 18,198 165,351 (Note 1)
December 10, 2013 Third-party allotment 2,190 332,540 909 166,261 (Note 2)
May 27, 2014 Public offering 21,400 353,940 9,876 176,138 (Note 3)
June 24, 2014 Third-party allotment 1,070 355,010 493 176,632 (Note 4)
November 27, 2014 Public offering 47,685 402,695 28,269 204,901 (Note 5)
December 24, 2014 Third-party allotment 2,190 404,885 1,298 206,199 (Note 6)
May 28, 2018 Public offering 22,500 427,385 14,067 220,267 (Note 7)
June 15, 2018 Third-party allotment 1,125 428,510 703 220,970 (Note 8)
Note 1: The Investment Corporation undertook an additional issue of new investment units (public offering) with the aim of procuring funds
for the acquisition of new properties and repayment of borrowings. The offer price was 430,950 yen per unit with an issue price of
415,480 yen per unit.
Note 2: The Investment Corporation undertook an additional issue of new investment units with an issue price of 415,480 yen per unit by way
of third-party allotment because cash on hand was allocated as a portion of the funds for the acquisition of new properties, the funds
from the issuance of new Investment Units by third-party allotment are allocated as proceeds to compensate for the decrease of cash on
hand.
Note 3: The Investment Corporation undertook an additional issue of new investment units (public offering) with the aim of procuring funds for
the acquisition of new properties. The offer price was 478,725 yen per unit with an issue price of 461,540 yen per unit.
Note 4: The Investment Corporation undertook an additional issue of new investment units with an issue price of 461,540 yen per unit by way
of third-party allotment for the purpose of using as funds for the future acquisition of specified assets or a portion of funds for the
repayment of borrowings.
Note 5: The Investment Corporation undertook an additional issue of new investment units (public offering) with the aim of procuring funds
for the acquisition of new properties and a portion of funds for the repayment of borrowings. The offer price was 614,250 yen per unit
with an issue price of 592,830 yen per unit.
Note 6: The Investment Corporation undertook an additional issue of new investment units with an issue price of 592,830 yen per unit by way
of third-party allotment for the purpose of using as funds for the future acquisition of specified assets or a portion of funds for the
repayment of borrowings.
Note 7: The Investment Corporation undertook an additional issue of new investment units (public offering) with the aim of procuring a portion
of funds for the acquisition of new properties. The offer price was 646,425 yen per unit with an issue price of 625,209 yen per unit.
Note 8: The Investment Corporation undertook an additional issue of new investment units with an issue price of 625,209 yen per unit by way
of third-party allotment with the aim of procuring a portion of funds for the acquisition of new properties.
Note 9: The amounts stated in units of 1 million yen are truncated at less than 1 million yen.
4. Resignation/Appointment of the Director
(1) Resignation/Appointment of the Director of the Investment Corporation
Not applicable
(2) Resignation/Appointment of the Director of the Asset Management Company
Not applicable
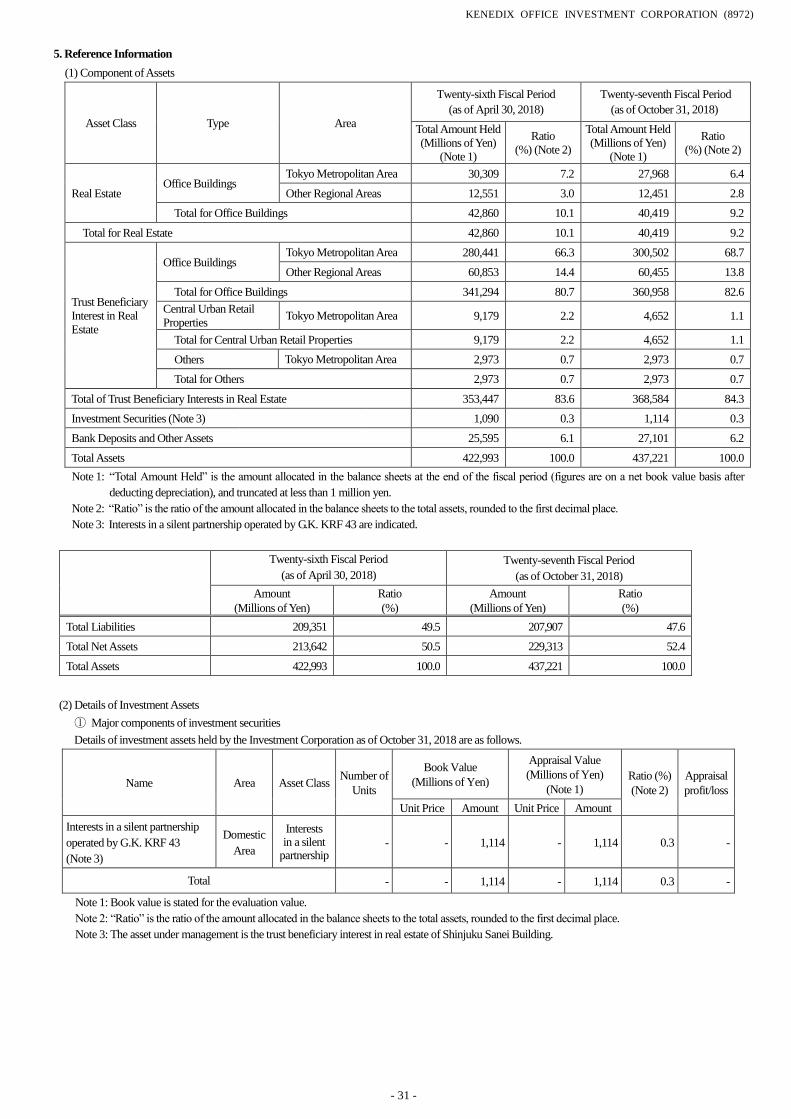
KENEDIX OFFICE INVESTMENT CORPORATION (8972)
- 31 -
5. Reference Information
(1) Component of Assets
Asset Class Type Area
Twenty-sixth Fiscal Period
(as of April 30, 2018)
Twenty-seventh Fiscal Period
(as of October 31, 2018)
Total Amount Held
(Millions of Yen)
(Note 1)
Ratio
(%) (Note 2)
Total Amount Held
(Millions of Yen)
(Note 1)
Ratio
(%) (Note 2)
Real Estate Office Buildings
Tokyo Metropolitan Area 30,309 7.2 27,968 6.4
Other Regional Areas 12,551 3.0 12,451 2.8
Total for Office Buildings 42,860 10.1 40,419 9.2
Total for Real Estate 42,860 10.1 40,419 9.2
Trust Beneficiary
Interest in Real
Estate
Office Buildings Tokyo Metropolitan Area 280,441 66.3 300,502 68.7
Other Regional Areas 60,853 14.4 60,455 13.8
Total for Office Buildings 341,294 80.7 360,958 82.6
Central Urban Retail
Properties Tokyo Metropolitan Area 9,179 2.2 4,652 1.1
Total for Central Urban Retail Properties 9,179 2.2 4,652 1.1
Others Tokyo Metropolitan Area 2,973 0.7 2,973 0.7
Total for Others 2,973 0.7 2,973 0.7
Total of Trust Beneficiary Interests in Real Estate 353,447 83.6 368,584 84.3
Investment Securities (Note 3) 1,090 0.3 1,114 0.3
Bank Deposits and Other Assets 25,595 6.1 27,101 6.2
Total Assets 422,993 100.0 437,221 100.0
Note 1: “Total Amount Held” is the amount allocated in the balance sheets at the end of the fiscal period (figures are on a net book value basis after
deducting depreciation), and truncated at less than 1 million yen.
Note 2: “Ratio” is the ratio of the amount allocated in the balance sheets to the total assets, rounded to the first decimal place.
Note 3: Interests in a silent partnership operated by G.K. KRF 43 are indicated.
Twenty-sixth Fiscal Period
(as of April 30, 2018)
Twenty-seventh Fiscal Period
(as of October 31, 2018)
Amount
(Millions of Yen)
Ratio
(%)
Amount
(Millions of Yen)
Ratio
(%)
Total Liabilities 209,351 49.5 207,907 47.6
Total Net Assets 213,642 50.5 229,313 52.4
Total Assets 422,993 100.0 437,221 100.0
(2) Details of Investment Assets
① Major components of investment securities
Details of investment assets held by the Investment Corporation as of October 31, 2018 are as follows.
Name Area Asset Class Number of
Units
Book Value
(Millions of Yen)
Appraisal Value
(Millions of Yen)
(Note 1)
Ratio (%)
(Note 2)
Appraisal
profit/loss
Unit Price Amount Unit Price Amount
Interests in a silent partnership
operated by G.K. KRF 43
(Note 3)
Domestic
Area
Interests in a silent
partnership - - 1,114 - 1,114 0.3 -
Total - - 1,114 - 1,114 0.3 -
Note 1: Book value is stated for the evaluation value.
Note 2: “Ratio” is the ratio of the amount allocated in the balance sheets to the total assets, rounded to the first decimal place.
Note 3: The asset under management is the trust beneficiary interest in real estate of Shinjuku Sanei Building.
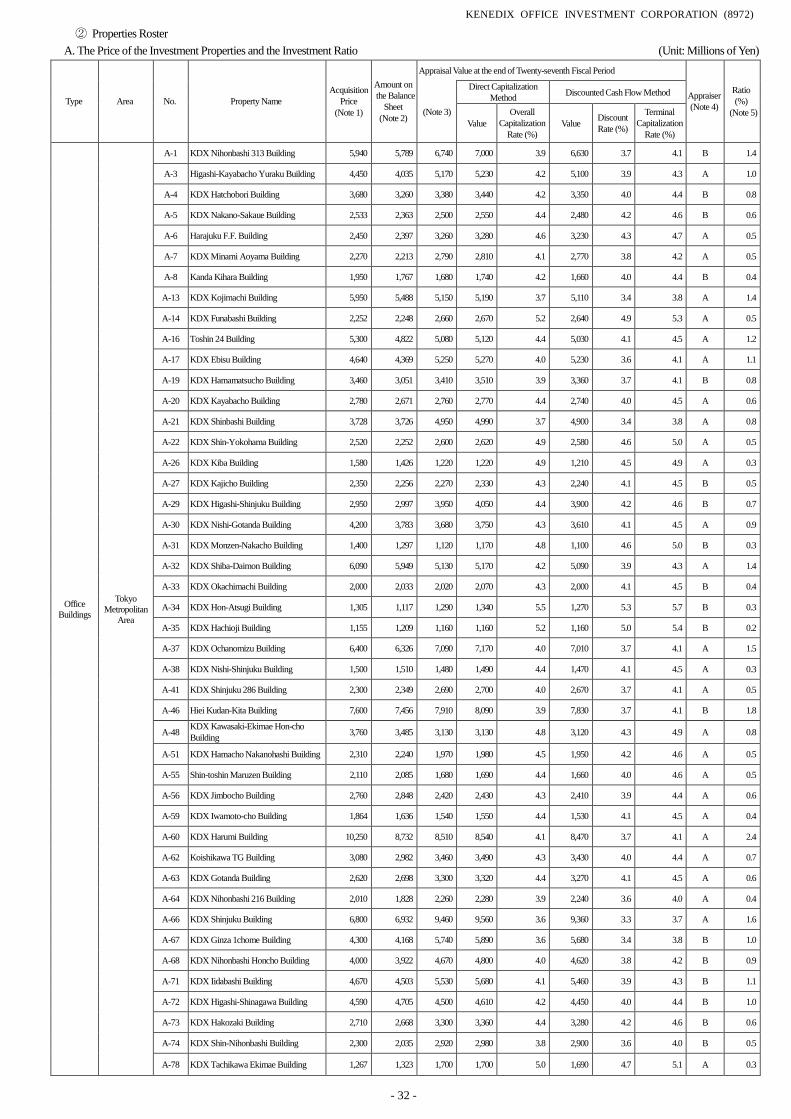
KENEDIX OFFICE INVESTMENT CORPORATION (8972)
- 32 -
② Properties Roster
A. The Price of the Investment Properties and the Investment Ratio (Unit: Millions of Yen)
Type Area No. Property Name
Acquisition
Price
(Note 1)
Amount on
the Balance
Sheet
(Note 2)
Appraisal Value at the end of Twenty-seventh Fiscal Period
Appraiser
(Note 4)
Ratio
(%)
(Note 5) (Note 3)
Direct Capitalization
Method Discounted Cash Flow Method
Value
Overall
Capitalization
Rate (%)
Value Discount
Rate (%)
Terminal
Capitalization
Rate (%)
Office
Buildings
Tokyo
Metropolitan
Area
A-1 KDX Nihonbashi 313 Building 5,940 5,789 6,740 7,000 3.9 6,630 3.7 4.1 B 1.4
A-3 Higashi-Kayabacho Yuraku Building 4,450 4,035 5,170 5,230 4.2 5,100 3.9 4.3 A 1.0
A-4 KDX Hatchobori Building 3,680 3,260 3,380 3,440 4.2 3,350 4.0 4.4 B 0.8
A-5 KDX Nakano-Sakaue Building 2,533 2,363 2,500 2,550 4.4 2,480 4.2 4.6 B 0.6
A-6 Harajuku F.F. Building 2,450 2,397 3,260 3,280 4.6 3,230 4.3 4.7 A 0.5
A-7 KDX Minami Aoyama Building 2,270 2,213 2,790 2,810 4.1 2,770 3.8 4.2 A 0.5
A-8 Kanda Kihara Building 1,950 1,767 1,680 1,740 4.2 1,660 4.0 4.4 B 0.4
A-13 KDX Kojimachi Building 5,950 5,488 5,150 5,190 3.7 5,110 3.4 3.8 A 1.4
A-14 KDX Funabashi Building 2,252 2,248 2,660 2,670 5.2 2,640 4.9 5.3 A 0.5
A-16 Toshin 24 Building 5,300 4,822 5,080 5,120 4.4 5,030 4.1 4.5 A 1.2
A-17 KDX Ebisu Building 4,640 4,369 5,250 5,270 4.0 5,230 3.6 4.1 A 1.1
A-19 KDX Hamamatsucho Building 3,460 3,051 3,410 3,510 3.9 3,360 3.7 4.1 B 0.8
A-20 KDX Kayabacho Building 2,780 2,671 2,760 2,770 4.4 2,740 4.0 4.5 A 0.6
A-21 KDX Shinbashi Building 3,728 3,726 4,950 4,990 3.7 4,900 3.4 3.8 A 0.8
A-22 KDX Shin-Yokohama Building 2,520 2,252 2,600 2,620 4.9 2,580 4.6 5.0 A 0.5
A-26 KDX Kiba Building 1,580 1,426 1,220 1,220 4.9 1,210 4.5 4.9 A 0.3
A-27 KDX Kajicho Building 2,350 2,256 2,270 2,330 4.3 2,240 4.1 4.5 B 0.5
A-29 KDX Higashi-Shinjuku Building 2,950 2,997 3,950 4,050 4.4 3,900 4.2 4.6 B 0.7
A-30 KDX Nishi-Gotanda Building 4,200 3,783 3,680 3,750 4.3 3,610 4.1 4.5 A 0.9
A-31 KDX Monzen-Nakacho Building 1,400 1,297 1,120 1,170 4.8 1,100 4.6 5.0 B 0.3
A-32 KDX Shiba-Daimon Building 6,090 5,949 5,130 5,170 4.2 5,090 3.9 4.3 A 1.4
A-33 KDX Okachimachi Building 2,000 2,033 2,020 2,070 4.3 2,000 4.1 4.5 B 0.4
A-34 KDX Hon-Atsugi Building 1,305 1,117 1,290 1,340 5.5 1,270 5.3 5.7 B 0.3
A-35 KDX Hachioji Building 1,155 1,209 1,160 1,160 5.2 1,160 5.0 5.4 B 0.2
A-37 KDX Ochanomizu Building 6,400 6,326 7,090 7,170 4.0 7,010 3.7 4.1 A 1.5
A-38 KDX Nishi-Shinjuku Building 1,500 1,510 1,480 1,490 4.4 1,470 4.1 4.5 A 0.3
A-41 KDX Shinjuku 286 Building 2,300 2,349 2,690 2,700 4.0 2,670 3.7 4.1 A 0.5
A-46 Hiei Kudan-Kita Building 7,600 7,456 7,910 8,090 3.9 7,830 3.7 4.1 B 1.8
A-48 KDX Kawasaki-Ekimae Hon-cho
Building 3,760 3,485 3,130 3,130 4.8 3,120 4.3 4.9 A 0.8
A-51 KDX Hamacho Nakanohashi Building 2,310 2,240 1,970 1,980 4.5 1,950 4.2 4.6 A 0.5
A-55 Shin-toshin Maruzen Building 2,110 2,085 1,680 1,690 4.4 1,660 4.0 4.6 A 0.5
A-56 KDX Jimbocho Building 2,760 2,848 2,420 2,430 4.3 2,410 3.9 4.4 A 0.6
A-59 KDX Iwamoto-cho Building 1,864 1,636 1,540 1,550 4.4 1,530 4.1 4.5 A 0.4
A-60 KDX Harumi Building 10,250 8,732 8,510 8,540 4.1 8,470 3.7 4.1 A 2.4
A-62 Koishikawa TG Building 3,080 2,982 3,460 3,490 4.3 3,430 4.0 4.4 A 0.7
A-63 KDX Gotanda Building 2,620 2,698 3,300 3,320 4.4 3,270 4.1 4.5 A 0.6
A-64 KDX Nihonbashi 216 Building 2,010 1,828 2,260 2,280 3.9 2,240 3.6 4.0 A 0.4
A-66 KDX Shinjuku Building 6,800 6,932 9,460 9,560 3.6 9,360 3.3 3.7 A 1.6
A-67 KDX Ginza 1chome Building 4,300 4,168 5,740 5,890 3.6 5,680 3.4 3.8 B 1.0
A-68 KDX Nihonbashi Honcho Building 4,000 3,922 4,670 4,800 4.0 4,620 3.8 4.2 B 0.9
A-71 KDX Iidabashi Building 4,670 4,503 5,530 5,680 4.1 5,460 3.9 4.3 B 1.1
A-72 KDX Higashi-Shinagawa Building 4,590 4,705 4,500 4,610 4.2 4,450 4.0 4.4 B 1.0
A-73 KDX Hakozaki Building 2,710 2,668 3,300 3,360 4.4 3,280 4.2 4.6 B 0.6
A-74 KDX Shin-Nihonbashi Building 2,300 2,035 2,920 2,980 3.8 2,900 3.6 4.0 B 0.5
A-78 KDX Tachikawa Ekimae Building 1,267 1,323 1,700 1,700 5.0 1,690 4.7 5.1 A 0.3
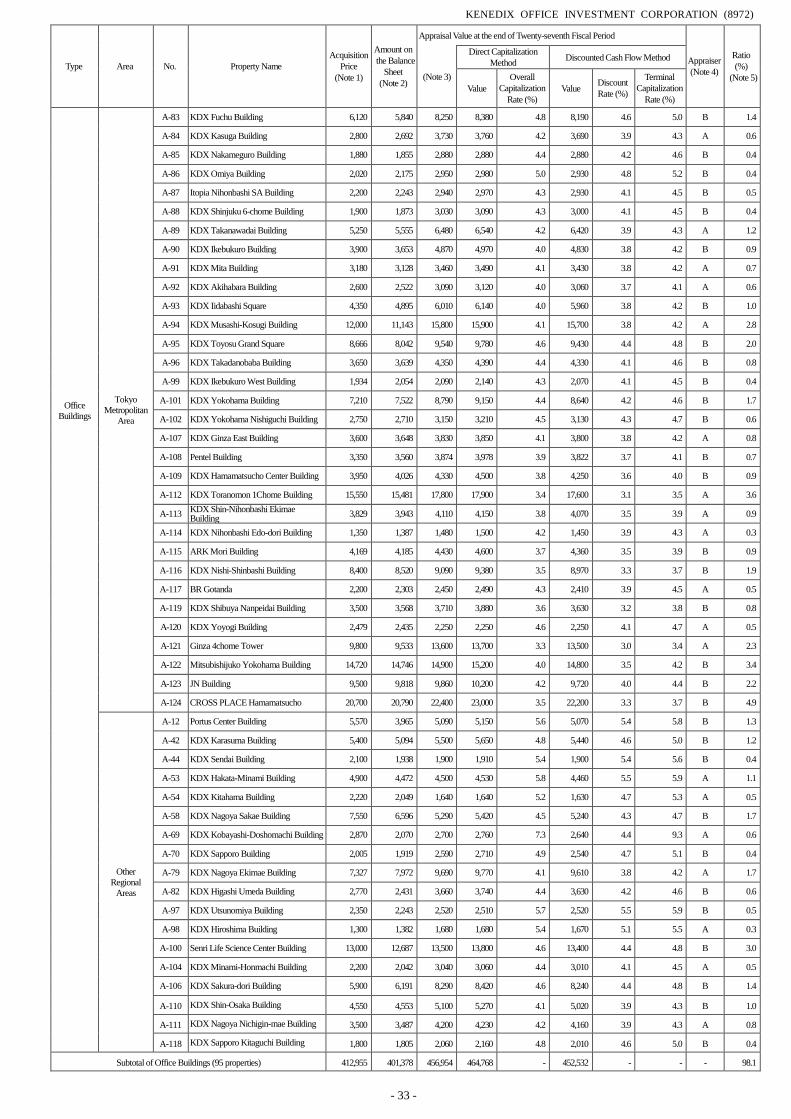
KENEDIX OFFICE INVESTMENT CORPORATION (8972)
- 33 -
Type Area No. Property Name
Acquisition
Price
(Note 1)
Amount on
the Balance
Sheet
(Note 2)
Appraisal Value at the end of Twenty-seventh Fiscal Period
Appraiser
(Note 4)
Ratio
(%)
(Note 5) (Note 3)
Direct Capitalization
Method Discounted Cash Flow Method
Value
Overall
Capitalization
Rate (%)
Value Discount
Rate (%)
Terminal
Capitalization
Rate (%)
Office
Buildings
Tokyo
Metropolitan
Area
A-83 KDX Fuchu Building 6,120 5,840 8,250 8,380 4.8 8,190 4.6 5.0 B 1.4
A-84 KDX Kasuga Building 2,800 2,692 3,730 3,760 4.2 3,690 3.9 4.3 A 0.6
A-85 KDX Nakameguro Building 1,880 1,855 2,880 2,880 4.4 2,880 4.2 4.6 B 0.4
A-86 KDX Omiya Building 2,020 2,175 2,950 2,980 5.0 2,930 4.8 5.2 B 0.4
A-87 Itopia Nihonbashi SA Building 2,200 2,243 2,940 2,970 4.3 2,930 4.1 4.5 B 0.5
A-88 KDX Shinjuku 6-chome Building 1,900 1,873 3,030 3,090 4.3 3,000 4.1 4.5 B 0.4
A-89 KDX Takanawadai Building 5,250 5,555 6,480 6,540 4.2 6,420 3.9 4.3 A 1.2
A-90 KDX Ikebukuro Building 3,900 3,653 4,870 4,970 4.0 4,830 3.8 4.2 B 0.9
A-91 KDX Mita Building 3,180 3,128 3,460 3,490 4.1 3,430 3.8 4.2 A 0.7
A-92 KDX Akihabara Building 2,600 2,522 3,090 3,120 4.0 3,060 3.7 4.1 A 0.6
A-93 KDX Iidabashi Square 4,350 4,895 6,010 6,140 4.0 5,960 3.8 4.2 B 1.0
A-94 KDX Musashi-Kosugi Building 12,000 11,143 15,800 15,900 4.1 15,700 3.8 4.2 A 2.8
A-95 KDX Toyosu Grand Square 8,666 8,042 9,540 9,780 4.6 9,430 4.4 4.8 B 2.0
A-96 KDX Takadanobaba Building 3,650 3,639 4,350 4,390 4.4 4,330 4.1 4.6 B 0.8
A-99 KDX Ikebukuro West Building 1,934 2,054 2,090 2,140 4.3 2,070 4.1 4.5 B 0.4
A-101 KDX Yokohama Building 7,210 7,522 8,790 9,150 4.4 8,640 4.2 4.6 B 1.7
A-102 KDX Yokohama Nishiguchi Building 2,750 2,710 3,150 3,210 4.5 3,130 4.3 4.7 B 0.6
A-107 KDX Ginza East Building 3,600 3,648 3,830 3,850 4.1 3,800 3.8 4.2 A 0.8
A-108 Pentel Building 3,350 3,560 3,874 3,978 3.9 3,822 3.7 4.1 B 0.7
A-109 KDX Hamamatsucho Center Building 3,950 4,026 4,330 4,500 3.8 4,250 3.6 4.0 B 0.9
A-112 KDX Toranomon 1Chome Building 15,550 15,481 17,800 17,900 3.4 17,600 3.1 3.5 A 3.6
A-113 KDX Shin-Nihonbashi Ekimae Building
3,829 3,943 4,110 4,150 3.8 4,070 3.5 3.9 A 0.9
A-114 KDX Nihonbashi Edo-dori Building 1,350 1,387 1,480 1,500 4.2 1,450 3.9 4.3 A 0.3
A-115 ARK Mori Building 4,169 4,185 4,430 4,600 3.7 4,360 3.5 3.9 B 0.9
A-116 KDX Nishi-Shinbashi Building 8,400 8,520 9,090 9,380 3.5 8,970 3.3 3.7 B 1.9
A-117 BR Gotanda 2,200 2,303 2,450 2,490 4.3 2,410 3.9 4.5 A 0.5
A-119 KDX Shibuya Nanpeidai Building 3,500 3,568 3,710 3,880 3.6 3,630 3.2 3.8 B 0.8
A-120 KDX Yoyogi Building 2,479 2,435 2,250 2,250 4.6 2,250 4.1 4.7 A 0.5
A-121 Ginza 4chome Tower 9,800 9,533 13,600 13,700 3.3 13,500 3.0 3.4 A 2.3
A-122 Mitsubishijuko Yokohama Building 14,720 14,746 14,900 15,200 4.0 14,800 3.5 4.2 B 3.4
A-123 JN Building 9,500 9,818 9,860 10,200 4.2 9,720 4.0 4.4 B 2.2
A-124 CROSS PLACE Hamamatsucho 20,700 20,790 22,400 23,000 3.5 22,200 3.3 3.7 B 4.9
Other
Regional
Areas
A-12 Portus Center Building 5,570 3,965 5,090 5,150 5.6 5,070 5.4 5.8 B 1.3
A-42 KDX Karasuma Building 5,400 5,094 5,500 5,650 4.8 5,440 4.6 5.0 B 1.2
A-44 KDX Sendai Building 2,100 1,938 1,900 1,910 5.4 1,900 5.4 5.6 B 0.4
A-53 KDX Hakata-Minami Building 4,900 4,472 4,500 4,530 5.8 4,460 5.5 5.9 A 1.1
A-54 KDX Kitahama Building 2,220 2,049 1,640 1,640 5.2 1,630 4.7 5.3 A 0.5
A-58 KDX Nagoya Sakae Building 7,550 6,596 5,290 5,420 4.5 5,240 4.3 4.7 B 1.7
A-69 KDX Kobayashi-Doshomachi Building 2,870 2,070 2,700 2,760 7.3 2,640 4.4 9.3 A 0.6
A-70 KDX Sapporo Building 2,005 1,919 2,590 2,710 4.9 2,540 4.7 5.1 B 0.4
A-79 KDX Nagoya Ekimae Building 7,327 7,972 9,690 9,770 4.1 9,610 3.8 4.2 A 1.7
A-82 KDX Higashi Umeda Building 2,770 2,431 3,660 3,740 4.4 3,630 4.2 4.6 B 0.6
A-97 KDX Utsunomiya Building 2,350 2,243 2,520 2,510 5.7 2,520 5.5 5.9 B 0.5
A-98 KDX Hiroshima Building 1,300 1,382 1,680 1,680 5.4 1,670 5.1 5.5 A 0.3
A-100 Senri Life Science Center Building 13,000 12,687 13,500 13,800 4.6 13,400 4.4 4.8 B 3.0
A-104 KDX Minami-Honmachi Building 2,200 2,042 3,040 3,060 4.4 3,010 4.1 4.5 A 0.5
A-106 KDX Sakura-dori Building 5,900 6,191 8,290 8,420 4.6 8,240 4.4 4.8 B 1.4
A-110 KDX Shin-Osaka Building 4,550 4,553 5,100 5,270 4.1 5,020 3.9 4.3 B 1.0
A-111 KDX Nagoya Nichigin-mae Building 3,500 3,487 4,200 4,230 4.2 4,160 3.9 4.3 A 0.8
A-118 KDX Sapporo Kitaguchi Building 1,800 1,805 2,060 2,160 4.8 2,010 4.6 5.0 B 0.4
Subtotal of Office Buildings (95 properties) 412,955 401,378 456,954 464,768 - 452,532 - - - 98.1
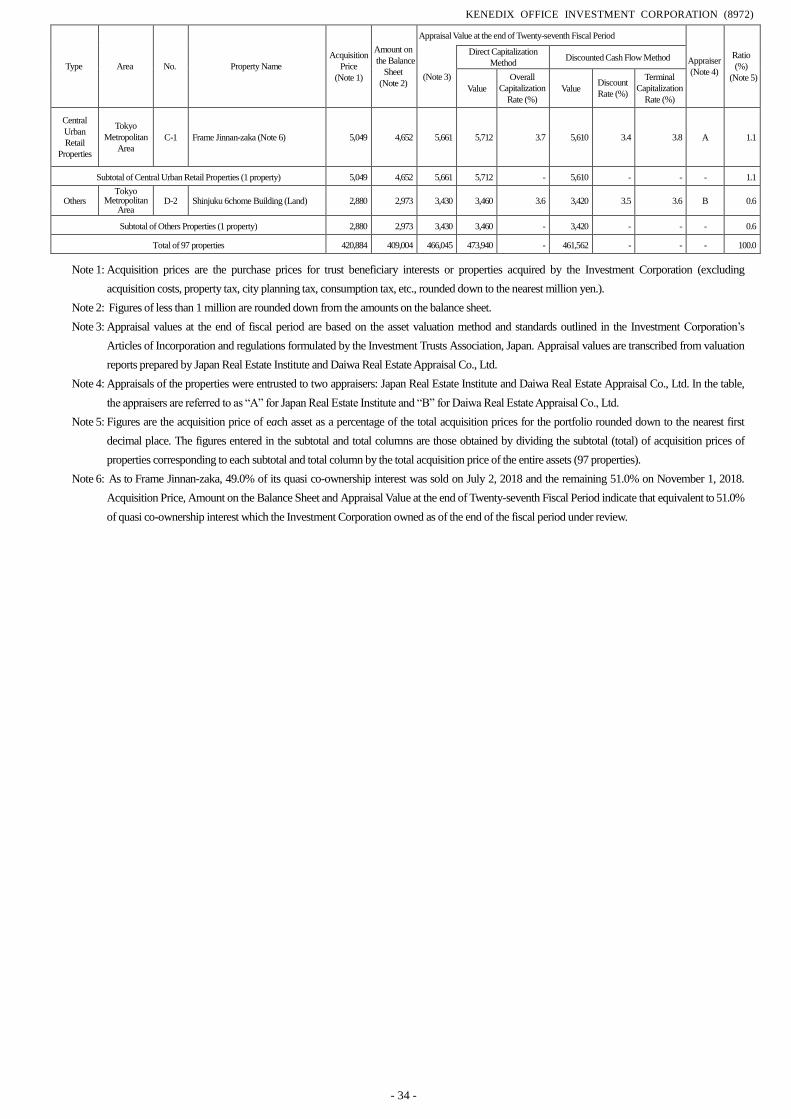
KENEDIX OFFICE INVESTMENT CORPORATION (8972)
- 34 -
Type Area No. Property Name
Acquisition
Price
(Note 1)
Amount on
the Balance
Sheet
(Note 2)
Appraisal Value at the end of Twenty-seventh Fiscal Period
Appraiser
(Note 4)
Ratio
(%)
(Note 5) (Note 3)
Direct Capitalization
Method Discounted Cash Flow Method
Value
Overall
Capitalization
Rate (%)
Value Discount
Rate (%)
Terminal
Capitalization
Rate (%)
Central
Urban
Retail
Properties
Tokyo
Metropolitan
Area
C-1 Frame Jinnan-zaka (Note 6) 5,049 4,652 5,661 5,712 3.7 5,610 3.4 3.8 A 1.1
Subtotal of Central Urban Retail Properties (1 property) 5,049 4,652 5,661 5,712 - 5,610 - - - 1.1
Others Tokyo
Metropolitan Area
D-2 Shinjuku 6chome Building (Land) 2,880 2,973 3,430 3,460 3.6 3,420 3.5 3.6 B 0.6
Subtotal of Others Properties (1 property) 2,880 2,973 3,430 3,460 - 3,420 - - - 0.6
Total of 97 properties 420,884 409,004 466,045 473,940 - 461,562 - - - 100.0
Note 1: Acquisition prices are the purchase prices for trust beneficiary interests or properties acquired by the Investment Corporation (excluding
acquisition costs, property tax, city planning tax, consumption tax, etc., rounded down to the nearest million yen.).
Note 2: Figures of less than 1 million are rounded down from the amounts on the balance sheet.
Note 3: Appraisal values at the end of fiscal period are based on the asset valuation method and standards outlined in the Investment Corporation’s
Articles of Incorporation and regulations formulated by the Investment Trusts Association, Japan. Appraisal values are transcribed from valuation
reports prepared by Japan Real Estate Institute and Daiwa Real Estate Appraisal Co., Ltd.
Note 4: Appraisals of the properties were entrusted to two appraisers: Japan Real Estate Institute and Daiwa Real Estate Appraisal Co., Ltd. In the table,
the appraisers are referred to as “A” for Japan Real Estate Institute and “B” for Daiwa Real Estate Appraisal Co., Ltd.
Note 5: Figures are the acquisition price of each asset as a percentage of the total acquisition prices for the portfolio rounded down to the nearest first
decimal place. The figures entered in the subtotal and total columns are those obtained by dividing the subtotal (total) of acquisition prices of
properties corresponding to each subtotal and total column by the total acquisition price of the entire assets (97 properties).
Note 6: As to Frame Jinnan-zaka, 49.0% of its quasi co-ownership interest was sold on July 2, 2018 and the remaining 51.0% on November 1, 2018.
Acquisition Price, Amount on the Balance Sheet and Appraisal Value at the end of Twenty-seventh Fiscal Period indicate that equivalent to 51.0%
of quasi co-ownership interest which the Investment Corporation owned as of the end of the fiscal period under review.
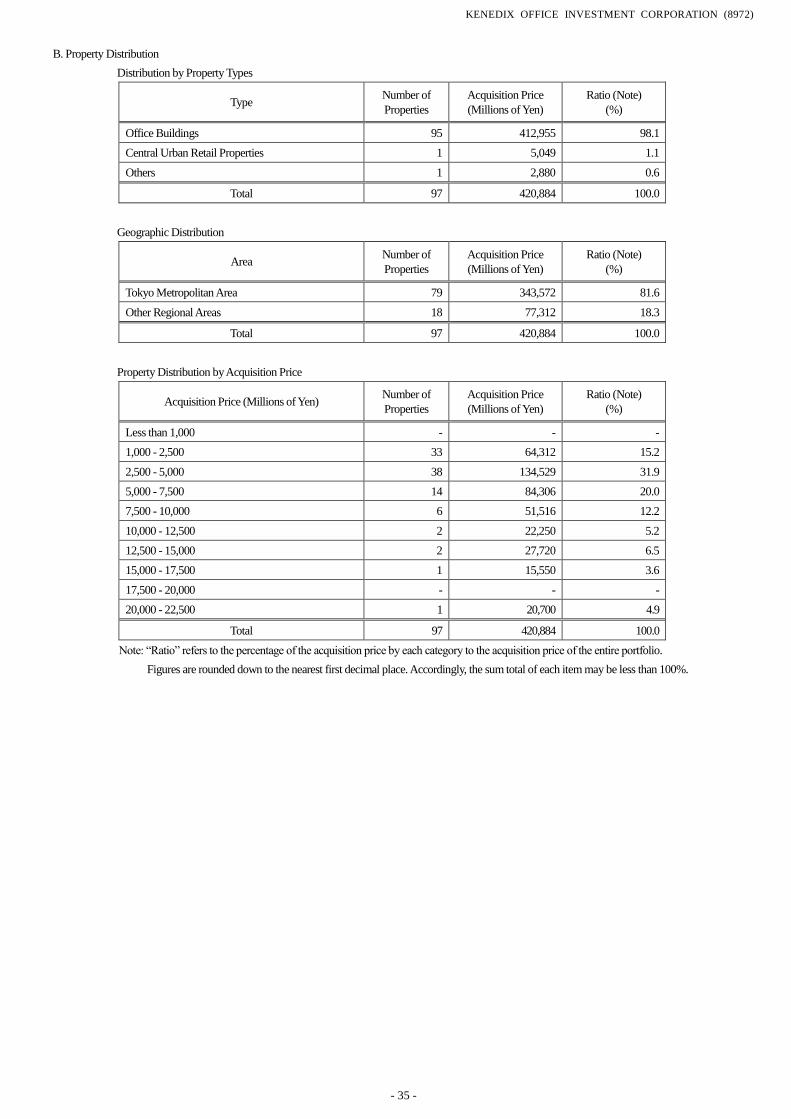
KENEDIX OFFICE INVESTMENT CORPORATION (8972)
- 35 -
B. Property Distribution
Distribution by Property Types
Type Number of
Properties
Acquisition Price
(Millions of Yen)
Ratio (Note)
(%)
Office Buildings 95 412,955 98.1
Central Urban Retail Properties 1 5,049 1.1
Others 1 2,880 0.6
Total 97 420,884 100.0
Geographic Distribution
Area Number of
Properties
Acquisition Price
(Millions of Yen)
Ratio (Note)
(%)
Tokyo Metropolitan Area 79 343,572 81.6
Other Regional Areas 18 77,312 18.3
Total 97 420,884 100.0
Property Distribution by Acquisition Price
Acquisition Price (Millions of Yen) Number of
Properties
Acquisition Price
(Millions of Yen)
Ratio (Note)
(%)
Less than 1,000 - - -
1,000 - 2,500 33 64,312 15.2
2,500 - 5,000 38 134,529 31.9
5,000 - 7,500 14 84,306 20.0
7,500 - 10,000 6 51,516 12.2
10,000 - 12,500 2 22,250 5.2
12,500 - 15,000 2 27,720 6.5
15,000 - 17,500 1 15,550 3.6
17,500 - 20,000 - - -
20,000 - 22,500 1 20,700 4.9
Total 97 420,884 100.0
Note: “Ratio” refers to the percentage of the acquisition price by each category to the acquisition price of the entire portfolio.
Figures are rounded down to the nearest first decimal place. Accordingly, the sum total of each item may be less than 100%.
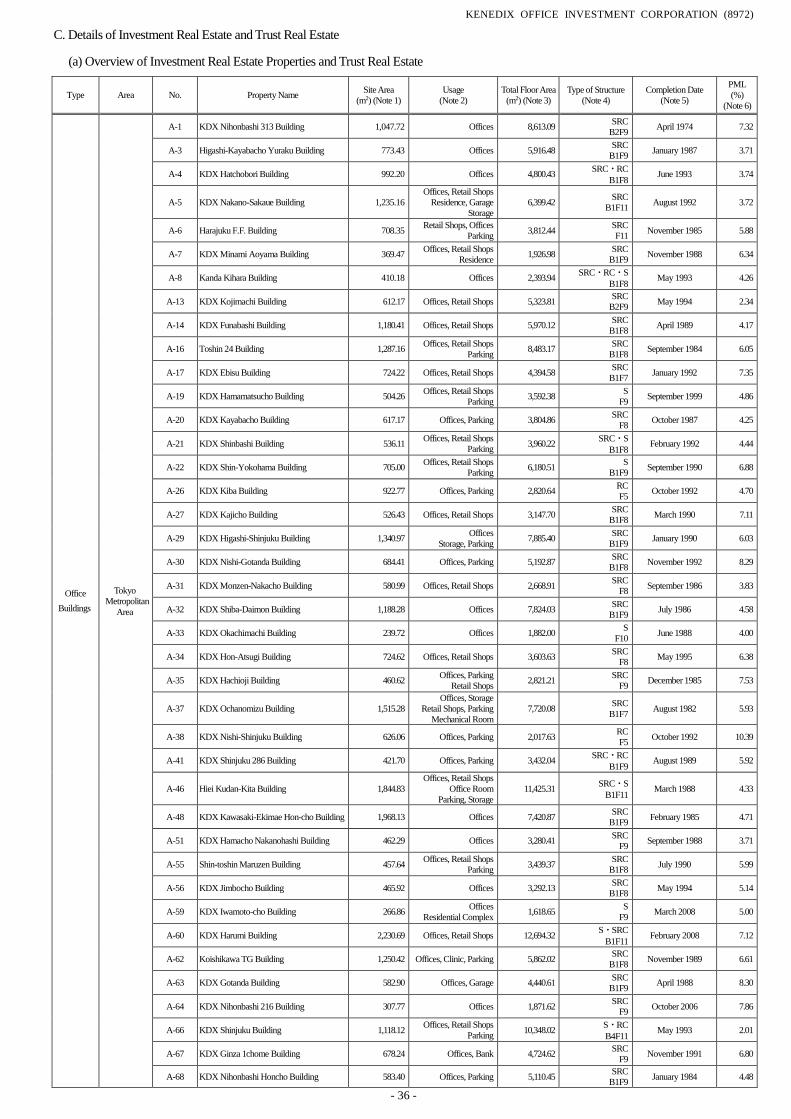
KENEDIX OFFICE INVESTMENT CORPORATION (8972)
- 36 -
C. Details of Investment Real Estate and Trust Real Estate
(a) Overview of Investment Real Estate Properties and Trust Real Estate
Type Area No. Property Name Site Area
(m2) (Note 1)
Usage
(Note 2)
Total Floor Area
(m2) (Note 3)
Type of Structure
(Note 4)
Completion Date
(Note 5)
PML
(%)
(Note 6)
Office
Buildings
Tokyo
Metropolitan
Area
A-1 KDX Nihonbashi 313 Building 1,047.72 Offices 8,613.09 SRC
B2F9 April 1974 7.32
A-3 Higashi-Kayabacho Yuraku Building 773.43 Offices 5,916.48 SRC
B1F9 January 1987 3.71
A-4 KDX Hatchobori Building 992.20 Offices 4,800.43 SRC・RC
B1F8 June 1993 3.74
A-5 KDX Nakano-Sakaue Building 1,235.16
Offices, Retail Shops
Residence, Garage
Storage
6,399.42 SRC
B1F11 August 1992 3.72
A-6 Harajuku F.F. Building 708.35 Retail Shops, Offices
Parking 3,812.44
SRC
F11 November 1985 5.88
A-7 KDX Minami Aoyama Building 369.47 Offices, Retail Shops
Residence 1,926.98
SRC
B1F9 November 1988 6.34
A-8 Kanda Kihara Building 410.18 Offices 2,393.94 SRC・RC・S
B1F8 May 1993 4.26
A-13 KDX Kojimachi Building 612.17 Offices, Retail Shops 5,323.81 SRC
B2F9 May 1994 2.34
A-14 KDX Funabashi Building 1,180.41 Offices, Retail Shops 5,970.12 SRC
B1F8 April 1989 4.17
A-16 Toshin 24 Building 1,287.16 Offices, Retail Shops
Parking 8,483.17
SRC
B1F8 September 1984 6.05
A-17 KDX Ebisu Building 724.22 Offices, Retail Shops 4,394.58 SRC
B1F7 January 1992 7.35
A-19 KDX Hamamatsucho Building 504.26 Offices, Retail Shops
Parking 3,592.38
S
F9 September 1999 4.86
A-20 KDX Kayabacho Building 617.17 Offices, Parking 3,804.86 SRC
F8 October 1987 4.25
A-21 KDX Shinbashi Building 536.11 Offices, Retail Shops
Parking 3,960.22
SRC・S
B1F8 February 1992 4.44
A-22 KDX Shin-Yokohama Building 705.00 Offices, Retail Shops
Parking 6,180.51
S
B1F9 September 1990 6.88
A-26 KDX Kiba Building 922.77 Offices, Parking 2,820.64 RC
F5 October 1992 4.70
A-27 KDX Kajicho Building 526.43 Offices, Retail Shops 3,147.70 SRC
B1F8 March 1990 7.11
A-29 KDX Higashi-Shinjuku Building 1,340.97 Offices
Storage, Parking 7,885.40
SRC
B1F9 January 1990 6.03
A-30 KDX Nishi-Gotanda Building 684.41 Offices, Parking 5,192.87 SRC
B1F8 November 1992 8.29
A-31 KDX Monzen-Nakacho Building 580.99 Offices, Retail Shops 2,668.91 SRC
F8 September 1986 3.83
A-32 KDX Shiba-Daimon Building 1,188.28 Offices 7,824.03 SRC
B1F9 July 1986 4.58
A-33 KDX Okachimachi Building 239.72 Offices 1,882.00 S
F10 June 1988 4.00
A-34 KDX Hon-Atsugi Building 724.62 Offices, Retail Shops 3,603.63 SRC
F8 May 1995 6.38
A-35 KDX Hachioji Building 460.62 Offices, Parking
Retail Shops 2,821.21
SRC
F9 December 1985 7.53
A-37 KDX Ochanomizu Building 1,515.28
Offices, Storage
Retail Shops, Parking
Mechanical Room
7,720.08 SRC
B1F7 August 1982 5.93
A-38 KDX Nishi-Shinjuku Building 626.06 Offices, Parking 2,017.63 RC
F5 October 1992 10.39
A-41 KDX Shinjuku 286 Building 421.70 Offices, Parking 3,432.04 SRC・RC
B1F9 August 1989 5.92
A-46 Hiei Kudan-Kita Building 1,844.83
Offices, Retail Shops
Office Room
Parking, Storage
11,425.31 SRC・S
B1F11 March 1988 4.33
A-48 KDX Kawasaki-Ekimae Hon-cho Building 1,968.13 Offices 7,420.87 SRC
B1F9 February 1985 4.71
A-51 KDX Hamacho Nakanohashi Building 462.29 Offices 3,280.41 SRC
F9 September 1988 3.71
A-55 Shin-toshin Maruzen Building 457.64 Offices, Retail Shops
Parking 3,439.37
SRC
B1F8 July 1990 5.99
A-56 KDX Jimbocho Building 465.92 Offices 3,292.13 SRC
B1F8 May 1994 5.14
A-59 KDX Iwamoto-cho Building 266.86 Offices
Residential Complex 1,618.65
S
F9 March 2008 5.00
A-60 KDX Harumi Building 2,230.69 Offices, Retail Shops 12,694.32 S・SRC
B1F11 February 2008 7.12
A-62 Koishikawa TG Building 1,250.42 Offices, Clinic, Parking 5,862.02 SRC
B1F8 November 1989 6.61
A-63 KDX Gotanda Building 582.90 Offices, Garage 4,440.61 SRC
B1F9 April 1988 8.30
A-64 KDX Nihonbashi 216 Building 307.77 Offices 1,871.62 SRC
F9 October 2006 7.86
A-66 KDX Shinjuku Building 1,118.12 Offices, Retail Shops
Parking 10,348.02
S・RC
B4F11 May 1993 2.01
A-67 KDX Ginza 1chome Building 678.24 Offices, Bank 4,724.62 SRC
F9 November 1991 6.80
A-68 KDX Nihonbashi Honcho Building 583.40 Offices, Parking 5,110.45 SRC
B1F9 January 1984 4.48
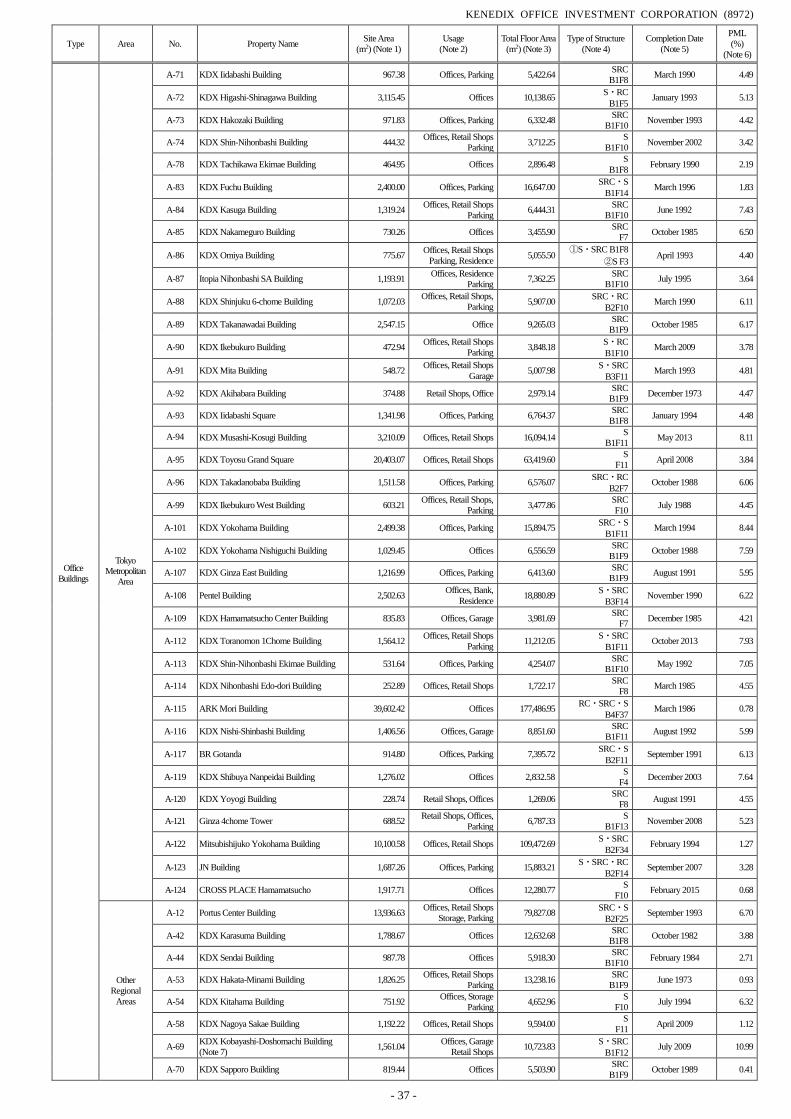
KENEDIX OFFICE INVESTMENT CORPORATION (8972)
- 37 -
Type Area No. Property Name Site Area
(m2) (Note 1)
Usage
(Note 2)
Total Floor Area
(m2) (Note 3)
Type of Structure
(Note 4)
Completion Date
(Note 5)
PML
(%)
(Note 6)
A-71 KDX Iidabashi Building 967.38 Offices, Parking 5,422.64 SRC
B1F8 March 1990 4.49
A-72 KDX Higashi-Shinagawa Building 3,115.45 Offices 10,138.65 S・RC
B1F5 January 1993 5.13
A-73 KDX Hakozaki Building 971.83 Offices, Parking 6,332.48 SRC
B1F10 November 1993 4.42
A-74 KDX Shin-Nihonbashi Building 444.32 Offices, Retail Shops
Parking 3,712.25
S
B1F10 November 2002 3.42
A-78 KDX Tachikawa Ekimae Building 464.95 Offices 2,896.48 S
B1F8 February 1990 2.19
A-83 KDX Fuchu Building 2,400.00 Offices, Parking 16,647.00 SRC・S
B1F14 March 1996 1.83
A-84 KDX Kasuga Building 1,319.24 Offices, Retail Shops
Parking 6,444.31
SRC
B1F10 June 1992 7.43
A-85 KDX Nakameguro Building 730.26 Offices 3,455.90 SRC
F7 October 1985 6.50
A-86 KDX Omiya Building 775.67 Offices, Retail Shops
Parking, Residence 5,055.50
①S・SRC B1F8
②S F3 April 1993 4.40
A-87 Itopia Nihonbashi SA Building 1,193.91 Offices, Residence
Parking 7,362.25
SRC
B1F10 July 1995 3.64
A-88 KDX Shinjuku 6-chome Building 1,072.03 Offices, Retail Shops,
Parking 5,907.00
SRC・RC
B2F10 March 1990 6.11
A-89 KDX Takanawadai Building 2,547.15 Office 9,265.03 SRC
B1F9 October 1985 6.17
A-90 KDX Ikebukuro Building 472.94 Offices, Retail Shops
Parking 3,848.18
S・RC
B1F10 March 2009 3.78
A-91 KDX Mita Building 548.72 Offices, Retail Shops
Garage 5,007.98
S・SRC
B3F11 March 1993 4.81
A-92 KDX Akihabara Building 374.88 Retail Shops, Office 2,979.14 SRC
B1F9 December 1973 4.47
A-93 KDX Iidabashi Square 1,341.98 Offices, Parking 6,764.37 SRC
B1F8 January 1994 4.48
A-94 KDX Musashi-Kosugi Building 3,210.09 Offices, Retail Shops 16,094.14 S
B1F11 May 2013 8.11
A-95 KDX Toyosu Grand Square 20,403.07 Offices, Retail Shops 63,419.60 S
F11 April 2008 3.84
A-96 KDX Takadanobaba Building 1,511.58 Offices, Parking 6,576.07 SRC・RC
B2F7 October 1988 6.06
A-99 KDX Ikebukuro West Building 603.21 Offices, Retail Shops,
Parking 3,477.86
SRC
F10 July 1988 4.45
A-101 KDX Yokohama Building 2,499.38 Offices, Parking 15,894.75 SRC・S
B1F11 March 1994 8.44
A-102 KDX Yokohama Nishiguchi Building 1,029.45 Offices 6,556.59 SRC
B1F9 October 1988 7.59
A-107 KDX Ginza East Building 1,216.99 Offices, Parking 6,413.60 SRC
B1F9 August 1991 5.95
A-108 Pentel Building 2,502.63 Offices, Bank,
Residence 18,880.89
S・SRC
B3F14 November 1990 6.22
A-109 KDX Hamamatsucho Center Building 835.83 Offices, Garage 3,981.69 SRC
F7 December 1985 4.21
A-112 KDX Toranomon 1Chome Building 1,564.12 Offices, Retail Shops
Parking 11,212.05
S・SRC
B1F11 October 2013 7.93
A-113 KDX Shin-Nihonbashi Ekimae Building 531.64 Offices, Parking 4,254.07 SRC
B1F10 May 1992 7.05
A-114 KDX Nihonbashi Edo-dori Building 252.89 Offices, Retail Shops 1,722.17 SRC
F8 March 1985 4.55
A-115 ARK Mori Building 39,602.42 Offices 177,486.95 RC・SRC・S
B4F37 March 1986 0.78
A-116 KDX Nishi-Shinbashi Building 1,406.56 Offices, Garage 8,851.60 SRC
B1F11 August 1992 5.99
A-117 BR Gotanda 914.80 Offices, Parking 7,395.72 SRC・S
B2F11 September 1991 6.13
A-119 KDX Shibuya Nanpeidai Building 1,276.02 Offices 2,832.58 S
F4 December 2003 7.64
A-120 KDX Yoyogi Building 228.74 Retail Shops, Offices 1,269.06 SRC
F8 August 1991 4.55
A-121 Ginza 4chome Tower 688.52 Retail Shops, Offices,
Parking 6,787.33
S
B1F13 November 2008 5.23
A-122 Mitsubishijuko Yokohama Building 10,100.58 Offices, Retail Shops 109,472.69 S・SRC
B2F34 February 1994 1.27
A-123 JN Building 1,687.26 Offices, Parking 15,883.21 S・SRC・RC
B2F14 September 2007 3.28
A-124 CROSS PLACE Hamamatsucho 1,917.71 Offices 12,280.77 S
F10 February 2015 0.68
Other
Regional
Areas
A-12 Portus Center Building 13,936.63 Offices, Retail Shops
Storage, Parking 79,827.08
SRC・S
B2F25 September 1993 6.70
A-42 KDX Karasuma Building 1,788.67 Offices 12,632.68 SRC
B1F8 October 1982 3.88
A-44 KDX Sendai Building 987.78 Offices 5,918.30 SRC
B1F10 February 1984 2.71
A-53 KDX Hakata-Minami Building 1,826.25 Offices, Retail Shops
Parking 13,238.16
SRC
B1F9 June 1973 0.93
A-54 KDX Kitahama Building 751.92 Offices, Storage
Parking 4,652.96
S
F10 July 1994 6.32
A-58 KDX Nagoya Sakae Building 1,192.22 Offices, Retail Shops 9,594.00 S
F11 April 2009 1.12
A-69 KDX Kobayashi-Doshomachi Building
(Note 7) 1,561.04
Offices, Garage
Retail Shops 10,723.83
S・SRC
B1F12 July 2009 10.99
A-70 KDX Sapporo Building 819.44 Offices 5,503.90 SRC
B1F9 October 1989 0.41
Tokyo
Metropolitan
Area
Office
Buildings
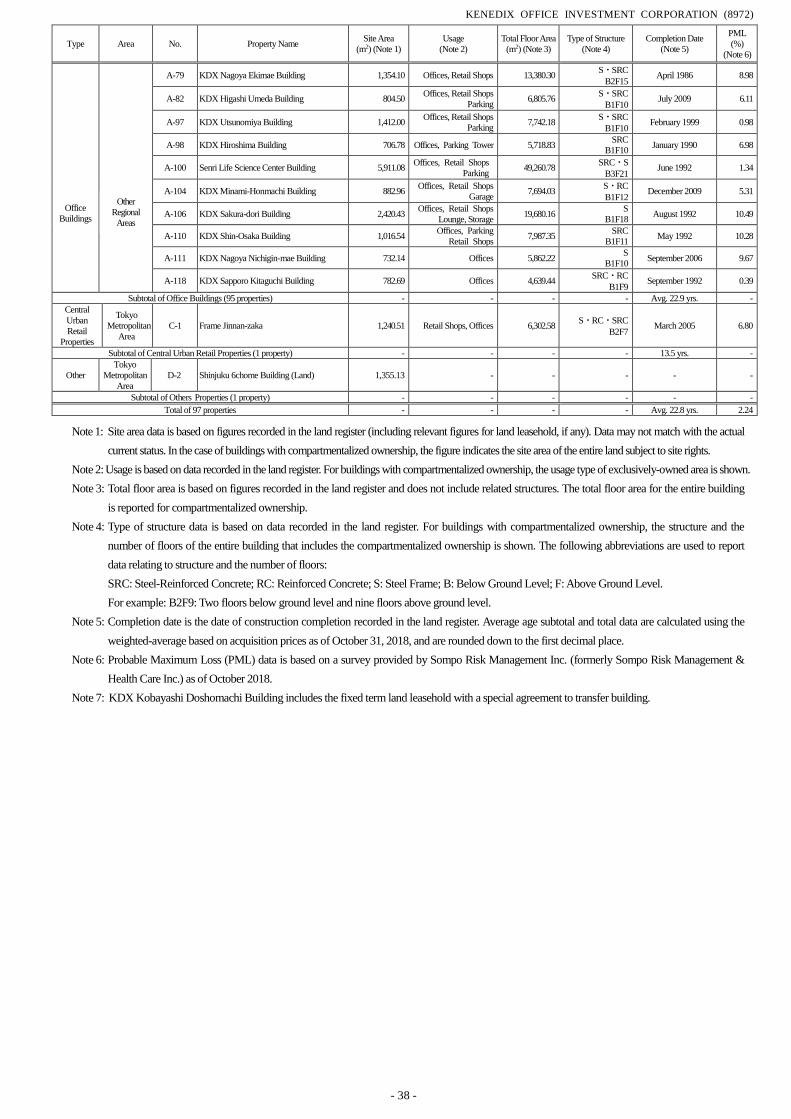
KENEDIX OFFICE INVESTMENT CORPORATION (8972)
- 38 -
Type Area No. Property Name Site Area
(m2) (Note 1)
Usage
(Note 2)
Total Floor Area
(m2) (Note 3)
Type of Structure
(Note 4)
Completion Date
(Note 5)
PML
(%)
(Note 6)
A-79 KDX Nagoya Ekimae Building 1,354.10 Offices, Retail Shops 13,380.30 S・SRC
B2F15 April 1986 8.98
A-82 KDX Higashi Umeda Building 804.50 Offices, Retail Shops
Parking 6,805.76
S・SRC
B1F10 July 2009 6.11
A-97 KDX Utsunomiya Building 1,412.00 Offices, Retail Shops
Parking 7,742.18
S・SRC
B1F10 February 1999 0.98
Office
Buildings
A-98 KDX Hiroshima Building 706.78 Offices, Parking Tower 5,718.83 SRC
B1F10 January 1990 6.98
A-100 Senri Life Science Center Building 5,911.08 Offices, Retail Shops
Parking 49,260.78
SRC・S
B3F21 June 1992 1.34
A-104 KDX Minami-Honmachi Building 882.96 Offices, Retail Shops
Garage 7,694.03
S・RC
B1F12 December 2009 5.31
A-106 KDX Sakura-dori Building 2,420.43 Offices, Retail Shops
Lounge, Storage 19,680.16
S
B1F18 August 1992 10.49
A-110 KDX Shin-Osaka Building 1,016.54 Offices, Parking
Retail Shops 7,987.35
SRC
B1F11 May 1992 10.28
A-111 KDX Nagoya Nichigin-mae Building 732.14 Offices 5,862.22 S
B1F10 September 2006 9.67
A-118 KDX Sapporo Kitaguchi Building 782.69 Offices 4,639.44 SRC・RC
B1F9 September 1992 0.39
Subtotal of Office Buildings (95 properties) - - - - Avg. 22.9 yrs. -
Central
Urban
Retail
Properties
Tokyo
Metropolitan
Area
C-1 Frame Jinnan-zaka 1,240.51 Retail Shops, Offices 6,302.58 S・RC・SRC
B2F7 March 2005 6.80
Subtotal of Central Urban Retail Properties (1 property) - - - - 13.5 yrs. -
Other
Tokyo
Metropolitan
Area
D-2 Shinjuku 6chome Building (Land) 1,355.13 - - - - -
Subtotal of Others Properties (1 property) - - - - - -
Total of 97 properties - - - - Avg. 22.8 yrs. 2.24
Note 1: Site area data is based on figures recorded in the land register (including relevant figures for land leasehold, if any). Data may not match with the actual
current status. In the case of buildings with compartmentalized ownership, the figure indicates the site area of the entire land subject to site rights.
Note 2: Usage is based on data recorded in the land register. For buildings with compartmentalized ownership, the usage type of exclusively-owned area is shown.
Note 3: Total floor area is based on figures recorded in the land register and does not include related structures. The total floor area for the entire building
is reported for compartmentalized ownership.
Note 4: Type of structure data is based on data recorded in the land register. For buildings with compartmentalized ownership, the structure and the
number of floors of the entire building that includes the compartmentalized ownership is shown. The following abbreviations are used to report
data relating to structure and the number of floors:
SRC: Steel-Reinforced Concrete; RC: Reinforced Concrete; S: Steel Frame; B: Below Ground Level; F: Above Ground Level.
For example: B2F9: Two floors below ground level and nine floors above ground level.
Note 5: Completion date is the date of construction completion recorded in the land register. Average age subtotal and total data are calculated using the
weighted-average based on acquisition prices as of October 31, 2018, and are rounded down to the first decimal place.
Note 6: Probable Maximum Loss (PML) data is based on a survey provided by Sompo Risk Management Inc. (formerly Sompo Risk Management &
Health Care Inc.) as of October 2018.
Note 7: KDX Kobayashi Doshomachi Building includes the fixed term land leasehold with a special agreement to transfer building.
Other
Regional
Areas
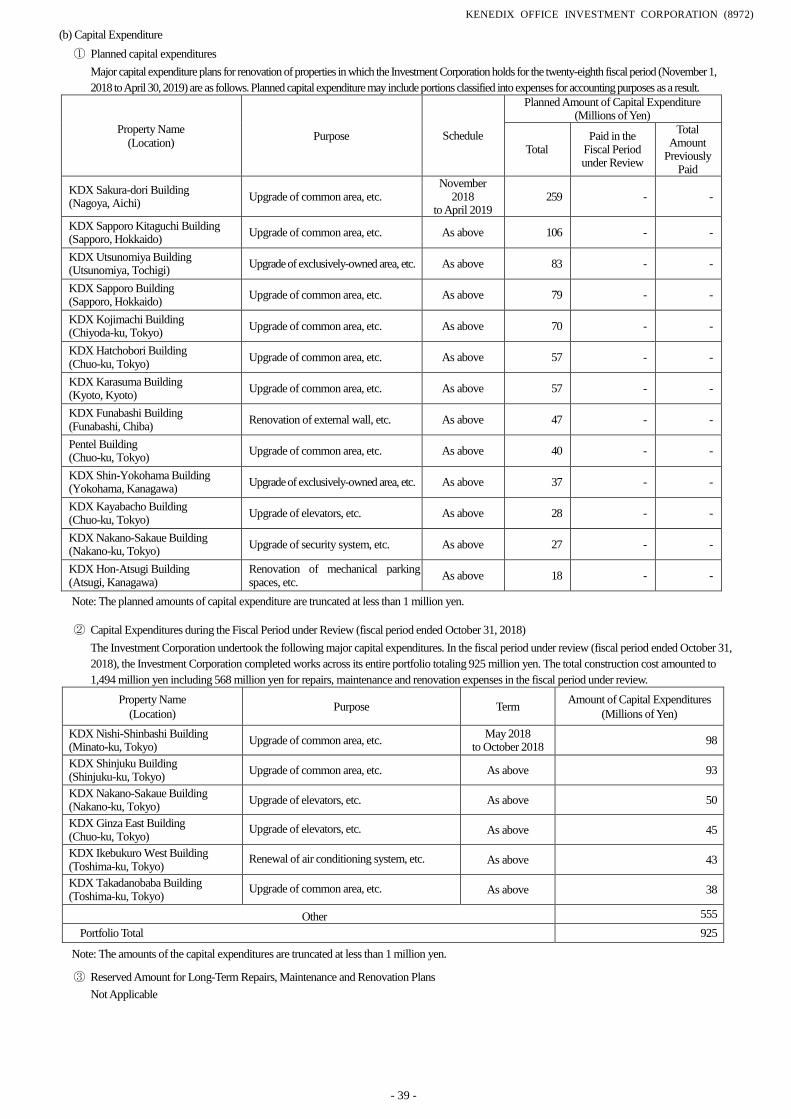
KENEDIX OFFICE INVESTMENT CORPORATION (8972)
- 39 -
(b) Capital Expenditure
① Planned capital expenditures
Major capital expenditure plans for renovation of properties in which the Investment Corporation holds for the twenty-eighth fiscal period (November 1,
2018 to April 30, 2019) are as follows. Planned capital expenditure may include portions classified into expenses for accounting purposes as a result.
Property Name
(Location) Purpose Schedule
Planned Amount of Capital Expenditure (Millions of Yen)
Total Paid in the
Fiscal Period under Review
Total Amount
Previously Paid
KDX Sakura-dori Building (Nagoya, Aichi)
Upgrade of common area, etc. November
2018 to April 2019
259 - -
KDX Sapporo Kitaguchi Building (Sapporo, Hokkaido)
Upgrade of common area, etc. As above 106 - -
KDX Utsunomiya Building (Utsunomiya, Tochigi)
Upgrade of exclusively-owned area, etc. As above 83 - -
KDX Sapporo Building (Sapporo, Hokkaido)
Upgrade of common area, etc. As above 79 - -
KDX Kojimachi Building (Chiyoda-ku, Tokyo)
Upgrade of common area, etc. As above 70 - -
KDX Hatchobori Building (Chuo-ku, Tokyo)
Upgrade of common area, etc. As above 57 - -
KDX Karasuma Building (Kyoto, Kyoto)
Upgrade of common area, etc. As above 57 - -
KDX Funabashi Building (Funabashi, Chiba)
Renovation of external wall, etc. As above 47 - -
Pentel Building (Chuo-ku, Tokyo)
Upgrade of common area, etc. As above 40 - -
KDX Shin-Yokohama Building (Yokohama, Kanagawa)
Upgrade of exclusively-owned area, etc. As above 37 - -
KDX Kayabacho Building (Chuo-ku, Tokyo)
Upgrade of elevators, etc. As above 28 - -
KDX Nakano-Sakaue Building (Nakano-ku, Tokyo)
Upgrade of security system, etc. As above 27 - -
KDX Hon-Atsugi Building (Atsugi, Kanagawa)
Renovation of mechanical parking spaces, etc.
As above 18 - -
Note: The planned amounts of capital expenditure are truncated at less than 1 million yen.
② Capital Expenditures during the Fiscal Period under Review (fiscal period ended October 31, 2018)
The Investment Corporation undertook the following major capital expenditures. In the fiscal period under review (fiscal period ended October 31,
2018), the Investment Corporation completed works across its entire portfolio totaling 925 million yen. The total construction cost amounted to
1,494 million yen including 568 million yen for repairs, maintenance and renovation expenses in the fiscal period under review.
Property Name
(Location) Purpose Term
Amount of Capital Expenditures
(Millions of Yen)
KDX Nishi-Shinbashi Building (Minato-ku, Tokyo)
Upgrade of common area, etc. May 2018
to October 2018 98
KDX Shinjuku Building (Shinjuku-ku, Tokyo)
Upgrade of common area, etc. As above 93
KDX Nakano-Sakaue Building (Nakano-ku, Tokyo)
Upgrade of elevators, etc. As above 50
KDX Ginza East Building (Chuo-ku, Tokyo)
Upgrade of elevators, etc. As above 45
KDX Ikebukuro West Building (Toshima-ku, Tokyo)
Renewal of air conditioning system, etc. As above 43
KDX Takadanobaba Building (Toshima-ku, Tokyo)
Upgrade of common area, etc. As above 38
Other 555
Portfolio Total 925
Note: The amounts of the capital expenditures are truncated at less than 1 million yen.
③ Reserved Amount for Long-Term Repairs, Maintenance and Renovation Plans
Not Applicable
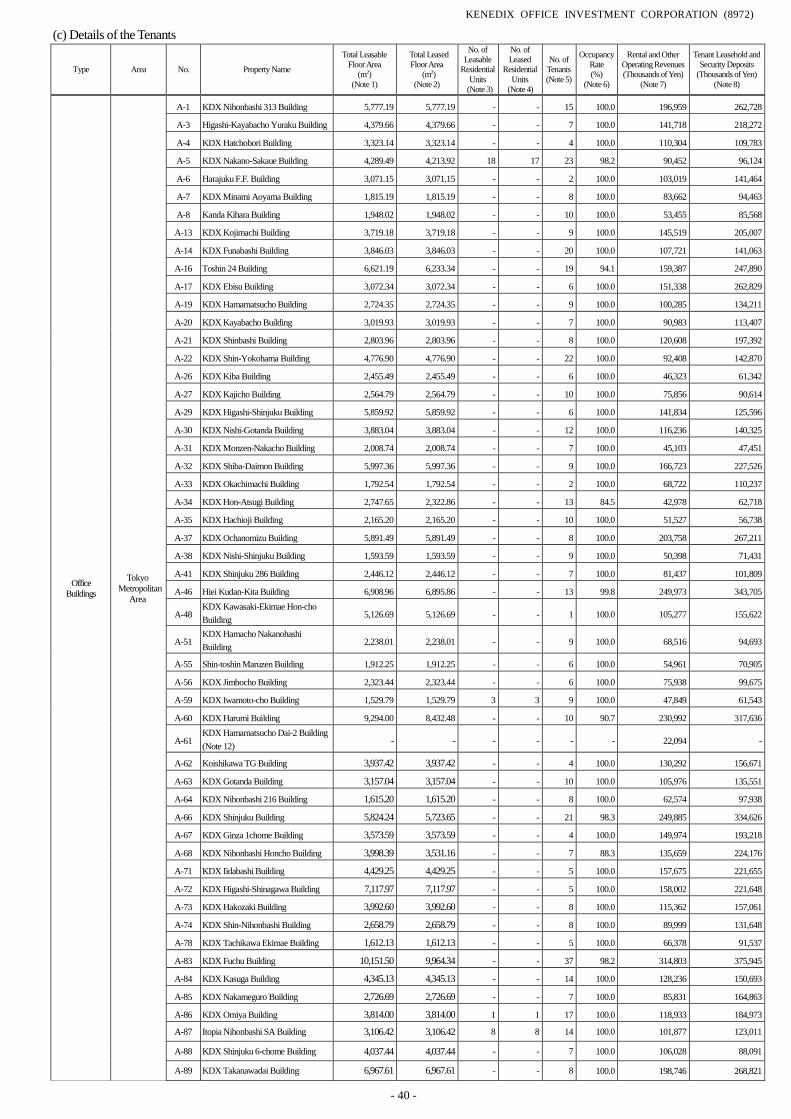
KENEDIX OFFICE INVESTMENT CORPORATION (8972)
- 40 -
(c) Details of the Tenants
Type Area No. Property Name
Total Leasable
Floor Area
(m2)
(Note 1)
Total Leased
Floor Area
(m2)
(Note 2)
No. of
Leasable
Residential
Units
(Note 3)
No. of
Leased
Residential
Units
(Note 4)
No. of
Tenants
(Note 5)
Occupancy
Rate
(%)
(Note 6)
Rental and Other
Operating Revenues
(Thousands of Yen)
(Note 7)
Tenant Leasehold and
Security Deposits
(Thousands of Yen)
(Note 8)
Office
Buildings
Tokyo
Metropolitan
Area
A-1 KDX Nihonbashi 313 Building 5,777.19 5,777.19 - - 15 100.0 196,959 262,728
A-3 Higashi-Kayabacho Yuraku Building 4,379.66 4,379.66 - - 7 100.0 141,718 218,272
A-4 KDX Hatchobori Building 3,323.14 3,323.14 - - 4 100.0 110,304 109,783
A-5 KDX Nakano-Sakaue Building 4,289.49 4,213.92 18 17 23 98.2 90,452 96,124
A-6 Harajuku F.F. Building 3,071.15 3,071.15 - - 2 100.0 103,019 141,464
A-7 KDX Minami Aoyama Building 1,815.19 1,815.19 - - 8 100.0 83,662 94,463
A-8 Kanda Kihara Building 1,948.02 1,948.02 - - 10 100.0 53,455 85,568
A-13 KDX Kojimachi Building 3,719.18 3,719.18 - - 9 100.0 145,519 205,007
A-14 KDX Funabashi Building 3,846.03 3,846.03 - - 20 100.0 107,721 141,063
A-16 Toshin 24 Building 6,621.19 6,233.34 - - 19 94.1 159,387 247,890
A-17 KDX Ebisu Building 3,072.34 3,072.34 - - 6 100.0 151,338 262,829
A-19 KDX Hamamatsucho Building 2,724.35 2,724.35 - - 9 100.0 100,285 134,211
A-20 KDX Kayabacho Building 3,019.93 3,019.93 - - 7 100.0 90,983 113,407
A-21 KDX Shinbashi Building 2,803.96 2,803.96 - - 8 100.0 120,608 197,392
A-22 KDX Shin-Yokohama Building 4,776.90 4,776.90 - - 22 100.0 92,408 142,870
A-26 KDX Kiba Building 2,455.49 2,455.49 - - 6 100.0 46,323 61,342
A-27 KDX Kajicho Building 2,564.79 2,564.79 - - 10 100.0 75,856 90,614
A-29 KDX Higashi-Shinjuku Building 5,859.92 5,859.92 - - 6 100.0 141,834 125,596
A-30 KDX Nishi-Gotanda Building 3,883.04 3,883.04 - - 12 100.0 116,236 140,325
A-31 KDX Monzen-Nakacho Building 2,008.74 2,008.74 - - 7 100.0 45,103 47,451
A-32 KDX Shiba-Daimon Building 5,997.36 5,997.36 - - 9 100.0 166,723 227,526
A-33 KDX Okachimachi Building 1,792.54 1,792.54 - - 2 100.0 68,722 110,237
A-34 KDX Hon-Atsugi Building 2,747.65 2,322.86 - - 13 84.5 42,978 62,718
A-35 KDX Hachioji Building 2,165.20 2,165.20 - - 10 100.0 51,527 56,738
A-37 KDX Ochanomizu Building 5,891.49 5,891.49 - - 8 100.0 203,758 267,211
A-38 KDX Nishi-Shinjuku Building 1,593.59 1,593.59 - - 9 100.0 50,398 71,431
A-41 KDX Shinjuku 286 Building 2,446.12 2,446.12 - - 7 100.0 81,437 101,809
A-46 Hiei Kudan-Kita Building 6,908.96 6,895.86 - - 13 99.8 249,973 343,705
A-48 KDX Kawasaki-Ekimae Hon-cho
Building 5,126.69 5,126.69 - - 1 100.0 105,277 155,622
A-51 KDX Hamacho Nakanohashi
Building 2,238.01 2,238.01 - - 9 100.0 68,516 94,693
A-55 Shin-toshin Maruzen Building 1,912.25 1,912.25 - - 6 100.0 54,961 70,905
A-56 KDX Jimbocho Building 2,323.44 2,323.44 - - 6 100.0 75,938 99,675
A-59 KDX Iwamoto-cho Building 1,529.79 1,529.79 3 3 9 100.0 47,849 61,543
A-60 KDX Harumi Building 9,294.00 8,432.48 - - 10 90.7 230,992 317,636
A-61 KDX Hamamatsucho Dai-2 Building
(Note 12) - - - - - - 22,094 -
A-62 Koishikawa TG Building 3,937.42 3,937.42 - - 4 100.0 130,292 156,671
A-63 KDX Gotanda Building 3,157.04 3,157.04 - - 10 100.0 105,976 135,551
A-64 KDX Nihonbashi 216 Building 1,615.20 1,615.20 - - 8 100.0 62,574 97,938
A-66 KDX Shinjuku Building 5,824.24 5,723.65 - - 21 98.3 249,885 334,626
A-67 KDX Ginza 1chome Building 3,573.59 3,573.59 - - 4 100.0 149,974 193,218
A-68 KDX Nihonbashi Honcho Building 3,998.39 3,531.16 - - 7 88.3 135,659 224,176
A-71 KDX Iidabashi Building 4,429.25 4,429.25 - - 5 100.0 157,675 221,655
A-72 KDX Higashi-Shinagawa Building 7,117.97 7,117.97 - - 5 100.0 158,002 221,648
A-73 KDX Hakozaki Building 3,992.60 3,992.60 - - 8 100.0 115,362 157,061
A-74 KDX Shin-Nihonbashi Building 2,658.79 2,658.79 - - 8 100.0 89,999 131,648
A-78 KDX Tachikawa Ekimae Building 1,612.13 1,612.13 - - 5 100.0 66,378 91,537
A-83 KDX Fuchu Building 10,151.50 9,964.34 - - 37 98.2 314,803 375,945
A-84 KDX Kasuga Building 4,345.13 4,345.13 - - 14 100.0 128,236 150,693
A-85 KDX Nakameguro Building 2,726.69 2,726.69 - - 7 100.0 85,831 164,863
A-86 KDX Omiya Building 3,814.00 3,814.00 1 1 17 100.0 118,933 184,973
A-87 Itopia Nihonbashi SA Building 3,106.42 3,106.42 8 8 14 100.0 101,877 123,011
A-88 KDX Shinjuku 6-chome Building 4,037.44 4,037.44 - - 7 100.0 106,028 88,091
A-89 KDX Takanawadai Building 6,967.61 6,967.61 - - 8 100.0 198,746 268,821
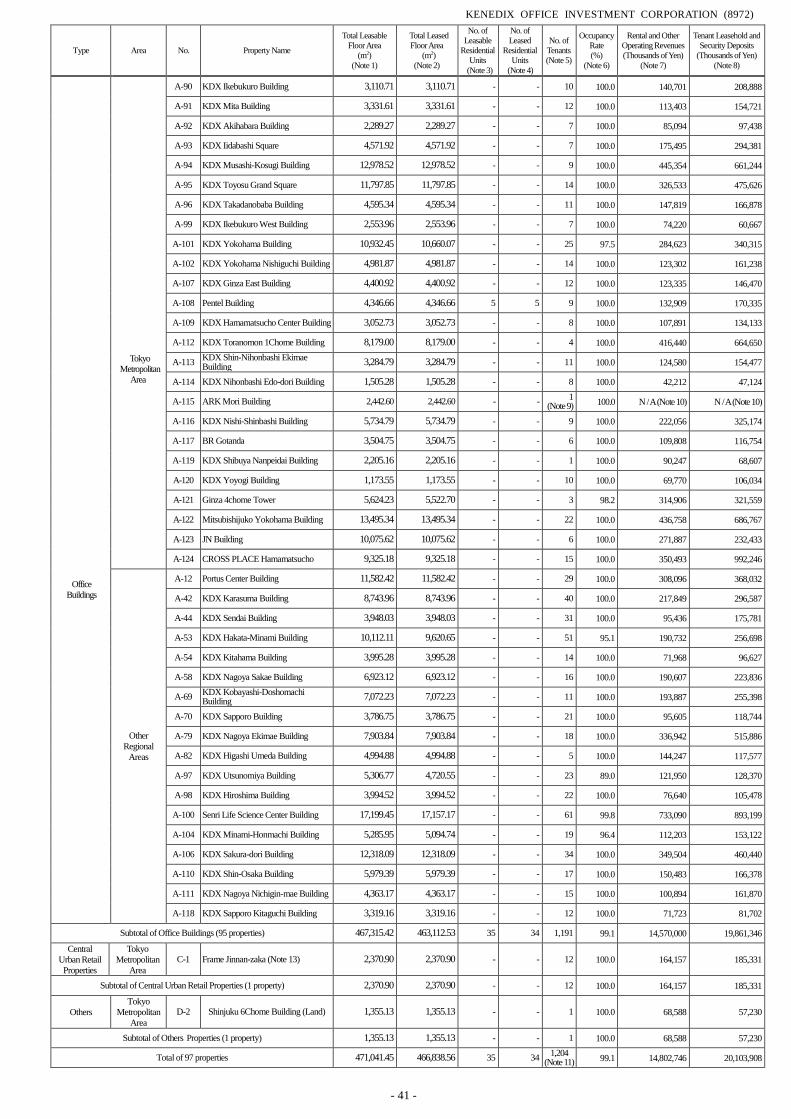
KENEDIX OFFICE INVESTMENT CORPORATION (8972)
- 41 -
Type Area No. Property Name
Total Leasable
Floor Area
(m2)
(Note 1)
Total Leased
Floor Area
(m2)
(Note 2)
No. of
Leasable
Residential
Units
(Note 3)
No. of
Leased
Residential
Units
(Note 4)
No. of
Tenants
(Note 5)
Occupancy
Rate
(%)
(Note 6)
Rental and Other
Operating Revenues
(Thousands of Yen)
(Note 7)
Tenant Leasehold and
Security Deposits
(Thousands of Yen)
(Note 8)
A-90 KDX Ikebukuro Building 3,110.71 3,110.71 - - 10 100.0 140,701 208,888
A-91 KDX Mita Building 3,331.61 3,331.61 - - 12 100.0 113,403 154,721
A-92 KDX Akihabara Building 2,289.27 2,289.27 - - 7 100.0 85,094 97,438
A-93 KDX Iidabashi Square 4,571.92 4,571.92 - - 7 100.0 175,495 294,381
A-94 KDX Musashi-Kosugi Building 12,978.52 12,978.52 - - 9 100.0 445,354 661,244
A-95 KDX Toyosu Grand Square 11,797.85 11,797.85 - - 14 100.0 326,533 475,626
A-96 KDX Takadanobaba Building 4,595.34 4,595.34 - - 11 100.0 147,819 166,878
A-99 KDX Ikebukuro West Building 2,553.96 2,553.96 - - 7 100.0 74,220 60,667
A-101 KDX Yokohama Building 10,932.45 10,660.07 - - 25 97.5 284,623 340,315
A-102 KDX Yokohama Nishiguchi Building 4,981.87 4,981.87 - - 14 100.0 123,302 161,238
A-107 KDX Ginza East Building 4,400.92 4,400.92 - - 12 100.0 123,335 146,470
A-108 Pentel Building 4,346.66 4,346.66 5 5 9 100.0 132,909 170,335
A-109 KDX Hamamatsucho Center Building 3,052.73 3,052.73 - - 8 100.0 107,891 134,133
A-112 KDX Toranomon 1Chome Building 8,179.00 8,179.00 - - 4 100.0 416,440 664,650
A-113 KDX Shin-Nihonbashi Ekimae Building
3,284.79 3,284.79 - - 11 100.0 124,580 154,477
A-114 KDX Nihonbashi Edo-dori Building 1,505.28 1,505.28 - - 8 100.0 42,212 47,124
A-115 ARK Mori Building 2,442.60 2,442.60 - - 1
(Note 9) 100.0 N / A (Note 10) N / A (Note 10)
A-116 KDX Nishi-Shinbashi Building 5,734.79 5,734.79 - - 9 100.0 222,056 325,174
A-117 BR Gotanda 3,504.75 3,504.75 - - 6 100.0 109,808 116,754
A-119 KDX Shibuya Nanpeidai Building 2,205.16 2,205.16 - - 1 100.0 90,247 68,607
A-120 KDX Yoyogi Building 1,173.55 1,173.55 - - 10 100.0 69,770 106,034
A-121 Ginza 4chome Tower 5,624.23 5,522.70 - - 3 98.2 314,906 321,559
A-122 Mitsubishijuko Yokohama Building 13,495.34 13,495.34 - - 22 100.0 436,758 686,767
A-123 JN Building 10,075.62 10,075.62 - - 6 100.0 271,887 232,433
A-124 CROSS PLACE Hamamatsucho 9,325.18 9,325.18 - - 15 100.0 350,493 992,246
Other
Regional
Areas
A-12 Portus Center Building 11,582.42 11,582.42 - - 29 100.0 308,096 368,032
A-42 KDX Karasuma Building 8,743.96 8,743.96 - - 40 100.0 217,849 296,587
A-44 KDX Sendai Building 3,948.03 3,948.03 - - 31 100.0 95,436 175,781
A-53 KDX Hakata-Minami Building 10,112.11 9,620.65 - - 51 95.1 190,732 256,698
A-54 KDX Kitahama Building 3,995.28 3,995.28 - - 14 100.0 71,968 96,627
A-58 KDX Nagoya Sakae Building 6,923.12 6,923.12 - - 16 100.0 190,607 223,836
A-69 KDX Kobayashi-Doshomachi Building
7,072.23 7,072.23 - - 11 100.0 193,887 255,398
A-70 KDX Sapporo Building 3,786.75 3,786.75 - - 21 100.0 95,605 118,744
A-79 KDX Nagoya Ekimae Building 7,903.84 7,903.84 - - 18 100.0 336,942 515,886
A-82 KDX Higashi Umeda Building 4,994.88 4,994.88 - - 5 100.0 144,247 117,577
A-97 KDX Utsunomiya Building 5,306.77 4,720.55 - - 23 89.0 121,950 128,370
A-98 KDX Hiroshima Building 3,994.52 3,994.52 - - 22 100.0 76,640 105,478
A-100 Senri Life Science Center Building 17,199.45 17,157.17 - - 61 99.8 733,090 893,199
A-104 KDX Minami-Honmachi Building 5,285.95 5,094.74 - - 19 96.4 112,203 153,122
A-106 KDX Sakura-dori Building 12,318.09 12,318.09 - - 34 100.0 349,504 460,440
A-110 KDX Shin-Osaka Building 5,979.39 5,979.39 - - 17 100.0 150,483 166,378
A-111 KDX Nagoya Nichigin-mae Building 4,363.17 4,363.17 - - 15 100.0 100,894 161,870
A-118 KDX Sapporo Kitaguchi Building 3,319.16 3,319.16 - - 12 100.0 71,723 81,702
Subtotal of Office Buildings (95 properties) 467,315.42 463,112.53 35 34 1,191 99.1 14,570,000 19,861,346
Central
Urban Retail
Properties
Tokyo
Metropolitan
Area
C-1 Frame Jinnan-zaka (Note 13) 2,370.90 2,370.90 - - 12 100.0 164,157 185,331
Subtotal of Central Urban Retail Properties (1 property) 2,370.90 2,370.90 - - 12 100.0 164,157 185,331
Others
Tokyo
Metropolitan
Area
D-2 Shinjuku 6Chome Building (Land) 1,355.13 1,355.13 - - 1 100.0 68,588 57,230
Subtotal of Others Properties (1 property) 1,355.13 1,355.13 - - 1 100.0 68,588 57,230
Total of 97 properties 471,041.45 466,838.56 35 34 1,204
(Note 11) 99.1 14,802,746 20,103,908
Tokyo
Metropolitan
Area
Office
Buildings
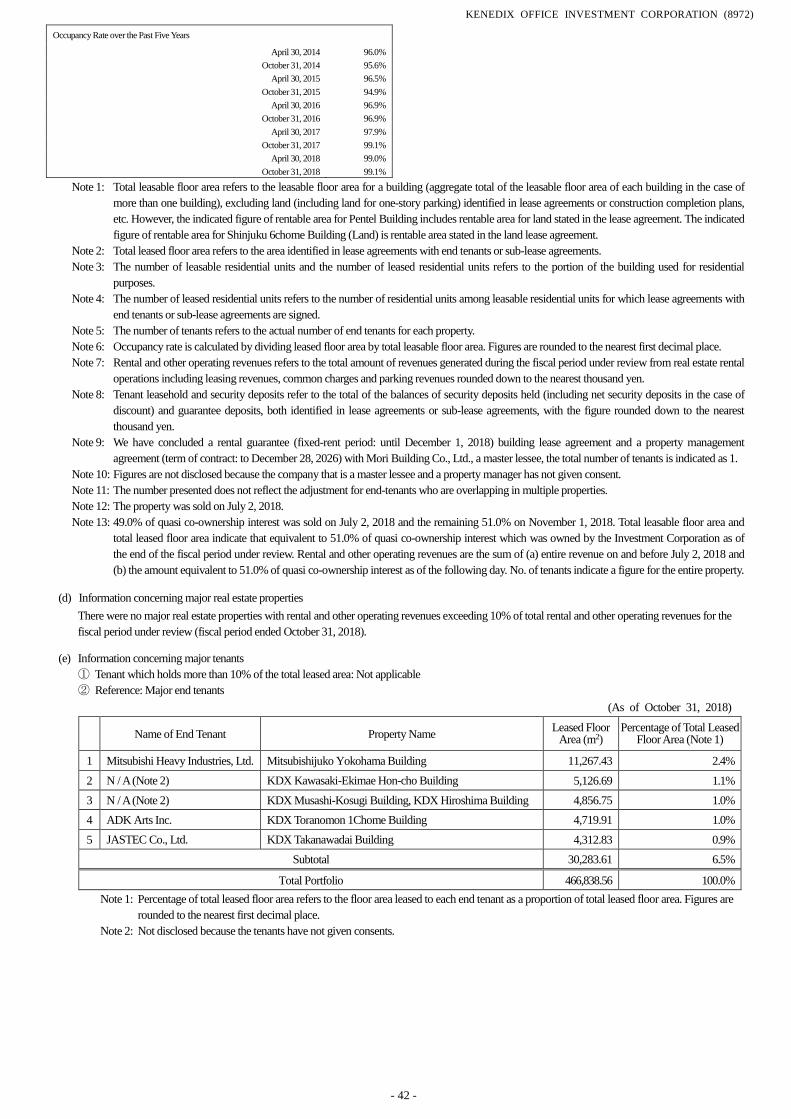
KENEDIX OFFICE INVESTMENT CORPORATION (8972)
- 42 -
Occupancy Rate over the Past Five Years
April 30, 2014 96.0%
October 31, 2014 95.6%
April 30, 2015 96.5%
October 31, 2015 94.9%
April 30, 2016 96.9%
October 31, 2016 96.9%
April 30, 2017 97.9%
October 31, 2017 99.1%
April 30, 2018 99.0%
October 31, 2018 99.1%
Note 1: Total leasable floor area refers to the leasable floor area for a building (aggregate total of the leasable floor area of each building in the case of
more than one building), excluding land (including land for one-story parking) identified in lease agreements or construction completion plans,
etc. However, the indicated figure of rentable area for Pentel Building includes rentable area for land stated in the lease agreement. The indicated
figure of rentable area for Shinjuku 6chome Building (Land) is rentable area stated in the land lease agreement.
Note 2: Total leased floor area refers to the area identified in lease agreements with end tenants or sub-lease agreements.
Note 3: The number of leasable residential units and the number of leased residential units refers to the portion of the building used for residential
purposes.
Note 4: The number of leased residential units refers to the number of residential units among leasable residential units for which lease agreements with
end tenants or sub-lease agreements are signed.
Note 5: The number of tenants refers to the actual number of end tenants for each property.
Note 6: Occupancy rate is calculated by dividing leased floor area by total leasable floor area. Figures are rounded to the nearest first decimal place.
Note 7: Rental and other operating revenues refers to the total amount of revenues generated during the fiscal period under review from real estate rental
operations including leasing revenues, common charges and parking revenues rounded down to the nearest thousand yen.
Note 8: Tenant leasehold and security deposits refer to the total of the balances of security deposits held (including net security deposits in the case of
discount) and guarantee deposits, both identified in lease agreements or sub-lease agreements, with the figure rounded down to the nearest
thousand yen.
Note 9: We have concluded a rental guarantee (fixed-rent period: until December 1, 2018) building lease agreement and a property management
agreement (term of contract: to December 28, 2026) with Mori Building Co., Ltd., a master lessee, the total number of tenants is indicated as 1.
Note 10: Figures are not disclosed because the company that is a master lessee and a property manager has not given consent.
Note 11: The number presented does not reflect the adjustment for end-tenants who are overlapping in multiple properties.
Note 12: The property was sold on July 2, 2018.
Note 13: 49.0% of quasi co-ownership interest was sold on July 2, 2018 and the remaining 51.0% on November 1, 2018. Total leasable floor area and
total leased floor area indicate that equivalent to 51.0% of quasi co-ownership interest which was owned by the Investment Corporation as of
the end of the fiscal period under review. Rental and other operating revenues are the sum of (a) entire revenue on and before July 2, 2018 and
(b) the amount equivalent to 51.0% of quasi co-ownership interest as of the following day. No. of tenants indicate a figure for the entire property.
(d) Information concerning major real estate properties
There were no major real estate properties with rental and other operating revenues exceeding 10% of total rental and other operating revenues for the
fiscal period under review (fiscal period ended October 31, 2018).
(e) Information concerning major tenants
① Tenant which holds more than 10% of the total leased area: Not applicable
② Reference: Major end tenants
(As of October 31, 2018)
Name of End Tenant Property Name Leased Floor
Area (m2) Percentage of Total Leased
Floor Area (Note 1)
1 Mitsubishi Heavy Industries, Ltd. Mitsubishijuko Yokohama Building 11,267.43 2.4%
2 N / A (Note 2) KDX Kawasaki-Ekimae Hon-cho Building 5,126.69 1.1%
3 N / A (Note 2) KDX Musashi-Kosugi Building, KDX Hiroshima Building 4,856.75 1.0%
4 ADK Arts Inc. KDX Toranomon 1Chome Building 4,719.91 1.0%
5 JASTEC Co., Ltd. KDX Takanawadai Building 4,312.83 0.9%
Subtotal 30,283.61 6.5%
Total Portfolio 466,838.56 100.0%
Note 1: Percentage of total leased floor area refers to the floor area leased to each end tenant as a proportion of total leased floor area. Figures are
rounded to the nearest first decimal place.
Note 2: Not disclosed because the tenants have not given consents.
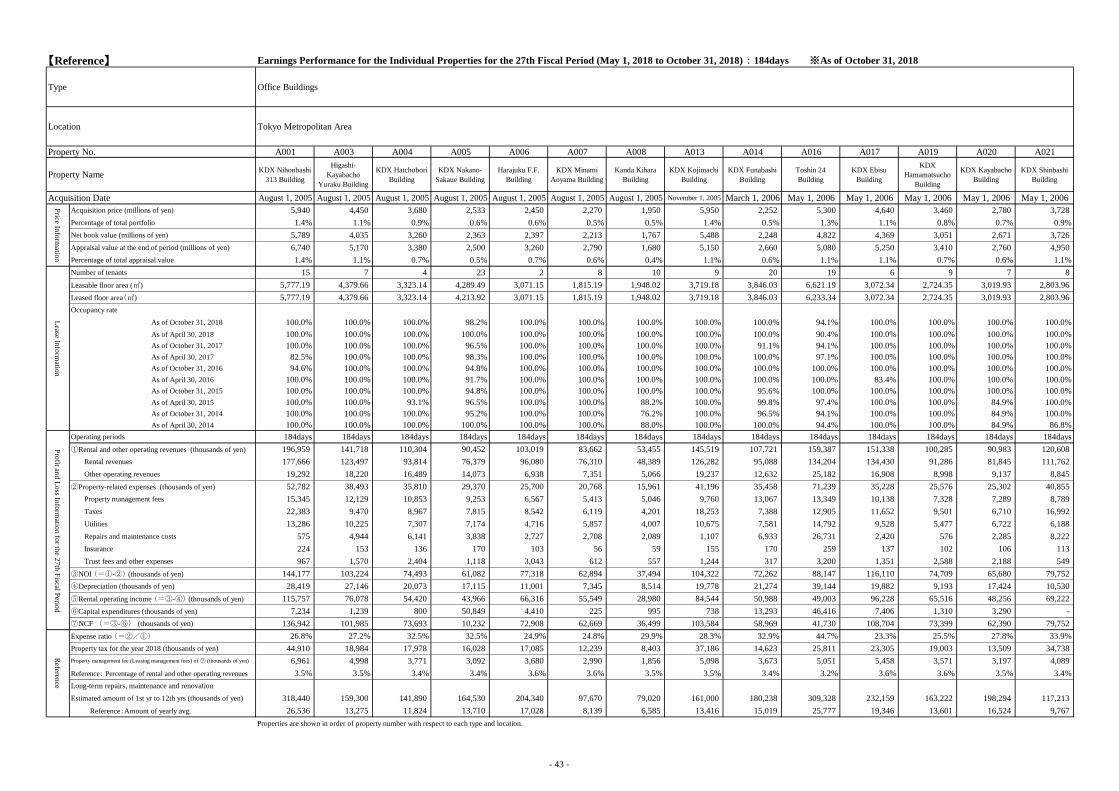
【Reference】 Earnings Performance for the Individual Properties for the 27th Fiscal Period (May 1, 2018 to October 31, 2018):184days ※As of October 31, 2018
Type Office Buildings
Location Tokyo Metropolitan Area
Property No. A001 A003 A004 A005 A006 A007 A008 A013 A014 A016 A017 A019 A020 A021
Property NameKDX Nihonbashi
313 Building
Higashi-
Kayabacho
Yuraku Building
KDX Hatchobori
Building
KDX Nakano-
Sakaue Building
Harajuku F.F.
Building
KDX Minami
Aoyama Building
Kanda Kihara
Building
KDX Kojimachi
Building
KDX Funabashi
Building
Toshin 24
Building
KDX Ebisu
Building
KDX
Hamamatsucho
Building
KDX Kayabacho
Building
KDX Shinbashi
Building
Acquisition Date August 1, 2005 August 1, 2005 August 1, 2005 August 1, 2005 August 1, 2005 August 1, 2005 August 1, 2005 November 1, 2005 March 1, 2006 May 1, 2006 May 1, 2006 May 1, 2006 May 1, 2006 May 1, 2006
Acquisition price (millions of yen) 5,940 4,450 3,680 2,533 2,450 2,270 1,950 5,950 2,252 5,300 4,640 3,460 2,780 3,728
Percentage of total portfolio 1.4% 1.1% 0.9% 0.6% 0.6% 0.5% 0.5% 1.4% 0.5% 1.3% 1.1% 0.8% 0.7% 0.9%
Net book value (millions of yen) 5,789 4,035 3,260 2,363 2,397 2,213 1,767 5,488 2,248 4,822 4,369 3,051 2,671 3,726
Appraisal value at the end of period (millions of yen) 6,740 5,170 3,380 2,500 3,260 2,790 1,680 5,150 2,660 5,080 5,250 3,410 2,760 4,950
Percentage of total appraisal value 1.4% 1.1% 0.7% 0.5% 0.7% 0.6% 0.4% 1.1% 0.6% 1.1% 1.1% 0.7% 0.6% 1.1%
Number of tenants 15 7 4 23 2 8 10 9 20 19 6 9 7 8
Leasable floor area (㎡) 5,777.19 4,379.66 3,323.14 4,289.49 3,071.15 1,815.19 1,948.02 3,719.18 3,846.03 6,621.19 3,072.34 2,724.35 3,019.93 2,803.96
Leased floor area(㎡) 5,777.19 4,379.66 3,323.14 4,213.92 3,071.15 1,815.19 1,948.02 3,719.18 3,846.03 6,233.34 3,072.34 2,724.35 3,019.93 2,803.96
Occupancy rate
As of October 31, 2018 100.0% 100.0% 100.0% 98.2% 100.0% 100.0% 100.0% 100.0% 100.0% 94.1% 100.0% 100.0% 100.0% 100.0%
As of April 30, 2018 100.0% 100.0% 100.0% 100.0% 100.0% 100.0% 100.0% 100.0% 100.0% 90.4% 100.0% 100.0% 100.0% 100.0%
As of October 31, 2017 100.0% 100.0% 100.0% 96.5% 100.0% 100.0% 100.0% 100.0% 91.1% 94.1% 100.0% 100.0% 100.0% 100.0%
As of April 30, 2017 82.5% 100.0% 100.0% 98.3% 100.0% 100.0% 100.0% 100.0% 100.0% 97.1% 100.0% 100.0% 100.0% 100.0%
As of October 31, 2016 94.6% 100.0% 100.0% 94.8% 100.0% 100.0% 100.0% 100.0% 100.0% 100.0% 100.0% 100.0% 100.0% 100.0%
As of April 30, 2016 100.0% 100.0% 100.0% 91.7% 100.0% 100.0% 100.0% 100.0% 100.0% 100.0% 83.4% 100.0% 100.0% 100.0%
As of October 31, 2015 100.0% 100.0% 100.0% 94.8% 100.0% 100.0% 100.0% 100.0% 95.6% 100.0% 100.0% 100.0% 100.0% 100.0%
As of April 30, 2015 100.0% 100.0% 93.1% 96.5% 100.0% 100.0% 88.2% 100.0% 99.8% 97.4% 100.0% 100.0% 84.9% 100.0%
As of October 31, 2014 100.0% 100.0% 100.0% 95.2% 100.0% 100.0% 76.2% 100.0% 96.5% 94.1% 100.0% 100.0% 84.9% 100.0%
As of April 30, 2014 100.0% 100.0% 100.0% 100.0% 100.0% 100.0% 88.0% 100.0% 100.0% 94.4% 100.0% 100.0% 84.9% 86.8%
Operating periods 184days 184days 184days 184days 184days 184days 184days 184days 184days 184days 184days 184days 184days 184days
①Rental and other operating revenues (thousands of yen) 196,959 141,718 110,304 90,452 103,019 83,662 53,455 145,519 107,721 159,387 151,338 100,285 90,983 120,608
Rental revenues 177,666 123,497 93,814 76,379 96,080 76,310 48,389 126,282 95,088 134,204 134,430 91,286 81,845 111,762
Other operating revenues 19,292 18,220 16,489 14,073 6,938 7,351 5,066 19,237 12,632 25,182 16,908 8,998 9,137 8,845
②Property-related expenses (thousands of yen) 52,782 38,493 35,810 29,370 25,700 20,768 15,961 41,196 35,458 71,239 35,228 25,576 25,302 40,855
Property management fees 15,345 12,129 10,853 9,253 6,567 5,413 5,046 9,760 13,067 13,349 10,138 7,328 7,289 8,789
Taxes 22,383 9,470 8,967 7,815 8,542 6,119 4,201 18,253 7,388 12,905 11,652 9,501 6,710 16,992
Utilities 13,286 10,225 7,307 7,174 4,716 5,857 4,007 10,675 7,581 14,792 9,528 5,477 6,722 6,188
Repairs and maintenance costs 575 4,944 6,141 3,838 2,727 2,708 2,089 1,107 6,933 26,731 2,420 576 2,285 8,222
Insurance 224 153 136 170 103 56 59 155 170 259 137 102 106 113
Trust fees and other expenses 967 1,570 2,404 1,118 3,043 612 557 1,244 317 3,200 1,351 2,588 2,188 549
③NOI (=①-②) (thousands of yen) 144,177 103,224 74,493 61,082 77,318 62,894 37,494 104,322 72,262 88,147 116,110 74,709 65,680 79,752
④Depreciation (thousands of yen) 28,419 27,146 20,073 17,115 11,001 7,345 8,514 19,778 21,274 39,144 19,882 9,193 17,424 10,530
⑤Rental operating income (=③-④) (thousands of yen) 115,757 76,078 54,420 43,966 66,316 55,549 28,980 84,544 50,988 49,003 96,228 65,516 48,256 69,222
⑥Capital expenditures (thousands of yen) 7,234 1,239 800 50,849 4,410 225 995 738 13,293 46,416 7,406 1,310 3,290 -
⑦NCF (=③-⑥) (thousands of yen) 136,942 101,985 73,693 10,232 72,908 62,669 36,499 103,584 58,969 41,730 108,704 73,399 62,390 79,752
Expense ratio (=②/①) 26.8% 27.2% 32.5% 32.5% 24.9% 24.8% 29.9% 28.3% 32.9% 44.7% 23.3% 25.5% 27.8% 33.9%
Property tax for the year 2018 (thousands of yen) 44,910 18,984 17,978 16,028 17,085 12,239 8,403 37,186 14,623 25,811 23,305 19,003 13,509 34,738
Property management fee (Leasing management fees) of ② (thousands of yen) 6,961 4,998 3,771 3,092 3,680 2,990 1,856 5,098 3,673 5,051 5,458 3,571 3,197 4,089
Reference: Percentage of rental and other operating revenues 3.5% 3.5% 3.4% 3.4% 3.6% 3.6% 3.5% 3.5% 3.4% 3.2% 3.6% 3.6% 3.5% 3.4%
Long-term repairs, maintenance and renovation
Estimated amount of 1st yr to 12th yrs (thousands of yen) 318,440 159,300 141,890 164,530 204,340 97,670 79,020 161,000 180,238 309,328 232,159 163,222 198,294 117,213
Reference:Amount of yearly avg. 26,536 13,275 11,824 13,710 17,028 8,139 6,585 13,416 15,019 25,777 19,346 13,601 16,524 9,767
Properties are shown in order of property number with respect to each type and location.
Price In
form
ation
Lease In
form
ation
Pro
fit and
Lo
ss Info
rmatio
n fo
r the 2
7th
Fiscal P
eriod
Referen
ce
- 43 -
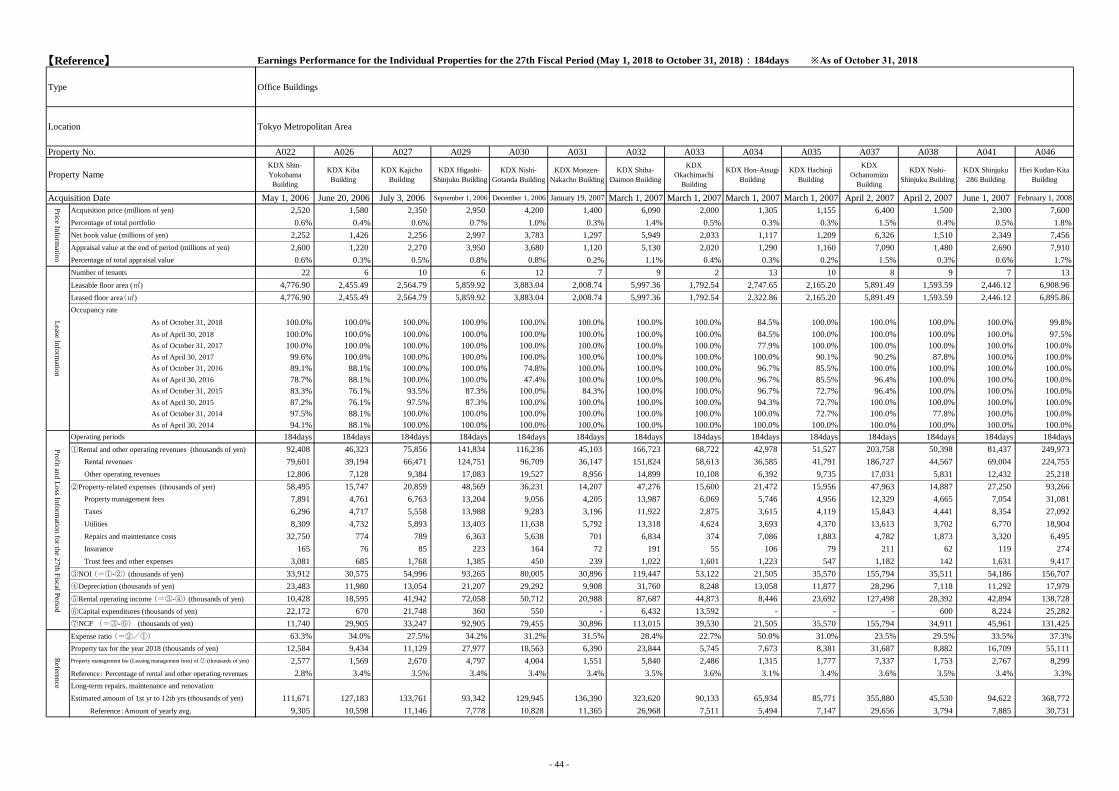
【Reference】
Type
Location
Property No.
Property Name
Acquisition Date
Acquisition price (millions of yen)
Percentage of total portfolio
Net book value (millions of yen)
Appraisal value at the end of period (millions of yen)
Percentage of total appraisal value
Number of tenants
Leasable floor area (㎡)
Leased floor area(㎡)
Occupancy rate
As of October 31, 2018
As of April 30, 2018
As of October 31, 2017
As of April 30, 2017
As of October 31, 2016
As of April 30, 2016
As of October 31, 2015
As of April 30, 2015
As of October 31, 2014
As of April 30, 2014
Operating periods
①Rental and other operating revenues (thousands of yen)
Rental revenues
Other operating revenues
②Property-related expenses (thousands of yen)
Property management fees
Taxes
Utilities
Repairs and maintenance costs
Insurance
Trust fees and other expenses
③NOI (=①-②) (thousands of yen)
④Depreciation (thousands of yen)
⑤Rental operating income (=③-④) (thousands of yen)
⑥Capital expenditures (thousands of yen)
⑦NCF (=③-⑥) (thousands of yen)
Expense ratio (=②/①)
Property tax for the year 2018 (thousands of yen)
Property management fee (Leasing management fees) of ② (thousands of yen)
Reference: Percentage of rental and other operating revenues
Long-term repairs, maintenance and renovation
Estimated amount of 1st yr to 12th yrs (thousands of yen)
Reference:Amount of yearly avg.
Price In
form
ation
Lease In
form
ation
Pro
fit and
Lo
ss Info
rmatio
n fo
r the 2
7th
Fiscal P
eriod
Referen
ce
Earnings Performance for the Individual Properties for the 27th Fiscal Period (May 1, 2018 to October 31, 2018):184days ※As of October 31, 2018
Office Buildings
Tokyo Metropolitan Area
A022 A026 A027 A029 A030 A031 A032 A033 A034 A035 A037 A038 A041 A046
KDX Shin-
Yokohama
Building
KDX Kiba
Building
KDX Kajicho
Building
KDX Higashi-
Shinjuku Building
KDX Nishi-
Gotanda Building
KDX Monzen-
Nakacho Building
KDX Shiba-
Daimon Building
KDX
Okachimachi
Building
KDX Hon-Atsugi
Building
KDX Hachioji
Building
KDX
Ochanomizu
Building
KDX Nishi-
Shinjuku Building
KDX Shinjuku
286 Building
Hiei Kudan-Kita
Building
May 1, 2006 June 20, 2006 July 3, 2006 September 1, 2006 December 1, 2006 January 19, 2007 March 1, 2007 March 1, 2007 March 1, 2007 March 1, 2007 April 2, 2007 April 2, 2007 June 1, 2007 February 1, 2008
2,520 1,580 2,350 2,950 4,200 1,400 6,090 2,000 1,305 1,155 6,400 1,500 2,300 7,600
0.6% 0.4% 0.6% 0.7% 1.0% 0.3% 1.4% 0.5% 0.3% 0.3% 1.5% 0.4% 0.5% 1.8%
2,252 1,426 2,256 2,997 3,783 1,297 5,949 2,033 1,117 1,209 6,326 1,510 2,349 7,456
2,600 1,220 2,270 3,950 3,680 1,120 5,130 2,020 1,290 1,160 7,090 1,480 2,690 7,910
0.6% 0.3% 0.5% 0.8% 0.8% 0.2% 1.1% 0.4% 0.3% 0.2% 1.5% 0.3% 0.6% 1.7%
22 6 10 6 12 7 9 2 13 10 8 9 7 13
4,776.90 2,455.49 2,564.79 5,859.92 3,883.04 2,008.74 5,997.36 1,792.54 2,747.65 2,165.20 5,891.49 1,593.59 2,446.12 6,908.96
4,776.90 2,455.49 2,564.79 5,859.92 3,883.04 2,008.74 5,997.36 1,792.54 2,322.86 2,165.20 5,891.49 1,593.59 2,446.12 6,895.86
100.0% 100.0% 100.0% 100.0% 100.0% 100.0% 100.0% 100.0% 84.5% 100.0% 100.0% 100.0% 100.0% 99.8%
100.0% 100.0% 100.0% 100.0% 100.0% 100.0% 100.0% 100.0% 84.5% 100.0% 100.0% 100.0% 100.0% 97.5%
100.0% 100.0% 100.0% 100.0% 100.0% 100.0% 100.0% 100.0% 77.9% 100.0% 100.0% 100.0% 100.0% 100.0%
99.6% 100.0% 100.0% 100.0% 100.0% 100.0% 100.0% 100.0% 100.0% 90.1% 90.2% 87.8% 100.0% 100.0%
89.1% 88.1% 100.0% 100.0% 74.8% 100.0% 100.0% 100.0% 96.7% 85.5% 100.0% 100.0% 100.0% 100.0%
78.7% 88.1% 100.0% 100.0% 47.4% 100.0% 100.0% 100.0% 96.7% 85.5% 96.4% 100.0% 100.0% 100.0%
83.3% 76.1% 93.5% 87.3% 100.0% 84.3% 100.0% 100.0% 96.7% 72.7% 96.4% 100.0% 100.0% 100.0%
87.2% 76.1% 97.5% 87.3% 100.0% 100.0% 100.0% 100.0% 94.3% 72.7% 100.0% 100.0% 100.0% 100.0%
97.5% 88.1% 100.0% 100.0% 100.0% 100.0% 100.0% 100.0% 100.0% 72.7% 100.0% 77.8% 100.0% 100.0%
94.1% 88.1% 100.0% 100.0% 100.0% 100.0% 100.0% 100.0% 100.0% 100.0% 100.0% 100.0% 100.0% 100.0%
184days 184days 184days 184days 184days 184days 184days 184days 184days 184days 184days 184days 184days 184days
92,408 46,323 75,856 141,834 116,236 45,103 166,723 68,722 42,978 51,527 203,758 50,398 81,437 249,973
79,601 39,194 66,471 124,751 96,709 36,147 151,824 58,613 36,585 41,791 186,727 44,567 69,004 224,755
12,806 7,128 9,384 17,083 19,527 8,956 14,899 10,108 6,392 9,735 17,031 5,831 12,432 25,218
58,495 15,747 20,859 48,569 36,231 14,207 47,276 15,600 21,472 15,956 47,963 14,887 27,250 93,266
7,891 4,761 6,763 13,204 9,056 4,205 13,987 6,069 5,746 4,956 12,329 4,665 7,054 31,081
6,296 4,717 5,558 13,988 9,283 3,196 11,922 2,875 3,615 4,119 15,843 4,441 8,354 27,092
8,309 4,732 5,893 13,403 11,638 5,792 13,318 4,624 3,693 4,370 13,613 3,702 6,770 18,904
32,750 774 789 6,363 5,638 701 6,834 374 7,086 1,883 4,782 1,873 3,320 6,495
165 76 85 223 164 72 191 55 106 79 211 62 119 274
3,081 685 1,768 1,385 450 239 1,022 1,601 1,223 547 1,182 142 1,631 9,417
33,912 30,575 54,996 93,265 80,005 30,896 119,447 53,122 21,505 35,570 155,794 35,511 54,186 156,707
23,483 11,980 13,054 21,207 29,292 9,908 31,760 8,248 13,058 11,877 28,296 7,118 11,292 17,979
10,428 18,595 41,942 72,058 50,712 20,988 87,687 44,873 8,446 23,692 127,498 28,392 42,894 138,728
22,172 670 21,748 360 550 - 6,432 13,592 - - - 600 8,224 25,282
11,740 29,905 33,247 92,905 79,455 30,896 113,015 39,530 21,505 35,570 155,794 34,911 45,961 131,425
63.3% 34.0% 27.5% 34.2% 31.2% 31.5% 28.4% 22.7% 50.0% 31.0% 23.5% 29.5% 33.5% 37.3%
12,584 9,434 11,129 27,977 18,563 6,390 23,844 5,745 7,673 8,381 31,687 8,882 16,709 55,111
2,577 1,569 2,670 4,797 4,004 1,551 5,840 2,486 1,315 1,777 7,337 1,753 2,767 8,299
2.8% 3.4% 3.5% 3.4% 3.4% 3.4% 3.5% 3.6% 3.1% 3.4% 3.6% 3.5% 3.4% 3.3%
111,671 127,183 133,761 93,342 129,945 136,390 323,620 90,133 65,934 85,771 355,880 45,530 94,622 368,772
9,305 10,598 11,146 7,778 10,828 11,365 26,968 7,511 5,494 7,147 29,656 3,794 7,885 30,731
- 44 -
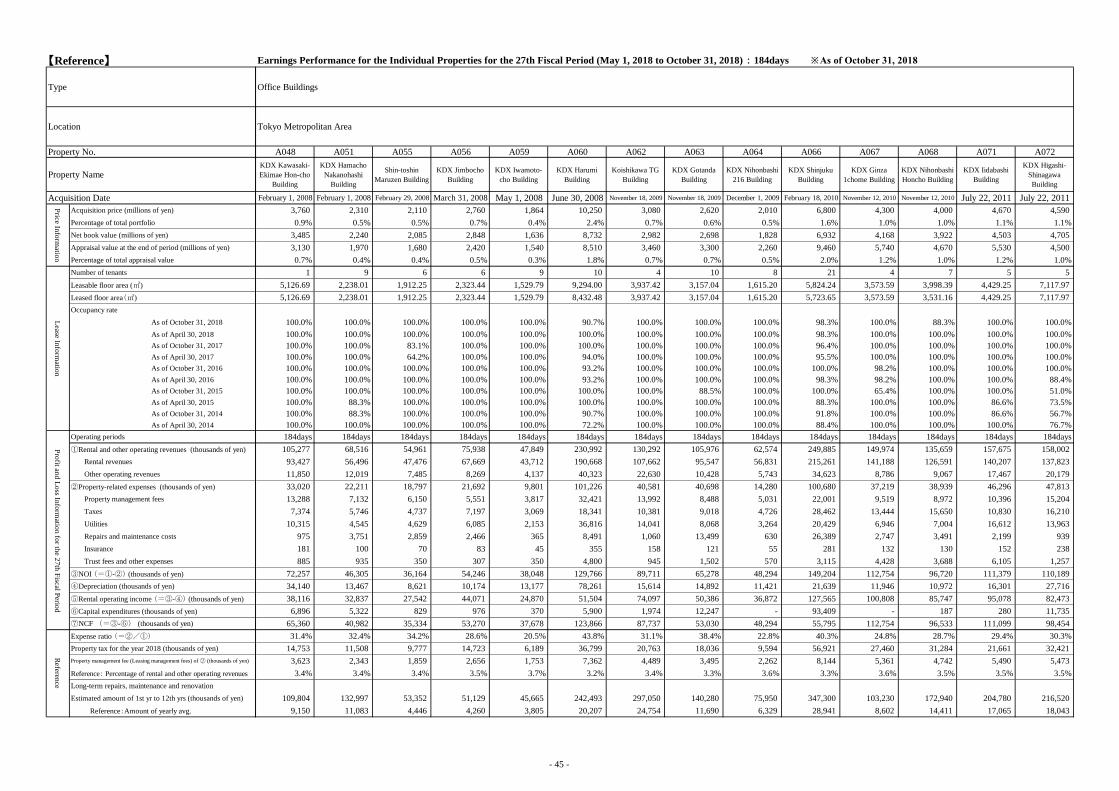
【Reference】
Type
Location
Property No.
Property Name
Acquisition Date
Acquisition price (millions of yen)
Percentage of total portfolio
Net book value (millions of yen)
Appraisal value at the end of period (millions of yen)
Percentage of total appraisal value
Number of tenants
Leasable floor area (㎡)
Leased floor area(㎡)
Occupancy rate
As of October 31, 2018
As of April 30, 2018
As of October 31, 2017
As of April 30, 2017
As of October 31, 2016
As of April 30, 2016
As of October 31, 2015
As of April 30, 2015
As of October 31, 2014
As of April 30, 2014
Operating periods
①Rental and other operating revenues (thousands of yen)
Rental revenues
Other operating revenues
②Property-related expenses (thousands of yen)
Property management fees
Taxes
Utilities
Repairs and maintenance costs
Insurance
Trust fees and other expenses
③NOI (=①-②) (thousands of yen)
④Depreciation (thousands of yen)
⑤Rental operating income (=③-④) (thousands of yen)
⑥Capital expenditures (thousands of yen)
⑦NCF (=③-⑥) (thousands of yen)
Expense ratio (=②/①)
Property tax for the year 2018 (thousands of yen)
Property management fee (Leasing management fees) of ② (thousands of yen)
Reference: Percentage of rental and other operating revenues
Long-term repairs, maintenance and renovation
Estimated amount of 1st yr to 12th yrs (thousands of yen)
Reference:Amount of yearly avg.
Price In
form
ation
Lease In
form
ation
Pro
fit and
Lo
ss Info
rmatio
n fo
r the 2
7th
Fiscal P
eriod
Referen
ce
Earnings Performance for the Individual Properties for the 27th Fiscal Period (May 1, 2018 to October 31, 2018):184days ※As of October 31, 2018
Office Buildings
Tokyo Metropolitan Area
A048 A051 A055 A056 A059 A060 A062 A063 A064 A066 A067 A068 A071 A072
KDX Kawasaki-
Ekimae Hon-cho
Building
KDX Hamacho
Nakanohashi
Building
Shin-toshin
Maruzen Building
KDX Jimbocho
Building
KDX Iwamoto-
cho Building
KDX Harumi
Building
Koishikawa TG
Building
KDX Gotanda
Building
KDX Nihonbashi
216 Building
KDX Shinjuku
Building
KDX Ginza
1chome Building
KDX Nihonbashi
Honcho Building
KDX Iidabashi
Building
KDX Higashi-
Shinagawa
Building
February 1, 2008 February 1, 2008 February 29, 2008 March 31, 2008 May 1, 2008 June 30, 2008 November 18, 2009 November 18, 2009 December 1, 2009 February 18, 2010 November 12, 2010 November 12, 2010 July 22, 2011 July 22, 2011
3,760 2,310 2,110 2,760 1,864 10,250 3,080 2,620 2,010 6,800 4,300 4,000 4,670 4,590
0.9% 0.5% 0.5% 0.7% 0.4% 2.4% 0.7% 0.6% 0.5% 1.6% 1.0% 1.0% 1.1% 1.1%
3,485 2,240 2,085 2,848 1,636 8,732 2,982 2,698 1,828 6,932 4,168 3,922 4,503 4,705
3,130 1,970 1,680 2,420 1,540 8,510 3,460 3,300 2,260 9,460 5,740 4,670 5,530 4,500
0.7% 0.4% 0.4% 0.5% 0.3% 1.8% 0.7% 0.7% 0.5% 2.0% 1.2% 1.0% 1.2% 1.0%
1 9 6 6 9 10 4 10 8 21 4 7 5 5
5,126.69 2,238.01 1,912.25 2,323.44 1,529.79 9,294.00 3,937.42 3,157.04 1,615.20 5,824.24 3,573.59 3,998.39 4,429.25 7,117.97
5,126.69 2,238.01 1,912.25 2,323.44 1,529.79 8,432.48 3,937.42 3,157.04 1,615.20 5,723.65 3,573.59 3,531.16 4,429.25 7,117.97
100.0% 100.0% 100.0% 100.0% 100.0% 90.7% 100.0% 100.0% 100.0% 98.3% 100.0% 88.3% 100.0% 100.0%
100.0% 100.0% 100.0% 100.0% 100.0% 100.0% 100.0% 100.0% 100.0% 98.3% 100.0% 100.0% 100.0% 100.0%
100.0% 100.0% 83.1% 100.0% 100.0% 100.0% 100.0% 100.0% 100.0% 96.4% 100.0% 100.0% 100.0% 100.0%
100.0% 100.0% 64.2% 100.0% 100.0% 94.0% 100.0% 100.0% 100.0% 95.5% 100.0% 100.0% 100.0% 100.0%
100.0% 100.0% 100.0% 100.0% 100.0% 93.2% 100.0% 100.0% 100.0% 100.0% 98.2% 100.0% 100.0% 100.0%
100.0% 100.0% 100.0% 100.0% 100.0% 93.2% 100.0% 100.0% 100.0% 98.3% 98.2% 100.0% 100.0% 88.4%
100.0% 100.0% 100.0% 100.0% 100.0% 100.0% 100.0% 88.5% 100.0% 100.0% 65.4% 100.0% 100.0% 51.0%
100.0% 88.3% 100.0% 100.0% 100.0% 100.0% 100.0% 100.0% 100.0% 88.3% 100.0% 100.0% 86.6% 73.5%
100.0% 88.3% 100.0% 100.0% 100.0% 90.7% 100.0% 100.0% 100.0% 91.8% 100.0% 100.0% 86.6% 56.7%
100.0% 100.0% 100.0% 100.0% 100.0% 72.2% 100.0% 100.0% 100.0% 88.4% 100.0% 100.0% 100.0% 76.7%
184days 184days 184days 184days 184days 184days 184days 184days 184days 184days 184days 184days 184days 184days
105,277 68,516 54,961 75,938 47,849 230,992 130,292 105,976 62,574 249,885 149,974 135,659 157,675 158,002
93,427 56,496 47,476 67,669 43,712 190,668 107,662 95,547 56,831 215,261 141,188 126,591 140,207 137,823
11,850 12,019 7,485 8,269 4,137 40,323 22,630 10,428 5,743 34,623 8,786 9,067 17,467 20,179
33,020 22,211 18,797 21,692 9,801 101,226 40,581 40,698 14,280 100,680 37,219 38,939 46,296 47,813
13,288 7,132 6,150 5,551 3,817 32,421 13,992 8,488 5,031 22,001 9,519 8,972 10,396 15,204
7,374 5,746 4,737 7,197 3,069 18,341 10,381 9,018 4,726 28,462 13,444 15,650 10,830 16,210
10,315 4,545 4,629 6,085 2,153 36,816 14,041 8,068 3,264 20,429 6,946 7,004 16,612 13,963
975 3,751 2,859 2,466 365 8,491 1,060 13,499 630 26,389 2,747 3,491 2,199 939
181 100 70 83 45 355 158 121 55 281 132 130 152 238
885 935 350 307 350 4,800 945 1,502 570 3,115 4,428 3,688 6,105 1,257
72,257 46,305 36,164 54,246 38,048 129,766 89,711 65,278 48,294 149,204 112,754 96,720 111,379 110,189
34,140 13,467 8,621 10,174 13,177 78,261 15,614 14,892 11,421 21,639 11,946 10,972 16,301 27,716
38,116 32,837 27,542 44,071 24,870 51,504 74,097 50,386 36,872 127,565 100,808 85,747 95,078 82,473
6,896 5,322 829 976 370 5,900 1,974 12,247 - 93,409 - 187 280 11,735
65,360 40,982 35,334 53,270 37,678 123,866 87,737 53,030 48,294 55,795 112,754 96,533 111,099 98,454
31.4% 32.4% 34.2% 28.6% 20.5% 43.8% 31.1% 38.4% 22.8% 40.3% 24.8% 28.7% 29.4% 30.3%
14,753 11,508 9,777 14,723 6,189 36,799 20,763 18,036 9,594 56,921 27,460 31,284 21,661 32,421
3,623 2,343 1,859 2,656 1,753 7,362 4,489 3,495 2,262 8,144 5,361 4,742 5,490 5,473
3.4% 3.4% 3.4% 3.5% 3.7% 3.2% 3.4% 3.3% 3.6% 3.3% 3.6% 3.5% 3.5% 3.5%
109,804 132,997 53,352 51,129 45,665 242,493 297,050 140,280 75,950 347,300 103,230 172,940 204,780 216,520
9,150 11,083 4,446 4,260 3,805 20,207 24,754 11,690 6,329 28,941 8,602 14,411 17,065 18,043
- 45 -
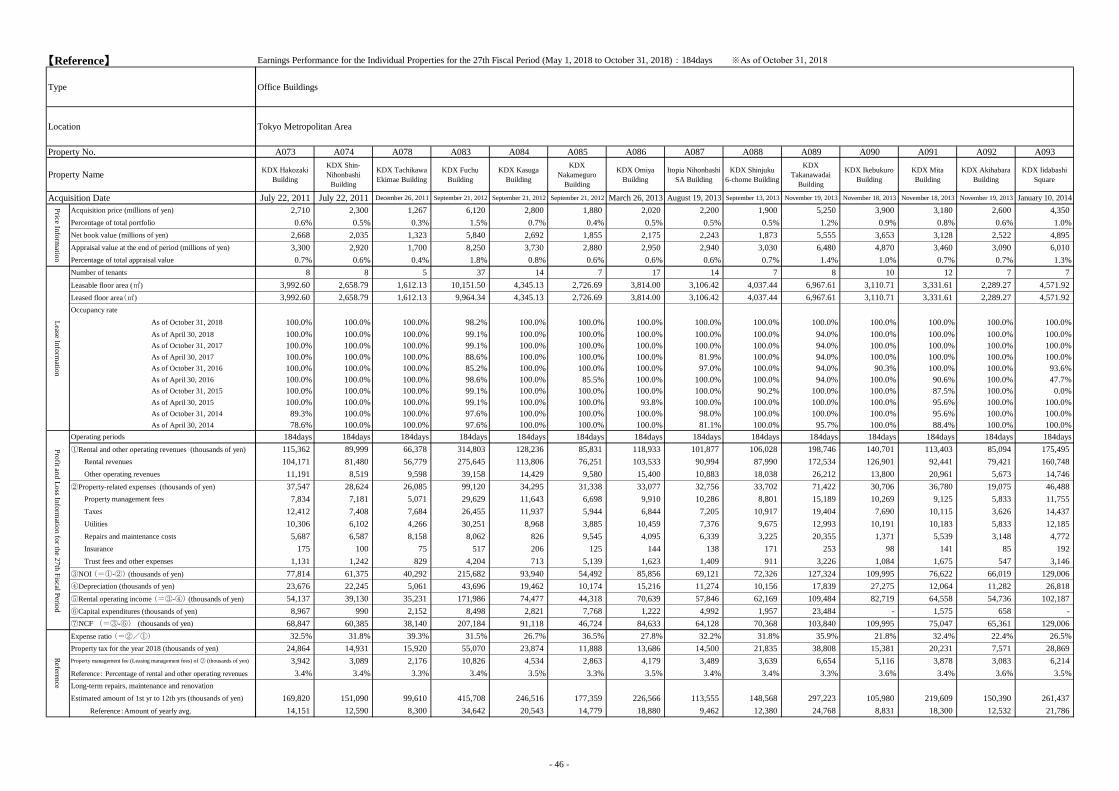
【Reference】
Type
Location
Property No.
Property Name
Acquisition Date
Acquisition price (millions of yen)
Percentage of total portfolio
Net book value (millions of yen)
Appraisal value at the end of period (millions of yen)
Percentage of total appraisal value
Number of tenants
Leasable floor area (㎡)
Leased floor area(㎡)
Occupancy rate
As of October 31, 2018
As of April 30, 2018
As of October 31, 2017
As of April 30, 2017
As of October 31, 2016
As of April 30, 2016
As of October 31, 2015
As of April 30, 2015
As of October 31, 2014
As of April 30, 2014
Operating periods
①Rental and other operating revenues (thousands of yen)
Rental revenues
Other operating revenues
②Property-related expenses (thousands of yen)
Property management fees
Taxes
Utilities
Repairs and maintenance costs
Insurance
Trust fees and other expenses
③NOI (=①-②) (thousands of yen)
④Depreciation (thousands of yen)
⑤Rental operating income (=③-④) (thousands of yen)
⑥Capital expenditures (thousands of yen)
⑦NCF (=③-⑥) (thousands of yen)
Expense ratio (=②/①)
Property tax for the year 2018 (thousands of yen)
Property management fee (Leasing management fees) of ② (thousands of yen)
Reference: Percentage of rental and other operating revenues
Long-term repairs, maintenance and renovation
Estimated amount of 1st yr to 12th yrs (thousands of yen)
Reference:Amount of yearly avg.
Price In
form
ation
Lease In
form
ation
Pro
fit and
Lo
ss Info
rmatio
n fo
r the 2
7th
Fiscal P
eriod
Referen
ce
Earnings Performance for the Individual Properties for the 27th Fiscal Period (May 1, 2018 to October 31, 2018):184days ※As of October 31, 2018
Office Buildings
Tokyo Metropolitan Area
A073 A074 A078 A083 A084 A085 A086 A087 A088 A089 A090 A091 A092 A093
KDX Hakozaki
Building
KDX Shin-
Nihonbashi
Building
KDX Tachikawa
Ekimae Building
KDX Fuchu
Building
KDX Kasuga
Building
KDX
Nakameguro
Building
KDX Omiya
Building
Itopia Nihonbashi
SA Building
KDX Shinjuku
6-chome Building
KDX
Takanawadai
Building
KDX Ikebukuro
Building
KDX Mita
Building
KDX Akihabara
Building
KDX Iidabashi
Square
July 22, 2011 July 22, 2011 December 26, 2011 September 21, 2012 September 21, 2012 September 21, 2012 March 26, 2013 August 19, 2013 September 13, 2013 November 19, 2013 November 18, 2013 November 18, 2013 November 19, 2013 January 10, 2014
2,710 2,300 1,267 6,120 2,800 1,880 2,020 2,200 1,900 5,250 3,900 3,180 2,600 4,350
0.6% 0.5% 0.3% 1.5% 0.7% 0.4% 0.5% 0.5% 0.5% 1.2% 0.9% 0.8% 0.6% 1.0%
2,668 2,035 1,323 5,840 2,692 1,855 2,175 2,243 1,873 5,555 3,653 3,128 2,522 4,895
3,300 2,920 1,700 8,250 3,730 2,880 2,950 2,940 3,030 6,480 4,870 3,460 3,090 6,010
0.7% 0.6% 0.4% 1.8% 0.8% 0.6% 0.6% 0.6% 0.7% 1.4% 1.0% 0.7% 0.7% 1.3%
8 8 5 37 14 7 17 14 7 8 10 12 7 7
3,992.60 2,658.79 1,612.13 10,151.50 4,345.13 2,726.69 3,814.00 3,106.42 4,037.44 6,967.61 3,110.71 3,331.61 2,289.27 4,571.92
3,992.60 2,658.79 1,612.13 9,964.34 4,345.13 2,726.69 3,814.00 3,106.42 4,037.44 6,967.61 3,110.71 3,331.61 2,289.27 4,571.92
100.0% 100.0% 100.0% 98.2% 100.0% 100.0% 100.0% 100.0% 100.0% 100.0% 100.0% 100.0% 100.0% 100.0%
100.0% 100.0% 100.0% 99.1% 100.0% 100.0% 100.0% 100.0% 100.0% 94.0% 100.0% 100.0% 100.0% 100.0%
100.0% 100.0% 100.0% 99.1% 100.0% 100.0% 100.0% 100.0% 100.0% 94.0% 100.0% 100.0% 100.0% 100.0%
100.0% 100.0% 100.0% 88.6% 100.0% 100.0% 100.0% 81.9% 100.0% 94.0% 100.0% 100.0% 100.0% 100.0%
100.0% 100.0% 100.0% 85.2% 100.0% 100.0% 100.0% 97.0% 100.0% 94.0% 90.3% 100.0% 100.0% 93.6%
100.0% 100.0% 100.0% 98.6% 100.0% 85.5% 100.0% 100.0% 100.0% 94.0% 100.0% 90.6% 100.0% 47.7%
100.0% 100.0% 100.0% 99.1% 100.0% 100.0% 100.0% 100.0% 90.2% 100.0% 100.0% 87.5% 100.0% 0.0%
100.0% 100.0% 100.0% 99.1% 100.0% 100.0% 93.8% 100.0% 100.0% 100.0% 100.0% 95.6% 100.0% 100.0%
89.3% 100.0% 100.0% 97.6% 100.0% 100.0% 100.0% 98.0% 100.0% 100.0% 100.0% 95.6% 100.0% 100.0%
78.6% 100.0% 100.0% 97.6% 100.0% 100.0% 100.0% 81.1% 100.0% 95.7% 100.0% 88.4% 100.0% 100.0%
184days 184days 184days 184days 184days 184days 184days 184days 184days 184days 184days 184days 184days 184days
115,362 89,999 66,378 314,803 128,236 85,831 118,933 101,877 106,028 198,746 140,701 113,403 85,094 175,495
104,171 81,480 56,779 275,645 113,806 76,251 103,533 90,994 87,990 172,534 126,901 92,441 79,421 160,748
11,191 8,519 9,598 39,158 14,429 9,580 15,400 10,883 18,038 26,212 13,800 20,961 5,673 14,746
37,547 28,624 26,085 99,120 34,295 31,338 33,077 32,756 33,702 71,422 30,706 36,780 19,075 46,488
7,834 7,181 5,071 29,629 11,643 6,698 9,910 10,286 8,801 15,189 10,269 9,125 5,833 11,755
12,412 7,408 7,684 26,455 11,937 5,944 6,844 7,205 10,917 19,404 7,690 10,115 3,626 14,437
10,306 6,102 4,266 30,251 8,968 3,885 10,459 7,376 9,675 12,993 10,191 10,183 5,833 12,185
5,687 6,587 8,158 8,062 826 9,545 4,095 6,339 3,225 20,355 1,371 5,539 3,148 4,772
175 100 75 517 206 125 144 138 171 253 98 141 85 192
1,131 1,242 829 4,204 713 5,139 1,623 1,409 911 3,226 1,084 1,675 547 3,146
77,814 61,375 40,292 215,682 93,940 54,492 85,856 69,121 72,326 127,324 109,995 76,622 66,019 129,006
23,676 22,245 5,061 43,696 19,462 10,174 15,216 11,274 10,156 17,839 27,275 12,064 11,282 26,818
54,137 39,130 35,231 171,986 74,477 44,318 70,639 57,846 62,169 109,484 82,719 64,558 54,736 102,187
8,967 990 2,152 8,498 2,821 7,768 1,222 4,992 1,957 23,484 - 1,575 658 -
68,847 60,385 38,140 207,184 91,118 46,724 84,633 64,128 70,368 103,840 109,995 75,047 65,361 129,006
32.5% 31.8% 39.3% 31.5% 26.7% 36.5% 27.8% 32.2% 31.8% 35.9% 21.8% 32.4% 22.4% 26.5%
24,864 14,931 15,920 55,070 23,874 11,888 13,686 14,500 21,835 38,808 15,381 20,231 7,571 28,869
3,942 3,089 2,176 10,826 4,534 2,863 4,179 3,489 3,639 6,654 5,116 3,878 3,083 6,214
3.4% 3.4% 3.3% 3.4% 3.5% 3.3% 3.5% 3.4% 3.4% 3.3% 3.6% 3.4% 3.6% 3.5%
169,820 151,090 99,610 415,708 246,516 177,359 226,566 113,555 148,568 297,223 105,980 219,609 150,390 261,437
14,151 12,590 8,300 34,642 20,543 14,779 18,880 9,462 12,380 24,768 8,831 18,300 12,532 21,786
- 46 -
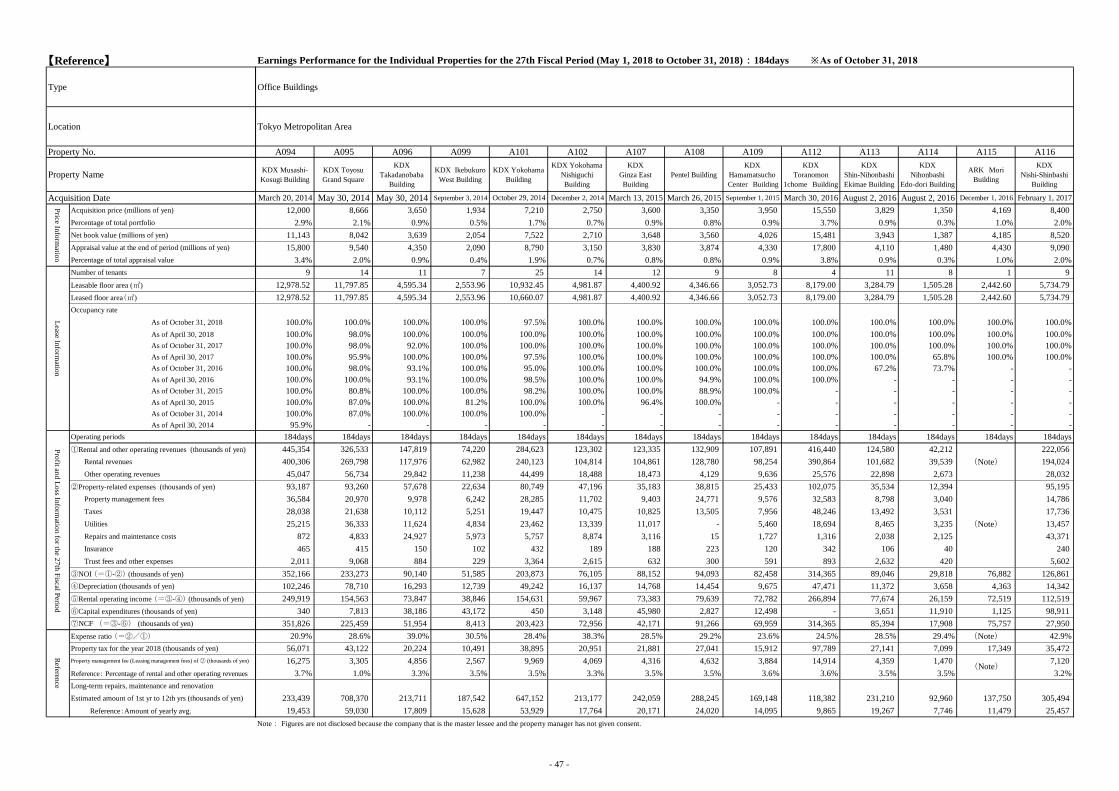
【Reference】
Type
Location
Property No.
Property Name
Acquisition Date
Acquisition price (millions of yen)
Percentage of total portfolio
Net book value (millions of yen)
Appraisal value at the end of period (millions of yen)
Percentage of total appraisal value
Number of tenants
Leasable floor area (㎡)
Leased floor area(㎡)
Occupancy rate
As of October 31, 2018
As of April 30, 2018
As of October 31, 2017
As of April 30, 2017
As of October 31, 2016
As of April 30, 2016
As of October 31, 2015
As of April 30, 2015
As of October 31, 2014
As of April 30, 2014
Operating periods
①Rental and other operating revenues (thousands of yen)
Rental revenues
Other operating revenues
②Property-related expenses (thousands of yen)
Property management fees
Taxes
Utilities
Repairs and maintenance costs
Insurance
Trust fees and other expenses
③NOI (=①-②) (thousands of yen)
④Depreciation (thousands of yen)
⑤Rental operating income (=③-④) (thousands of yen)
⑥Capital expenditures (thousands of yen)
⑦NCF (=③-⑥) (thousands of yen)
Expense ratio (=②/①)
Property tax for the year 2018 (thousands of yen)
Property management fee (Leasing management fees) of ② (thousands of yen)
Reference: Percentage of rental and other operating revenues
Long-term repairs, maintenance and renovation
Estimated amount of 1st yr to 12th yrs (thousands of yen)
Reference:Amount of yearly avg.
Price In
form
ation
Lease In
form
ation
Pro
fit and
Lo
ss Info
rmatio
n fo
r the 2
7th
Fiscal P
eriod
Referen
ce
Earnings Performance for the Individual Properties for the 27th Fiscal Period (May 1, 2018 to October 31, 2018):184days ※As of October 31, 2018
Office Buildings
Tokyo Metropolitan Area
A094 A095 A096 A099 A101 A102 A107 A108 A109 A112 A113 A114 A115 A116
KDX Musashi-
Kosugi Building
KDX Toyosu
Grand Square
KDX
Takadanobaba
Building
KDX Ikebukuro
West Building
KDX Yokohama
Building
KDX Yokohama
Nishiguchi
Building
KDX
Ginza East
Building
Pentel Building
KDX
Hamamatsucho
Center Building
KDX
Toranomon
1chome Building
KDX
Shin-Nihonbashi
Ekimae Building
KDX
Nihonbashi
Edo-dori Building
ARK Mori
Building
KDX
Nishi-Shinbashi
Building
March 20, 2014 May 30, 2014 May 30, 2014 September 3, 2014 October 29, 2014 December 2, 2014 March 13, 2015 March 26, 2015 September 1, 2015 March 30, 2016 August 2, 2016 August 2, 2016 December 1, 2016 February 1, 2017
12,000 8,666 3,650 1,934 7,210 2,750 3,600 3,350 3,950 15,550 3,829 1,350 4,169 8,400
2.9% 2.1% 0.9% 0.5% 1.7% 0.7% 0.9% 0.8% 0.9% 3.7% 0.9% 0.3% 1.0% 2.0%
11,143 8,042 3,639 2,054 7,522 2,710 3,648 3,560 4,026 15,481 3,943 1,387 4,185 8,520
15,800 9,540 4,350 2,090 8,790 3,150 3,830 3,874 4,330 17,800 4,110 1,480 4,430 9,090
3.4% 2.0% 0.9% 0.4% 1.9% 0.7% 0.8% 0.8% 0.9% 3.8% 0.9% 0.3% 1.0% 2.0%
9 14 11 7 25 14 12 9 8 4 11 8 1 9
12,978.52 11,797.85 4,595.34 2,553.96 10,932.45 4,981.87 4,400.92 4,346.66 3,052.73 8,179.00 3,284.79 1,505.28 2,442.60 5,734.79
12,978.52 11,797.85 4,595.34 2,553.96 10,660.07 4,981.87 4,400.92 4,346.66 3,052.73 8,179.00 3,284.79 1,505.28 2,442.60 5,734.79
100.0% 100.0% 100.0% 100.0% 97.5% 100.0% 100.0% 100.0% 100.0% 100.0% 100.0% 100.0% 100.0% 100.0%
100.0% 98.0% 100.0% 100.0% 100.0% 100.0% 100.0% 100.0% 100.0% 100.0% 100.0% 100.0% 100.0% 100.0%
100.0% 98.0% 92.0% 100.0% 100.0% 100.0% 100.0% 100.0% 100.0% 100.0% 100.0% 100.0% 100.0% 100.0%
100.0% 95.9% 100.0% 100.0% 97.5% 100.0% 100.0% 100.0% 100.0% 100.0% 100.0% 65.8% 100.0% 100.0%
100.0% 98.0% 93.1% 100.0% 95.0% 100.0% 100.0% 100.0% 100.0% 100.0% 67.2% 73.7% - -
100.0% 100.0% 93.1% 100.0% 98.5% 100.0% 100.0% 94.9% 100.0% 100.0% - - - -
100.0% 80.8% 100.0% 100.0% 98.2% 100.0% 100.0% 88.9% 100.0% - - - - -
100.0% 87.0% 100.0% 81.2% 100.0% 100.0% 96.4% 100.0% - - - - - -
100.0% 87.0% 100.0% 100.0% 100.0% - - - - - - - - -
95.9% - - - - - - - - - - - - -
184days 184days 184days 184days 184days 184days 184days 184days 184days 184days 184days 184days 184days 184days
445,354 326,533 147,819 74,220 284,623 123,302 123,335 132,909 107,891 416,440 124,580 42,212 222,056
400,306 269,798 117,976 62,982 240,123 104,814 104,861 128,780 98,254 390,864 101,682 39,539 (Note) 194,024
45,047 56,734 29,842 11,238 44,499 18,488 18,473 4,129 9,636 25,576 22,898 2,673 28,032
93,187 93,260 57,678 22,634 80,749 47,196 35,183 38,815 25,433 102,075 35,534 12,394 95,195
36,584 20,970 9,978 6,242 28,285 11,702 9,403 24,771 9,576 32,583 8,798 3,040 14,786
28,038 21,638 10,112 5,251 19,447 10,475 10,825 13,505 7,956 48,246 13,492 3,531 17,736
25,215 36,333 11,624 4,834 23,462 13,339 11,017 - 5,460 18,694 8,465 3,235 (Note) 13,457
872 4,833 24,927 5,973 5,757 8,874 3,116 15 1,727 1,316 2,038 2,125 43,371
465 415 150 102 432 189 188 223 120 342 106 40 240
2,011 9,068 884 229 3,364 2,615 632 300 591 893 2,632 420 5,602
352,166 233,273 90,140 51,585 203,873 76,105 88,152 94,093 82,458 314,365 89,046 29,818 76,882 126,861
102,246 78,710 16,293 12,739 49,242 16,137 14,768 14,454 9,675 47,471 11,372 3,658 4,363 14,342
249,919 154,563 73,847 38,846 154,631 59,967 73,383 79,639 72,782 266,894 77,674 26,159 72,519 112,519
340 7,813 38,186 43,172 450 3,148 45,980 2,827 12,498 - 3,651 11,910 1,125 98,911
351,826 225,459 51,954 8,413 203,423 72,956 42,171 91,266 69,959 314,365 85,394 17,908 75,757 27,950
20.9% 28.6% 39.0% 30.5% 28.4% 38.3% 28.5% 29.2% 23.6% 24.5% 28.5% 29.4% (Note) 42.9%
56,071 43,122 20,224 10,491 38,895 20,951 21,881 27,041 15,912 97,789 27,141 7,099 17,349 35,472
16,275 3,305 4,856 2,567 9,969 4,069 4,316 4,632 3,884 14,914 4,359 1,470 7,120
3.7% 1.0% 3.3% 3.5% 3.5% 3.3% 3.5% 3.5% 3.6% 3.6% 3.5% 3.5% 3.2%
233,439 708,370 213,711 187,542 647,152 213,177 242,059 288,245 169,148 118,382 231,210 92,960 137,750 305,494
19,453 59,030 17,809 15,628 53,929 17,764 20,171 24,020 14,095 9,865 19,267 7,746 11,479 25,457
Note: Figures are not disclosed because the company that is the master lessee and the property manager has not given consent.
(Note)
- 47 -
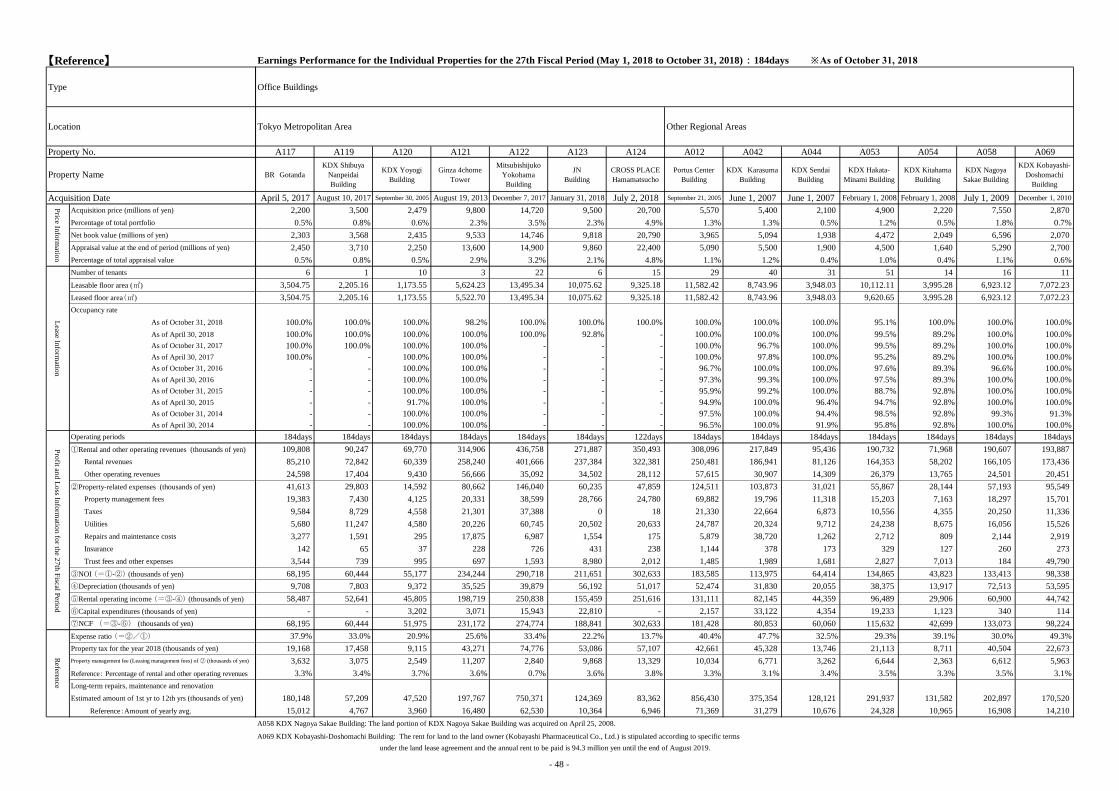
【Reference】
Type
Location
Property No.
Property Name
Acquisition Date
Acquisition price (millions of yen)
Percentage of total portfolio
Net book value (millions of yen)
Appraisal value at the end of period (millions of yen)
Percentage of total appraisal value
Number of tenants
Leasable floor area (㎡)
Leased floor area(㎡)
Occupancy rate
As of October 31, 2018
As of April 30, 2018
As of October 31, 2017
As of April 30, 2017
As of October 31, 2016
As of April 30, 2016
As of October 31, 2015
As of April 30, 2015
As of October 31, 2014
As of April 30, 2014
Operating periods
①Rental and other operating revenues (thousands of yen)
Rental revenues
Other operating revenues
②Property-related expenses (thousands of yen)
Property management fees
Taxes
Utilities
Repairs and maintenance costs
Insurance
Trust fees and other expenses
③NOI (=①-②) (thousands of yen)
④Depreciation (thousands of yen)
⑤Rental operating income (=③-④) (thousands of yen)
⑥Capital expenditures (thousands of yen)
⑦NCF (=③-⑥) (thousands of yen)
Expense ratio (=②/①)
Property tax for the year 2018 (thousands of yen)
Property management fee (Leasing management fees) of ② (thousands of yen)
Reference: Percentage of rental and other operating revenues
Long-term repairs, maintenance and renovation
Estimated amount of 1st yr to 12th yrs (thousands of yen)
Reference:Amount of yearly avg.
Price In
form
ation
Lease In
form
ation
Pro
fit and
Lo
ss Info
rmatio
n fo
r the 2
7th
Fiscal P
eriod
Referen
ce
Earnings Performance for the Individual Properties for the 27th Fiscal Period (May 1, 2018 to October 31, 2018):184days ※As of October 31, 2018
Office Buildings
Tokyo Metropolitan Area Other Regional Areas
A117 A119 A120 A121 A122 A123 A124 A012 A042 A044 A053 A054 A058 A069
BR Gotanda
KDX Shibuya
Nanpeidai
Building
KDX Yoyogi
Building
Ginza 4chome
Tower
Mitsubishijuko
Yokohama
Building
JN
Building
CROSS PLACE
Hamamatsucho
Portus Center
Building
KDX Karasuma
Building
KDX Sendai
Building
KDX Hakata-
Minami Building
KDX Kitahama
Building
KDX Nagoya
Sakae Building
KDX Kobayashi-
Doshomachi
Building
April 5, 2017 August 10, 2017 September 30, 2005 August 19, 2013 December 7, 2017 January 31, 2018 July 2, 2018 September 21, 2005 June 1, 2007 June 1, 2007 February 1, 2008 February 1, 2008 July 1, 2009 December 1, 2010
2,200 3,500 2,479 9,800 14,720 9,500 20,700 5,570 5,400 2,100 4,900 2,220 7,550 2,870
0.5% 0.8% 0.6% 2.3% 3.5% 2.3% 4.9% 1.3% 1.3% 0.5% 1.2% 0.5% 1.8% 0.7%
2,303 3,568 2,435 9,533 14,746 9,818 20,790 3,965 5,094 1,938 4,472 2,049 6,596 2,070
2,450 3,710 2,250 13,600 14,900 9,860 22,400 5,090 5,500 1,900 4,500 1,640 5,290 2,700
0.5% 0.8% 0.5% 2.9% 3.2% 2.1% 4.8% 1.1% 1.2% 0.4% 1.0% 0.4% 1.1% 0.6%
6 1 10 3 22 6 15 29 40 31 51 14 16 11
3,504.75 2,205.16 1,173.55 5,624.23 13,495.34 10,075.62 9,325.18 11,582.42 8,743.96 3,948.03 10,112.11 3,995.28 6,923.12 7,072.23
3,504.75 2,205.16 1,173.55 5,522.70 13,495.34 10,075.62 9,325.18 11,582.42 8,743.96 3,948.03 9,620.65 3,995.28 6,923.12 7,072.23
100.0% 100.0% 100.0% 98.2% 100.0% 100.0% 100.0% 100.0% 100.0% 100.0% 95.1% 100.0% 100.0% 100.0%
100.0% 100.0% 100.0% 100.0% 100.0% 92.8% - 100.0% 100.0% 100.0% 99.5% 89.2% 100.0% 100.0%
100.0% 100.0% 100.0% 100.0% - - - 100.0% 96.7% 100.0% 99.5% 89.2% 100.0% 100.0%
100.0% - 100.0% 100.0% - - - 100.0% 97.8% 100.0% 95.2% 89.2% 100.0% 100.0%
- - 100.0% 100.0% - - - 96.7% 100.0% 100.0% 97.6% 89.3% 96.6% 100.0%
- - 100.0% 100.0% - - - 97.3% 99.3% 100.0% 97.5% 89.3% 100.0% 100.0%
- - 100.0% 100.0% - - - 95.9% 99.2% 100.0% 88.7% 92.8% 100.0% 100.0%
- - 91.7% 100.0% - - - 94.9% 100.0% 96.4% 94.7% 92.8% 100.0% 100.0%
- - 100.0% 100.0% - - - 97.5% 100.0% 94.4% 98.5% 92.8% 99.3% 91.3%
- - 100.0% 100.0% - - - 96.5% 100.0% 91.9% 95.8% 92.8% 100.0% 100.0%
184days 184days 184days 184days 184days 184days 122days 184days 184days 184days 184days 184days 184days 184days
109,808 90,247 69,770 314,906 436,758 271,887 350,493 308,096 217,849 95,436 190,732 71,968 190,607 193,887
85,210 72,842 60,339 258,240 401,666 237,384 322,381 250,481 186,941 81,126 164,353 58,202 166,105 173,436
24,598 17,404 9,430 56,666 35,092 34,502 28,112 57,615 30,907 14,309 26,379 13,765 24,501 20,451
41,613 29,803 14,592 80,662 146,040 60,235 47,859 124,511 103,873 31,021 55,867 28,144 57,193 95,549
19,383 7,430 4,125 20,331 38,599 28,766 24,780 69,882 19,796 11,318 15,203 7,163 18,297 15,701
9,584 8,729 4,558 21,301 37,388 0 18 21,330 22,664 6,873 10,556 4,355 20,250 11,336
5,680 11,247 4,580 20,226 60,745 20,502 20,633 24,787 20,324 9,712 24,238 8,675 16,056 15,526
3,277 1,591 295 17,875 6,987 1,554 175 5,879 38,720 1,262 2,712 809 2,144 2,919
142 65 37 228 726 431 238 1,144 378 173 329 127 260 273
3,544 739 995 697 1,593 8,980 2,012 1,485 1,989 1,681 2,827 7,013 184 49,790
68,195 60,444 55,177 234,244 290,718 211,651 302,633 183,585 113,975 64,414 134,865 43,823 133,413 98,338
9,708 7,803 9,372 35,525 39,879 56,192 51,017 52,474 31,830 20,055 38,375 13,917 72,513 53,595
58,487 52,641 45,805 198,719 250,838 155,459 251,616 131,111 82,145 44,359 96,489 29,906 60,900 44,742
- - 3,202 3,071 15,943 22,810 - 2,157 33,122 4,354 19,233 1,123 340 114
68,195 60,444 51,975 231,172 274,774 188,841 302,633 181,428 80,853 60,060 115,632 42,699 133,073 98,224
37.9% 33.0% 20.9% 25.6% 33.4% 22.2% 13.7% 40.4% 47.7% 32.5% 29.3% 39.1% 30.0% 49.3%
19,168 17,458 9,115 43,271 74,776 53,086 57,107 42,661 45,328 13,746 21,113 8,711 40,504 22,673
3,632 3,075 2,549 11,207 2,840 9,868 13,329 10,034 6,771 3,262 6,644 2,363 6,612 5,963
3.3% 3.4% 3.7% 3.6% 0.7% 3.6% 3.8% 3.3% 3.1% 3.4% 3.5% 3.3% 3.5% 3.1%
180,148 57,209 47,520 197,767 750,371 124,369 83,362 856,430 375,354 128,121 291,937 131,582 202,897 170,520
15,012 4,767 3,960 16,480 62,530 10,364 6,946 71,369 31,279 10,676 24,328 10,965 16,908 14,210
A058 KDX Nagoya Sakae Building: The land portion of KDX Nagoya Sakae Building was acquired on April 25, 2008.
A069 KDX Kobayashi-Doshomachi Building: The rent for land to the land owner (Kobayashi Pharmaceutical Co., Ltd.) is stipulated according to specific terms
under the land lease agreement and the annual rent to be paid is 94.3 million yen until the end of August 2019.
- 48 -
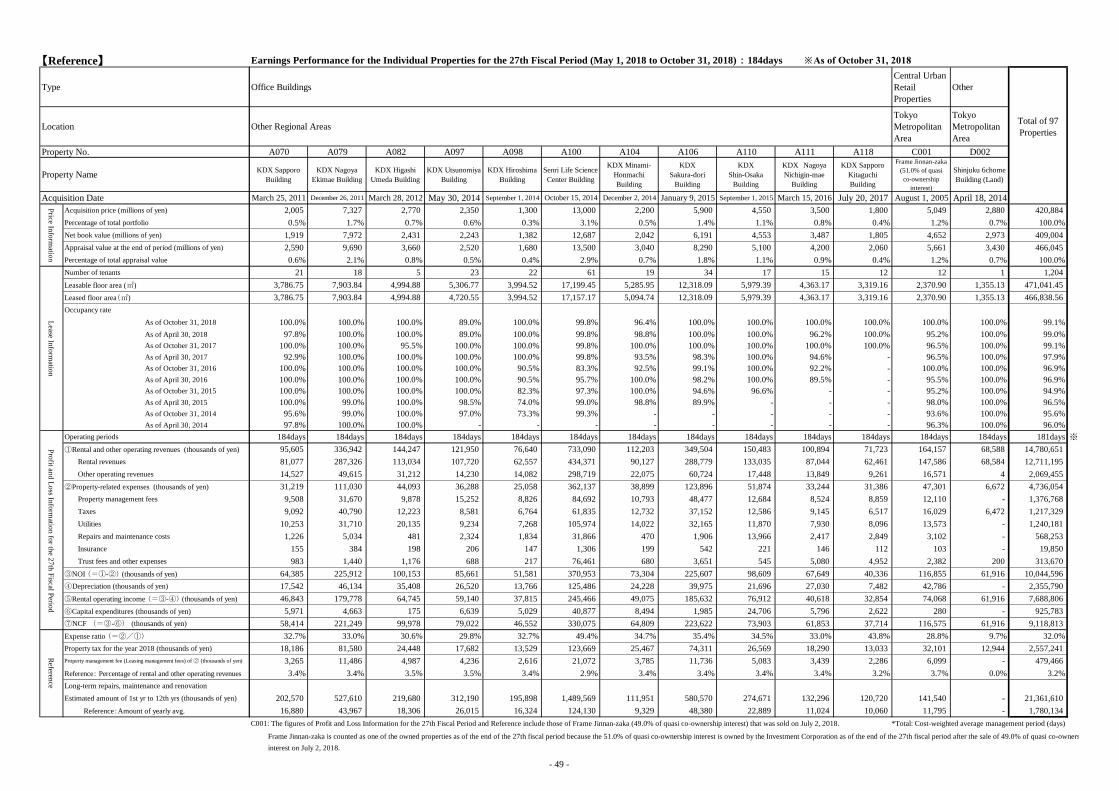
【Reference】
Type
Location
Property No.
Property Name
Acquisition Date
Acquisition price (millions of yen)
Percentage of total portfolio
Net book value (millions of yen)
Appraisal value at the end of period (millions of yen)
Percentage of total appraisal value
Number of tenants
Leasable floor area (㎡)
Leased floor area(㎡)
Occupancy rate
As of October 31, 2018
As of April 30, 2018
As of October 31, 2017
As of April 30, 2017
As of October 31, 2016
As of April 30, 2016
As of October 31, 2015
As of April 30, 2015
As of October 31, 2014
As of April 30, 2014
Operating periods
①Rental and other operating revenues (thousands of yen)
Rental revenues
Other operating revenues
②Property-related expenses (thousands of yen)
Property management fees
Taxes
Utilities
Repairs and maintenance costs
Insurance
Trust fees and other expenses
③NOI (=①-②) (thousands of yen)
④Depreciation (thousands of yen)
⑤Rental operating income (=③-④) (thousands of yen)
⑥Capital expenditures (thousands of yen)
⑦NCF (=③-⑥) (thousands of yen)
Expense ratio (=②/①)
Property tax for the year 2018 (thousands of yen)
Property management fee (Leasing management fees) of ② (thousands of yen)
Reference: Percentage of rental and other operating revenues
Long-term repairs, maintenance and renovation
Estimated amount of 1st yr to 12th yrs (thousands of yen)
Reference:Amount of yearly avg.
Price In
form
ation
Lease In
form
ation
Pro
fit and
Lo
ss Info
rmatio
n fo
r the 2
7th
Fiscal P
eriod
Referen
ce
Earnings Performance for the Individual Properties for the 27th Fiscal Period (May 1, 2018 to October 31, 2018):184days ※As of October 31, 2018
Office Buildings
Central Urban
Retail
Properties
Other
Other Regional Areas
Tokyo
Metropolitan
Area
Tokyo
Metropolitan
Area
Total of 97
Properties
A070 A079 A082 A097 A098 A100 A104 A106 A110 A111 A118 C001 D002
KDX Sapporo
Building
KDX Nagoya
Ekimae Building
KDX Higashi
Umeda Building
KDX Utsunomiya
Building
KDX Hiroshima
Building
Senri Life Science
Center Building
KDX Minami-
Honmachi
Building
KDX
Sakura-dori
Building
KDX
Shin-Osaka
Building
KDX Nagoya
Nichigin-mae
Building
KDX Sapporo
Kitaguchi
Building
Frame Jinnan-zaka
(51.0% of quasi
co-ownership
interest)
Shinjuku 6chome
Building (Land)
March 25, 2011 December 26, 2011 March 28, 2012 May 30, 2014 September 1, 2014 October 15, 2014 December 2, 2014 January 9, 2015 September 1, 2015 March 15, 2016 July 20, 2017 August 1, 2005 April 18, 2014
2,005 7,327 2,770 2,350 1,300 13,000 2,200 5,900 4,550 3,500 1,800 5,049 2,880 420,884
0.5% 1.7% 0.7% 0.6% 0.3% 3.1% 0.5% 1.4% 1.1% 0.8% 0.4% 1.2% 0.7% 100.0%
1,919 7,972 2,431 2,243 1,382 12,687 2,042 6,191 4,553 3,487 1,805 4,652 2,973 409,004
2,590 9,690 3,660 2,520 1,680 13,500 3,040 8,290 5,100 4,200 2,060 5,661 3,430 466,045
0.6% 2.1% 0.8% 0.5% 0.4% 2.9% 0.7% 1.8% 1.1% 0.9% 0.4% 1.2% 0.7% 100.0%
21 18 5 23 22 61 19 34 17 15 12 12 1 1,204
3,786.75 7,903.84 4,994.88 5,306.77 3,994.52 17,199.45 5,285.95 12,318.09 5,979.39 4,363.17 3,319.16 2,370.90 1,355.13 471,041.45
3,786.75 7,903.84 4,994.88 4,720.55 3,994.52 17,157.17 5,094.74 12,318.09 5,979.39 4,363.17 3,319.16 2,370.90 1,355.13 466,838.56
100.0% 100.0% 100.0% 89.0% 100.0% 99.8% 96.4% 100.0% 100.0% 100.0% 100.0% 100.0% 100.0% 99.1%
97.8% 100.0% 100.0% 89.0% 100.0% 99.8% 98.8% 100.0% 100.0% 96.2% 100.0% 95.2% 100.0% 99.0%
100.0% 100.0% 95.5% 100.0% 100.0% 99.8% 100.0% 100.0% 100.0% 100.0% 100.0% 96.5% 100.0% 99.1%
92.9% 100.0% 100.0% 100.0% 100.0% 99.8% 93.5% 98.3% 100.0% 94.6% - 96.5% 100.0% 97.9%
100.0% 100.0% 100.0% 100.0% 90.5% 83.3% 92.5% 99.1% 100.0% 92.2% - 100.0% 100.0% 96.9%
100.0% 100.0% 100.0% 100.0% 90.5% 95.7% 100.0% 98.2% 100.0% 89.5% - 95.5% 100.0% 96.9%
100.0% 100.0% 100.0% 100.0% 82.3% 97.3% 100.0% 94.6% 96.6% - - 95.2% 100.0% 94.9%
100.0% 99.0% 100.0% 98.5% 74.0% 99.0% 98.8% 89.9% - - - 98.0% 100.0% 96.5%
95.6% 99.0% 100.0% 97.0% 73.3% 99.3% - - - - - 93.6% 100.0% 95.6%
97.8% 100.0% 100.0% - - - - - - - - 96.3% 100.0% 96.0%
184days 184days 184days 184days 184days 184days 184days 184days 184days 184days 184days 184days 184days 181days ※
95,605 336,942 144,247 121,950 76,640 733,090 112,203 349,504 150,483 100,894 71,723 164,157 68,588 14,780,651
81,077 287,326 113,034 107,720 62,557 434,371 90,127 288,779 133,035 87,044 62,461 147,586 68,584 12,711,195
14,527 49,615 31,212 14,230 14,082 298,719 22,075 60,724 17,448 13,849 9,261 16,571 4 2,069,455
31,219 111,030 44,093 36,288 25,058 362,137 38,899 123,896 51,874 33,244 31,386 47,301 6,672 4,736,054
9,508 31,670 9,878 15,252 8,826 84,692 10,793 48,477 12,684 8,524 8,859 12,110 - 1,376,768
9,092 40,790 12,223 8,581 6,764 61,835 12,732 37,152 12,586 9,145 6,517 16,029 6,472 1,217,329
10,253 31,710 20,135 9,234 7,268 105,974 14,022 32,165 11,870 7,930 8,096 13,573 - 1,240,181
1,226 5,034 481 2,324 1,834 31,866 470 1,906 13,966 2,417 2,849 3,102 - 568,253
155 384 198 206 147 1,306 199 542 221 146 112 103 - 19,850
983 1,440 1,176 688 217 76,461 680 3,651 545 5,080 4,952 2,382 200 313,670
64,385 225,912 100,153 85,661 51,581 370,953 73,304 225,607 98,609 67,649 40,336 116,855 61,916 10,044,596
17,542 46,134 35,408 26,520 13,766 125,486 24,228 39,975 21,696 27,030 7,482 42,786 - 2,355,790
46,843 179,778 64,745 59,140 37,815 245,466 49,075 185,632 76,912 40,618 32,854 74,068 61,916 7,688,806
5,971 4,663 175 6,639 5,029 40,877 8,494 1,985 24,706 5,796 2,622 280 - 925,783
58,414 221,249 99,978 79,022 46,552 330,075 64,809 223,622 73,903 61,853 37,714 116,575 61,916 9,118,813
32.7% 33.0% 30.6% 29.8% 32.7% 49.4% 34.7% 35.4% 34.5% 33.0% 43.8% 28.8% 9.7% 32.0%
18,186 81,580 24,448 17,682 13,529 123,669 25,467 74,311 26,569 18,290 13,033 32,101 12,944 2,557,241
3,265 11,486 4,987 4,236 2,616 21,072 3,785 11,736 5,083 3,439 2,286 6,099 - 479,466
3.4% 3.4% 3.5% 3.5% 3.4% 2.9% 3.4% 3.4% 3.4% 3.4% 3.2% 3.7% 0.0% 3.2%
202,570 527,610 219,680 312,190 195,898 1,489,569 111,951 580,570 274,671 132,296 120,720 141,540 - 21,361,610
16,880 43,967 18,306 26,015 16,324 124,130 9,329 48,380 22,889 11,024 10,060 11,795 - 1,780,134
C001: The figures of Profit and Loss Information for the 27th Fiscal Period and Reference include those of Frame Jinnan-zaka (49.0% of quasi co-ownership interest) that was sold on July 2, 2018. *Total: Cost-weighted average management period (days)
Frame Jinnan-zaka is counted as one of the owned properties as of the end of the 27th fiscal period because the 51.0% of quasi co-ownership interest is owned by the Investment Corporation as of the end of the 27th fiscal period after the sale of 49.0% of quasi co-ownership
interest on July 2, 2018.
- 49 -
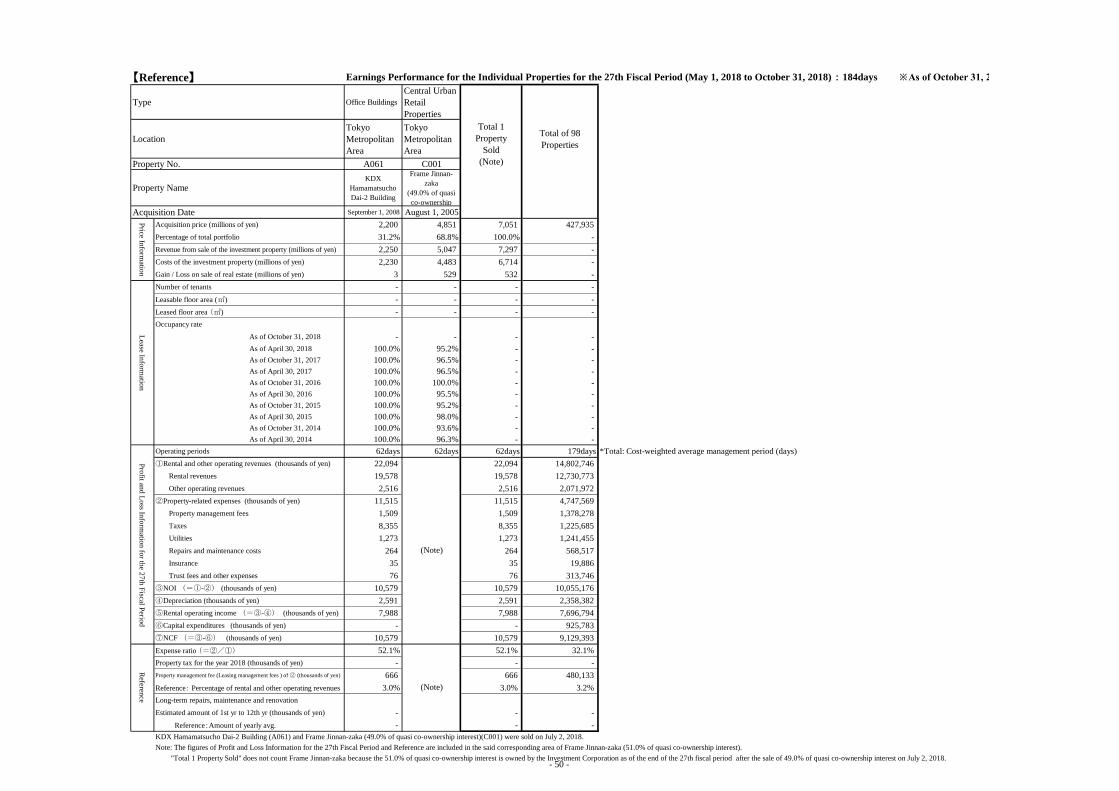
【Reference】 Earnings Performance for the Individual Properties for the 27th Fiscal Period (May 1, 2018 to October 31, 2018):184days ※As of October 31, 2018
Type Office Buildings
Central Urban
Retail
Properties
Location
Tokyo
Metropolitan
Area
Tokyo
Metropolitan
Area
Total of 98
Properties
Property No. A061 C001
Property NameKDX
Hamamatsucho
Dai-2 Building
Frame Jinnan-
zaka
(49.0% of quasi
co-ownership
Acquisition Date September 1, 2008 August 1, 2005
Acquisition price (millions of yen) 2,200 4,851 7,051 427,935
Percentage of total portfolio 31.2% 68.8% 100.0% -
Revenue from sale of the investment property (millions of yen) 2,250 5,047 7,297 -
Costs of the investment property (millions of yen) 2,230 4,483 6,714 -
Gain / Loss on sale of real estate (millions of yen) 3 529 532 -
Number of tenants - - - -
Leasable floor area (㎡) - - - -
Leased floor area (㎡) - - - -
Occupancy rate
As of October 31, 2018 - - - -
As of April 30, 2018 100.0% 95.2% - -
As of October 31, 2017 100.0% 96.5% - -
As of April 30, 2017 100.0% 96.5% - -
As of October 31, 2016 100.0% 100.0% - -
As of April 30, 2016 100.0% 95.5% - -
As of October 31, 2015 100.0% 95.2% - -
As of April 30, 2015 100.0% 98.0% - -
As of October 31, 2014 100.0% 93.6% - -
As of April 30, 2014 100.0% 96.3% - -
Operating periods 62days 62days 62days 179days *Total: Cost-weighted average management period (days)
①Rental and other operating revenues (thousands of yen) 22,094 22,094 14,802,746
Rental revenues 19,578 19,578 12,730,773
Other operating revenues 2,516 2,516 2,071,972
②Property-related expenses (thousands of yen) 11,515 11,515 4,747,569
Property management fees 1,509 1,509 1,378,278
Taxes 8,355 8,355 1,225,685
Utilities 1,273 1,273 1,241,455
Repairs and maintenance costs 264 264 568,517
Insurance 35 35 19,886
Trust fees and other expenses 76 76 313,746
③NOI (=①-②) (thousands of yen) 10,579 10,579 10,055,176
④Depreciation (thousands of yen) 2,591 2,591 2,358,382
⑤Rental operating income (=③-④) (thousands of yen) 7,988 7,988 7,696,794
⑥Capital expenditures (thousands of yen) - - 925,783
⑦NCF (=③-⑥) (thousands of yen) 10,579 10,579 9,129,393
Expense ratio (=②/①) 52.1% 52.1% 32.1%
Property tax for the year 2018 (thousands of yen) - - -
Property management fee (Leasing management fees ) of ② (thousands of yen) 666 666 480,133
Reference: Percentage of rental and other operating revenues 3.0% 3.0% 3.2%
Long-term repairs, maintenance and renovation
Estimated amount of 1st yr to 12th yr (thousands of yen) - - -
Reference:Amount of yearly avg. - - -
KDX Hamamatsucho Dai-2 Building (A061) and Frame Jinnan-zaka (49.0% of quasi co-ownership interest)(C001) were sold on July 2, 2018.
Note: The figures of Profit and Loss Information for the 27th Fiscal Period and Reference are included in the said corresponding area of Frame Jinnan-zaka (51.0% of quasi co-ownership interest).
"Total 1 Property Sold" does not count Frame Jinnan-zaka because the 51.0% of quasi co-ownership interest is owned by the Investment Corporation as of the end of the 27th fiscal period after the sale of 49.0% of quasi co-ownership interest on July 2, 2018.
Total 1
Property
Sold
(Note)
(Note)
(Note)
Price In
form
ation
Lease In
form
ation
Pro
fit and
Lo
ss Info
rmatio
n fo
r the 2
7th
Fiscal P
eriod
Referen
ce
- 50 -
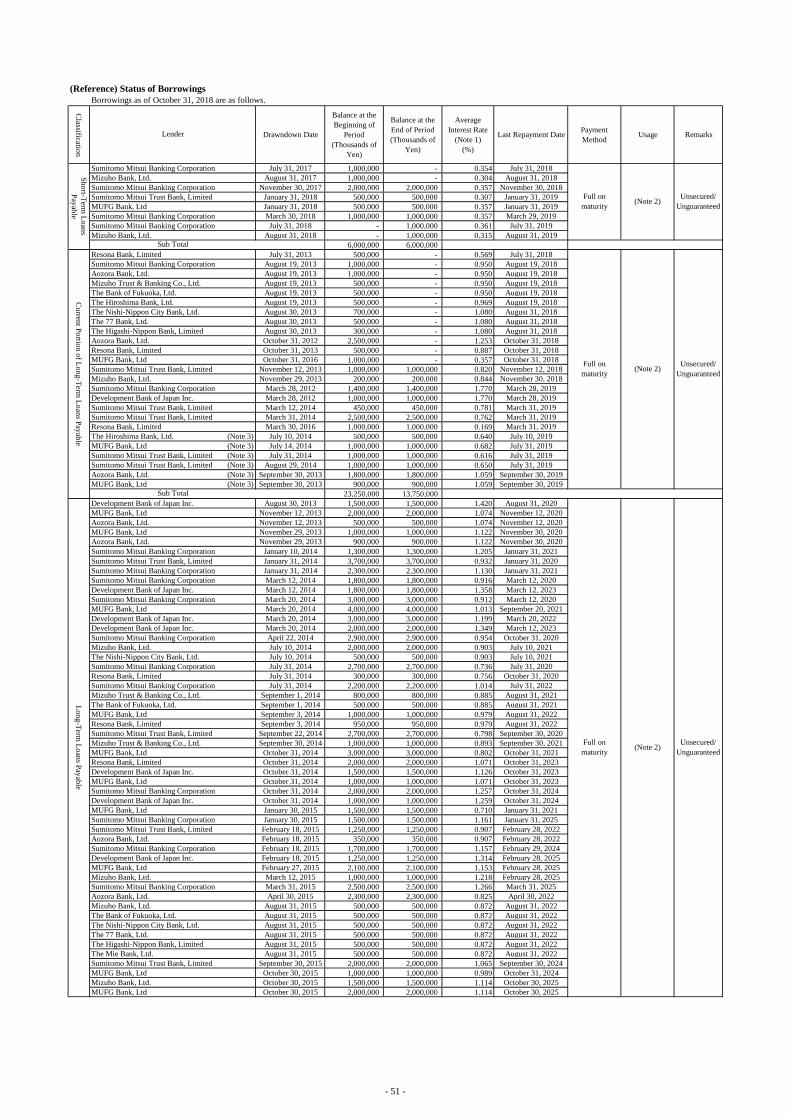
(Reference) Status of Borrowings
Borrowings as of October 31, 2018 are as follows.
Classificatio
n
Drawndown Date
Balance at the
Beginning of
Period
(Thousands of
Yen)
Balance at the
End of Period
(Thousands of
Yen)
Average
Interest Rate
(Note 1)
(%)
Last Repayment DatePayment
MethodUsage Remarks
Sumitomo Mitsui Banking Corporation July 31, 2017 1,000,000 - 0.354 July 31, 2018
Mizuho Bank, Ltd. August 31, 2017 1,000,000 - 0.304 August 31, 2018
Sumitomo Mitsui Banking Corporation November 30, 2017 2,000,000 2,000,000 0.357 November 30, 2018
Sumitomo Mitsui Trust Bank, Limited January 31, 2018 500,000 500,000 0.307 January 31, 2019
MUFG Bank, Ltd January 31, 2018 500,000 500,000 0.357 January 31, 2019
Sumitomo Mitsui Banking Corporation March 30, 2018 1,000,000 1,000,000 0.357 March 29, 2019
Sumitomo Mitsui Banking Corporation July 31, 2018 - 1,000,000 0.361 July 31, 2019
Mizuho Bank, Ltd. August 31, 2018 - 1,000,000 0.315 August 31, 2019
6,000,000 6,000,000
Resona Bank, Limited July 31, 2013 500,000 - 0.569 July 31, 2018
Sumitomo Mitsui Banking Corporation August 19, 2013 1,000,000 - 0.950 August 19, 2018
Aozora Bank, Ltd. August 19, 2013 1,000,000 - 0.950 August 19, 2018
Mizuho Trust & Banking Co., Ltd. August 19, 2013 500,000 - 0.950 August 19, 2018
The Bank of Fukuoka, Ltd. August 19, 2013 500,000 - 0.950 August 19, 2018
The Hiroshima Bank, Ltd. August 19, 2013 500,000 - 0.969 August 19, 2018
The Nishi-Nippon City Bank, Ltd. August 30, 2013 700,000 - 1.080 August 31, 2018
The 77 Bank, Ltd. August 30, 2013 500,000 - 1.080 August 31, 2018
The Higashi-Nippon Bank, Limited August 30, 2013 300,000 - 1.080 August 31, 2018
Aozora Bank, Ltd. October 31, 2012 2,500,000 - 1.253 October 31, 2018
Resona Bank, Limited October 31, 2013 500,000 - 0.887 October 31, 2018
MUFG Bank, Ltd October 31, 2016 1,000,000 - 0.357 October 31, 2018
Sumitomo Mitsui Trust Bank, Limited November 12, 2013 1,000,000 1,000,000 0.820 November 12, 2018
Mizuho Bank, Ltd. November 29, 2013 200,000 200,000 0.844 November 30, 2018
Sumitomo Mitsui Banking Corporation March 28, 2012 1,400,000 1,400,000 1.770 March 28, 2019
Development Bank of Japan Inc. March 28, 2012 1,000,000 1,000,000 1.770 March 28, 2019
Sumitomo Mitsui Trust Bank, Limited March 12, 2014 450,000 450,000 0.781 March 31, 2019
Sumitomo Mitsui Trust Bank, Limited March 31, 2014 2,500,000 2,500,000 0.762 March 31, 2019
Resona Bank, Limited March 30, 2016 1,000,000 1,000,000 0.169 March 31, 2019
The Hiroshima Bank, Ltd. (Note 3) July 10, 2014 500,000 500,000 0.640 July 10, 2019
MUFG Bank, Ltd (Note 3) July 14, 2014 1,000,000 1,000,000 0.682 July 31, 2019
Sumitomo Mitsui Trust Bank, Limited (Note 3) July 31, 2014 1,000,000 1,000,000 0.616 July 31, 2019
Sumitomo Mitsui Trust Bank, Limited (Note 3) August 29, 2014 1,000,000 1,000,000 0.650 July 31, 2019
Aozora Bank, Ltd. (Note 3) September 30, 2013 1,800,000 1,800,000 1.059 September 30, 2019
MUFG Bank, Ltd (Note 3) September 30, 2013 900,000 900,000 1.059 September 30, 2019
23,250,000 13,750,000
Development Bank of Japan Inc. August 30, 2013 1,500,000 1,500,000 1.420 August 31, 2020
MUFG Bank, Ltd November 12, 2013 2,000,000 2,000,000 1.074 November 12, 2020
Aozora Bank, Ltd. November 12, 2013 500,000 500,000 1.074 November 12, 2020
MUFG Bank, Ltd November 29, 2013 1,000,000 1,000,000 1.122 November 30, 2020
Aozora Bank, Ltd. November 29, 2013 900,000 900,000 1.122 November 30, 2020
Sumitomo Mitsui Banking Corporation January 10, 2014 1,300,000 1,300,000 1.205 January 31, 2021
Sumitomo Mitsui Trust Bank, Limited January 31, 2014 3,700,000 3,700,000 0.932 January 31, 2020
Sumitomo Mitsui Banking Corporation January 31, 2014 2,300,000 2,300,000 1.130 January 31, 2021
Sumitomo Mitsui Banking Corporation March 12, 2014 1,800,000 1,800,000 0.916 March 12, 2020
Development Bank of Japan Inc. March 12, 2014 1,800,000 1,800,000 1.358 March 12, 2023
Sumitomo Mitsui Banking Corporation March 20, 2014 3,000,000 3,000,000 0.912 March 12, 2020
MUFG Bank, Ltd March 20, 2014 4,000,000 4,000,000 1.013 September 20, 2021
Development Bank of Japan Inc. March 20, 2014 3,000,000 3,000,000 1.199 March 20, 2022
Development Bank of Japan Inc. March 20, 2014 2,000,000 2,000,000 1.349 March 12, 2023
Sumitomo Mitsui Banking Corporation April 22, 2014 2,900,000 2,900,000 0.954 October 31, 2020
Mizuho Bank, Ltd. July 10, 2014 2,000,000 2,000,000 0.903 July 10, 2021
The Nishi-Nippon City Bank, Ltd. July 10, 2014 500,000 500,000 0.903 July 10, 2021
Sumitomo Mitsui Banking Corporation July 31, 2014 2,700,000 2,700,000 0.736 July 31, 2020
Resona Bank, Limited July 31, 2014 300,000 300,000 0.756 October 31, 2020
Sumitomo Mitsui Banking Corporation July 31, 2014 2,200,000 2,200,000 1.014 July 31, 2022
Mizuho Trust & Banking Co., Ltd. September 1, 2014 800,000 800,000 0.885 August 31, 2021
The Bank of Fukuoka, Ltd. September 1, 2014 500,000 500,000 0.885 August 31, 2021
MUFG Bank, Ltd September 3, 2014 1,000,000 1,000,000 0.979 August 31, 2022
Resona Bank, Limited September 3, 2014 950,000 950,000 0.979 August 31, 2022
Sumitomo Mitsui Trust Bank, Limited September 22, 2014 2,700,000 2,700,000 0.798 September 30, 2020
Mizuho Trust & Banking Co., Ltd. September 30, 2014 1,000,000 1,000,000 0.893 September 30, 2021
MUFG Bank, Ltd October 31, 2014 3,000,000 3,000,000 0.802 October 31, 2021
Resona Bank, Limited October 31, 2014 2,000,000 2,000,000 1.071 October 31, 2023
Development Bank of Japan Inc. October 31, 2014 1,500,000 1,500,000 1.126 October 31, 2023
MUFG Bank, Ltd October 31, 2014 1,000,000 1,000,000 1.071 October 31, 2023
Sumitomo Mitsui Banking Corporation October 31, 2014 2,000,000 2,000,000 1.257 October 31, 2024
Development Bank of Japan Inc. October 31, 2014 1,000,000 1,000,000 1.259 October 31, 2024
MUFG Bank, Ltd January 30, 2015 1,500,000 1,500,000 0.710 January 31, 2021
Sumitomo Mitsui Banking Corporation January 30, 2015 1,500,000 1,500,000 1.161 January 31, 2025
Sumitomo Mitsui Trust Bank, Limited February 18, 2015 1,250,000 1,250,000 0.907 February 28, 2022
Aozora Bank, Ltd. February 18, 2015 350,000 350,000 0.907 February 28, 2022
Sumitomo Mitsui Banking Corporation February 18, 2015 1,700,000 1,700,000 1.157 February 29, 2024
Development Bank of Japan Inc. February 18, 2015 1,250,000 1,250,000 1.314 February 28, 2025
MUFG Bank, Ltd February 27, 2015 2,100,000 2,100,000 1.153 February 28, 2025
Mizuho Bank, Ltd. March 12, 2015 1,000,000 1,000,000 1.218 February 28, 2025
Sumitomo Mitsui Banking Corporation March 31, 2015 2,500,000 2,500,000 1.266 March 31, 2025
Aozora Bank, Ltd. April 30, 2015 2,300,000 2,300,000 0.825 April 30, 2022
Mizuho Bank, Ltd. August 31, 2015 500,000 500,000 0.872 August 31, 2022
The Bank of Fukuoka, Ltd. August 31, 2015 500,000 500,000 0.872 August 31, 2022
The Nishi-Nippon City Bank, Ltd. August 31, 2015 500,000 500,000 0.872 August 31, 2022
The 77 Bank, Ltd. August 31, 2015 500,000 500,000 0.872 August 31, 2022
The Higashi-Nippon Bank, Limited August 31, 2015 500,000 500,000 0.872 August 31, 2022
The Mie Bank, Ltd. August 31, 2015 500,000 500,000 0.872 August 31, 2022
Sumitomo Mitsui Trust Bank, Limited September 30, 2015 2,000,000 2,000,000 1.065 September 30, 2024
MUFG Bank, Ltd October 30, 2015 1,000,000 1,000,000 0.989 October 31, 2024
Mizuho Bank, Ltd. October 30, 2015 1,500,000 1,500,000 1.114 October 30, 2025
MUFG Bank, Ltd October 30, 2015 2,000,000 2,000,000 1.114 October 30, 2025
Lo
ng
-Term
Lo
ans P
ayab
le
Full on
maturity(Note 2)
Unsecured/
Unguaranteed
Lender
Sh
ort-T
erm L
oan
s
Pay
able
Cu
rrent P
ortio
n o
f Lo
ng
-Term
Lo
ans P
ayab
le
Sub Total
Full on
maturity
Sub Total
Unsecured/
Unguaranteed
Full on
maturity(Note 2)
Unsecured/
Unguaranteed
(Note 2)
- 51 -
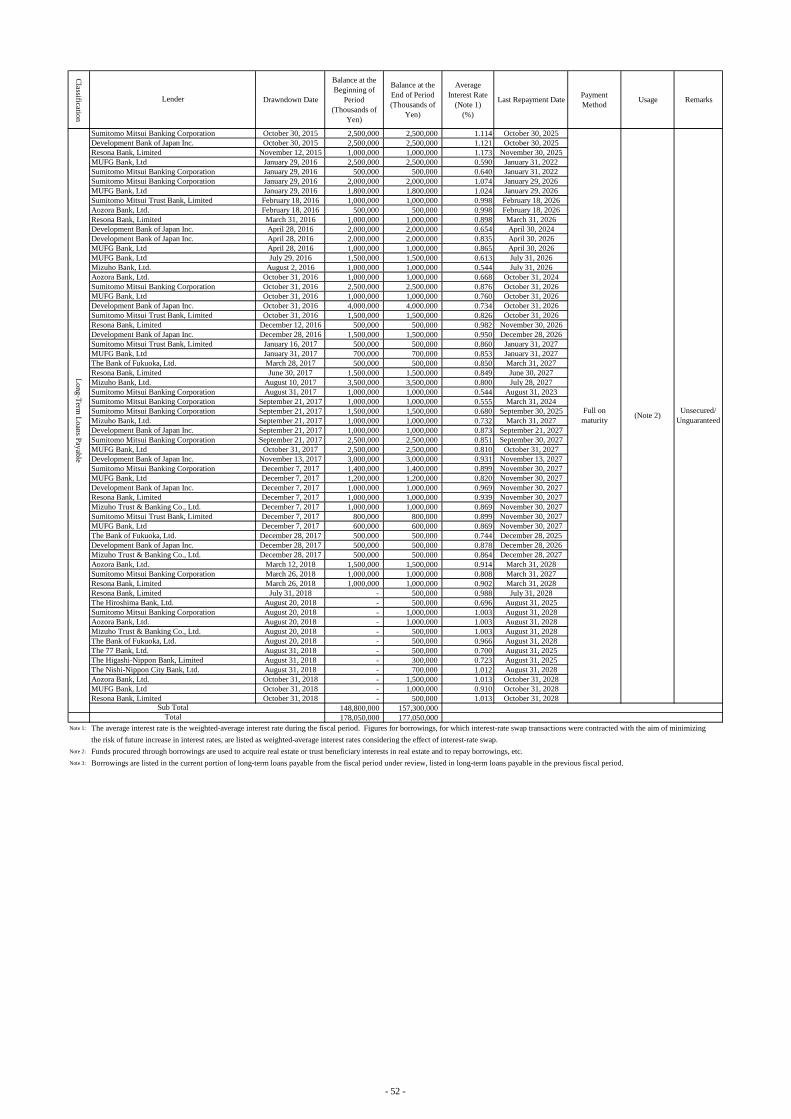
Classificatio
n
Drawndown Date
Balance at the
Beginning of
Period
(Thousands of
Yen)
Balance at the
End of Period
(Thousands of
Yen)
Average
Interest Rate
(Note 1)
(%)
Last Repayment DatePayment
MethodUsage RemarksLender
Sumitomo Mitsui Banking Corporation October 30, 2015 2,500,000 2,500,000 1.114 October 30, 2025
Development Bank of Japan Inc. October 30, 2015 2,500,000 2,500,000 1.121 October 30, 2025
Resona Bank, Limited November 12, 2015 1,000,000 1,000,000 1.173 November 30, 2025
MUFG Bank, Ltd January 29, 2016 2,500,000 2,500,000 0.590 January 31, 2022
Sumitomo Mitsui Banking Corporation January 29, 2016 500,000 500,000 0.640 January 31, 2022
Sumitomo Mitsui Banking Corporation January 29, 2016 2,000,000 2,000,000 1.074 January 29, 2026
MUFG Bank, Ltd January 29, 2016 1,800,000 1,800,000 1.024 January 29, 2026
Sumitomo Mitsui Trust Bank, Limited February 18, 2016 1,000,000 1,000,000 0.998 February 18, 2026
Aozora Bank, Ltd. February 18, 2016 500,000 500,000 0.998 February 18, 2026
Resona Bank, Limited March 31, 2016 1,000,000 1,000,000 0.898 March 31, 2026
Development Bank of Japan Inc. April 28, 2016 2,000,000 2,000,000 0.654 April 30, 2024
Development Bank of Japan Inc. April 28, 2016 2,000,000 2,000,000 0.835 April 30, 2026
MUFG Bank, Ltd April 28, 2016 1,000,000 1,000,000 0.865 April 30, 2026
MUFG Bank, Ltd July 29, 2016 1,500,000 1,500,000 0.613 July 31, 2026
Mizuho Bank, Ltd. August 2, 2016 1,000,000 1,000,000 0.544 July 31, 2026
Aozora Bank, Ltd. October 31, 2016 1,000,000 1,000,000 0.668 October 31, 2024
Sumitomo Mitsui Banking Corporation October 31, 2016 2,500,000 2,500,000 0.876 October 31, 2026
MUFG Bank, Ltd October 31, 2016 1,000,000 1,000,000 0.760 October 31, 2026
Development Bank of Japan Inc. October 31, 2016 4,000,000 4,000,000 0.734 October 31, 2026
Sumitomo Mitsui Trust Bank, Limited October 31, 2016 1,500,000 1,500,000 0.826 October 31, 2026
Resona Bank, Limited December 12, 2016 500,000 500,000 0.982 November 30, 2026
Development Bank of Japan Inc. December 28, 2016 1,500,000 1,500,000 0.950 December 28, 2026
Sumitomo Mitsui Trust Bank, Limited January 16, 2017 500,000 500,000 0.860 January 31, 2027
MUFG Bank, Ltd January 31, 2017 700,000 700,000 0.853 January 31, 2027
The Bank of Fukuoka, Ltd. March 28, 2017 500,000 500,000 0.850 March 31, 2027
Resona Bank, Limited June 30, 2017 1,500,000 1,500,000 0.849 June 30, 2027
Mizuho Bank, Ltd. August 10, 2017 3,500,000 3,500,000 0.800 July 28, 2027
Sumitomo Mitsui Banking Corporation August 31, 2017 1,000,000 1,000,000 0.544 August 31, 2023
Sumitomo Mitsui Banking Corporation September 21, 2017 1,000,000 1,000,000 0.555 March 31, 2024
Sumitomo Mitsui Banking Corporation September 21, 2017 1,500,000 1,500,000 0.680 September 30, 2025
Mizuho Bank, Ltd. September 21, 2017 1,000,000 1,000,000 0.732 March 31, 2027
Development Bank of Japan Inc. September 21, 2017 1,000,000 1,000,000 0.873 September 21, 2027
Sumitomo Mitsui Banking Corporation September 21, 2017 2,500,000 2,500,000 0.851 September 30, 2027
MUFG Bank, Ltd October 31, 2017 2,500,000 2,500,000 0.810 October 31, 2027
Development Bank of Japan Inc. November 13, 2017 3,000,000 3,000,000 0.931 November 13, 2027
Sumitomo Mitsui Banking Corporation December 7, 2017 1,400,000 1,400,000 0.899 November 30, 2027
MUFG Bank, Ltd December 7, 2017 1,200,000 1,200,000 0.820 November 30, 2027
Development Bank of Japan Inc. December 7, 2017 1,000,000 1,000,000 0.969 November 30, 2027
Resona Bank, Limited December 7, 2017 1,000,000 1,000,000 0.939 November 30, 2027
Mizuho Trust & Banking Co., Ltd. December 7, 2017 1,000,000 1,000,000 0.869 November 30, 2027
Sumitomo Mitsui Trust Bank, Limited December 7, 2017 800,000 800,000 0.899 November 30, 2027
MUFG Bank, Ltd December 7, 2017 600,000 600,000 0.869 November 30, 2027
The Bank of Fukuoka, Ltd. December 28, 2017 500,000 500,000 0.744 December 28, 2025
Development Bank of Japan Inc. December 28, 2017 500,000 500,000 0.878 December 28, 2026
Mizuho Trust & Banking Co., Ltd. December 28, 2017 500,000 500,000 0.864 December 28, 2027
Aozora Bank, Ltd. March 12, 2018 1,500,000 1,500,000 0.914 March 31, 2028
Sumitomo Mitsui Banking Corporation March 26, 2018 1,000,000 1,000,000 0.808 March 31, 2027
Resona Bank, Limited March 26, 2018 1,000,000 1,000,000 0.902 March 31, 2028
Resona Bank, Limited July 31, 2018 - 500,000 0.988 July 31, 2028
The Hiroshima Bank, Ltd. August 20, 2018 - 500,000 0.696 August 31, 2025
Sumitomo Mitsui Banking Corporation August 20, 2018 - 1,000,000 1.003 August 31, 2028
Aozora Bank, Ltd. August 20, 2018 - 1,000,000 1.003 August 31, 2028
Mizuho Trust & Banking Co., Ltd. August 20, 2018 - 500,000 1.003 August 31, 2028
The Bank of Fukuoka, Ltd. August 20, 2018 - 500,000 0.966 August 31, 2028
The 77 Bank, Ltd. August 31, 2018 - 500,000 0.700 August 31, 2025
The Higashi-Nippon Bank, Limited August 31, 2018 - 300,000 0.723 August 31, 2025
The Nishi-Nippon City Bank, Ltd. August 31, 2018 - 700,000 1.012 August 31, 2028
Aozora Bank, Ltd. October 31, 2018 - 1,500,000 1.013 October 31, 2028
MUFG Bank, Ltd October 31, 2018 - 1,000,000 0.910 October 31, 2028
Resona Bank, Limited October 31, 2018 - 500,000 1.013 October 31, 2028
148,800,000 157,300,000
178,050,000 177,050,000
Note 1: The average interest rate is the weighted-average interest rate during the fiscal period. Figures for borrowings, for which interest-rate swap transactions were contracted with the aim of minimizing
the risk of future increase in interest rates, are listed as weighted-average interest rates considering the effect of interest-rate swap.
Note 2: Funds procured through borrowings are used to acquire real estate or trust beneficiary interests in real estate and to repay borrowings, etc.
Note 3: Borrowings are listed in the current portion of long-term loans payable from the fiscal period under review, listed in long-term loans payable in the previous fiscal period.
TotalL
on
g-T
erm L
oan
s Pay
able
Sub Total
Full on
maturity(Note 2)
Unsecured/
Unguaranteed
- 52 -