1 physics of the first atlas data - lost-contact.mit.edu
TRANSCRIPT

1 Physics of the First ATLAS Data1
The start up of the LHC has signaled the shift of energy frontier from Fermilab to CERN. After2
a brief period of running at pp center-of-mass energies (√
s) of 900 GeV and 2.36 TeV, the LHC3
operated at 7 TeV for much of 2010 delivering 49 pb−1 integrated luminosity to ATLAS. Among4
these, 45 pb−1 was recorded by ATLAS representing an impressive DAQ efficiency of 92%. The5
University of Michigan ATLAS group is fully engaged in the timely studies of the LHC data. Our6
activities cover detector and object performance studies, measurements of W , Z and WW production7
cross sections, studies of B physics and hyperons as well as searches for the Standard Model (SM)8
Higgs boson, supersymmetry and other new physics beyond the SM. We are major contributors and9
in many cases leaders of these analyses, largely due to the dedications of the members of the group.10
These activities are summarized below.11
1

1.1 Measurements of W and Z Boson Production Cross Sections12
W and Z bosons with their leptonic decays are standard candles at hadron colliders. They are13
ideal for studying detector performance, particularly for understanding lepton identifications and14
the measurement of transverse momentum imbalance ( 6ET ). Moreover, they offer important testbeds15
of precision electroweak physics as well as perturbative QCD. They are the prerequisite of any other16
physics with high transverse momentum (pT ) leptons and are among the first to be studied at a new17
collider such as the LHC. The University of Michigan group is proud to be a major contributor18
to the first ATLAS publication on the W and Z cross section measurements and the subsequent19
precision measurement of the Z pT distributions. We are probably the only group in ATLAS that20
made critical contributions in both electron and muon final states.21
1.1.1 Inclusive W and Z Cross Sections22
The W and Z bosons are expected to be produced abundantly in pp collisions at√
s = 7 TeV. In23
contrast to pp collisions, the cross sections for W+ and W− are expected to be different in pp24
collisions due to different valence quark distributions of the u and d quarks. The expected large25
dataset and the high LHC energy will allow for detailed measurements of W and Z production26
properties in a previously unexplored energy regime. These conditions, together with the pp nature27
of the collisions, will provide new constraints on the parton distribution functions and will allow28
for precise tests of perturbative QCD. Besides the measurements of the W and Z boson production29
cross sections, the measurement of their ratio R and the asymmetry between the W+ and W− cross30
sections provide important tests of the Standard Model. The ratio R can be measured with a higher31
relative precision because both experimental and theoretical uncertainties partially cancel.32
The first ATLAS measurement of the inclusive W and Z production cross sections was pub-33
lished in 2010 [1]. The analysis was based on a dataset corresponding to 320 nb−1 of integrated34
luminosity. We made major contributions to the event selection, trigger efficiency studies, back-35
ground determinations and systematic uncertainty estimations. Contributing group members are36
Hao Liu, Jonas Strandberg and Jianming Qian for the electron final-state and Xuefei Li, Jianbei37
Liu, Yuesheng Wu, Haijun Yang, Tiesheng Dai, Rudi Thun, Bing Zhou and Junjie Zhu for the38
muon final-state. Strandberg served as the editor of the electron supporting note and Qian is a ma-39
jor contributor to the theoretical predictions. Based on 2250 W → `ν and 179 Z → `` candidates40
after the final selection, the cross sections are measured to be41
σWtot ×BR(W → `ν) = 9.96±0.23(stat)±0.50(syst)±1.10(lumi)nb42
σγ∗/Ztot ×BR(Z → ``) = 0.82±0.06(stat)±0.05(syst)±0.09(lumi)nb43
The W± and Z cross sections are compared to their predictions from the next-next-to-leading-44
order (NNLO) QCD calculation as well as the previous measurements at pp and pp colliders in45
Figure 1. The measured cross section ratios of R`(W+/Z), R`(W−/Z) and R`(W/Z) are also found46
in good agreements with theoretical predictions.47
We have continued our work in the muon final state. Our students Xuefei Li and John Purdham48
will write their thesis on the measurements of W → µν and Z → µµ cross sections respectively,49
based on the full 2010 LHC dataset. From an integrated luminosity of XX pb−1 after the data50
quality requirement, we have selected XXX W → µν events and XXX Z → µµ events. The observed51
transverse mass distribution of W → µν candidates is compared with MC simulations in Fig. 2 (left).52
2

[TeV] s1 10
) [n
b]
ν l
→ B
r(W
× Wσ
-110
1
10
)pW (p
W (pp)
(pp)+W
(pp)-W
= 7 TeV)sData 2010 (
-1 L dt = 310-315 nb∫ν l→W
ν+ l→+Wν- l→-W
ν (l/e) →CDF W/
ν)µ (e/→D0 W/
ν l →UA1 W
ν e →UA2 W
ν)-/e+ (e→±Phenix W/
NNLO QCD
ATLAS
[TeV] s1 10
ll)
[nb]
→*γ
Br(
Z/
× *γZ
/σ
-210
-110
1
)p* (pγZ/
* (pp)γZ/
= 7 TeV)sData 2010 (
-1 L dt = 316-331 nb∫ < 116 GeV)
ll ll (66 < m→*γZ/
< 116 GeV)ee
ee (66 < m→*γCDF Z/
< 110 GeV)ee
ee (70 < m→*γD0 Z/
< 116 GeV)ee
(66 < mµµ ee/→*γCDF Z//
< 105 GeV)ee
ee (75 < m→*γD0 Z/
> 70 GeV)ee
ee (m→*γUA1 Z/
> 50 GeV)µµ
(mµµ →*γUA1 Z/
> 76 GeV)ee
ee (m→*γUA2 Z/
NNLO QCD
ATLAS
Figure 1: (Left) The measured values of σWtot ×BR(W → `ν) for W+ and W−; (Right) The measured value
of σγ∗/Ztot ×BR(Z → ``). The cross sections are compared to the predictions based on the NNLO calculation.
Results are shown for the combined electron-muon results. The predictions of W± are shown for both ppand pp colliders. In addition, the previous measurements at pp and pp colliders are shown. The data pointsat the various energies are staggered to improve readability. All data points are displayed with their totaluncertainties. The theoretical uncertainties are not shown.
Similar comparison of dimuon mass distribution of the Z → µµ candidates is shown in Fig. 2 (right).53
Preliminary cross section measurements are54
σW ×BR(W → µν) = XX±XX(stat)±XX(syst)±XX(lumi) nb55
σZ×BR(Z → µµ) = XX±XX(stat)±XX(syst)±XX(lumi) nb56
Figure 2: Distributions of the transverse mass of W → µν candidates (left) and the dilepton mass of Z → µµcandidates (right) of the full 2010 dataset.
1.1.2 Transverse Momentum Distribution of the Z Boson57
At the LHC, the large dataset of the Z → `` events enables precise measurements of the Z trans-58
verse momentum (pZT ) distribution. The pZ
T study allows the validation of QCD perturbation theory59
(pQCD). A precise knowledge of the Z boson pT is also crucial for the measurement of the W boson60
3
transverse momentum, which is more challenging due to the neutrino escaping from the detector.61
Furthermore, it will help the measurement of the W boson mass, one of the fundamental parameters62
in the Standard Model. After the publication of the inclusive cross sections, we shifted our effort63
to the pZT measurement. Our contribution is driven by our student Hao Liu for the electron channel64
and our postdoc Jianbei Liu for the muon channel. H. Liu’s Ph.D dissertation will largely be based65
on this measurement.66
In the high transverse momentum regime with pZT values larger than half of the mass of the Z67
boson, mZ/2, the production is dominated by the radiation of additional hard partons prior to the68
Z boson decay and can be calculated by pQCD theory. However, in the low transverse momentum69
regime with pZT values less than 5 GeV, the production is dominated by unbalanced real and virtual70
gluon emissions. The calculation is not perturbative and a soft-gluon resummation is mandated in71
the low pZT regime to avoid the divergence from the pQCD theory.72
The normalized pZT distribution is measured based on all the data collected in year 2010 with73
an integrated luminosity around 40 pb−1. The luminosity uncertainty along with many systematic74
uncertainties, which do not depend on pZT , are canceled after the normalization. There are 892375
and 13214 candidates after the final selections in the electron and muon channels, respectively. Our76
group leads the pZT study in both electron and muon channels and we aim to publish a paper with77
electron-muon results combined.78
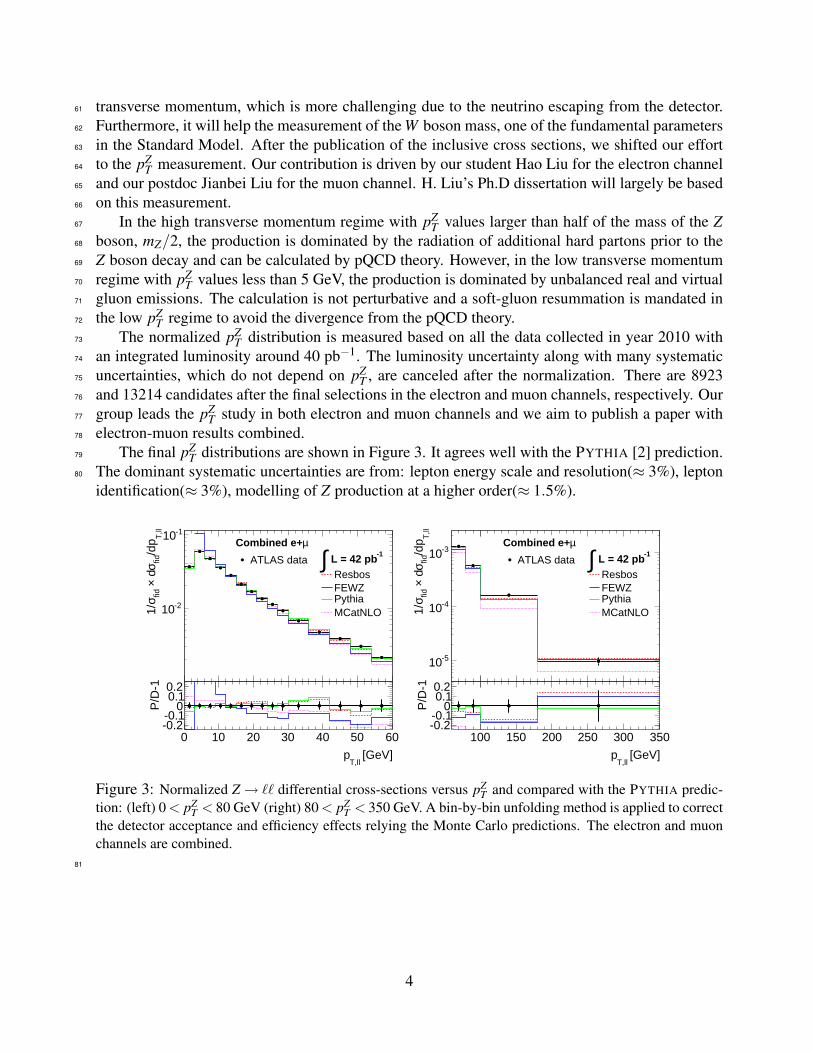
The final pZT distributions are shown in Figure 3. It agrees well with the PYTHIA [2] prediction.79
The dominant systematic uncertainties are from: lepton energy scale and resolution(≈ 3%), lepton80
identification(≈ 3%), modelling of Z production at a higher order(≈ 1.5%).
0 10 20 30 40 50 60
T,ll
/dp
fidσ d×
fidσ1/ -210
-110-1 L = 42 pb∫
ResbosFEWZPythiaMCatNLO
µCombined e+
ATLAS data
[GeV]T,ll
p
0 10 20 30 40 50 60
P/D
-1
-0.2-0.1
00.10.2 100 150 200 250 300 350
T,ll
/dp
fidσ d×
fidσ1/
-510
-410
-310 -1 L = 42 pb∫ResbosFEWZPythiaMCatNLO
µCombined e+
ATLAS data
[GeV]T,ll
p
100 150 200 250 300 350
P/D
-1
-0.2-0.1
00.10.2
Figure 3: Normalized Z → `` differential cross-sections versus pZT and compared with the PYTHIA predic-
tion: (left) 0 < pZT < 80 GeV (right) 80 < pZ
T < 350 GeV. A bin-by-bin unfolding method is applied to correctthe detector acceptance and efficiency effects relying the Monte Carlo predictions. The electron and muonchannels are combined.
81
4
1.2 Diboson Physics Studies82
The Michigan ATLAS group has been the major driving force for diboson physics studies in ATLAS83
for many years. Zhou was the coordinator and the editor of the ’Diboson Physics’ chapter in the84
ATLAS Physics book [3]. Many Michigan group members (Dai, Levin, Li, Thun, Yang, Wilson85
and Zhou) made significant contributions to the diboson (W+W−, W±Z, ZZ, W±γ, Zγ) physics86
studies using fully simulated Monte Carlo events during 2005 to 2009. Since 2010 we have been87
focusing our studies on W+W− and W±Z analysis using the first year LHC collision data at 7 TeV.88
Research Scientist Haijun Yang has played a leading role in ATLAS Standard Model Electroweak89
Group to develop the diboson analysis software packages. He has been the responsible person to90
develop, update and to produce the WW D3PD (derived physics data) data-sets for ATLAS SM and91
Higgs working groups, which has a big impact on the WW analysis efficiencies in ATLAS. Our new92
faculty Zhu and his student Liu joined the effort in the WW data analysis since 2010. In addition,93
Yusheng Wu, a co-education Ph.D. student between UM and USTC (Univ. of Sci. and Tech. of94
China) under supervision of Zhou, also joined the diboson physics working group. Their active95
participation and significant contributions have made the Michigan group much stronger in ATLAS96
diboson whoring group. Our intensive work has resulted in a detailed ATLAS physics note (Yang,97
Zhu and Zhou are co-editors) [4], an ATLAS public note (Zhou is the editor) [5], and a physics98
paper [6].99
The physics motivation to study the diboson productions at the LHC is to test the SM of the100
high-energy behavior of electroweak interactions. Vector boson self-couplings are fundamental101
predictions of the SM, resulting from the non-Abelian nature of the SU(2)L×SU(1)Y gauge sym-102
metry. Any theory predicting physics beyond the SM while maintaining the SM as a low-energy103
limit, may introduce deviations in the diboson couplings at some high-energy scale. Precise mea-104
surements of the triple-gauge-couplings (TGC) will not only be a stringent test of the SM, but also a105
sensitive probe to new physics in the bosonic sector that could provide complementary information106
to that performed by direct searches for new physics at the LHC.107
Many new physics signatures at the LHC involve diboson final states, particularly for final108
states with either W or Z pairs, provide irreducible backgrounds to Higgs searches with the same109
final states. Furthermore, with W leptonic decays no Higgs mass peak can be reconstructed, so110
the WW background cannot be estimated from the measured data via sideband interpolation. An111
understanding of the irreducible SM W-pair continuum background is therefore crucial for Higgs112
and other new physics searches.113
1.2.1 WW Analysis114
The measurement of the WW production cross section at 7 TeV is the first milestone in ATLAS115
diboson physics program with the 2010 LHC collision data. We reconstruct the WW events using116
leptonic decays of the W boson: W±→ `±ν, where ` is an electron or muon. Sequential decays to117
electrons and muons via τ leptons are also included as signal: W±→ τ±ντ → `±ν`ντ. The resulting118
final state has two high-transverse-momentum (high-pT ) charged leptons and substantial transverse119
momentum imbalance in the final state (referred to as missing transverse energy 6ET below) due to120
the neutrinos escaping detection. The major backgrounds for this `+`− 6ET final state are Drell-Yan,121
top quark, W+jet and diboson (WZ, ZZ and Wγ) production. A set of event selection criteria is122
designed and optimized to achieve good WW signal detection sensitivity.123
5

For each di-lepton final state (ee, or µµ, or eµ), we require each lepton to have pT > 20 GeV,124
and that there are exactly two leptons with opposite charges. After the di-lepton selection, the125
dominant contribution (>97%) to ee and µµ events comes from the inclusive Z → `+`− process. To126
remove such backgrounds and QCD background, the invariant mass of the ee or µµ must be greater127
than 15 GeV and not within ±10 GeV of the Z-mass. As shown in Fig. 4. further suppression of128
the remaining Drell-Yan and other backgrounds is achieved by requiring 6ETrel >40 GeV for the129
ee and µµ channels and 6ETrel > 20 GeV for the eµ channel. Suppression of the top background is130
accomplished by rejecting events containing jets with ET > 20 GeV and |η|< 3, as shown in Fig. 4,131
the top events populate the higher jet multiplicity bins.132
With above selection criteria eight WW candidate events are observed. one in the ee channel,133
two in the µµ channel, and five in the eµ channel. The signal acceptance and efficiencies are deter-134
mined using MC simulations. Detailed comparisons of MC predicted efficiencies to the efficiencies135
measured from data control samples such as Z → `+`− are used to determine scale factors. These136
scale factors are then used to correct the MC predictions of efficiencies and acceptances for both137
signal and background events. The background contributions to the final signal sample are deter-138
mined with a combination of high-statistics MC samples and estimates determined directly from139
data. The observed and expected number of events after applying all WW selection cuts are shown140
in Table 1.141
Figure 4: The distributions of 6ETrel for dilepton samples: ee and µµ (left) and eµ (middle) after the Z mass
veto and jet veto cuts. The right plot shows the jet multiplicity. The points represent data and the stackedhistograms are the MC predictions.
The WW production cross section is extracted from the observed eight WW candidate events,the estimated background events (1.7±0.6), the WW signal detection acceptance and efficiency, andthe integrated luminosity. Using a maximum log-likelihood fitting method, the WW cross-sectiontogether with statistical and systematic uncertainties are found to be
σWW = 40+20−16(stat)±6(syst) pb.
The statistical uncertainty is 44% which is the dominant uncertainty for this measurement. The total142
systematic uncertainty (16.4%) includes the luminosity uncertainty (∆L/L = 11%), acceptance un-143
certainty (∆A/A = 7.4%), and background estimation uncertainty (∆Nb/Nb = 35%). Our measured144
WW cross-section is consistent with the SM prediction of 46±3 pb.145
We use the event re-weighting technique [7] to probe the anomalous triple-gauge-coupling sen-sitivity. The NLO MC generator, BHO program [8] is used to produce the WW events with theSM couplings and with a set of anomalous couplings parameters. These events are used to pro-duce a set of event ’weights’ to study the TGC sensitivity using 2010 selected WW events. The
6
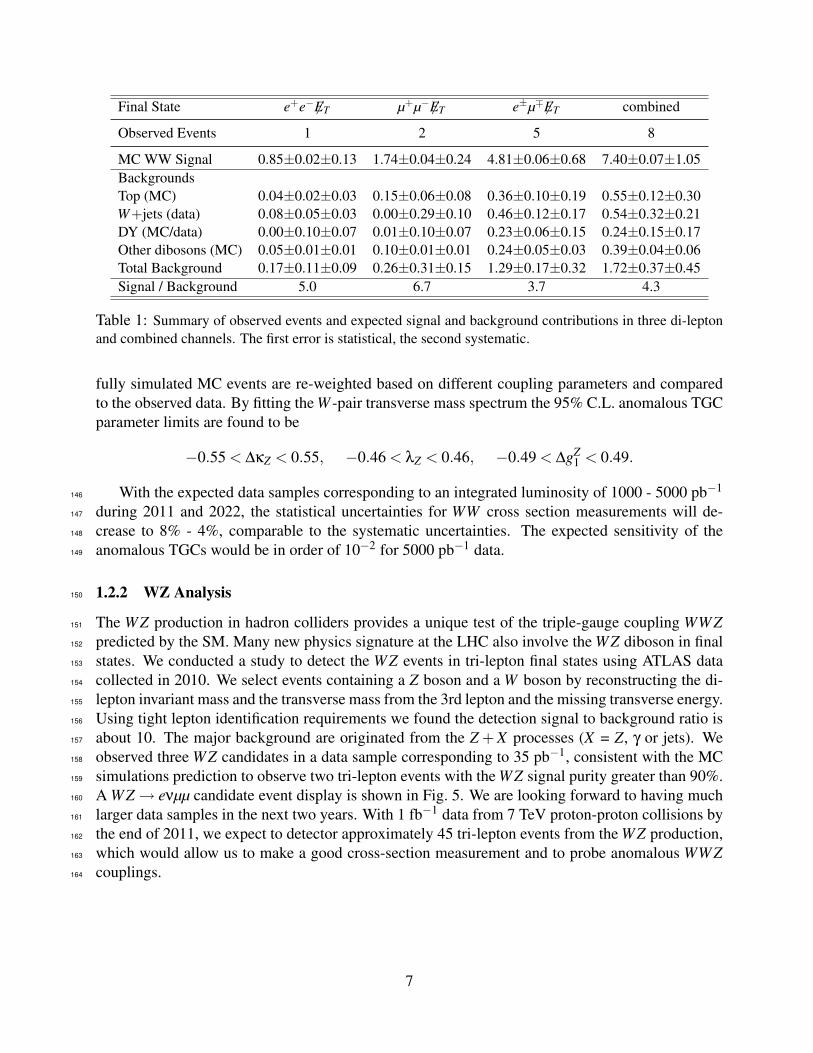
Final State e+e− 6ET µ+µ− 6ET e±µ∓ 6ET combined
Observed Events 1 2 5 8
MC WW Signal 0.85±0.02±0.13 1.74±0.04±0.24 4.81±0.06±0.68 7.40±0.07±1.05BackgroundsTop (MC) 0.04±0.02±0.03 0.15±0.06±0.08 0.36±0.10±0.19 0.55±0.12±0.30W+jets (data) 0.08±0.05±0.03 0.00±0.29±0.10 0.46±0.12±0.17 0.54±0.32±0.21DY (MC/data) 0.00±0.10±0.07 0.01±0.10±0.07 0.23±0.06±0.15 0.24±0.15±0.17Other dibosons (MC) 0.05±0.01±0.01 0.10±0.01±0.01 0.24±0.05±0.03 0.39±0.04±0.06Total Background 0.17±0.11±0.09 0.26±0.31±0.15 1.29±0.17±0.32 1.72±0.37±0.45Signal / Background 5.0 6.7 3.7 4.3
Table 1: Summary of observed events and expected signal and background contributions in three di-leptonand combined channels. The first error is statistical, the second systematic.
fully simulated MC events are re-weighted based on different coupling parameters and comparedto the observed data. By fitting the W -pair transverse mass spectrum the 95% C.L. anomalous TGCparameter limits are found to be
−0.55 < ∆κZ < 0.55, −0.46 < λZ < 0.46, −0.49 < ∆gZ1 < 0.49.
With the expected data samples corresponding to an integrated luminosity of 1000 - 5000 pb−1146
during 2011 and 2022, the statistical uncertainties for WW cross section measurements will de-147
crease to 8% - 4%, comparable to the systematic uncertainties. The expected sensitivity of the148
anomalous TGCs would be in order of 10−2 for 5000 pb−1 data.149
1.2.2 WZ Analysis150
The WZ production in hadron colliders provides a unique test of the triple-gauge coupling WWZ151
predicted by the SM. Many new physics signature at the LHC also involve the WZ diboson in final152
states. We conducted a study to detect the WZ events in tri-lepton final states using ATLAS data153
collected in 2010. We select events containing a Z boson and a W boson by reconstructing the di-154
lepton invariant mass and the transverse mass from the 3rd lepton and the missing transverse energy.155
Using tight lepton identification requirements we found the detection signal to background ratio is156
about 10. The major background are originated from the Z + X processes (X = Z, γ or jets). We157
observed three WZ candidates in a data sample corresponding to 35 pb−1, consistent with the MC158
simulations prediction to observe two tri-lepton events with the WZ signal purity greater than 90%.159
A WZ → eνµµ candidate event display is shown in Fig. 5. We are looking forward to having much160
larger data samples in the next two years. With 1 fb−1 data from 7 TeV proton-proton collisions by161
the end of 2011, we expect to detector approximately 45 tri-lepton events from the WZ production,162
which would allow us to make a good cross-section measurement and to probe anomalous WWZ163
couplings.164
7

Figure 5: A WZ → eνµµ event candidate observed in ATLAS 2010 data sample
8

1.3 B-Physics and Hyperon Studies165
The UMATLAS Group played a major role in various aspects of the ATLAS b-physics program. We166
led the effort to assess the feasibility of measuring the polarization of Λb hyperons in ATLAS, and167
had primary editorial responsiblity for presenting the relevant section on this topic in the ATLAS168
CSC publication. The group, in planning for the Λb measurements and seeking in detail what could169
be learned from existing DZERO Tevatron data as we estimated rates and other parameters useful in170
ATLAS studies, were the lead in the recent discovery of two new baryons, the Ξb and Ωb. Certain171
members of our group also played the lead role in developing the low-pT trigger needed for ATLAS172
b-physics studies. This trigger was used to collect the bulk of J/ψ statistics in ATLAS 2010 data.173
Furthermore, we were the first in ATLAS to see the B0d meson and Λb/Λb baryons. A paper on this174
observation is now in preparation.175
Our planned Λb studies require luminosities in the range of several tens of inverse femtobarns so,176
at the moment, this is not the primary focus of our analyses. But since a part of the Λb analyses will177
require us to have precise knowledge of how to reconstruct Λ0 and since we already have available178
a hundred thousand inclusively produced Λ0, we have focussed some of our effort on measuring the179
Λ0 polarization, testing our ability to make unbiased spin measurements and taking into account180
background and acceptance effects. Moreover, we are pursuing a set of new physics ideas in which181
Λ0 polarization measurements, even at xF near 0, where symmetries drive the polarization to 0, can182
help pin down the Λ0 fragmentation functions. The physics interest in this study is discussed below.183
One of the most mysterious results observed in hadron reactions at energies below 1 TeV is184
the large polarization values and the bizarre polarization structure seen in inclusively produced185
lambda hyperons in proton-proton and proton-nucleus collisions. The puzzlement derives from the186
fact that a single particle like the lambda could emerge from a violent p-p collision with a large187
polarization even in the midst of a host of other accompanying final state particles that could indeed188
share, or dilute, the polarization of the Λ0. Furthermore, the large lambda polarization, however it189
is produced, seems in stark contradiction with all QCD predictions.190
Using data from the early runs in the ATLAS Experiment a total of ∼26k Λ0 events have been191
reconstructed. The polarization of these events has been extracted through the observation of the192
angular distribution of the decay of the Λ0’s into πp pairs. Indeed, if θ is the angle between the decay193
proton and the normal to the lambda production plane, and the lambda polarization is designated194
by P, the decay distribution should follow the p.d.f. of (1+Pαcosθ).195
Because of the large energy of the impinging LHC proton beams, and the fact that the longi-196
tudinal momenta of the observed Λ0’s will be in the few-GeV range, the Feynman xF values will197
be vanishingly small, and we know that P vanishes with deceasing xF . Thus, we should not be198
surprised to find the polarization measured to be quite small. But we also know that, in a domain199
where the energy reach is seven times that of all prior measurements, it interesting to look for any200
anomalies even near xF = 0. Were there to be any found, they could point to the onset of dif-201
ferent production mechanisms, or the violation of established conservation laws, or even possible202
new physics production mechanisms. Indeed, we note that polarization anomalies in p+ p scatter-203
ing may have even been the first indicators of the compositiveness of protons and the existence of204
quarks. This observation became apparent only as the energy of the colliding particles grew – and205
we are cognizant of the fact that we have now entered a new energy regime at the LHC.206
We present below some of the details of the current state of our Λ0 analysis. Other work, such207
as di-jet analyses with one of the jets containing a Λ0, and preparations for using spin dependencies208
9

in SUSY searches, are also underway.209
For this analysis we use 11.6 nb−1 of ATLAS early data at center of mass energy√
s = 7 TeV210
(data taking periods A–C). Data were collected using a Minimum Bias Trigger. In addition we use211
20 M of Minimum Bias Monte Carlo events with the same trigger requirement. Both real data and212
Monte Carlo samples were reprocessed in May 2010 using the same Atlas reconstruction software213
for all the periods.214
Figure 6: Mass distribution of Λ0 candidates selected by default V 0 finder.
V 0 candidates were reconstructed using standard Atlas V 0 finder tool in default setting. It is215
designed to select Λ0 → pπ−, Λ0 → pπ+, KS → π+π− and γ→ e+e− decays.216
Figure 6 (left) shows Λ0 invariant mass distribution after the final selection. Figure 6 (right)217
shows an example of cosθ∗ MC template for polarization 0% compared to data. Negative log-218
likelihood for 7 MC templates with different polarization was calculated and fitted with a quadratic219
function. Minimum of the quadratic function corresponds to the best estimate of the polarization.220
With this method we have measured inclusive polarization of Λ0 P = 0.009±0.017stat±0.021syst.221
Similar studies have been made for KS and Λ0 and the results in both cases have been consistent222
with 0.223
2010 data were analyzed in search for B0d , Λb, and Λb hadrons. All these particles decay into a224
very similar final J/ψ +V 0, with V 0 being KS, Λ0, and Λ0respectively. Reconstruction algorithm225
developed by Michigan group was used to search for these decays and we were the first to see these226
particles reconstructed in ATLAS. Additional cuts on B and V 0 lifetime were applied to clean up227
the background. Invariant mass distributions are shown in Figure 7. Measured invariant mass is228
consistent with PDG value which illustrates excelent performance of ATLAS inner tracker.229
1.3.1 Theoretical Interest230
Though the variation of the Λ0 polarization with pT has been a mystery spanning decades, no231
successful explanation has been generally embraced. Models such as the Lund Model, where the232
polarization arises because the angular momentum of a newly created ss pair must be canceled by233
the polarization of the s-quark (which joins light quarks in a singlet pair) to produce the Λ0 and234
its polarization, have quite a bit of appeal, but the model has been attacked for not accounting for235
Jefferson Lab result, which require ss pairs to be produced with the spins counter-aligned. A model236
proposed previously by Neal, which assumes that, in the case of Λ0, the polarization in the outgoing237
10

Figure 7: Mass distribution of B0d(left) and Λb and Λb (right)
hyperon is the result of the scattering of beam light quarks, and the assumption that the change in238
pT of any spin-1/2 quarks can produce a polarization that is universal in magnitude, though perhaps239
depended on quark mass. This hypothesis follows from a comparison of Λ0 polarization and the240
polarization observed in p− p scattering, where one can predict the other. But this model suffers241
when one notes that some hyperon polarizations appear similar, even when beam valence quarks242
might be involved in one case and not in another.243
A more recent approach is demonstrated in the work of Sivers and Boer, in which it is suggested244
that Λ0’s within jets be studied. The reference frame for this polarization measurement is given245
by the momentum of the jet and Λ0, unlike in the previous case when one measures polarization246
perpendicular to the beam-Λ0plane (production plane). The great advantge of this new frame is that247
the usual symmetry argument requiring polarization to vanish for xF = 0 does not apply, making a248
collider (where xF is small) an ideal tool for such a measurement. The polarization of Λ0’s inside249
jet can be linked back to the fragmentation process from which they originated, however, we still250
believe that the same mechanism can be used to explain the large polarizations measured in the251
previuos fixed target experiments where xF was close to 1. If that is indeed true, we can anticipate252
to see large polarizations of Λ0’s inside jet.253
The feasibility study with MC di-jet sample is ongoing. We have been able to reconstruct Λ0254
inside jets where track density is large and bacground contribution is significant. We have been255
able clean up the sample and reduce background to a managable level. Figure 8 shows invariant256
mass distribution of Λ0’s inside jet (left) and the decay angle distribution in the new reference frame257
(right) that will be used to extract polarization originating in the fragmentation process.258
We are working with the authors of these models and look forward to seeing if our data can help259
in the pinning down of the fragmentation extraction.260
1.3.2 Summary261
In conclusion, the UMATLAS group has made significant contributions to the ATLAS b physics262
program, have discovered two new particles in the process, have used Λ0 data to both confirm the263
integrity of the ATLAS detector, have made the first observation in ATLAS of the B0 and Λb and264
Λb, and have been primary developers of the low-pT b-physics trigger.265
11

Figure 8: Mass distribution of Λ0 in jet (left) and it’s decay angle in the new reference frame (right)
1.3.3 Service work266
ATLAS trigger system has 3 levels, with the first being hardware based and the other two (so called267
high level trigger) software based. B-physics measurements at ATLAS rely mainly on low-pt di-268
muon trigger which is able to select J/ψ particles. Low-pt J/ψ trigger algorithm was developed in269
Michigan and was the main trigger for b-physics in 2010. Unlike the standard J/ψ trigger which270
starts reconstruction from 2 level-1 muons, our trigger is seeded by only one level-1 muon and271
reconstructs the second muon at high level. This means that it is able to trigger J/ψ’s where one272
muon wasn’t energetic enough to fire level-1 trigger. This algorithm was successfully tested and273
calibrated at the beginning of the year 2010 and became the main J/ψ trigger in the second half274
of the year. Main bulk of J/ψ statistics was colected by this trigger. Figure 9 shows measured275
efficiency of the algorithm compared to the standard di-muon trigger.276
Figure 9: Mass distribution of Λ0 candidates selected by default V 0 finder.
12
1.4 Search for a Standard Model Higgs Boson277
The search for a Standard Model (SM) Higgs boson is one of the most important goals of the278
LHC physics program. Direct searches at the CERN LEP e+e− collider has led to a lower limit279
of 114.4 GeV at 95% confidence level (CL) [9] on the Higgs boson mass (mH). Searches by the280
CDF and DØ experiments at the Fermilab Tevatron pp collider have further excluded the mass281
region of 158 < mH < 175 GeV [10]. A global fit to precision electroweak data yields a bound of282
mH < 185 GeV at 95% CL [11] taking into account exclusions from direct searches.283
The Michigan group has been a leading contributor to the ATLAS Higgs search for many years284
now. Contributing members include faculty Rudi Thun and Jianming Qian, staff physicist Tiesheng285
Dai, postdoctoral research fellow Jonas Strandberg, and graduate students Hao Liu, Shannon Walch286
and Aaron Armbruster. We have primarily worked on the H →WW → ``νν (` = e,µ) search as287
it offers the best sensitivity with the early LHC data, due to its expected large production rate and288
relative easy triggering and identification. Consequently, this search has a high profile in ATLAS289
and attracts a large number of collaborators. We take pride in our important contributions in such a290
competitive environment.291
Before the LHC data-taking, we studied search sensitivities of various LHC running scenarios.292
In pp collisions at√
s = 7 TeV, the Higgs production is dominated by the gluon-gluon fusion (gg→293
H), but with a significant contribution from the vector-boson fusion (VBF) for the mass region of294
interest [12]. Our group was the first in ATLAS to investigate the search and discovery potential of295
a dataset of 1 fb−1 at 7 TeV in the production and decay gg → H →WW → ``νν channel. These296
studies provided valuable inputs to both 2009 and 2010 Chamonix LHC performance workshops297
and had significant impact on the running scenarios of the LHC.298
Our work has been intensified since the data-taking. After many years of MC studies, we are299
thrilled to analyze real data. This excitement has led to focused efforts throughout the collaboration.300
Indeed, ATLAS has recently released the first LHC limit on the Higgs boson production [13] based301
on the H → WW → ``νν search in a dataset recorded by ATLAS in 2010 corresponding to an302
integrated luminosity of 35 pb−1. The H →WW → ``νν events are characterized by two high pT303
leptons and large transverse momentum imbalance. Because of initial-state radiations, signal events304
can have one or more jets. The search is, therefore, divided into three separate analyses based on305
the jet-multiplicity: H + 0 j, H + 1 j and H + 2 j analysis. Since backgrounds increase with the jet306
multiplicity, H + 0 j is expected to have the best signal-background ratio while H + 2 j offers little307
sensitivity for the current dataset. Thus we have concentrated on the H +0 j and H +1 j analysis.308
Though the new result is the fruit of a truly collaborative effort by all groups involved, we309
lay claims on several critical aspects of the search. The list includes comparison of data and MC,310
selection optimization, Z/γ∗ background estimation and finally limit extraction. We summarize311
some of our contributions below. The original ATLAS plan is to apply the selection developed for312
MC studies at√
s = 10 TeV directly to the 7 TeV data. Realizing that this is not optimal as the313
background composition change from 10 to 7 TeV is significant, we embarked on a re-optimization314
and eventually convinced ATLAS to adapt new mH−dependent selections.315
Main backgrounds of the search are expected from QCD multijet and W+jets, top quark,Z/γ∗+jets and SM WW productions. Their contributions are estimated from MC and data-drivenmethods. Our contribution here i s on the Z/γ∗+jets background which can mimic the signal ifthere are mismeasured 6ET . This is particularly true for the H +1 j analysis. Its contribution is deter-mined from the scaling of MC by a 6ET mismodeling factor determined from data-MC comparisons.
13

Figure 10: MC distribution of the m``−6ET plane for dielectron (left) and dimuon (right) events, dominantlyfrom Z/γ∗→ ``.
mH (GeV) 120 130 140 150 160 170 180 190 120H +0 j analysis
estimated bkgd 0.87 0.97 1.07 1.12 1.09 1.70 1.33 0.97 0.72signal 0.15 0.34 0.56 0.79 1.11 1.26 0.85 0.45 0.29data 1 2 2 1 1 3 3 3 3
H +1 j analysisestimated bkgd 1.05 1.07 1.02 1.03 0.93 1.26 1.25 1.12 0.85
signal 0.05 0.13 0.22 0.32 0.50 0.60 0.42 0.24 0.15data 1 1 0 0 0 1 1 1 1
Table 2: Numbers of events after all selections for the total estimated backgrounds, expected from signaland observed in data. Three dilepton final states (ee, eµ and µµ) are combined.
As shown in Fig. 10, dilepton events before the 6ET selection are divided into four regions in them``− 6ET plane with region “A” representing the signal region while the other three as the controlregions. The data-corrected background contribution in region “A” can then be calculated
AcorrectedMC = AMC×
(Bdata
Ddata
DMC
BMC
)Table 2 summarizes the numbers of estimated background events, observed events in data and316
expected from signal for different mH values. The observed distributions of the transverse mass of317
the dilepton and 6ET system are compared to expectations in Fig. 11. The data are generally found318
to be in good agreements with the expected backgrounds both in normalizations and in kinematic319
distributions. Without significant excess, we set upper limits on the Higgs boson production cross320
section, in multiples of its SM prediction, using a profile likelihood [3]. Our student Armbruster was321
responsible for this task. The exclusion limits were extracted using a fully frequentest technique322
with the ratio of profile likelihoods as the test statistics. Since the limits are based on CLs+b, a power323
constraint is applied to avoid excluding a very small signal for which ATLAS has no sensitivity [14].324
This procedure is referred as PCL. For our appication, a power-constraint of 16% is chosen (e.g.325
the −1σ expected limit band. Figure 12 compares the observed limits with the expected median326
limits along with its ±1σ and +2σ uncertainty bands. With an integrated luminosity of 35 pb−1,327
14

0 50 100 150 200 250 300
-210
-110
1
10
0 50 100 150 200 250 300
-210
-110
1
10
[GeV]Tm0 50 100 150 200 250 300
Ent
ries
/ 10
GeV
-210
-110
1
10
[GeV]Tm0 50 100 150 200 250 300
Ent
ries
/ 10
GeV
-210
-110
1
10
Data =170 GeV)H
WW (m→HW+jets topWW +jetsγZ/
γWZ/ZZ/W
= 7 TeVs-1
L dt = 35 pb∫
PreliminaryATLAS
0 50 100 150 200 250 300
-210
-110
1
10
0 50 100 150 200 250 300
-210
-110
1
10
[GeV]Tm0 50 100 150 200 250 300
Ent
ries
/ 10
GeV
-210
-110
1
10
[GeV]Tm0 50 100 150 200 250 300
Ent
ries
/ 10
GeV
-210
-110
1
10
Data =170 GeV)H
WW (m→HW+jets topWW +jetsγZ/
γWZ/ZZ/W
= 7 TeVs-1
L dt = 35 pb∫
PreliminaryATLAS
Figure 11: Transverse mass distribution of the dilepton and 6ET system after all selections except the cut onitself of the H +0 j candidates (left) and H +1 j candidates (right).
a SM like Higgs boson with a production rate of 1.2 times the SM value is excluded at 95% CL328
for mH = 160 GeV. Though the limit is not yet sensitive to the SM Higgs nor is it competitive to329
Tevatron, it is nevertheless exciting to see the first limits that are so close to both. We now have all330
the machinery in place and are confident to surpass Tevatron in the near future.331
Figure 12: Left: the 95% CL upper limit on σH×Br(H →WW ∗) as a function of mH . Right: same as the leftplot, but expressed as a multiple of the SM prediction. Also shown are limits from Tevatron experiments [10].
With the release of the cut-based H →WW → ``νν result, our attention has been shifted to two332
other areas: combinations of results and improvement of H →WW → ``νν through multivariate333
techniques. While Higgs boson searches are performed separately for different decay modes, the334
results from individual searches need to be combined. To this end, ATLAS is now working on an335
internal combination. Moreover, an LHC combination of ATLAS and CMS results is planned for336
the summer. Through Armbruster who is becoming an expert in statistics, we are in the middle of337
these two combination efforts. As for the multivariate analysis, we are right at the center as well338
since Qian is coordinating this effort for ATLAS.339
Besides of the H →WW → ``νν search, we are involved in two other Higgs search analyses.340
Qian is a co-editor of the H → ZZ → ``νν, ``qq conference note which has just been released for341
public presentation. The note reports a first direct experimental search of a heavy standard model342
Higgs boson which decays to a pair of on-shell Z bosons. The Higgs boson mass considered is343
200−600 GeV, a range extending beyond the sensitivities of LEP and Tevatron experiments [9, 10].344
15

At mH = 400 GeV, the observed upper cross section limit is 15 times of the SM prediction. In345
addition, Qian chairs the Editorial Board reviewing the analysis of a search for a light CP-odd346
Higgs boson decaying to µµ, predicted in the next minimal supersymmetric standard model [15].347
Furthermore, both Dai and Qian are contributing members of the joint theory, ATLAS and CMS348
Higgs cross section working group, an outgrow of an internal ATLAS group Qian chaired earlier.349
The group has compiled the state-of-the-art calculations of Higgs production cross sections and350
decay branching ratios [12] to be referenced by both ATLAS and CMS collaborations.351
The LHC has opened a new era in our hunt for the Higgs boson. It is expected to deliver352
∼ 5 fb−1 at√
s = 7 or 8 TeV over the next two years. With this dataset, ATLAS has the potential353
to have a > 3σ signal for mH above 130 GeV if Higgs exists and to exclude it for all allowed mass354
range if it does not. The next two years is no doubt a golden age for the Higgs search and we fully355
intend to exploit this unique opportunity.356
16

1.5 Searches for Supersymmetry357
Currently, with the first 7 TeV data, we concentrate on the new physics searches in the γγ + 6ET and358
ll + 6ET final states. These studies are cared by PhD students: D. Harper, Z. Dongliang.359
Search for γγ and 6ET final state The search for a γγ + 6ET final state was done for total integrated360
luminosity of 37.5pb−1 and is under EB review. The event selection should be independent from361
any specific SUSY model as much as possible. Nevertheless, the usage of specific SUSY signal362
points is necessary to test the coverage in the model parameter space and to set limits on the model363
parameters in case of no access above the SM expectations.
[GeV]T
p
0 100 200 300 400 500 600 700
Eve
nts
/ 5 G
eV
0
20
40
60
80
100
120
140
160 ) = 150GeV1
0χ∼) = 400GeV m(g~GGM m(
) = 300GeV1
0χ∼) = 600GeV m(g~GGM m(
) = 680GeV1
0χ∼) = 700GeV m(g~GGM m(
[GeV]missTE
0 100 200 300 400 500 600 700 800 900 1000
Eve
nts
/ 20
GeV
0
50
100
150
200
250) = 150GeV
1
0χ∼) = 400GeV m(g~GGM m(
) = 300GeV1
0χ∼) = 600GeV m(g~GGM m(
) = 680GeV1
0χ∼) = 700GeV m(g~GGM m(
Figure 13: Distribution of the photon pT (left) and 6ET (right) from several GGM MC signal points.Three points are included in the plots: Mg = 400 GeV and M
χ01= 150 GeV, Mg = 600 GeV and
Mχ0
1= 300 GeV, Mg = 700 GeV and M
χ01= 680 GeV.
364
In this analysis we considered the General Gauge Mediation (GGM) model as our main SUSY365
model and calculate exclusion limits as a function of the GGM model parameters. In the GGM,366
there is no hierarchy between colored and uncolored states and thus there is no theoretical constraint367
on how light the colored states can be. It brings the possibility of the GGM discovery even with368
early LHC data.369
SUSY events with γγ + 6ET final state, are characterized by the energetic photons and the large370
6ET . Figure 13 show the reconstructed pT of both photons and 6ET from several MC GGM events. We371
require at least two photon candidates with ET > 30 GeV for the first candidate and ET > 20 GeV for372
all others and 6ET > 125 GeV. Figure 14 show the reconstructed pT of the leading photon (left) and373
6ET (right) for data and SM background MC. A GGM signal point (Mg = 600 GeV, Mχ0
1= 300 GeV)374
illustrate the SUSY contribution.375
The Standard Model contribution is estimated to be NB = 0.15±0.66 events using data driven376
methods, while zero events are observed in data. This result is interpreted in the context of General377
Gauge Mediation, one model of supersymmetry breaking. In this model we consider bino-like378
neutralinos and exclude gluino masses up to 640 GeV at 95% C. L. for any lightest neutralino mass379
less than the gluino mass. The observed 95% C. L. is illustrated in Figure 15.380
Search for ll and 6ET final state We participated in the inclusive searches for supersymmetric381
particles in events with lepton pairs and large 6ET . In a data sample corresponding to an integrated382
17

[GeV]γ1st T
p0 50 100 150 200 250 300
entr
ies
/ 10
GeV
-210
-110
1
10
210
310 = 7TeV)sData 2010 (
Monte Carlodi-jets + jetsγ
di-photonW + XZ + X
γγW/Z
ttGGM
-1 Ldt ~ 37.5 pb∫
[GeV]missTE
0 50 100 150 200 250 300 350 400
entr
ies
/ 10
GeV
-210
-110
1
10
210
310
= 7TeV)sData 2010 (Monte Carlodi-jets + jetsγ
di-photonW + XZ + X
γγW/Z
ttGGM
-1 Ldt ~ 37.5 pb∫
Figure 14: Distribution of the leading photon pT (left) and 6ET (right) for data and SM backgroundMC. A GGM signal point (Mg = 600 GeV, M
χ01= 300 GeV) illustrate the SUSY contribution.
) [GeV]χ∼m(
200 300 400 500 600 700
) [G
eV]
g~m
(
400
450
500
550
600
650
700-1 = 37.5 pbintL
NLSPg~
95% CL observed
95% CL expected
expectationσ 1 ±
Figure 15: Observed together with expected upper 95% limit on signal events in the GGM plane.
luminosity of 35 pb−1 no significant excesses are observed. Based on specific benchmark models,383
limits are placed on the squark and gluino masses of 450-600 GeV depending on the supersymmet-384
ric mass hierarchy considered.385
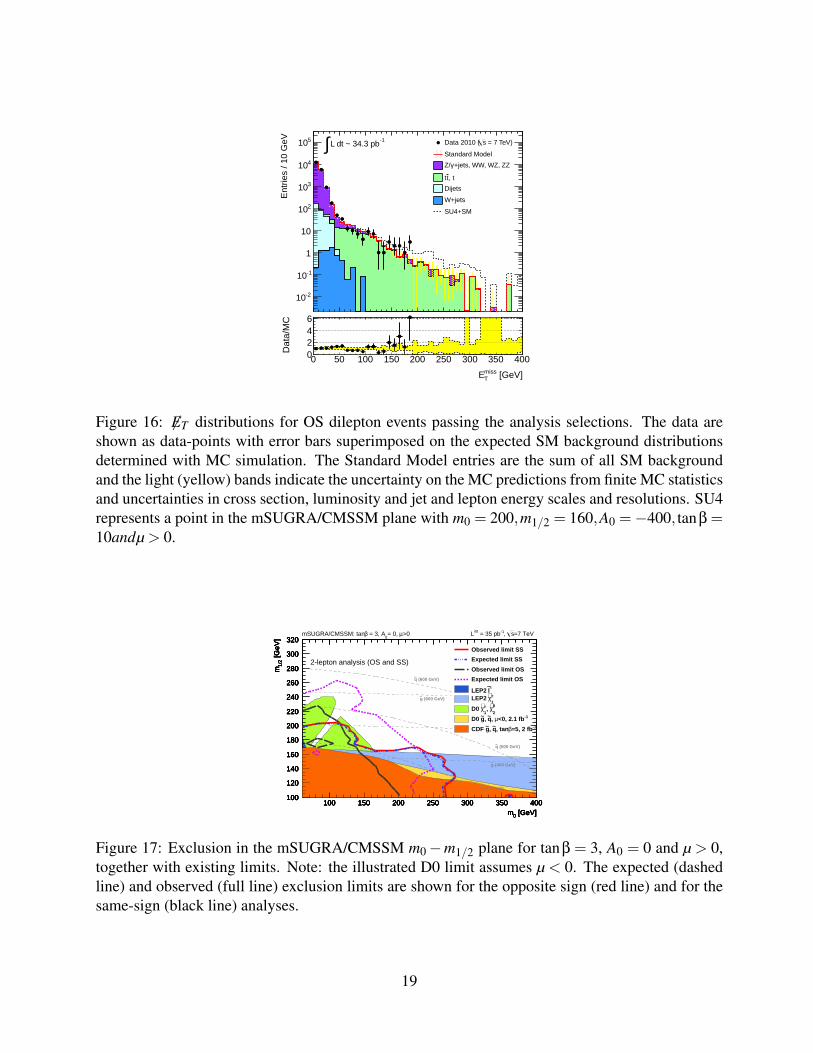
Figure 16 show 6ET for OS dilepton events passing the analysis selections. The signal region386
(SR) for OS (SS) events is defined by a requirement 6ET > 150 GeV (100 GeV), which was evaluated387
through a loose optimisation of the sensitivity based on the study of MSSM models with squarks388
and gluinos with a mass of 400 GeV. The observed numbers of events and the expected numbers389
of SM background events in the signal regions for the SS and OS analyses are shown in Table 1.5.390
Our group worked on the estimation of the Z/γ∗ events in the SR.391
Within the mSUGRA/CMSSM framework, the results are interpreted as limits in the m0−m1/2392
plane, for tanβ = 10,A0 = 0,µ > 0 (see Figure 17).393
18
Ent
ries
/ 10
GeV
-210
-110
1
10
210
310
410
510 = 7 TeV)sData 2010 (
Standard Model
+jets, WW, WZ, ZZγZ/
, ttt
Dijets
W+jets
SU4+SM
-1L dt ~ 34.3 pb∫
[GeV]TmissE
0 50 100 150 200 250 300 350 400
Dat
a/M
C
0246
Figure 16: 6ET distributions for OS dilepton events passing the analysis selections. The data areshown as data-points with error bars superimposed on the expected SM background distributionsdetermined with MC simulation. The Standard Model entries are the sum of all SM backgroundand the light (yellow) bands indicate the uncertainty on the MC predictions from finite MC statisticsand uncertainties in cross section, luminosity and jet and lepton energy scales and resolutions. SU4represents a point in the mSUGRA/CMSSM plane with m0 = 200,m1/2 = 160,A0 =−400, tanβ =10andµ > 0.
[GeV]0m100 150 200 250 300 350 400
[GeV
]1/
2m
100
120
140
160
180
200
220
240
260
280
300
320
[GeV]0m100 150 200 250 300 350 400
[GeV
]1/
2m
100
120
140
160
180
200
220
240
260
280
300
320
[GeV]0m100 150 200 250 300 350 400
[GeV
]1/
2m
100
120
140
160
180
200
220
240
260
280
300
320
[GeV]0m100 150 200 250 300 350 400
[GeV
]1/
2m
100
120
140
160
180
200
220
240
260
280
300
320
[GeV]0m100 150 200 250 300 350 400
[GeV
]1/
2m
100
120
140
160
180
200
220
240
260
280
300
320Observed limit SS
Expected limit SS
Observed limit OS
Expected limit OS±l~
LEP2
1
±χ∼LEP2
2
0χ∼, 1
±χ∼D0 -1<0, 2.1 fbµ, q~, g~D0
-1=5, 2 fbβ, tanq~, g~CDF
>0µ= 0, 0
= 3, AβmSUGRA/CMSSM: tan =7 TeVs, -1 = 35 pbintL
2-lepton analysis (OS and SS)
(400 GeV)q~
(500 GeV)q~
(600 GeV)q~
(400 GeV)g~
(600 GeV)g~
Figure 17: Exclusion in the mSUGRA/CMSSM m0−m1/2 plane for tanβ = 3, A0 = 0 and µ > 0,together with existing limits. Note: the illustrated D0 limit assumes µ < 0. The expected (dashedline) and observed (full line) exclusion limits are shown for the opposite sign (red line) and for thesame-sign (black line) analyses.
19
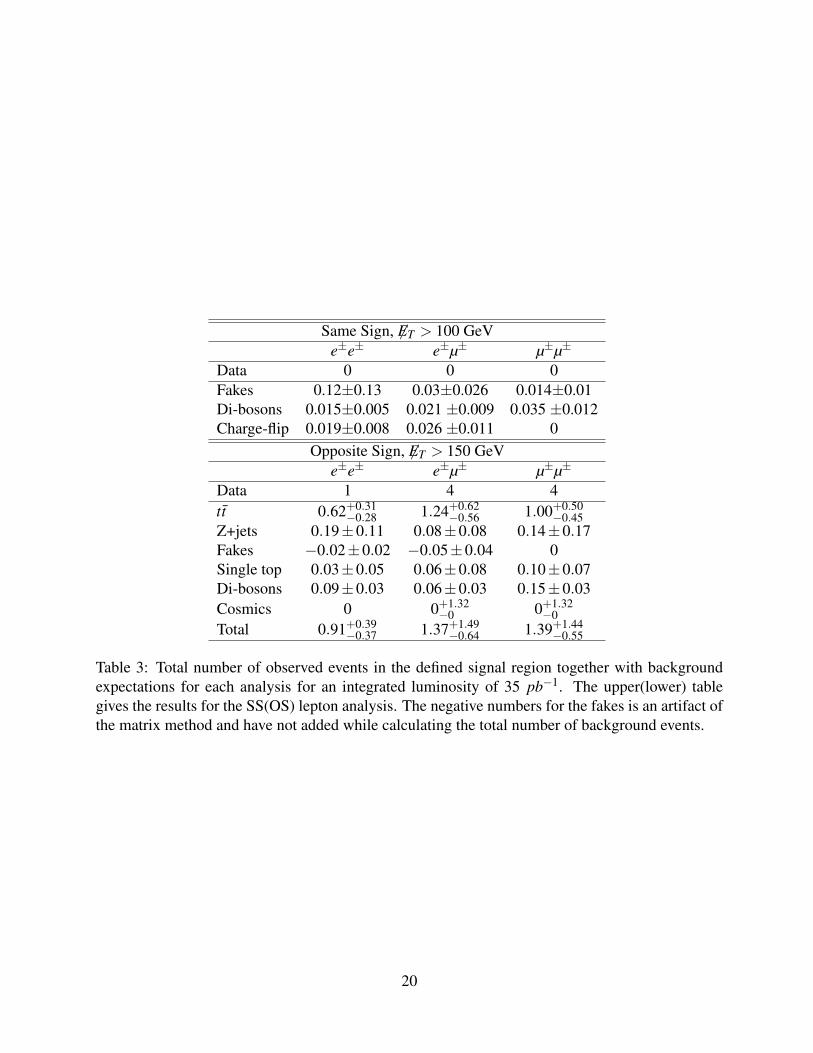
Same Sign, 6ET > 100 GeVe±e± e±µ± µ±µ±
Data 0 0 0Fakes 0.12±0.13 0.03±0.026 0.014±0.01Di-bosons 0.015±0.005 0.021 ±0.009 0.035 ±0.012Charge-flip 0.019±0.008 0.026 ±0.011 0
Opposite Sign, 6ET > 150 GeVe±e± e±µ± µ±µ±
Data 1 4 4tt 0.62+0.31
−0.28 1.24+0.62−0.56 1.00+0.50
−0.45Z+jets 0.19±0.11 0.08±0.08 0.14±0.17Fakes −0.02±0.02 −0.05±0.04 0Single top 0.03±0.05 0.06±0.08 0.10±0.07Di-bosons 0.09±0.03 0.06±0.03 0.15±0.03Cosmics 0 0+1.32
−0 0+1.32−0
Total 0.91+0.39−0.37 1.37+1.49
−0.64 1.39+1.44−0.55
Table 3: Total number of observed events in the defined signal region together with backgroundexpectations for each analysis for an integrated luminosity of 35 pb−1. The upper(lower) tablegives the results for the SS(OS) lepton analysis. The negative numbers for the fakes is an artifact ofthe matrix method and have not added while calculating the total number of background events.
20

1.6 Searches for physics beyond the SM394
With a factor of 3.5 times higher center of mass energy than the Tevatron collider, the LHC machine395
provides unique opportunities to explore new phenomena beyond the SM, the Michigan group has396
been actively participated in searches for new particles using the pp collision data taken in 2010.397
Contributing members include faculty B. Zhou and J. Zhu, two UM graduate students (X. Li and398
L. Liu) and two USTC graduate students under the supervision of Zhu (H. Wang and D. Zhang).399
With our expertise on the W and Z boson inclusive and differential cross section measurements and400
muon identifications, we have focused on the following three new particle searches with charged401
lepton(s) in the final state: Z′→ µµ, W ′→ µν and a heavy resonance decaying into eµ final state.402
All three analyses using 35-39 pb−1 of data are currently under the ATLAS collaboration review,403
and will be sent for journal publications this March.404
The W ′ and Z′ bosons are expected in many models that extend the current SU(3)c×SU(2)L×405
U(1)Y gauge group. Due to their clean detector signatures with two high pT leptons, W ′ and406
Z′ are good candidates for an early discovery at the LHC experiments. These searches can be407
further extended as model-independent searches and are sensitive to a broad range of new physics408
possibilities (Sequential SM (SSM), large extra-dimension model, Stueckelberg model etc). We409
focus on the muon decay channels. Our contributions include studies of the muon selection criteria,410
determinations of muon trigger, reconstruction and identification efficiencies, estimation of QCD411
multijet backgrounds, studies with muon momentum scale and resolution.412
The muon tracks can be reconstructed independently in both the inner detector (ID) and muon413
spectrometer (MS), and the muons used in these two analyses are required to have matching tracks414
in both systems. A requirement on the fractional difference between the pT values measured by the415
ID and MS was originally adopted from the inclusive W and Z inclusive cross section measurements416
to remove the badly reconstructed muons. Our group was the first in the ATLAS Z′ group to point417
out that this requirement will dramatically reduce the reconstruction and identification rate for high418
pT muons (for example, the muon efficiency drops by 40% at 500 GeV compared with 45 GeV).419
We investigated several options and proposed to drop the fractional pT difference cut and instead420
add tighter requirements on numbers of ID and MS hits. This proposal was accepted by the Z′421
group and its implementation has greatly increased the sensitivity for high mass Z′ searches.422
We provided the muon trigger, reconstruction and identification efficiencies for both W ′ and Z′423
searches. For the trigger efficiency measurement, we investigated two different methods to cross424
check the absolute trigger efficiency and also the pT and η dependencies. The two methods we425
studied are the tag-and-probe method using Z → µµ candidates and the independent trigger method426
using an unbiased subset of data collected by uncorrelated jet and missing energy triggers. For the427
muon reconstruction and identification efficiencies, our group was the first to separate the overall428
efficiency into MS muon reconstruction efficiency, ID track matching efficiency, isolation efficiency429
and hits efficiency. We also provided the measured absolute efficiencies and dependencies using the430
tag-and-probe method. A separation of different components of the efficiency measurement helps431
us to identify the source of requirements with low efficiency.432
For high mass resonance searches, the decayed muons tend to have large transverse momenta433
and thus the pT measurements are very sensitive to the detector alignment of both the ID and MS.434
Understanding the momentum measurement for high pT muons is critical for almost all heavy435
resonance searches with muon(s) in the final state. Our group is heavily involved in the moun436
momentum scale and resolution studies, as described in Sect. 1.7. We developed and determined437
21
the muon momentum scaling and smearing formula and parameters used by the whole ATLAS438
collaboration.439
Our group is the main contributor to the heavy resonance search in eµ channel. We are the main440
analyzers and editors for the analysis supporting note and paper draft. The eµ search channel was441
motivated by the indication of lepton flavor violation from the observed neutrino oscillations. It has442
clean detector signature and low backgrounds. The SM processes that can produce an eµ signature443
typically have small cross sections and are characterized by eµ invariant mass (Meµ) spectra that lie444
well below the range favored for new physics signals. An excess of eµ events will possibly indicate445
new physics. We performed the whole analysis and developed the data-driven method to estimate446
backgrounds due to one jet or two jets satisfying the lepton requirements. No data excess was447
observed for the final selected 160 opposite-sign eµ events. And we interpreted our results based448
on the tau sneutrino in the R-parity violating (RPV) SUSY model and the extra-gauge boson Z′ in449
the lepton flavor violating model. Our results improve over the published Tevatron results for high450
mass sneutrinos and lepton flavor violating Z′s.451
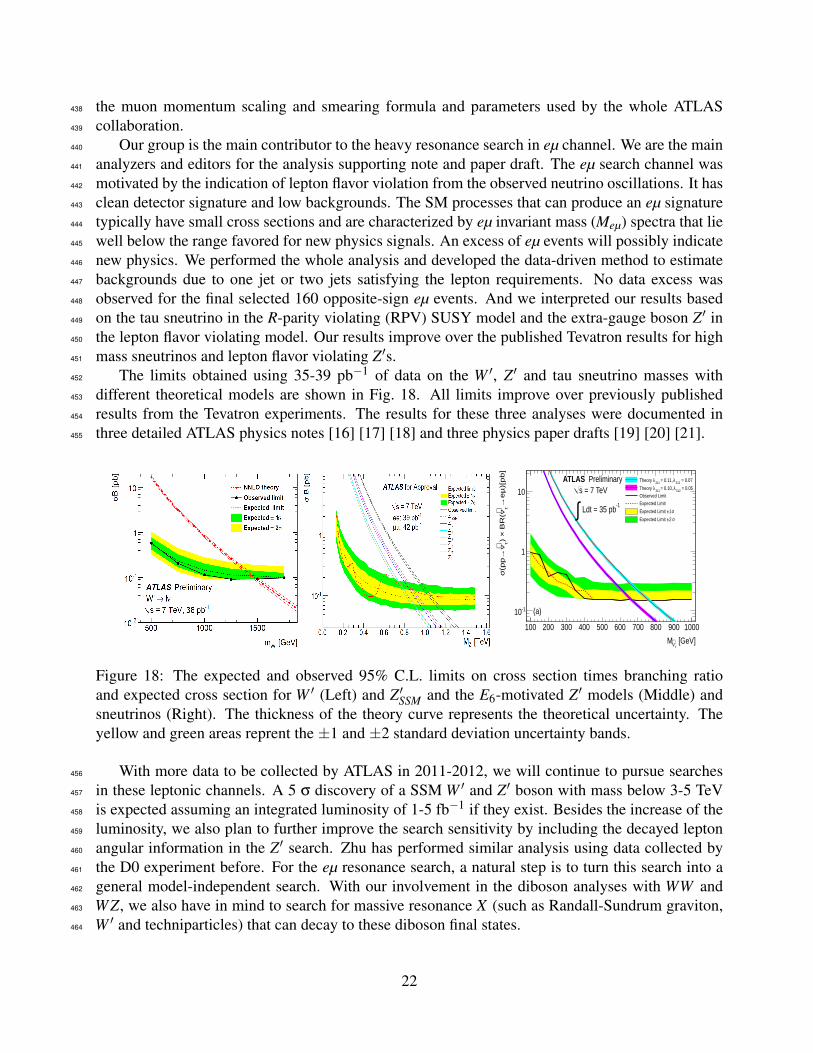
The limits obtained using 35-39 pb−1 of data on the W ′, Z′ and tau sneutrino masses with452
different theoretical models are shown in Fig. 18. All limits improve over previously published453
results from the Tevatron experiments. The results for these three analyses were documented in454
three detailed ATLAS physics notes [16] [17] [18] and three physics paper drafts [19] [20] [21].455
[GeV]τν∼M
100 200 300 400 500 600 700 800 900 1000
)[p
b]
µe
→ τν∼
BR
(×
) τν∼
→(p
pσ
-110
1
10
= 0.07312λ = 0.11, 311
’λTheory
= 0.05312λ = 0.10, 311
’λTheory
Observed Limit
Expected Limit
σ1 ±Expected Limit
σ2 ±Expected Limit
-1 Ldt = 35 pb∫ = 7 TeVs
ATLAS Preliminary
(a)
Figure 18: The expected and observed 95% C.L. limits on cross section times branching ratioand expected cross section for W ′ (Left) and Z′SSM and the E6-motivated Z′ models (Middle) andsneutrinos (Right). The thickness of the theory curve represents the theoretical uncertainty. Theyellow and green areas reprent the ±1 and ±2 standard deviation uncertainty bands.
With more data to be collected by ATLAS in 2011-2012, we will continue to pursue searches456
in these leptonic channels. A 5 σ discovery of a SSM W ′ and Z′ boson with mass below 3-5 TeV457
is expected assuming an integrated luminosity of 1-5 fb−1 if they exist. Besides the increase of the458
luminosity, we also plan to further improve the search sensitivity by including the decayed lepton459
angular information in the Z′ search. Zhu has performed similar analysis using data collected by460
the D0 experiment before. For the eµ resonance search, a natural step is to turn this search into a461
general model-independent search. With our involvement in the diboson analyses with WW and462
WZ, we also have in mind to search for massive resonance X (such as Randall-Sundrum graviton,463
W ′ and techniparticles) that can decay to these diboson final states.464
22

1.7 Muon Combined Performance465
The first year of LHC data has provided a trove of muon data with which to gauge the spectrometer466
performance and physics reach. This performance is being investigated in a number of arenas: low467
level detector resolution studies based on moderate to high pT muons, reconstruction algorithm468
performance using J/ψ→ µµ and high pT muons, overall combined muon performance using Z →469
µµ and W → µν events. Contributing members include T. Dai, D. Levin, L. Liu, J. Liu, J. Purdham470
and J. Zhu.471
1.7.1 Low level detector performance472
The advent of collision muons from IP provides an ideal data sample with which to assess the preci-473
sion MDT chambers resolution, and in particular to gauge the quality of the calibrations generated474
by the UM Tier-2 center for ATLAS wide use. Such calibrations include T0-timing offsets and475
chamber level drift-time to drift-space RT functions. These studies are conducted using a suite of476
UM developed dedicated software tools that perform track segment pattern recognition and mea-477
sure the hit level track residuals. The results reported here are based on a two day run. Muons478
with pT > 20 GeV are selected with additional criteria to establish their origin at the interaction479
point. The calibration constants, including UM Gas Monitor RT functions for all chambers, are480
established at the UM Tier-2 computing center. (See the calibration section). Characteristic track481
segment residuals versus the drift radius for Barrel chambers is shown in the left plot of Fig. 19.482
Here we show the hit residuals before and after the Lorentz angle correction for the large toroidal483
magnetic field is applied. The right plot of Fig. 19 shows the gaussian resolutions obtained in 314484
endcap chambers.485
Figure 19: Left: Track segment hit residuals verse drift radius, before (above) and after (below)the magnetic field correction for drift time is applied. Right: Endcap chamber tube resolution forover 300 chambers using the UM Tier-2 calibration center constants. Mean single tube intrinsicresolution is 90 microns.
23

Figure 20: Invariant dimuon mass spectra for only Staco algorithm (left) and for both algorithms(right). This plot includes 334nb−1 and all possible dimuon candidates assembled from CC, CTand TT pair combinations. Red lines indicate the signal region mass window used in this study.Plots for the Muid algorithm yield similar results.
1.7.2 Reconstruction algorithm performance using J/ψ and high pT muons486
Muon reconstruction algorithm performance studies focused on low pT muons from J/ψ and higher487
pT isolated muons from W and Z. Here we refer to muons identified by the Muon Spectrometer488
(MS), and whose momenta are measured either by the Inner Detector (ID) or by the merged track489
of the ID tracking algorithm and a MS algorithm. Low pT tracks that penetrate only the first station490
of the MS are tagged as muons if there is a matching MS track segment geometrically associated to491
the extrapolated ID track. Higher pT muons traversing at least two stations in the bending regions492
of the MS can be be fully reconstructed and their momenta measured. These MS standalone tracks,493
or the associated hits along the tracks, are used to generate a combined muon track using both ID494
and MS information. Two muon reconstruction algorithms, referred to as STACO and MUID, have495
been used. These studies have been documented as an ATLAS internal note.496
For both low and high pT muons, we compare the number of dimuon candidates in the J/ψ497
region identified by the MUID and STACO muon containers and their respective tracking, tagging498
algorithms. The “performance” is determined by the metrics: 1) the number of reconstructed J/ψ499
candidates; 2) the signal to background ratio; 3) the gaussian width and mean of the mass peak. In500
particular we examine cases where both muons produce combined tracks (CC), one muon produces501
a combined the second a tagged track (CT), or both muons generate tagged tracks (TT).502
We present the dimuon mass spectra for one algorithm (Staco) in Fig. 20 for all J/ψ candidates503
and for those mutually found by both algorithms. For the case where both algorithms are required504
to identify a a candidate, there are significantly fewer events. Plots made for Muid show similar505
results. We observe that either muon reconstruction container produces a clear peak of J/ψ assem-506
bled from candidates completely missed by the other container. For the specific case where both507
muons are required to be combined, the fraction of overlap events is 78%. The significant number508
of missed J/psi indicates the power of the selection criteria used by each container and suggests that509
weak signals might be better measured if both container’s outputs are merged.510
The high pT analysis considers isolated combined muons with pT > 15 GeV. Distributions of511
the measured and MC expectation of kinematic variable pT of the overlap events for both containers512
are shown in Fig. 21. These distributions derived separately for Muid and Staco algorithms are all513
in reasonable agreement with each other. Agreement with the MC is also very good.514
24

Figure 21: pT distributions for the Muid (left) and Staco (right) high pT , isolated muons found inboth algorithms.
Similar studies as done for J/ψ → µµ events are also done for Z → µµ, W → µν and W → τν515
events. We conclude that the both ATLAS Muon reconstruction algorithms are able to reconstruct516
in the early LHC data with an efficiency of about 90%, and the results are consistent with the MC517
expectations.518
1.7.3 Momentum scale and resolution studies using J/ψ, Z and W events519
Many new physics searches at the LHC have high pT muons in the final state, a good understanding520
of the high pT muon momentum measurement is thus crucial to the whole ATLAS physics pro-521
gram. Due to the finite resolution of the optical alignment system and limited data collected so far,522
the muon spectrometer has not reached its designed performance yet. It represents a tremendous523
challenge to figure out the sources of the worse momentum resolution given the unprecedented size524
of the muon spectrometer and the complicated toroid field configurations.525
We have played an important role to study and improve the momentum measurement for both526
the ID and MS. Our studies indicated that much worse momentum resolution have been observed527
for events with one muon in the very forward region of the muon detector. This finding has led to528
the fix of a bug in the ATLAS muon reconstruction software. As a result, all collected data were529
later reprocessed with this bug fix. We developed a Minuit fitting program and used the recon-530
structed J/ψ→ µµ, Z → µµ and W → µν events to determine the momentum resolution parameters531
for both the ID and MS. Since muons from these three processes have different pT distributions, we532
separated the three effects contributing to the overall resolution: the muon energy loss fluctuations533
in the calorimeters, the multiple scattering in the traversed material and the intrinsic spatial reso-534
lution from ID and MS measurements. We also separated our studies in four different eta regions535
to measure the corresponding resolution parameters for each detector. Our results were compared536
with the expectations from the current ATLAS simulation and the measurement from cosmic muon537
events to get a better overall picture of the muon detector performance using the collision data. We538
also provided the corrections to the simulated muon momenta to reproduce the momentum mea-539
surement in data. The extra-smearing functions and parameters we used were adopted by the muon540
combined performance group and used by the entire ATLAS collaboration for all muon-related541
physics analysis. Figure 22 shows the comparison of Z mass distributions for data before (labeled542
as “Data rel 15”) and after (labeled as “Data rel 16”) the 2010 autumn reprocessing and the default543
ATLAS Geant simulation (labeled as “MC no smearing”) on the left side and also the comparison of544
25

(GeV)µ µM70 80 90 100 110
Eve
nts
0
200
400
600
800
1000
1200
1400Data rel15
Data rel16
MC nosmearing
(GeV)µ µM70 80 90 100 110
Eve
nts
0
200
400
600
800
1000
1200
Data rel16
MC rel16 smeared
Figure 22: pT distributions for the Muid (left) and Staco (right) high pT , isolated muon overlapsignal
data with MC smearing applied on the right side. Better resolution has been observed with the au-545
tumn reprocessed data, and better agreement between data and MC is observed with extra-smearing546
applied.547
References548
[1] Atlas Collaboration, G. Aad et al., Measurement of the W → `ν and Z/γ∗→ `` production549
cross sections in proton-proton collisions at√
s = 7 TeV with the ATLAS detector, JHEP 12550
(2010) 060, arXiv:1010.2130 [hep-ex].551
[2] T. Sjostrand, S. Mrenna, and P. Z. Skands, PYTHIA 6.4 Physics and Manual, JHEP 05 (2006)552
026, arXiv:hep-ph/0603175.553
[3] ATLAS Collaboration, Expected Performance of the ATLAS Experiment - Detector, Trigger554
and Physics, arXiv:0901.0512 [hep-ex] .555
[4] ATLAS Collaboration, Measurement of the WW production cross section in proton-proton556
collisions at sqrt = 7 TeV with the ATLAS detector, ATL-COM-PHYS-2011-052 (2011) ,557
http://cdsweb.cern.ch/record/1323900.558
[5] ATLAS Collaboration, Measurement of the WW production cross section in proton-proton559
collisions at sqrt = 7 TeV with the ATLAS detector, under review .560
[6] ATLAS Collaboration in preparation .561
[7] D0 Collaboration, V. M. Abazov et al., Measurement of trilinear gauge boson couplings from562
WW +WZ → `ν j j events in pp collisions at sqrts = 1.96 TeV , Phys. Rev. D80 (2009)563
053012, arXiv:0907.4398 [hep-ex].564
[8] U. Baur, T. Han, and J. Ohnemus, QCD corrections and nonstandard three vector boson565
couplings in W+W− production at hadron colliders, Phys. Rev. D53 (1996) 1098–1123,566
arXiv:hep-ph/9507336.567
26

[9] LEP Working Group for Higgs boson searches Collaboration, R. Barate et al., Search for the568
standard model Higgs boson at LEP, Phys. Lett. B565 (2003) 61–75,569
arXiv:hep-ex/0306033.570
[10] CDF and D0 Collaboration, T. Aaltonen et al., Combination of Tevatron searches for the571
standard model Higgs boson in the W+W− decay mode, Phys. Rev. Lett. 104 (2010) 061802,572
arXiv:1001.4162 [hep-ex].573
[11] ALEPH, DELPHI, L3 and OPAL Collaborations, The LEP Electroweak Working Group,574
http://lepewwg.web.cern.ch/LEPEWWG/.575
[12] LHC Higgs Cross Section Working Group Collaboration, LHC Higgs Cross Section Working576
Group, S. Dittmaier, C. Mariotti, G. Passarino, R. Tanaka (Eds.), et al., Handbook of LHC577
Higgs Cross Sections: 1. Inclusive Observables, arXiv:1101.0593 [hep-ph].578
[13] ATLAS Collaboration, Higgs Boson Searches using the H →WW → `+ν`−ν Decay Mode579
with the ATLAS Detector at 7 TeV , ATLAS-COM-CONF-2010-115 (2010) .580
[14] G. J. Feldman and R. D. Cousins, A Unified Approach to the Classical Statistical Analysis of581
Small Signals, Phys. Rev. D57 (1998) 3873–3889, arXiv:physics/9711021.582
[15] R. Dermisek and J. F. Gunion, Many Light Higgs Bosons in the NMSSM, Phys. Rev. D79583
(2009) 055014, arXiv:0811.3537 [hep-ph].584
[16] ATLAS Collaboration, Search for high-mass states with lepton plus missing transverse585
energy in proton-proton collisions at√
s = 7 TeV with the ATLAS detector,586
ATL-COM-PHYS-2010-1073 (2010) , http://cdsweb.cern.ch/record/1317922.587
[17] ATLAS Collaboration, Search for high mass dilepton resonances in the ATLAS experiment at588 √s = 7 TeV , ATL-COM-PHYS-2011-083 (2011) ,589
http://cdsweb.cern.ch/record/1325590.590
[18] ATLAS Collaboration, Search for a heavy particle decaying into one electron and one muon591
with the ATLAS detector in√
s = 7 TeV pp collisions at the LHC,592
ATL-COM-PHYS-2010-1061 (2011) , http://cdsweb.cern.ch/record/1316982.593
[19] ATLAS Collaboration, Search for high-mass states with lepton plus missing transverse594
energy in proton-proton collisions at√
s = 7 TeV with the ATLAS detector, To be submitted595
to Phys. Lett. B or EPJC Letters (2011) , http://cdsweb.cern.ch/record/1329568.596
[20] ATLAS Collaboration, Search for high mass dilepton resonances in the ATLAS experiment at597 √s = 7 TeV , To be submitted to Phys. Lett. B or JHEP (2011) ,598
http://cdsweb.cern.ch/record/1329888.599
[21] ATLAS Collaboration, Search for a heavy particle decaying into one electron and one muon600
with the ATLAS detector in√
s = 7 TeV pp collisions at the LHC, To be submitted to Phys.601
Rev. Lett. (2011) , http://cdsweb.cern.ch/record/1330343.602
27