1. - nuevapolar.cl · p&l 1s 2015. clp $ b 2q 2015 u 2q ... (clp $ b) 15 15 14 15 15 16 %...
TRANSCRIPT
1

2
1. Highlights 2Q 2015 2. Consolidated Income Statements 3. Retail Business Indicators 4. Stores 5. Financial Business Indicators 6. Financial Statements La Polar S.A. - IFRS a. Consolidated income statements by function b. Consolidated Balance Sheet c. Cash Flow 7. Annex
Notes:
Quarters are named as: 1Q, 2Q, 3Q, 4Q accordingly
Semesters are named as: 1H, 2H accordingly and 12M for year to date
Calendar years are named LTM (Last twelve months)
Currency symbols: CLP $ for Chilean Pesos, US $ U.S. Dollars, M Millions, B Billions

3
1. Highlights 2Q 2015
By the end of the second quarter of 2015, there is a positive EBITDA of CLP $B 1.9, which offset the decline in
the first quarter and thus an accumulated breakeven EBITDA for the first half of 2015. This was accomplished in a very competitive environment under adverse macroeconomic conditions.
Continuing the trend seen in the first quarter, the company continues the second quarter with a significant
improvement in sales and administrative expenses, achieving a reduction of 12.6% over the same period of 2014. This is the result of an extensive savings plan, which included the reduction of executive staff and back office in stores, the closure of two stores in 2014 and a reduction in other expenses to company level. In the 2Q15, we continued with the implementation of self-service model, adapting to the competitive environment with 35 stores fully operational under this model.
The retail segment ended the second quarter of 2015 growing 210 basis points in its gross margin compared to the same period last year. This increase responds to the optimization of product mix with a special emphasis on private labels, which came to represent 39% of total sales versus 35% last year. There was also an improvement in inventory control allowing a decrease in product sales. Thus, although revenue fell by 6.3% getting CLP B$ 77.6 the contribution margin ended at 0.2% over the same period last year, with CLP $B 24.3 compared to CLP B$ respectively.
SSS of the 2Q of 2015 was -4.1% attributed mainly to lower product sales in hard lines of a high base of comparison
associated with sales related to the World Cup in May and June 2014. An increase of 2.3% was observed in the financial business revenue over the first quarter of 2015, with CLP $B
17.8 this quarter compared to CLP $B 28.4 in the 1Q of 2015. There is a stable trend in the financial business indicators throughout 2015, which can be seen in a moderate growth in the loans portfolio and customers with balance. This has led to a steady evolution of both the financial income as indicators of risk in the portfolio.
On April the 24th of 2015, it was held at the headquarters of La Polar the ordinary shareholders' meeting in
which the withdrawal and choice of directory was treated, being chosen the following candidates: a. Jorge Id Sánchez b. Bernardo Fontaine Talavera c. Juan Enrique Vilajuana Rigau d. Pedro Pellegrini Ripamonti e. Richard Urresti Gundlach f. Cristobal Hurtado Rourke g. Alberto Sobredo del Amo (Independent)
On May the 8th of 2015, it was agreed to designate as President of the company Mr. Juan Enrique Vilajuana Rigau and as vice president Mr. Jorge Id Sanchez. They also were appointed as members of the Board of Directors, Jorge Id Sanchez, Pedro Alberto Pellegrini Ripamonti and Alberto Sobredo del Amo as chairman of that committee.

4
On May the 26th of 2015, the Company from the General Treasury of the Republic, a refund for the AT 2014
under the temporary payments for earnings absorbed (PPUA), of CLP $B 9.0. Additionally, on May the 28th of 2015, subsidiaries of the Company, Inversiones SA, Collect SA, Agencia de Publicidad Conexion SA y Operadora y Administradora Nueva Polar SA, together received from the General Treasury of the Republic, returns for the AT 2015 under the temporary payments for earnings absorbed (PPUA), amounting to a total of CLP $B 2.8. All these returns had been considered in previous “Recoverable Taxes” and therefore had no effect on the outcome.
On May the 16h of 2015 the store located in the city of Copiapo, was affected by a fire. Currently work is
underway to reopen the store. La Polar has committed insurance for the property as well as for the merchandise that was in shops and business interruption loss.
Conversion of H Bonds into shares:
Summary of H Bonds coverted into shares at June 30 of 2015:
On the 30h of June of 2015 455,805,357 shares have been converted through H Bonds, equivalent to a 46% of growth over the initial shares on the 6th of February of 2015.
At the end of these financial statements (September 11, 2015) the new shares totaled 535,385,780 and a remaining to convert from H Bond that are equivalents to 1,461,839,624 shares that represent 48.8% of the total potential shares.1
1 Total number of potential shares: 2,995,842,926 (sum of initial actions, bonds converted into shares and to be converted)
N° of Shares 06-02-2015 Shares 30-06-2015 New SharesH Bonds ( eq Shares) not
converted 30-06-2015
998,617,522 1,454,422,879 455.805.357 1.541.419.687

5
2. Consolidated Income Statements P&L 2Q 2015.
P&L 1S 2015.
CLP $ B 2Q 2015 r 2Q 2014 2Q 2015 r 2Q 2014 2Q 2015 r 2Q 2014
Revenues 94.2 -6.1% 100.4 77.6 -6.3% 82.8 17.8 -6.3% 19.0
Costs (60.1) (64.9) (53.3) (58.6) (7.1) (6.6)
Gross Margin 34.1 -3.8% 35.4 24.3 0.2% 24.2 10.8 -13.3% 12.4
% Revenues 36.2% 35.3% 31.3% 29.2% 60.3% 65.2%
SG&A (w/o depreciation) (32.1) -12.6% (36.8) (25.1) -11.7% (28.4) (8.0) -16.1% (9.5)
% Revenues -34.1% -36.6% -32.3% -34.3% -44.8% -50.0%
EBITDA 1.9 (1.3) (0.8) (4.2) 2.8 2.9
% Revenues 2.1% -1.3% -1.1% -5.1% 15.5% 15.2%
Depretiation (2.6) (2.0)
Operating Income (0.6) (3.3)
Non - Operating Income (3.3) (7.5)
Profit (Loss) Before Taxes (3.9) (10.8)
Benefits (Expenses) Income Tax 0.5 (1.0)
Profit (Loss) (3.4) (11.8)
Consolidated Retail Financial
CLP $ B 1H 2015 r 1H 2014 1H 2015 r 1H 2014 1H 2015 r 1H 2014
Revenues 178.9 -6.8% 192.0 146.2 -6.1% 155.8 35.2 -9.9% 39.1
Costs (116.3) (125.3) (103.3) (113.5) (13.5) (12.5)
Gross Margin 62.7 -6.0% 66.7 42.9 1.3% 42.3 21.7 -18.4% 26.6
% Revenues 35.0% 34.7% 29.3% 27.1% 61.7% 68.1%
SG&A (w/o depreciation) (62.7) -10.2% (69.8) (48.2) -8.3% (52.5) (16.4) -15.9% (19.5)
% Revenues -35.0% -36.3% -32.9% -33.7% -46.6% -49.9%
EBITDA 0.0 (3.1) (5.3) (10.2) 5.3 7.1
% Revenues 0.0% -1.6% -3.6% -6.6% 15.1% 18.2%
Depretiation (4.4) (3.8)
Operating Income (4.4) (6.8)
Non - Operating Income (7.6) (14.1)
Profit (Loss) Before Taxes (12.0) (21.0)
Benefits (Expenses) Income Tax 2.7 (0.4)
Profit (Loss) (9.3) (21.4)
Consolidated Retail Financial
6
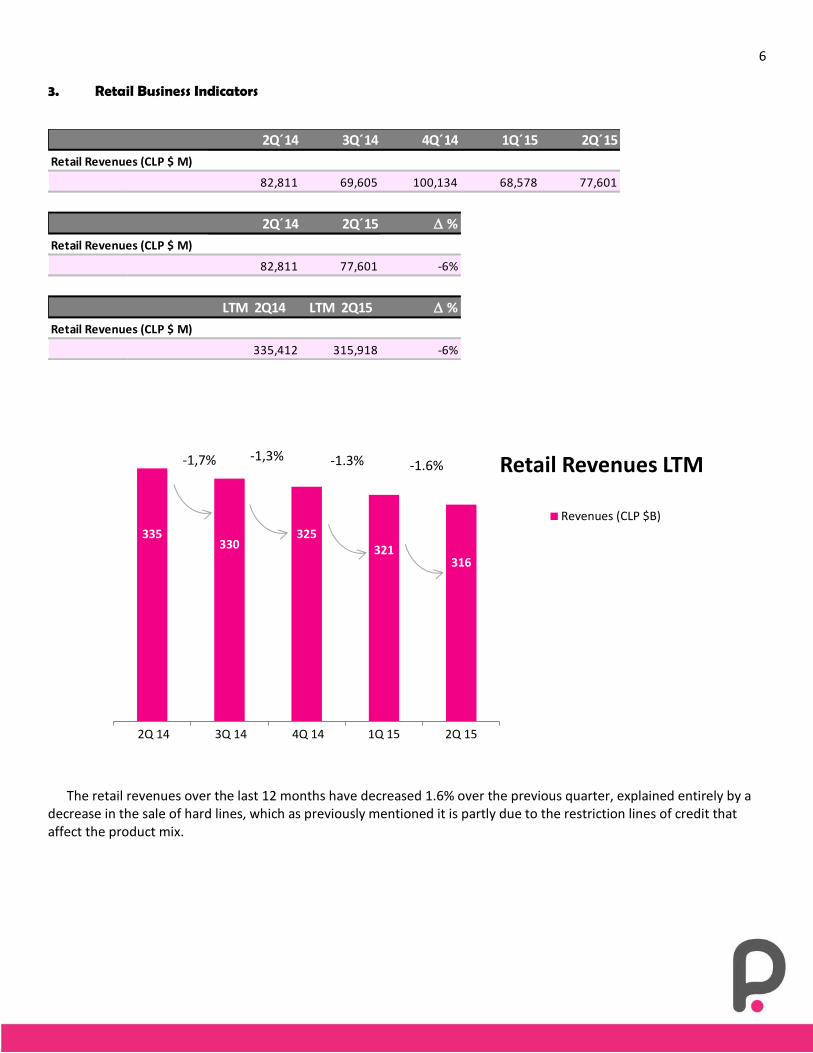
3. Retail Business Indicators
The retail revenues over the last 12 months have decreased 1.6% over the previous quarter, explained entirely by a decrease in the sale of hard lines, which as previously mentioned it is partly due to the restriction lines of credit that affect the product mix.
2Q´14 3Q´14 4Q´14 1Q´15 2Q´15
Retail Revenues (CLP $ M)
82,811 69,605 100,134 68,578 77,601
2Q´14 2Q´15 D %
Retail Revenues (CLP $ M)
82,811 77,601 -6%
LTM 2Q14 LTM 2Q15 D %
Retail Revenues (CLP $ M)
335,412 315,918 -6%
335330
325321
316
2Q 14 3Q 14 4Q 14 1Q 15 2Q 15
Retail Revenues LTM
Revenues (CLP $B)
-1.3%-1,7% -1,3%-1.6%

7
4. Stores
26,7%26,9%
27,8%
28,3%28,8%
2Q 14 3Q 14 4Q 14 1Q 15 2Q 15
Retail Margin % LTM
Sales UF/ sqm
1Q 2Q 3Q 4Q
2014 6.4 7.2 5.9 8.4
2015 5.8 6.6
Var % -10% -9%
2015
Q1 Q2 Q3 Q4 Q1 Q2
Number of Stores 40 40 38 38 38 38
Sales Surface (Thousands sqm) 161,500 160,700 159,700 159,000 159,000 157,000
Revenues ( Th. $ /sqm) 452 515 436 630 431 494
2014

8
5. Financial Business Indicators
Revenues decreased 6% compared to the same period last year, which is mainly explained by a lower average portfolio.
2Q´14 3Q´14 4Q´14 1Q´15 2Q´15
Financial Revenues (CLP $ M)
19,018 16,902 16,606 17,426 17,817
2Q´14 2Q´15 D %
Financial Revenues (CLP $ M)
19,018 17,817 -6%
U12M 1Q14 U12M 1Q15 D %
Financial Revenues (CLP $ M)
78,370 68,751 -12%
78 7773 70 69
2Q 14 3Q 14 4Q 14 1Q 15 2Q 15
Financial Revenues LTM
Revenues (CLP $B)-6,0%
-3,7%
-1,7%
-1,4%

9
Financial Indicators
72%
67%63%
61% 59%
2Q 14 3Q 14 4Q 14 1Q 15 2Q 15
Financial Margin % LTM
FINANCIAL BUSINESS 1Q´14 2Q´14 3Q´14 4Q´14 1Q´15 2Q´15
Credit Card Loan Stock (CLP $ B) 163 153 133 144 136 141
Provision for loan losses (CLP $ B) 15 15 14 15 15 16
% Provision for loan losses 9.1% 9.9% 10.4% 10.3% 10.8% 11.3%
Net loan losses ( CLP $ B) 5 5 9 7 7 6
Open accounts w/balance (Th.) 508 524 492 531 509 526
Average Debt (CLP $ Th.) 322 292 271 271 268 268
% of sales with credit card 49.2% 56.0% 52.5% 51.4% 49.7% 56.5%
2014 2015

10
Credit Card Loans (CLP B$) Credit Card Loan Portfolio (CLP B$)
Loans rose by 12% in the second quarter versus the same period last year. The total portfolio decreased by 6% over the previous year and increased by 2% over the first quarter 2015.
While the risk rate has experienced a rise during 2015, this level of provision at the end of the second quarter of 2015 is considered appropriate limit for the segment in which the company operates. While it is important to note that there is a lower proportion of customers renegotiated 16% versus 18% compared with the same period last year and a greater proportion of current customers with 77% versus 75% respectively.
57 64
2Q´
2014 2015
126 118
27 23
JUN´14 JUN´15
Normal Renegociated
26.2%
22.7%
19.1%
16.1%12.4% 12.9%
10.8%8.3% 7.9%
9.1%9.9% 10.4%
10.3%10,8%
11,3%
DEC´11 MAR´12 JUN´12 SEP´12 DeC´12 MAR´13 JUN´13 SEP´13 DEC´13 MAR´14 JUN´14 SEP´14 DEC´14 MAR´15 JUN´15
Risk Rate
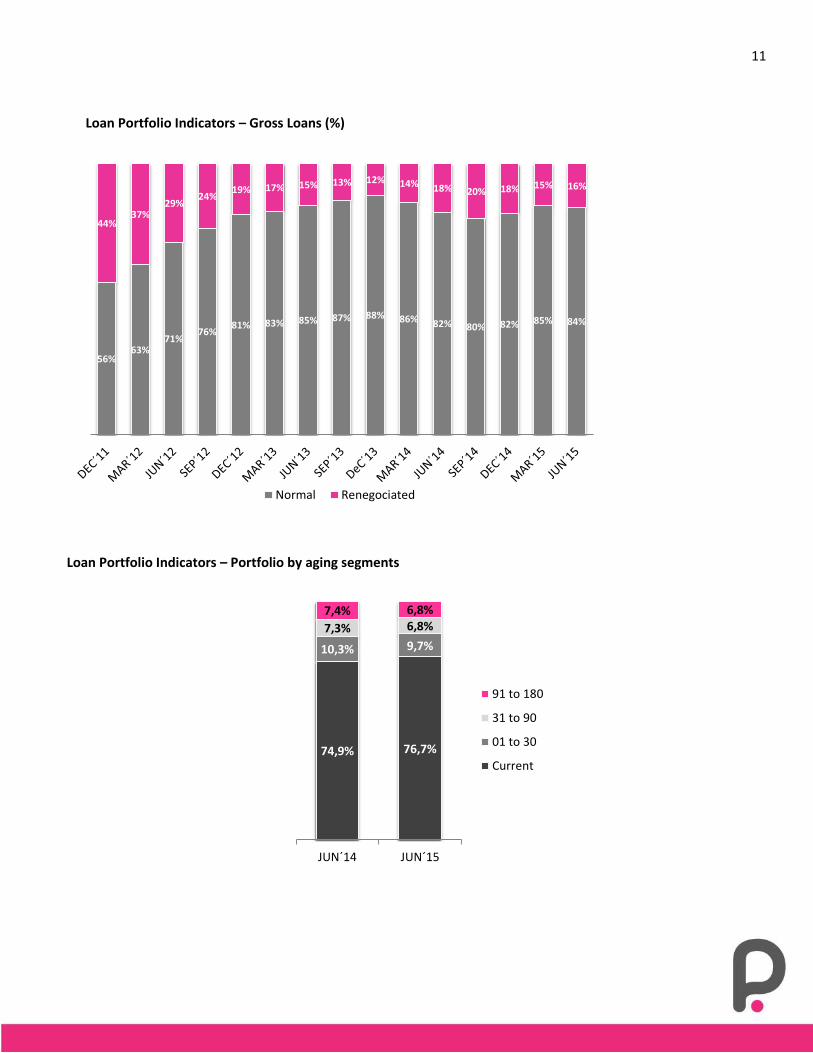
11
Loan Portfolio Indicators – Gross Loans (%)
Loan Portfolio Indicators – Portfolio by aging segments
56%63%
71%76%
81% 83% 85% 87% 88% 86% 82% 80% 82% 85% 84%
44%37%
29%24%
19% 17% 15% 13% 12% 14% 18% 20% 18% 15% 16%
Normal Renegociated
74,9% 76,7%
10,3% 9,7%
7,3% 6,8%7,4% 6,8%
JUN´14 JUN´15
91 to 180
31 to 90
01 to 30
Current
12
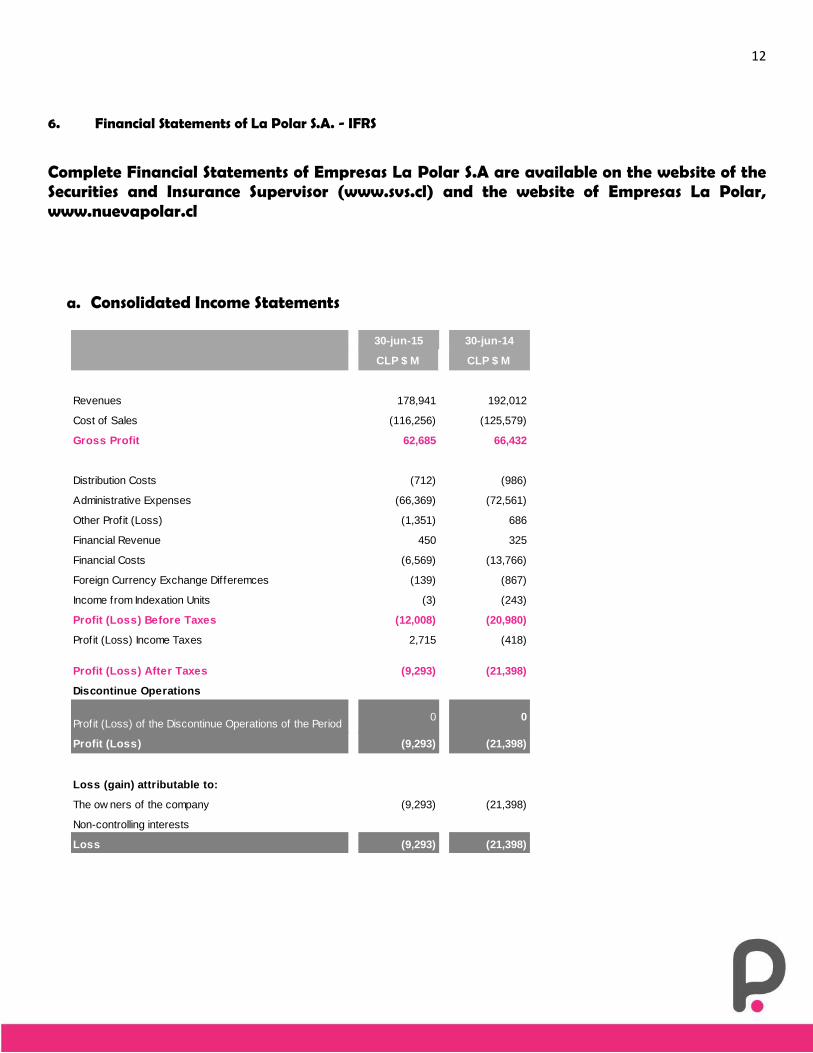
6. Financial Statements of La Polar S.A. - IFRS
Complete Financial Statements of Empresas La Polar S.A are available on the website of the Securities and Insurance Supervisor (www.svs.cl) and the website of Empresas La Polar, www.nuevapolar.cl
a. Consolidated Income Statements
30-jun-15 30-jun-14
CLP $ M CLP $ M
Revenues 178,941 192,012
Cost of Sales (116,256) (125,579)
Gross Profit 62,685 66,432
Distribution Costs (712) (986)
Administrative Expenses (66,369) (72,561)
Other Profit (Loss) (1,351) 686
Financial Revenue 450 325
Financial Costs (6,569) (13,766)
Foreign Currency Exchange Differemces (139) (867)
Income from Indexation Units (3) (243)
Profit (Loss) Before Taxes (12,008) (20,980)
Profit (Loss) Income Taxes 2,715 (418)
Profit (Loss) After Taxes (9,293) (21,398)
Discontinue Operations
Profit (Loss) of the Discontinue Operations of the Period0 0
Profit (Loss) (9,293) (21,398)
Loss (gain) attributable to:
The ow ners of the company (9,293) (21,398)
Non-controlling interests
Loss (9,293) (21,398)

13
31-06-2015 31-12-2014
CLP $ M CLP $ M
Current Assets
Cash and cash equivalents 15,118 20,329
Other current financial assets 835 593
Other current non financial assets 7,078 4,402
Current trade and accounts receivables 114,287 110,031
Inventory 55,573 58,148
Tax assets 26,246 37,338
Total current assets 219,137 230,841
Non - Current Assets
Fees receivable 21,766 31,129
Other non - current financial assets 260 314
Intangible assets other than goodwill 24,099 20,066
Properties, plant and equipment 53,295 59,215
Total Non - Current Assets 99,420 110,723
Non Current Assets held for sale
Total Assets 318,557 341,565
Current Liabilities
Other current financial liabilities 28,988 44,125
Other trade and other accounts payable 54,261 63,863
Other current provisions 3,047 3,385
Current tax liabilities 4,149 4,098
Employee benefits provisions 4,083 4,949
Other current non - financial liabilities 2,038 4,201
Total Current Liabilities 96,566 124,621
Non - Current Liabilities
Other non - current financial liabilities 24,470 186,050
Other long term provisions 2,259 1,730
Defered tax liabilities 51,250 48,322
Total non - current liabilities 77,978 236,101
Liabilities directly associated with non - current assets held for sale
Total Liabilities 174,545 360,722
Equity
Issued capital 313,617 302,678
Retained earnings (347,682) (338,389)
Other reserves 178,077 16,554
Equity attibutable to:
Owners of the parent 144,012 (19,157)
Non - controlling interests -
Total Equity 144,012 (19,157)
Total Liabilities and Equity 318,557 341,565
b. Consolidated Balance Sheet

14
Indicators
Indicators Unit Jun´15 Mar´15 Dec´14 Sep´14 Jun´14
Current Ratio Times 2.27 2.25 1.87 2.03 2.18
Acid Ratio Times 1.69 1.72 1.45 1.5 1.65
Indicators Unit Jun´15 Mar´15 Dec´14 Sep´14 Jun´14
Inventory Turnover Times 4 4 5 4 4
Inventory Turnover Days 91 83 79 92 89
Indicators Unit Jun´15 Mar´15 Dec´14 Sep´14 Jun´14
Average Payment Period Days 188 190 201 169 171
Indicators Unit Jun´15 Mar´15 Dec´14 Sep´14 Jun´14
Average Collection Period Days 60 85 58 62 70
Indicators Unit Jun´15 Mar´15 Dec´14 Sep´14 Jun´14
Current Liabilities % 55.3% 52.4% 33.2% 30.6% 30.8%
Non - Current Liabilities % 44.7% 47.6% 66.8% 69.4% 69.2%

15
c. Cash Flow Statements
30-jun-15 30-jun-14
CLP $ M CLP $ M
Cash Flow from (used in ) operating activities
Proceeds from sales of goods providing activities 210,136 258,682
Payment to suppliers for goods and services (150,157) (203,520)
Payment to and on behalf of employees (27,138) (30,098)
Other payments related to operating activities (42,272) (25,365)
Interest received (163) 1,308
Interest paid (372) (489)
Reimbursed (paid) income taxes 11,746 (710)
Cash Flow from (used in ) operating activities 1,781 (192)
Cash Flow from (used in ) investing activities
Cash receipts from the loss of control of subsidaries and other businesses
Loans to related entities
Proceeds from the sale of property, plant and equipment 13 73
Acquisition of property, plant and equipment (1,190) (2,088)
Proceeds from sales of intangible assets (1,544)
Other incomes (outflows) of cash
Cash Flow from (used in ) investing activities (2,721) (2,015)
Cash Flow from (used in ) financing activities
Proceeds from shot - term borrowings 6,000
Loan payments (2,000) (482)
Payments for finance leases (728) (1,015)
Interest payments (7,543) (4,829)
Cash Flow from (used in ) financing activities (4,271) (6,326)
Net decrease in cash and equivalents (5,211) (8,534)
Cash and cash equivalents at the beginning of the period 20,329 21,403
Cash and cash equivalents at the end of the period 15,118 12,869
Cash Flow Statements

16
7. Annex CLP $M
1Q 2014 2Q 2014 3Q 2014 4Q 2014 1Q 2015 2Q 2015
Retail Business
Revenues 72,942 82,811 69,605 100,134 68,578 77,601
Costs -54,865 -58,603 -51,639 -69,961 -49,974 -53,350
Gross Margin 18,078 24,208 17,966 30,173 18,603 24,252
% Revenues 24.8% 29.2% 25.8% 30.1% 27.1% 31.3%
SG&A (w/o depreciation) -22,002 -26,450 -23,484 -27,174 -23,084 -25,077
EBITDA -3,925 -2,241 -5,518 3,000 -4,480 -825
% Revenues -5.4% -2.7% -7.9% 3.0% -6.5% -1.1%
Financial Business
Revenues 20,087 19,018 16,902 16,606 17,426 17,822
Costs -5,849 -6,619 -6,506 -7,946 -6,433 -7,072
Gross Margin 14,238 12,399 10,395 8,660 10,993 10,750
% Revenues 70.9% 65.2% 61.5% 52.1% 63.1% 60.3%
SG&A (w/o depreciation) -12,070 -11,483 -10,249 -8,407 -8,431 -7,979
EBITDA 2,168 917 147 253 2,562 2,771
% Revenues 10.8% 4.8% 0.9% 1.5% 14.7% 15.5%
Consolidation Adjustments¹Revenues -1,388 -1,459 -1,378 -1,242 -1,279 -1,207
Costs 333 292 277 242 278 295
SG&A (w/o depreciation) 1,055 1,167 1,100 1,001 1,002 912
Consolidated²Revenues 91,641 100,371 85,129 115,498 84,724 94,217
Costs -60,380 -64,930 -57,868 -77,665 -56,129 -60,127
Gross Margin 31,261 35,441 27,261 37,833 28,595 34,090
% Revenues 34.1% 35.3% 32.0% 32.8% 33.8% 36.2%
SG&A (w/o depreciation) -33,018 -36,765 -32,633 -34,580 -30,513 -32,144
EBITDA -1,757 -1,325 -5,372 3,253 -1,918 1,946
% Revenues -1.9% -1.3% -6.3% 2.8% -2.3% 2.1%
¹ Intercompany billing, of the financial business to the retail business for purchases made with the TLP card
² Financial interests that are related to the portfolio financing , which are considered in the cost of sales