1 prepared in cooperation with the lahontan regional water
TRANSCRIPT

1
Prepared in cooperation with the Lahontan Regional Water Quality Control Board
A Plan for Study of Natural and Man-Made Hexavalent Chromium, Cr(VI), in Groundwater near a Mapped Plume, Hinkley, CaliforniaBy John A. Izbicki and Krishangi Groover
U.S. Department of the InteriorU.S. Geological Survey
Open-File Report 2016–1004January 2016
ISSN 2327-6932 (online)http://dx.doi.org/10.3133/ofr20161004
Figure 1. Pacific Gas and Electric (PG&E) compressor station, Hinkley, California, March 2009. (Photo by Steven Perry, Arcadis, Inc., courtesy of PG&E).
The Pacific Gas and Electric Company (PG&E) Hinkley compressor station (fig. 1), in the Mojave Desert 80 miles north-east of Los Angeles, is used to compress natural gas as it is transported through a pipeline from Texas to California. Between 1952 and 1964, cooling water used at the compressor station was treated with a compound containing chromium to prevent corrosion. After cooling, the wastewater was discharged to unlined ponds, resulting in contamination of soil and groundwater in the underlying alluvial aquifer (Lahontan Regional Water Quality Control Board, 2013). Since 1964, cooling-water management practices have been used that do not contribute chromium to groundwater.
In 2007, a PG&E study of the natural background concentrations of hexavalent chromium, Cr(VI), in groundwater estimated average concentrations in the Hinkley area to be 1.2 micrograms per liter (µg/L), with a 95-percent upper-confidence limit of 3.1 µg/L (CH2M-Hill, 2007). The 3.1 µg/L upper-confidence limit was adopted by the Lahontan Regional Water Quality Control Board (RWQCB) as the maximum background concentration used to map the plume extent. In response to criticism of the study’s methodology,
and an increase in the mapped extent of the plume between 2008 and 2011, the Lahontan RWQCB (Lahontan Regional Water Quality Control Board, 2012) agreed that the 2007 PG&E background-concentration study be updated.
The purpose of the updated background study is to evaluate the presence of natural and man-made Cr(VI) near Hinkley, Calif. The study also is to estimate natural background Cr(VI) concentrations in the aquifer upgradient and downgradient from the mapped Cr(VI) contamination plume, as well as in the plume and near its margins. The study was developed by the U.S. Geological Survey (USGS) in collaboration with a technical working group (TWG) composed of community
members, the Independent Review Panel (IRP) Manager (Project Navigator, Ltd.), the Lahontan RWQCB, PG&E, and consultants for PG&E.
The scope of the study includes eight tasks and publication of four reports (table 1, shown on page 12). The proposal is available at http://ca.water.usgs.gov/projects/hinkley/; a video describing the study is available at http://ca.water.usgs.gov/media/hinkley-groundwater-chromium.html. The study agreement was approved by the State Water Resources Control Board in January 2015; field-data collection began in March 2015; the study is scheduled to be completed in December 2019.
2
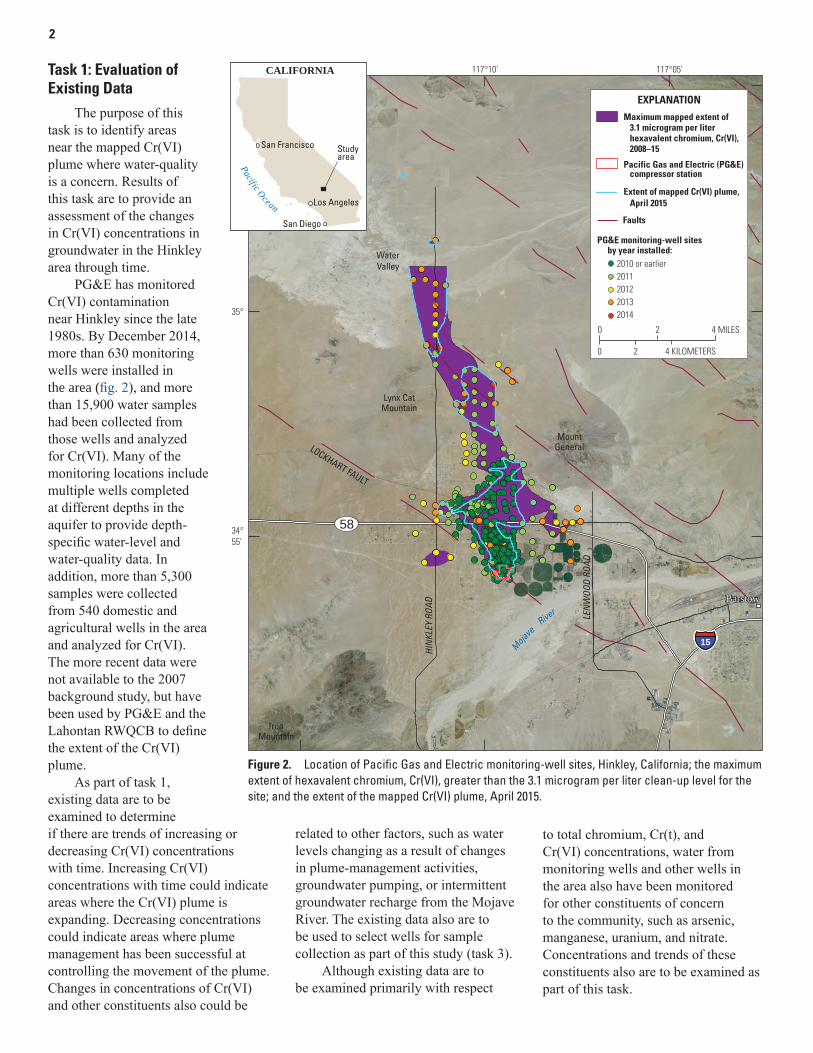
Figure 2. Location of Pacific Gas and Electric monitoring-well sites, Hinkley, California; the maximum extent of hexavalent chromium, Cr(VI), greater than the 3.1 microgram per liter clean-up level for the site; and the extent of the mapped Cr(VI) plume, April 2015.
Task 1: Evaluation of Existing Data
The purpose of this task is to identify areas near the mapped Cr(VI) plume where water-quality is a concern. Results of this task are to provide an assessment of the changes in Cr(VI) concentrations in groundwater in the Hinkley area through time.
PG&E has monitored Cr(VI) contamination near Hinkley since the late 1980s. By December 2014, more than 630 monitoring wells were installed in the area (fig. 2), and more than 15,900 water samples had been collected from those wells and analyzed for Cr(VI). Many of the monitoring locations include multiple wells completed at different depths in the aquifer to provide depth-specific water-level and water-quality data. In addition, more than 5,300 samples were collected from 540 domestic and agricultural wells in the area and analyzed for Cr(VI). The more recent data were not available to the 2007 background study, but have been used by PG&E and the Lahontan RWQCB to define the extent of the Cr(VI) plume.
As part of task 1, existing data are to be examined to determine if there are trends of increasing or decreasing Cr(VI) concentrations with time. Increasing Cr(VI) concentrations with time could indicate areas where the Cr(VI) plume is expanding. Decreasing concentrations could indicate areas where plume management has been successful at controlling the movement of the plume. Changes in concentrations of Cr(VI) and other constituents also could be
related to other factors, such as water levels changing as a result of changes in plume-management activities, groundwater pumping, or intermittent groundwater recharge from the Mojave River. The existing data also are to be used to select wells for sample collection as part of this study (task 3).
Although existing data are to be examined primarily with respect
HIN
KLEY
ROA
D
Lynx CatMountain
WaterValley
§̈¦15
58
117°05'117°10'117°15'35°05'
35°
34°55'
sac15-0586_fig02
IronMountain
Mojave
River
MountGeneralLOCKHART FAULT
PG&E monitoring-well sites by year installed:
2010 or earlier2011201220132014
EXPLANATION
Extent of mapped Cr(VI) plume, April 2015
Maximum mapped extent of 3.1 microgram per liter hexavalent chromium, Cr(VI), 2008–15
Pacific Gas and Electric (PG&E) compressor station
0 2 4 KILOMETERS
0 2 4 MILES
Faults
LEN
WOO
D RO
AD
San Francisco Studyarea
Los Angeles
San Diego
CALIFORNIA
Pacific Ocean
Barstow
to total chromium, Cr(t), and Cr(VI) concentrations, water from monitoring wells and other wells in the area also have been monitored for other constituents of concern to the community, such as arsenic, manganese, uranium, and nitrate. Concentrations and trends of these constituents also are to be examined as part of this task.

3
Task 2: Analyses of Rock and Alluvium
The purpose of this task is to determine if there are natural geologic sources of chromium in the area and if any such sources are contributing Cr(VI) to groundwater. The natural presence of Cr(VI) in groundwater is influenced by a number of factors, including (1) the concentration of chromium in rock and aquifer materials; (2) the minerals in those materials and their weathering rates; and (3) the abundance and reactivity of manganese oxides on the surfaces of mineral grains that can convert trivalent chromium, Cr(III), weath-ered from minerals, to Cr(VI). The pH (a measure of the acidity or alkalinity of water) and reduction-oxidation (redox) conditions of groundwater, particularly with respect to dissolved oxygen that allows Cr(VI) to enter and remain in solution, are to be assessed on the basis of existing water-quality data (task 1) and data collected as part of this study (task 3).
Alluvium from the Mojave River and eroded from rock in the hills surrounding the study area is to be examined in the field by using a hand-held X-ray fluorescence (XRF) instrument (fig. 3). Results are to be compared with XRF measurements of core material from wells installed in the area by PG&E (1) to identify areas where alluvium is derived from local sources in the nearby hills surrounding Hinkley Valley or from more distant sources, such as rocks in the San Gabriel or San Bernardino Mountains that were transported to and deposited in the area by the Mojave River, and (2) to determine whether chromium concentrations in the alluvium that composes the aquifers are high or low relative to average continental abundances. XRF measurements are to include core material from the screened
intervals of wells selected for sample collection in task 3 and to be compared with water-quality data from those wells (task 6).
The XRF data also are to be used as a screening tool to select materials for additional analyses. Those analyses include (1) chemical extractions using increasingly aggressive (reactive) solutions to determine how tightly bound chromium and other selected elements are to the surfaces
of mineral grains (fig. 4); (2) thin-sections to identify minerals associated with high chromium abundance; (3) separation of heavier, denser minerals from lighter, less-dense minerals, coupled with optical and X-ray diffraction (XRD) identification of the denser minerals possibly associated with high chromium abundance; and (4) digestion and chemical analyses of the denser minerals to determine their elemental composition.
The data are to be used to describe the abundance and potential for weathering of chromium-containing minerals. Results from task 2 are to be considered during selection of wells for sample collection (task 3) and for evaluation of the presence of natural and anthropogenic chromium (task 6).
Figure 3. Hand-held X-ray fluorescence (XRF) instrument used to measure concentrations of up to 28 elements (including chromium) in rock, alluvium, and core material from Pacific Gas and Electric (PG&E) monitoring wells, Hinkley, California, March 2015 (core material archived by PG&E in background).
Figure 4. Preparation of sequential chemical extractions from alluvium and core material, Hinkley, California, June 2015.
4
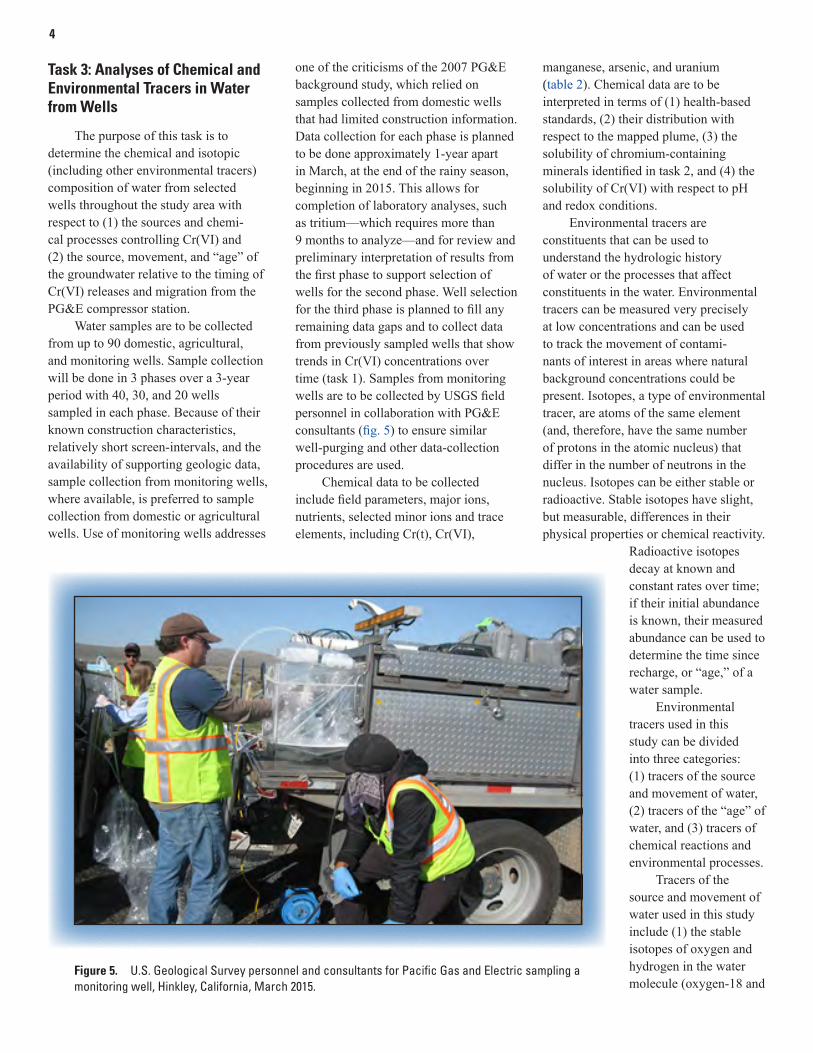
Figure 5. U.S. Geological Survey personnel and consultants for Pacific Gas and Electric sampling a monitoring well, Hinkley, California, March 2015.
Task 3: Analyses of Chemical and Environmental Tracers in Water from Wells
The purpose of this task is to determine the chemical and isotopic (including other environmental tracers) composition of water from selected wells throughout the study area with respect to (1) the sources and chemi-cal processes controlling Cr(VI) and (2) the source, movement, and “age” of the groundwater relative to the timing of Cr(VI) releases and migration from the PG&E compressor station.
Water samples are to be collected from up to 90 domestic, agricultural, and monitoring wells. Sample collection will be done in 3 phases over a 3-year period with 40, 30, and 20 wells sampled in each phase. Because of their known construction characteristics, relatively short screen-intervals, and the availability of supporting geologic data, sample collection from monitoring wells, where available, is preferred to sample collection from domestic or agricultural wells. Use of monitoring wells addresses
one of the criticisms of the 2007 PG&E background study, which relied on samples collected from domestic wells that had limited construction information. Data collection for each phase is planned to be done approximately 1-year apart in March, at the end of the rainy season, beginning in 2015. This allows for completion of laboratory analyses, such as tritium—which requires more than 9 months to analyze—and for review and preliminary interpretation of results from the first phase to support selection of wells for the second phase. Well selection for the third phase is planned to fill any remaining data gaps and to collect data from previously sampled wells that show trends in Cr(VI) concentrations over time (task 1). Samples from monitoring wells are to be collected by USGS field personnel in collaboration with PG&E consultants (fig. 5) to ensure similar well-purging and other data-collection procedures are used.
Chemical data to be collected include field parameters, major ions, nutrients, selected minor ions and trace elements, including Cr(t), Cr(VI),
manganese, arsenic, and uranium (table 2). Chemical data are to be interpreted in terms of (1) health-based standards, (2) their distribution with respect to the mapped plume, (3) the solubility of chromium-containing minerals identified in task 2, and (4) the solubility of Cr(VI) with respect to pH and redox conditions.
Environmental tracers are constituents that can be used to understand the hydrologic history of water or the processes that affect constituents in the water. Environmental tracers can be measured very precisely at low concentrations and can be used to track the movement of contami-nants of interest in areas where natural background concentrations could be present. Isotopes, a type of environmental tracer, are atoms of the same element (and, therefore, have the same number of protons in the atomic nucleus) that differ in the number of neutrons in the nucleus. Isotopes can be either stable or radioactive. Stable isotopes have slight, but measurable, differences in their physical properties or chemical reactivity.
Radioactive isotopes decay at known and constant rates over time; if their initial abundance is known, their measured abundance can be used to determine the time since recharge, or “age,” of a water sample.
Environmental tracers used in this study can be divided into three categories: (1) tracers of the source and movement of water, (2) tracers of the “age” of water, and (3) tracers of chemical reactions and environmental processes.
Tracers of the source and movement of water used in this study include (1) the stable isotopes of oxygen and hydrogen in the water molecule (oxygen-18 and

5
Table 2. Chemical constituents to be analyzed in water from wells as part of task 3 in the U.S. Geological Survey hexavalent chromium, Cr(VI), updated background study, Hinkley, California.
[Field parameters to be measured include water temperature, pH, dissolved oxygen, specific conductance, and alkalinity]
deuterium), which provide information on the source of recharge (for example, Mojave River or runoff in local streams) and the evaporative history of water, and (2) dissolved atmospheric gasses (nitrogen and argon), which record information on recharge processes.
Tracers of the “age” of water include (1) dissolved industrial gasses, including chlorofluorocarbons and sulfur hexafluoride; (2) tritium, a radioactive isotope of hydrogen that
analyses of water samples and a variety of interpretive tools developed for this purpose (fig. 6).
Tracers of chemical reactions and environmental processes include (1) chromium-53, a stable isotope of chromium that can be used to distinguish natural and man-made sources of chromium and processes that control the reduction of Cr(VI) to Cr(III), and (2) strontium-87/86, a ratio of the stable isotopes of strontium that can be used to evaluate the geologic material with which the water has been in contact over time.
Collectively, chemical and environmental tracer data are to be used to evaluate the source, movement, and “age” of water in aquifers underlying the study area to determine (1) the geochemical “footprint” (areal extent) of water recharged during the period of Cr(VI) releases from the PG&E compressor station; (2) older groundwater recharged prior to the releases; and (3) the effect of mixing of water from different recharge sources that have different hydrologic histories, different “ages,” and have been in contact with different geologic materials. Interpretation of these data is to be used to help answer “What Cr(VI) is associated with PG&E releases from the compressor station, and what is not?” (task 6).
Figure 6. U.S. Geological Survey field personnel organizing bottle sets used to collect water samples, Hinkley, California, March 2015.
has a half-life of 12.3 years, and its decay product helium-3; and (3) carbon-14, a radioactive isotope of carbon that has a half-life of 5,730 years, and carbon-13, a stable isotope of carbon. Many tracers of the “age” of water are affected by processes during groundwater recharge, chemical reactions in the aquifer, and mixing of water from different sources. These processes are to be evaluated by using results from
Nutrients,in milligrams per liter
Reporting limit
Ammonia, as nitrogen 0.01
Ammonia plus organic nitrogen as nitrogen 0.07
Nitrite, as nitrogen 0.0011Nitrite plus nitrate, as
nitrogen 0.04
Phosphorous 0.02
Orthophosphorous, as phosphorous 0.004
1Nitrate calculated by difference from nitrite and nitrite plus nitrate.
Trace elements,in micrograms per liter
Reporting limit
Antimony 0.03
Aluminum 2.2
Arsenic 0.1
Barium 0.3
Boron 2
Cadmium 0.3
Chromium 0.2
Iron 3.2
Lithium 0.1
Manganese 0.1
Uranium 0.1
Vanadium 0.6
Major ions,in milligrams per liter
Reporting limit
Alkalinity (bicarbonate) 4.6
Calcium 0.02
Chloride 0.02
Fluoride 0.04
Mangnesium 0.01
Potassium 0.03
Silica 0.02
Sodium 0.06
Sulfate 0.02
Residue on evaporation(dissolved solids) 20
Minor ions,in micrograms per liter
Reporting limit
Bromide 30Iodide 1Strontium 0.2
Reduction-oxidation couples,in micrograms per liter
Reporting limit2Iron/iron II 2 / 22Arsenic/arsenic III 0.2 / 0.52Chromium/chromium VI 0.2 / 0.06
2Iron III, arsenic V, and chromium III calculated by difference from their respective reduction-oxidation couples.

6
geology and hydrology in the western, northern (including Water Valley), and eastern (including the plume and upgradient areas) subareas (fig. 7)
influence concentrations of natural Cr(VI) in groundwater and the movement of Cr(VI) released from the compressor station. The scope of work
Figure 7. Map showing features of hexavalent chromium study, Hinkley, California: western, northern (including Water Valley), and eastern (including the mapped plume and upgradient) subareas, Pacific Gas and Electric monitoring wells, monitoring wells installed for flow-path studies, U.S. Geological Survey multiple-well monitoring sites, and domestic wells.
Task 4: Evaluation of Local Conditions
The purpose of this task is to determine how differences in local
!
!
!
!
!
§̈¦15
58
117°05'117°10'117°15'
35°05'
35°
34°55'
LOCKHART FAULT
LOCKHART FAULT
HINKLEY ROAD
Lynx CatMountain
WaterValley
IronMountain
Mojave River
MountGeneral
sac15-0586_fig07
EXPLANATION
Pacific Gas and Electric (PG&E) compressor station
SubareasEastern and upgradient
Faults
Extent of mapped Cr(VI) plume April 2015; dashed where uncertain.
U.S. Geological Survey multiple-well monitoring sites
Domestic wells sampled by PG&E
PG&E monitoring-well sites
PG&E monitoring-well sites for flowpath studies
Maximum mapped extent of 3.1 microgram per liter hexavalent chromium VI, Cr(VI),
2008–15
NorthernWestern
0 2 4 KILOMETERS
0 2 4 MILES
LENW
OOD ROAD
San Francisco Studyarea
Los Angeles
San Diego
CALIFORNIA
Pacific Ocean
Barstow

7
Figure 9. Test-drilling by consultants for Pacific Gas and Electric to install monitoring wells for flow-path studies, Hinkley, California, August 2015.
Figure 8. U.S. Geological Survey field crew preparing to set a temporary pump for borehole-geophysical data collection in a well, Hinkley, California, June 2015 (Roger Killian, Hinkley Technical Working Group, in foreground).
for this task is intended to be flexible, so that issues important to the background study that were not apparent during the initial development of the study can be addressed as the study progresses. This task includes a combination of (1) test drilling and monitoring-well installation for groundwater flow-path studies, (2) collection of surface-geophysical data (primarily gravity measurements) to estimate aquifer thickness, (3) collection of borehole-geophysical data to assess aquifer properties and lithology (fig. 8), and (4) collection of hydraulic data for estimation of aquifer properties that control the movement of water and Cr(VI) in the plume and in downgradient areas.
In the western subarea, data are to be collected (1) to estimate the thickness of alluvial deposits; (2) to assess the hydraulic connection between weathered bedrock and overlying alluvial deposits in the aquifer; and (3) to evaluate the effect of the Lockhart Fault, which crosses the western subarea, on groundwater movement. In the northern subarea, data are to be collected on aquifer thickness and
hydraulic properties. Spatial variation in aquifer properties to the north are to be related to differences in the sources and depositional environments of alluvium identified on the basis of XRF data (task 2) and chemical and isotopic data (task 3). In the eastern subarea, borehole geophysical data are to be collected to assess changes in the hydraulic properties of the aquifer with depth. Additionally, test drilling and monitoring-well installation are to be done by PG&E consultants in upgradient areas to facilitate flow-path studies (fig. 9). The flow-path studies are designed to provide data on Cr(VI) concentra-tions, aquifer properties, rates of groundwater movement, and geochemical reactions in the aquifer upgradient of the compressor station. Data collec-tion in each subarea supplements data collected by PG&E during recent years.
As part of task 4, a conceptual geologic framework is to be developed to explain the origin of alluvial and lacustrine deposits in the Hinkley Valley. The conceptual geologic framework is to be based on interpretations made from examinations of core material (task 2) that are supported by water chemistry, environmental-tracer (task 3), geophysical, and hydraulic-property data (collected as part of this task). The conceptual geologic framework is intended to explain some of the differences in geohydrologic units, hydrology, and geochemistry among the western, northern, and eastern subareas. The conceptual geologic framework can provide information to improve the existing conceptual hydrologic model and simulations of groundwater flow in the study area (task 5).

8
Figure 10. Model extent for existing Pacific Gas and Electric (PG&E) groundwater-flow model and for updated groundwater-flow model, Hinkley, California.
and infiltration of streamflow from the Mojave River, are to be derived from the existing PG&E or USGS models and data from other recent studies. Areal and local recharge data are to be derived from basin-scale climate and hydrologic data (http://ca.water.usgs.gov/projects/reg_hydro/projects/dataset.html). Model calibration is to include comparison of field-measured and model-simulated hydrographs and water-level contours. A comparison of water-budget estimates from the updated and existing models is planned.
The updated model is to be constrained by chemical and
environmental-tracer data (task 3) by using a technique known as “particle tracking.” The simulated movement of model particles can be used (1) to evaluate the “footprint” of water recharged during the period of Cr(VI) releases and (2) to estimate the extent of the PG&E Cr(VI) contaminant plume through time. The model simulation results can provide a better understanding of groundwater flow than can be determined from analyses of field data alone. The updated model is not intended to simulate chemical processes affecting the movement of Cr(VI).
Task 5: Evaluation of Groundwater Movement
The purpose of this task is to evaluate how changes in hydrologic conditions over time have influenced the movement of water and Cr(VI) through the aquifer underlying Hinkley Valley.
It is not possible to go back in time and measure the movement of Cr(VI) from the PG&E compressor station following the releases. It is possible, however, to assemble available geologic and hydrologic data in a computer simulation, or model, of groundwater flow in Hinkley Valley and to use that model to estimate what could have happened after the Cr(VI) releases.
Two models of groundwater flow have been developed for the study area. Both models use the USGS computer code MODFLOW. The PG&E model simulates groundwater flow in Hinkley Valley near and downgradient from the compressor station (fig. 10; ARCADIS/CH2M-Hill, 2011) from the period 1990 to 2010 and is used to evaluate various plume-management alternatives. The USGS model simulates regional groundwater flow in the larger Mojave River basin (Stamos and others, 2001) and is used to evaluate regional water-management alternatives. The USGS model has limited hydrogeologic detail in the Hinkley area, but simulates groundwater flow from 1931 to 1999, which includes the period of Cr(VI) releases. Although each model is suitable for its intended use, neither model is suitable, without modification, for the purposes of this background study.
As part of this task, the PG&E flow model is to be updated and expanded to include a larger area so that model boundaries coincide with hydrologic boundaries (fig. 10). The updated model is to simulate groundwater flow from 1931 to 2010, which includes the period of the releases of Cr(VI) from the compressor station.
The model updates are to be done by PG&E consultants in collaboration with the USGS and include additional data on the distribution and layering of hydraulic properties that conform to the conceptual geologic framework developed as part of task 4. Model inputs, including pumping
58
247
§̈¦15
LOCKHART FAULT
HIN
KLEY
ROA D
Lynx CatMountain
BlackMountain
WaterValley
IronMountain
MountGeneral
LEN
WOO
D
RO
AD
Moja
ve
River
Barstow
Existing groundwater-flow model boundary
Updated groundwater-flow model boundary
Fault
EXPLANATION
0 2 4 MILES
0 4 KILOMETERS2
PG&E compressor station
117°05'117°10'117°15'
35°05'
35°
34°55'
34°50'
San Francisco Studyarea
Los Angeles
San Diego
CALIFORNIA
Pacific Ocean

9
Figure 12. U.S. Geological Survey mobile laboratory and equipment to analyze chromium (VI).
Figure 11. Chromium-containing rocks and soils in California: A, chromium-containing rocks, and, B, chromium-containing soils (modified from Izbicki and others, 2015).
of the study area affected by discharges from the PG&E compressor station.
The estimated Cr(VI) background concentrations could differ among the western, northern, and eastern subareas as a result of local differences in geology, hydrology, land use, and other factors. As a consequence, there could be different values used for plume management and clean-up goals in different parts of the study area.
The exact nature and statistical rigor associated with estimates of background Cr(VI) concentrations have not yet been determined. For example, is it necessary to precisely estimate background Cr(VI)
concentrations in areas that have distinctive geology or hydrology and where results of task 6 show Cr(VI) is natural and not related to releases from the compressor station? How are background Cr(VI) concentrations to be estimated in areas where contamination is present at concentrations greater than what would be natural, but existing wells representative of pre-release conditions do not exist? These issues are to be discussed in the second report from the study, to be prepared in 2016.
from domestic wells in the study area to provide information on Cr(VI) concentrations in areas not sampled by monitoring wells. These data are to be analyzed onsite in a mobile laboratory (fig. 12). Data from task 6 are to be used to supple-ment data collected as part of task 3 and, if appropriate, to guide selection of additional wells for analyses as part of task 3.
The USGS plans to assemble data from the previous five tasks, ranking relevant data to simplify complex data sets and produce understandable graphics to facilitate input and discussion from TWG members during data interpretation. Final interpretation of the data is to be process oriented, and data interpretation is the responsibility of the USGS.
Task 7: Estimation of Background Chromium (VI) Concentrations
The purpose of this task is to estimate background Cr(VI) in the parts
Hydrogeologic province boundary
Soil chromium(depth = 0–5 centimeters),in milligrams per kilogram
56–2,85046–5540–4536–3931–35
27–3022–2617–2111–16<1–10
EXPLANATION
116°
118°
120°122°124°42°
40°
38°
36°
34°
San Francisco
Los AngelesLos Angeles
HinkleyHinkleyHinkleyHinkley
Figure 1
B
EXPLANATIONChromium- containing ultramafic rock
Hydrogeologic province boundary
0 100 MILES50
0 100 KILOMETERS50
116°
118°
120°122°124°42°
40°
38°
36°
34°PACIFIC OCEAN
San Francisco
Los AngelesLos Angeles
A
Hydrogeologicprovince
1 Central Valley2 Desert3 Basin and Range4 Klamath Mountains5 Modoc Plateau and Cascades6 Northern Coast Ranges7 Southern Coast Ranges8 San Diego9 Sierra Nevada10 Transverse and selected Peninsular Ranges
1
2
3
4 5
6
7
8
9
10
PACIFIC OCEAN
Task 6: Evaluation of Natural and Man-Made Chromium (VI)
The purpose of this task is to identify areas in the aquifer containing man-made Cr(VI) from releases at the PG&E compressor station and areas that contain Cr(VI) from other sources. Although rocks and soils in the study area have comparative low chromium concentrations (fig. 11), some natural chromium may be present.
Data and results from the previous five tasks can be interpreted to answer the question “What Cr(VI) is associated with PG&E releases from the compressor station, and what is not?” This question was not addressed as part of the 2007 background study.
Mineralogical (task 2), chemical, environmental-tracer, and groundwater “age” information (task 3); increased understanding of local geology and hydrology (task 4); and results from the groundwater-flow model (task 5) are expected to provide information on areas that likely were affected by releases from the PG&E compressor station and to identify areas that likely were not affected by releases, but could contain natural Cr(VI). As part of this task, additional Cr(VI) data are to be collected

10
Figure 13. Experimental microcosms used to evaluate the potential reoxidation of trace elements over time.
Task 8: Fate of Chromium During and After In Situ Reduction
To create reduced conditions, where dissolved oxygen is depleted, PG&E is injecting ethanol into wells in the Cr(VI) contamination plume in an area known as the “in situ reactive zone” (IRZ). Reduced conditions in the IRZ convert Cr(VI) to Cr(III), which is only sparingly soluble and is removed from groundwater. The purpose of this task is to determine whether chromium is permanently removed by the IRZ or if changes in hydrology (such as large amounts of groundwater recharge from the Mojave River) that result in oxic conditions (where dissolved oxygen is present) in the IRZ can convert Cr(III) back to Cr(VI) and allow it to reenter groundwater.
There are several factors that could control the mobility of chromium sorbed to aquifer materials in the IRZ. Two factors to be investigated include (1) changes in how chromium is sorbed and mineralized over time and (2) the rate of re-oxidation of sorbed Cr(III) to Cr(VI).
First, chromium sorbed to aquifer materials can be weakly sorbed (and potentially more reactive), more strongly sorbed (and potentially less reactive), or incorporated into the crystalline structure of iron and manganese oxide coatings on the mineral grains that compose the aquifer (least reactive). The nature of chromium sorption could change with time as weakly sorbed chromium is incorporated into less reactive materials. The less abundant, natural stable isotopes of chromium (chromium-50 and chromium-54) are to be used to track the sorption of chromium on aquifer materials in experimental microcosms.
Second, if geochemical conditions change, and groundwater once again becomes oxic, Cr(III) could oxidize to Cr(VI) and reenter groundwater. If Cr(III) is oxidized, is the rate of oxidation environmentally meaningful over decadal time scales? Specialized techniques, such as X-ray absorption near-edge structure (XANES)
spectroscopy, can be used to measure the presence of small concentrations of Cr(VI) oxidized in the experimental microcosms.
These issues are to be investigated in a series of laboratory microcosm studies of aquifer materials under controlled conditions for a period of 2 years (fig. 13). Numerous microcosms are to be set-up at the beginning of the experiment and then harvested periodically to provide time-series data. The experimental design considers a range of factors, including (1) the number of microcosms and harvest times needed to provide time-series data on the composition of the water/solid mixture in each microcosm; (2) the amount of ethanol to be added to each microcosm to create conditions similar to those found in the IRZ without under-dosing or over-dosing; (3) the need for buffers to control pH; (4) the use of suitable materials to allow exchange with atmospheric oxygen (for aerobic microcosms), while limiting water loss; and (5) the mass of chromium isotopes to be used as tracers.
These experiments cannot perfectly replicate field conditions and, because
of project time constraints, can only be run for about 2 years. Results, however, are expected to provide a basis for management decisions that need to consider the longer time frames present in the field setting.
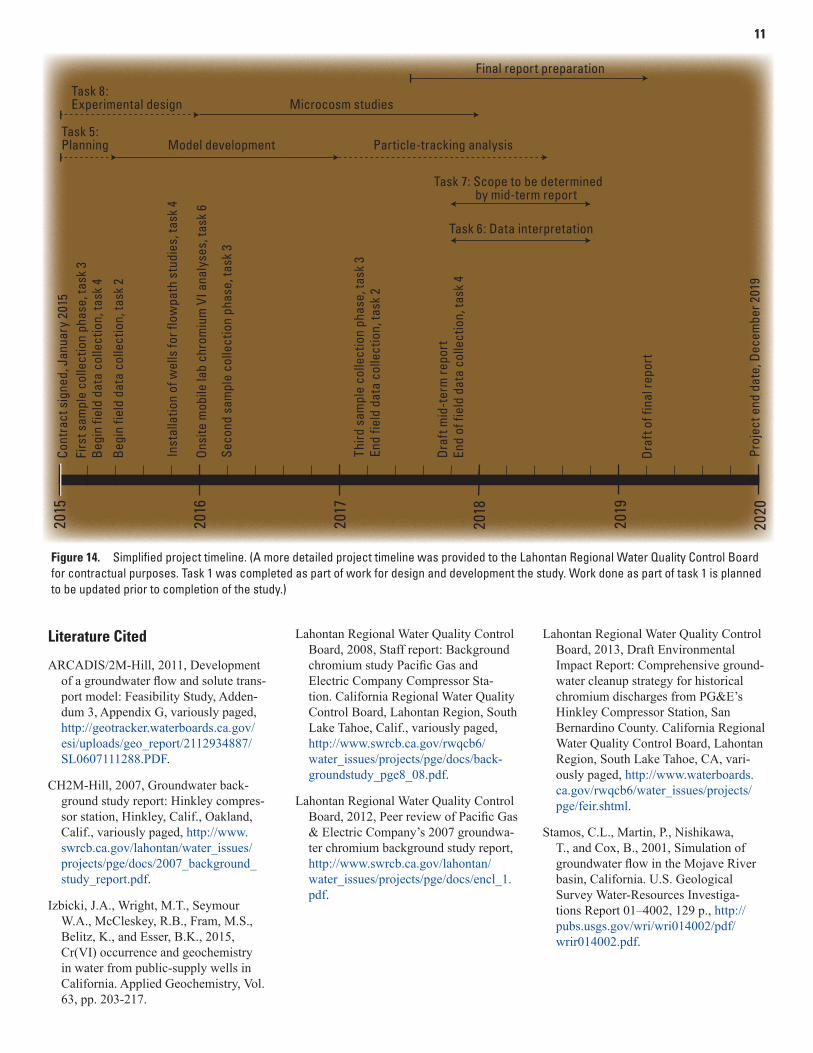
Project Timeline and Reports
The study is to be completed in December 2019. Important project milestones are shown in figure 14. Several USGS-authored reports are planned: (1) a study overview (this report); (2) a mid-term report that refines the project scope for remaining work, especially tasks 6 and 7, on the basis of preliminary results; and (3) a final report documenting study results. The final report may take the form of a large report that has several chapters cor-responding to study tasks or of several smaller reports. In addition, a fact-sheet style report is planned to summarize the study results.
Data from the study are to be made publically available and, after review by the USGS and TWG, posted on the USGS online data base, NWIS-web, at http://waterdata.usgs.gov/nwis.
11
Literature Cited
ARCADIS/2M-Hill, 2011, Development of a groundwater flow and solute trans-port model: Feasibility Study, Adden-dum 3, Appendix G, variously paged, http://geotracker.waterboards.ca.gov/esi/uploads/geo_report/2112934887/SL0607111288.PDF.
CH2M-Hill, 2007, Groundwater back-ground study report: Hinkley compres-sor station, Hinkley, Calif., Oakland, Calif., variously paged, http://www.swrcb.ca.gov/lahontan/water_issues/projects/pge/docs/2007_background_study_report.pdf.
Izbicki, J.A., Wright, M.T., Seymour W.A., McCleskey, R.B., Fram, M.S., Belitz, K., and Esser, B.K., 2015, Cr(VI) occurrence and geochemistry in water from public-supply wells in California. Applied Geochemistry, Vol. 63, pp. 203-217.
Lahontan Regional Water Quality Control Board, 2008, Staff report: Background chromium study Pacific Gas and Electric Company Compressor Sta-tion. California Regional Water Quality Control Board, Lahontan Region, South Lake Tahoe, Calif., variously paged, http://www.swrcb.ca.gov/rwqcb6/water_issues/projects/pge/docs/back-groundstudy_pge8_08.pdf.
Lahontan Regional Water Quality Control Board, 2012, Peer review of Pacific Gas & Electric Company’s 2007 groundwa-ter chromium background study report, http://www.swrcb.ca.gov/lahontan/water_issues/projects/pge/docs/encl_1.pdf.
Lahontan Regional Water Quality Control Board, 2013, Draft Environmental Impact Report: Comprehensive ground-water cleanup strategy for historical chromium discharges from PG&E’s Hinkley Compressor Station, San Bernardino County. California Regional Water Quality Control Board, Lahontan Region, South Lake Tahoe, CA, vari-ously paged, http://www.waterboards.ca.gov/rwqcb6/water_issues/projects/pge/feir.shtml.
Stamos, C.L., Martin, P., Nishikawa, T., and Cox, B., 2001, Simulation of groundwater flow in the Mojave River basin, California. U.S. Geological Survey Water-Resources Investiga-tions Report 01–4002, 129 p., http://pubs.usgs.gov/wri/wri014002/pdf/wrir014002.pdf.
sac15-0586_fig13
2015
2016
2017
2018
2019
2020
Cont
ract
sig
ned,
Jan
uary
201
5Fi
rst s
ampl
e co
llect
ion
phas
e, ta
sk 3
Beg
in fi
eld
data
col
lect
ion,
task
4
Beg
in fi
eld
data
col
lect
ion,
task
2
Inst
alla
tion
of w
ells
for f
low
path
stu
dies
, tas
k 4
Ons
ite m
obile
lab
chro
miu
m V
I ana
lyse
s, ta
sk 6
Seco
nd s
ampl
e co
llect
ion
phas
e, ta
sk 3
Third
sam
ple
colle
ctio
n ph
ase,
task
3En
d fie
ld d
ata
colle
ctio
n, ta
sk 2
Draf
t of f
inal
repo
rt
Proj
ect e
nd d
ate,
Dec
embe
r 201
9
Draf
t mid
-ter
m re
port
End
of fi
eld
data
col
lect
ion,
task
4
Final report preparation
Task 6: Data interpretation
Task 7: Scope to be determined by mid-term report
Task 8:Experimental design
Model development
Microcosm studies
Task 5:Planning Particle-tracking analysis
Figure 14. Simplified project timeline. (A more detailed project timeline was provided to the Lahontan Regional Water Quality Control Board for contractual purposes. Task 1 was completed as part of work for design and development the study. Work done as part of task 1 is planned to be updated prior to completion of the study.)

12
Other ResourcesTechnical documents and
regulatory orders related to the Cr(VI) contamination at Hinkley are available from the Lahontan RWQCB website, http://www.waterboards.ca.gov/lahontan/water_issues/projects/pge/index.shtml.
Table 1. Tasks and questions addressed by the U.S. Geological Survey background study, January 2015 to December 2019, Hinkley, California.
Task PurposeTask 1: Evaluation of existing data. Identify areas near the mapped hexavalent chromium, Cr(VI),
plume having water-quality of concern to the study.
Task 2: Analyses of rock and alluvium.
Determine if there are natural geologic sources of chromium in the area and if these sources are contributing Cr(VI) to ground-water.
Task 3: Analyses of chemical and environmental tracers in water from wells.
Determine the chemical and isotopic (including other environmental tracers) composition of water from selected wells throughout the study area with respect to (1) the sources and chemical processes controlling Cr(VI) occurrence and (2) the source, movement, and age of the groundwater relative to the timing of Cr(VI) releases from the Pacific Gas and Electric (PG&E) compressor station.
Task 4: Evaluation of local conditions. Determine how differences in local geohydrology in the western, northern (including Water Valley), and eastern (including the plume and upgradient area) subareas influence natural Cr(VI) in groundwater and the movement of anthropogenic (man-made) Cr(VI) from the compressor station.
Task 5: Evaluation of groundwater movement.
Evaluate how changing hydrologic conditions in the study area over time influence the movement of water and Cr(VI) through aquifers underlying Hinkley Valley.
Task 6: Evaluation of the presence of natural and anthropogenic Cr(VI).
Identify areas in the aquifer containing man-made Cr(VI) from releases at the PG&E compressor station and areas that contain Cr(VI) from other sources.
Task 7: Estimation of background Cr(VI) concentrations.
Estimate background Cr(VI) in parts of the study area affected by discharges from the PG&E compressor station.
Task 8: Fate of chromium during and after in situ reduction.
Determine if chromium in the in situ reactive zone is permanently removed from solution.
Report preparation and project timeline. Four reports are identified in the proposal, and completion of the project is scheduled for December 2019.
Other documents intended for the public and interested stakeholders are available from the IRP Manager web-site, http://www.hinkleygroundwater.com/.
AcknowledgmentsThis work is being done under
an agreement with the State Water Resources Control Board with funding provided by Pacific Gas and Electric. Funding for the study is held in trust by the State in an escrow account to ensure unbiased and independent completion of the study.