1 presenting information communicating meaning health management information systems joão carlos de...
TRANSCRIPT

1
Presenting informationcommunicating meaning
Health Management Information Systems
João Carlos de Timóteo Mavimbe
Oslo, April 2007

2
Presenting Presenting informationinformation
LEARNING OUTCOMES:
By the end of the session you should be able to:
Understand the purposes and basic principles of data presentation
Present data in simple tables
Select appropriate graph types to present the various types of data
Build appropriate graphs for display of data
Develop skills in proper presentation of information

3
The information cycle: Presenting Information
Collection
InputRaw data
PresentingInterpreting
USEANALYSIS Processing
Tables, Graphs, Population, Maps

4
Preparing for Presentationessential ingredients: 3 C + 1 Tessential ingredients: 3 C + 1 T
Correct good quality data
Complete submission by all (most) reporting facilities
Consistent data within normal ranges
reflects community shifts
clear definitions
Timely

5
Presenting information
What information is presented?
Why is information presented?
How is information presented?

6
What What “information“information” is ” is presented?presented?
Analysed data (mainly)
Collated data (sometimes)
Raw data (rarely)

7
Why is Why is information information presentedpresented??
To promote understanding and facilitate interpretation:
Appropriate interpretations what linkages are possible? (correct, logical, sensible) may answer important questions may result in action Possible interpretations are context dependent (population, health, service status) depend on data quality should depart from data definitions

8
Why is Why is information information presentedpresented??
To share knowledge with whom?
To provide feedback to whom?

9
How is information How is information presented?presented?
Three ways of presenting data:
1. Tabular: frequency distribution table
2. Graphs: Histogram, Line diagrams, Scatter plot, Bar chart, Pie chart
3. Numerical:
Measures of Typicality or Center: mode, median, mean
Measures of Variability (or Spread): range, variance, SD
Measures of Shape: skewness, kurtosis
Proportions, rates, ratios

10
Types of data
Data
Qualitative, Non- Numerical or Categorical
Discrete
Quantitative or Numerical
Discrete
Continuous
They determine the most appropriate tool for presenting data.

11
Data
Quantitative(Numbers)
Qualitative(Characteristics)
Discrete Continuous
Discretecategories/ kinds
counts measures

12
Numerical Data
Continuous – they are measurablemeasurable Examples:
Age of patients in years or months Weight of newborn in grams
Discrete – they are countedcounted (possible values are distinct or separate): Examples:
The size of a family expressed as the number of children
The number of days since the begining of a disease
units of measurement

13
Non-numerical Data
They are the qualitative description of categories of a characteristic.
Examples:The gender of a patient is recorded as
“male” or “female”;The list of diagnoses in a health center;

14
Exercise:Mark with in the blank spaces
Data Quantitative Qualitative Discrete Continuous Discrete
Number of beds per HC Bed ocupation Addresses of patients Number of children Patient temperature in ºC Cost of a drug presciption Population of a village Age of patients in years Number of broken vials Health area

15
BEDS
Number of bedsType of bedHeight of the bed
(from mattress to floor)
– an example of how a single data element may provide different types of data.

16
Tables: saying it with figures
TitleColumn
Row Cell
Source: Comments: Date:___/___/___
Table No.

17
TablesTables Beware information overload:
easy to produce – difficult to use
Ideally should contain:
Few rows
One category
Uses:
assess quality
trends over time
make comparisons
pick up outliers, gaps

18
Tables
Number of Children Frequency %0 7 6,71 10 9,62 15 14,43 25 24,04 21 20,25 10 9,66 6 5,87 5 4,88 2 1,99 3 2,9
Total 104 100,0
Table 1: Number of children per family in Maputo, 2005
Source: Statistics & Planning Directorate, 2005

19
GRAPHS: talking with pictures(…a visual representation of data)
Advantages: Information is instantly conveyed Data are presented clearly and simply Can expose relationships and patterns Detect trends over time Can be used to emphasise information

20
Graph ElementsGraph ElementsGraph 1: Clinic Alpha -PHC Headcount, 2001
0
200
400
600
800
1000
1200
Jan Feb Mar Apr May Jun
num
bers
PHC Headcount
X
Y
Title – descriptive clinic name, what is graphed and the time period
Y axis – must ALWAYS be labeled
Y axis label
X axis – label if appropriate
Key or legend – used if more than one element graphed
Scale – be appropriate
Source: Notes:

21
Golden rules for graphs
1. Never put too much information in the graph. KEEP IT SIMPLE.2. Never mix different activities: stick to one group of people or
diseases or services.3. Label your graph: always have a clear heading, easily read
labels on the axes, and a legend which explains each of the lines or bars.
4. Select scales that fit the entire graph on both axes.5. Where possible, draw a target line or reference point to show
where you are aiming at.

22
Types of graphs They follow the types of data available:
Data
Quantitative(Numbers)
Qualitative(Characteristics)
Discrete Continuous
Discretecategories/ kinds
counts measures

23
Type of graphs
Continuous data histograms line Graphs scatter Graphs
Discrete Data bar graphs pie charts

24
Graphs for sets of continuous data
a) histogramsb) line graphsc) cumulative line graphs

25
Line graphLine graph
0
100
200
300
400
Jan Feb Mar Apr May Jun
accurate, can show minute changes in the relationships between 2 major variables
displays trends over time
can be useful if more than one data item is used
Graph 2: PHC headcount under 5 years old, Manyara Clinic, 2001

26
Bar graph versus Line graph which one is best?

27
Line graph, with 2 dependent variables
Cases of Malaria and Diarrhoea among children, year 2000, Marrupa district
020406080
100120
case
s
Plasmodium +Diarrhoea
Remember to remove the silly gray background to improve contrast!
The larger the font, less detail will be shown in the axes

28
Line graph, for cumulative Line graph, for cumulative coveragecoverage
Clinic Alpha : EPI : Cumulative Coverage of Children Fully Immunised 2000
0
20
40
60
80
100
%
Monthly Immunisation Cumulative Immunisation
Monthly Immunisation 4 5.3 6.2 3.8 5.6 7.3 6.8 7 5.9 6.7 7.5 5.8
Cumulative Immunisation 4 9.3 15.5 19.3 24.9 32.2 39 46 51.9 58.6 66.1 71.9
Jan Feb Mar Apr May Jun Jul Aug Sep Oct Nov Dec
Target line

29
Line graph, for cumulative coverageLine graph, for cumulative coverage
Simple and effective monitoring tool
Used when targets are set for a year i.e. immunization, antenatal coverage, etc.
Each month, data is graphed individually and also added to the previous month
A target is set, a target line is drawn and progress is monitored with respect to the target line

30
Graphs for sets of discrete data
a) pie chartsb) bar graphs

31
Bar graph, simple Bar graph, simple Clinic Alpha : Attendance 2001
0
100
200
300
400
500
600
700
800
Jan Feb Mar Apr May Jun
num
bers
PHC Headcount under 5 years PHC Headcount 5 years and over
• displays data over time or can compare 2 or more different facilities / districts / regions / years

32
Bar graph, stacked Bar graph, stacked Clinic Alpha : Attendance 2001
0
200
400
600
800
1000
1200
Jan Feb Mar Apr May Jun
num
bers
PHC Headcount under 5 years PHC Headcount 5 years and over
• has the advantages of a circle graph: it displays the quantities, but it also shows the relative proportions of the categories to each other and to the whole.

33
Pie chart or circle graphPie chart or circle graph
Clinic Alpha : Headcount distribution Jan 20017%
62%
31%
PHC Headcount under 5 years
PHC Headcount 5-59 years
PHC Headcount 60 years and over
• best type of graph for showing the relative proportions of different categories to each other and to the whole
• can be used when exact quantities are less important than the relative sizes of the parts

34
Common faults with graphs No title No labels for the variables No units of measurement (or incorrect units!) No scale markings (or just too many!) Inappropriate scale choice – data points
should be evenly represented Incorrect choice of independent (x-axis) and
dependent (y-axis) variables No legends when needed

35
Graphs- population Graphs- population pyramidspyramids
• they may highlight the differences in age distribution between males and females as well as proportional age categories
36
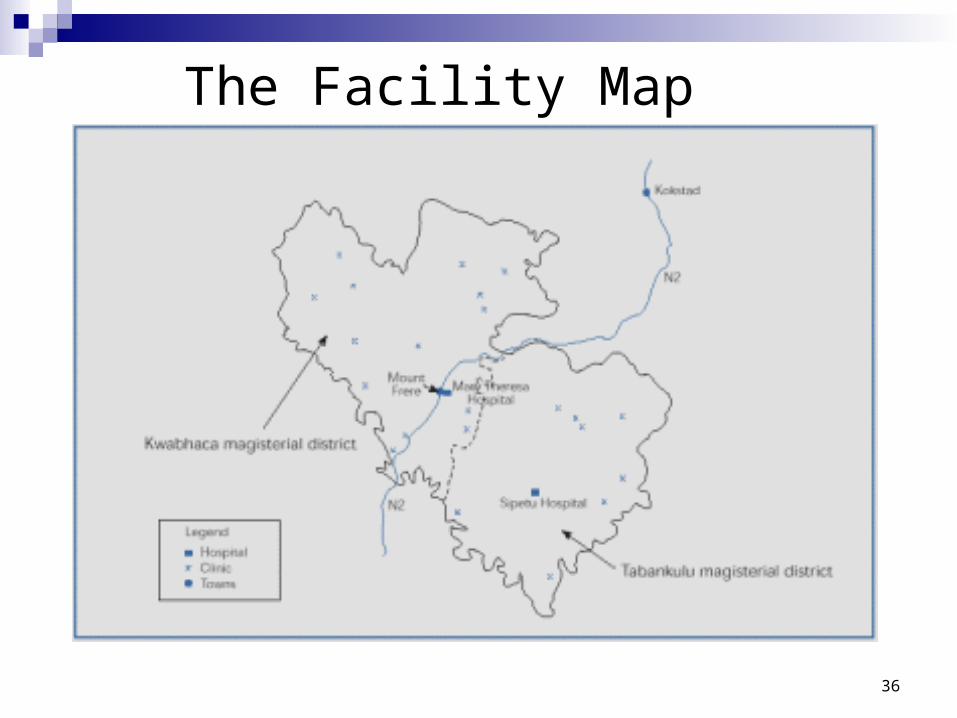
The Facility Map

37
GRAPHS YOU
SHOULD NOT
BUILD!

38

39
…gone fishing…

40