1 q. please state your name and address. 2 q. what is …
TRANSCRIPT

1
2
3
4
5
6
7
8
9
10
11
12
13
14
15
16
17
18
19
20
21
22
23
24
25
26
27
28
DR MARGARET STUMPP - 1
Q. PLEASE STATE YOUR NAME AND ADDRESS.
A. Dr. Margaret Stumpp, 48 Laenani St., Haiku HI 96708.
Q. WHAT IS THE PURPOSE OF YOUR TESTIMONY TODAY?
A. Because I am a economist and also a small coffee grower affiliated with the Maui Coffee Association, I
was asked by the Agriculture Working Group (AWG) to examine the impact of alternative land assessment
scenarios on property taxes paid by farms and ranches in Maui County and to present my findings to this
Council.
Q WHAT ARE YOUR PROFESSIONAL CREDENTIALS?
A. I have a BA degree Cum Laude and with distinction in Economics from Boston University (1974), AM
(1976) and PhD (1981) degrees in Economics from Brown University. I am currently Senior Advisor to,
and a founder of Quantitative Management Associates (QMA), an investment affiliate of Prudential
Financial, Inc. With over 50 investment professionals including 21 PhD’s, QMA manages over $100 billion
on behalf of a global roster of institutional clients including international sovereign wealth funds, large
state pension plans, corporate and union pension plans and retail mutual funds. Some of QMA’s
investments and institutional clients are, or have been, located in Hawaii. I was QMA’s Chief Investment
Officer over the 20 year interval between 1993 and 2013 and oversaw all investments and investment
research for global equities, bonds, real estate, commodities and many other asset categories.
Among many responsibilities over my career, I oversaw asset allocation for Prudential Financial’s then $11
billion pension plan; was a member of the Board of Advisors for PRISA (a $13 billion institutional real
estate fund); the Advisory Board of Asian Property Partners (an South East Asian real estate investment
fund) and the Advisory Board for ARGUS (a portfolio of European real estate projects) and Pru Timber
Fund I (an institutional portfolio of timber properties). I have published a number of scholarly articles on
economics, finance and investment management in peer-reviewed journals such as Award Papers in Public
Utility Economics; The Journal of Investment Management; The Journal of Portfolio Management; and,
The Financial Analysts Journal. In addition to published research, I have addressed numerous investment

1
2
3
4
5
6
7
8
9
10
11
12
13
14
15
16
17
18
19
20
21
22
23
24
25
26
27
28
DR MARGARET STUMPP - 2
management conferences around the globe and my views have been presented in various print and video
media such as on CNBC. During my professional career, I have provided expert testimony on behalf a
number of institutions such as AT&T and PWC before many regulatory bodies on a variety of matters
involving economics, regulation and finance. I am currently a member of the Research Committee of the
Q-Group in finance – an organization consisting of academic and industry experts focusing on the
application of quantitative techniques to financial problems. My current emphasis as Senior Advisor is
primarily on the application of quantitative methods to investment strategies.
Q. DO YOU HAVE ANY CONFLICTS OF INTEREST TO DISCLOSE IN THIS MATTER?
A. No. I am not receiving any compensation for my testimony or analysis. My testimony is as a Maui resident
and do not reflect the interests of QMA, Prudential Financial, or any of our investment clients.
Q. BEFORE DISCUSSING YOUR ANALYSIS, CAN YOU BRIEFLY REVIEW THE ECONOMIC
RATIONALE FOR PREFERENTIAL ASSESSMENTS OF AGRICULTURAL LAND.
A. Between 1950 and 1995 all 50 states adopted some form of preferential tax treatment for agricultural
property. Although there were a number of motivations for this trend, a primary motivation was a desire to
both slow urbanization and improve quality of life by inducing landowners to keep property out of
development. The market value of farm land approximately equals the capitalized value of expected
agricultural income, often called “use value.” The market value of properties with development potential,
however, will generally exceed agricultural use value. It is widely recognized that market value taxation
would render agriculture more costly on land with development potential and would, consequently,
accelerate both development and urban sprawl. Moreover, recent research has also shown that agricultural
spaces add to existing residential values by making communities more desirable to live in. In other words,
preferential treatment of agricultural properties can boost the market values of properties in nearby
residential areas. Here in Maui County, accelerated development in some key areas can reduce the
attractiveness of the islands to tourists, adversely affecting tourism and local employment.

1
2
3
4
5
6
7
8
9
10
11
12
13
14
15
16
17
18
19
20
21
22
23
24
25
26
27
28
DR MARGARET STUMPP - 3
In addition to the forgoing, local agriculture on Maui plays a unique security role by protecting residents
and guests from potentially serious consequences of disruptions in the transportation of agricultural
products to Hawaii.
Q. ARE YOU AWARE OF ANY TRENDS FOR MUNICIPALITIES TO MOVE AWAY FROM
PREFERABLE TAXES FOR AGRICULTURE?
A. No, I am not.
Q. PLEASE SUMMARIZE THE FINDINGS OF YOUR RESEARCH.
A. With the exception of assessing agricultural property at market value, most alternatives to current land
assessments (such as increasing current assessed values by CPI inflation since they were first established;
moving to NASS assessments; or, using either Hawaii County or Oahu’s assessment methodologies) will
increase Maui County tax revenues by modest amounts – increases that would be mostly borne by large
agricultural operations.
Moving to market value assessments on the other hand would have material consequences. It would
increase taxes on Maui County agricultural land by more than $19 million with sizable increases in
property taxes for agricultural enterprises of all types and sizes.
Q. BASED UPON YOUR EXPERIENCE AND ANALYSIS, DO YOU HAVE ANY
RECOMMENDATIONS FOR THIS COMMISSION?
A. Yes, I do. I believe that moving to market value assessments for agricultural properties would be a
mistake. Both economic theory and peer-reviewed published studies indicates that increases in land taxes
can accelerate development. Because market values are highest in areas that are on the fringes of
development, properties with expansive views, commercial attractiveness, or properties with ocean access
would be most induced to shift away from agriculture.

1
2
3
4
5
6
7
8
9
10
11
12
13
14
15
16
17
18
19
20
21
22
23
24
25
26
27
28
DR MARGARET STUMPP - 4
Q. CAN YOU DESCRIBE THE ANALYSES YOU CONDUCTED?
A. Maui County makes available several extracts from their property tax database for public use on its web
site. These database extracts include assessed value, land classification and tax data for each Maui TMK.
Using this data I was able to identify 4,620 agricultural properties in August 2015 comprising 282,576
acres of agricultural land classified by land use (e.g., Diversified Agriculture, Sugar, Pasture, etc.). I then
examined the impact of alternative assessment approaches on each properties tax bill; calculated the impact
on aggregate Maui County property tax billings. I also calculated the impact of each scenario on farms
grouped by size, neighborhood and property use. I excluded some properties such as County Owned land,
some non-profit organizations, properties with missing, or conflicting data, and those that had tax bills that
I could not reconcile with current statutory rates.
I considered 5 alternative agricultural assessment approaches. Specifically:
1. Increasing all assessed values by CPI inflation since 1965 (all assessments rise by 750%);
2. Applying average NASS (National Agricultural Statistics Service) valuations to corresponding Maui
county ag land;
3. Applying the Hawaii County assessment rates to Maui county ag land;
4. Applying the Oahu assessment approach to Maui county ag land;
5. Value all Maui county ag land at current market value.
Summary results from these studies is shown in attached Stumpp_Exhibit #1. More detailed results for
each study is attached as Stumpp_Exhibit #2.
Q. DO YOUR FINDINGS REPRESENT A PRECISE ACCOUNTING OF THE EFFECTS OF EACH
ALTERNATIVE?
A. No. First, it’s important to emphasize that these are studies of hypothetical assessment approaches intended
to show the approximate impact of changes in assessment policy. None of these scenarios represents a
specific proposal of the AWG. It’s also important to emphasize that this is not a formal accounting and is

1
2
3
4
5
6
7
8
9
10
11
12
13
14
15
16
17
18
19
20
21
22
23
24
25
26
27
28
DR MARGARET STUMPP - 5
not intended to replace a more comprehensive study by the County Tax Assessor. However, the results
include the vast majority of agricultural properties and I believe that they are reasonable approximations of
findings that would be obtained from more comprehensive accountings. Finally, it’s important to note that
some property owners will respond to higher agricultural rates in various ways, such as by selling their land
for development, or by formally dedicating their land to agriculture. A more comprehensive analysis
would incorporate estimates of these effects. However, doing so was beyond the scope of my study.
Q. CAN WE DRAW ANY BROAD CONCLUSIONS FROM YOUR RESEARCH?
A. Yes. Assessment approaches that result in proportional increases in current assessments (such as increasing
all assessments by CPI inflation since 1965) have modest revenue and distributional effects.
To understand this, we can examine more closely the impact of adjusting all agricultural property
assessments for inflation since 1965. Adjusting for the increase in the CPI-U would increase all valuations
by approximately 750%. Despite this seemingly large increase in assessed land values, the tax bill for
many small farms (e.g., less than 3 acres) would be small, or zero. This occurs for three reasons:
1. Because property taxes for small enterprises are often dominated by the home site valuation
(home sites, typically between 0.25 and 1.0 acres, are generally assessed at market value and
therefore unaffected by changes in agricultural assessments).
2. Many very small farms without home sites (those under 2 acres) are often taxed at minimum
rates (i.e. $250) – tax levels that are not breeched even when agricultural land is assessed at
much higher rates.
3. Initial assessments made in 1965 were relatively low and even surprisingly large increases in
these rates do not create a large increase in tax bills for small farms.
As a consequence, the impact of changing assessments on the typical small farm is fairly small even when
all assessments are increased by 750%. Most of the burden of higher assessments would fall on larger
agricultural operations (those with more than 15 acres) and they would bear almost all of the $1.2 million
increase in aggregate tax bills. Some very large operations would experience increases in their annual tax

1
2
3
4
5
6
7
8
9
10
11
12
13
14
15
16
17
18
19
20
21
22
23
24
25
26
27
28
DR MARGARET STUMPP - 6
bills exceeding $10,000. A very small number of small and mid-sized farms (less than 15 acres), however,
would experience tax increases of between $2,000 and $4,000.
Because there are many small farms (with low, or zero tax increases) and only a few large ones
(experiencing larger tax increases), even a 750% increase in assessed land values would generate very little
additional property tax revenue for Maui County.
Q. DID YOU FIND SIMILAR RESULTS FOR OTHER ASSESSMENT APPROACHES?
A. Yes, I did. Increasing assessment rates to reflect NASS (National Agricultural Statistical Service)
averages; Applying Hawaii County tax rates to Maui County property; or, use of Oahu’s assessment
approach all generated modest increases in tax receipts with most of the increase falling on larger
properties. Of these three alternatives, using Oahu’s approach generated the most increase in tax receipts
($3.8 million), assuming no changes in property dedication.
Results for market value assessments, however, were materially different from the status quo resulting in
over $19 million in additional taxes.
Q. WHY IS THE IMPACT OF SHIFTING TO MARKET VALUE ASSSESSMENTS DIFFERENT FROM
OTHER ALTERNATIVES?
A. Because land values in some areas of Maui have increased dramatically since initial assessments in 1965,
agricultural assessments for most areas are currently well below market value. The typical current
agricultural assessment is approximately $200 per acre --far below the median market value of over
$300,000 per acre. Even increasing assessed values by CPI inflation since 1965 (750%) would still leave
many assessments substantially below market value.
Additionally, market values vary widely by property and location. Consequently, market value
assessments would cause some valuations to increase substantially, while others would remain
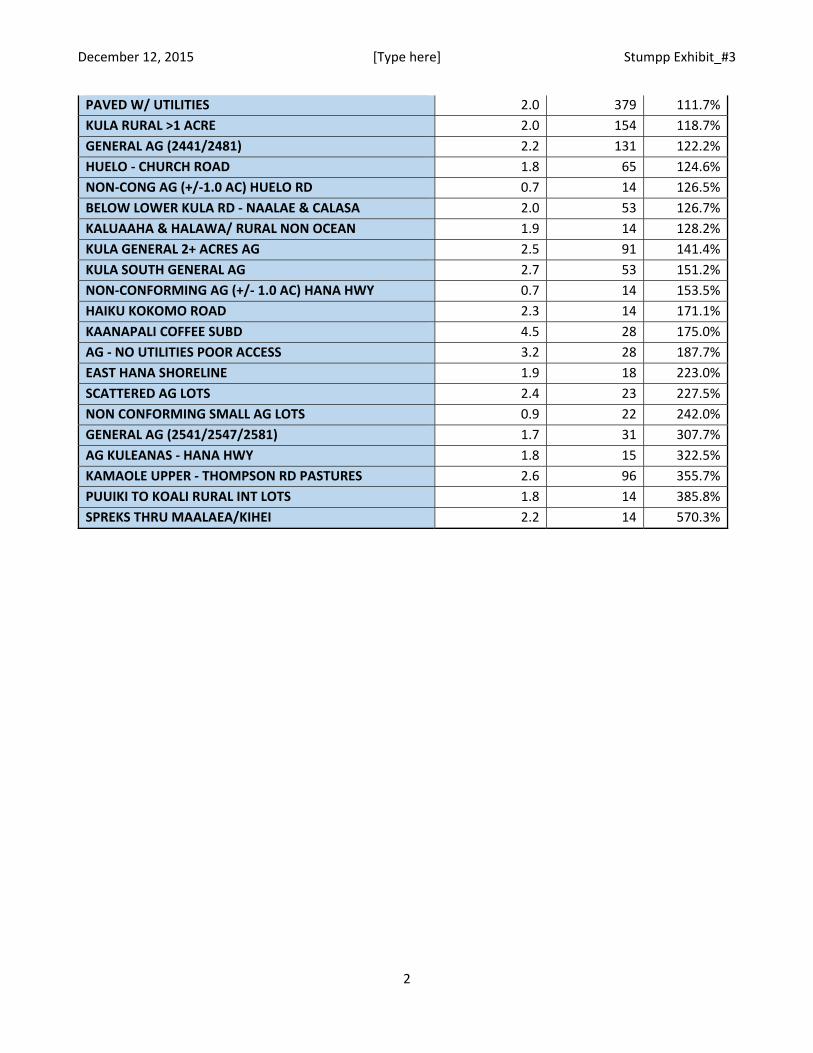
comparatively unchanged. For example, Stumpp_Exhibit #3 shows that taxes on the average small farm in
the County’s Pelekunu -Halawa area -- where there are 147 small agricultural entities -- would increase by
only 2.5%, while the 140 small agricultural entities in the Kula area would experience average tax increases

1
2
3
4
5
6
7
8
9
10
11
12
13
14
15
16
17
18
19
20
21
22
23
24
25
26
27
28
DR MARGARET STUMPP - 7
of over 140%. Taxes on small agricultural properties in the band between Spreckelsville and Maalea would
increase by over 500%. Put differently, farmers in areas most susceptible to development would face the
sharpest increases and property owners would be the most incentivized to develop or sell. A table showing
the disparate effects across many of the County’s neighborhoods is shown in Stumpp Exhibit#3.
Q. COULD THE COUNTY LOWER AGRICULTURAL TAX RATES TO OFFSET THE IMPACT OF
MARKET VALUE ASSESSMENTS?
A. Clearly, that would help reduce the overall burden. However, even if tax rates were reduced by 90%, some
small sub-2 acre properties would experience annual tax increases of nearly $2,000, while some properties
between 2 and 5 acres would experience nearly $5,000 increases. Simply put, there would be a material
change in taxes for a number of small farms with potential for development.
Q. WOULD MARKET VALUE BASED ASSESSMENTS INDUCE MORE PROPERTY HOLDERS TO
DEDICATE THEIR PROPERTIES TO AGRICULTURE, THEREBY REDUCING REVENUES TO THE
COUNTY, BUT ALSO ENSURING THESE PROPERTIES ARE USED FOR AGRICULTURAL IN THE
FUTURE?
A. It’s likely that some property owners would respond to market-value assessments by dedicating their land
to agricultural purposes in order to obtain preferential tax treatment. At present, only 5% of all diversified
agriculture land, and only 2% of land among farms with less than 1 acre is dedicated for 10 years
(dedication values are higher for very large farms and for Sugar properties). I have not attempted to model
the potential response to higher tax rates. However, I find that the greatest impact of moving to market
value assessments would be among properties with the greatest development potential. It seems probable
that owners of those properties would be least interested in restricting their property by dedication.
The expected increase in tax revenues would decline proportionally with the percentage of property owners
who decide to dedicate. For example, the $19 million increase in taxes under market value assessments
would be roughly halved if 50% of property owners decided to dedicate. The increase would fall below $1
million if all owners of agricultural land decided to dedicate.

1
2
3
4
5
6
7
8
9
10
11
12
13
14
15
16
17
18
19
20
21
22
23
24
25
26
27
28
DR MARGARET STUMPP - 8
Q. SOME CONTEND THAT, AS A WAY TO REDUCE PROPERTY TAXES, SOME INDIVIDUALS
ABUSE AGRICULTURAL VALUATIONS BY ENGAGING IN MINIMAL SCALE AGRICULTURE
ON PRIMARILY RESIDENTIAL PROPERTIES. WOULD MOVING TO MARKET VALUE BASED
ASSESSMENTS AMELIORATE THIS ISSUE?
A. As I noted earlier, valuations for most very small farms (say, less than 2 acres) are already dominated by
home site valuations, which are generally assessed at market value. Preferential assessments for the small
amounts of remaining agricultural land on such largely residential properties have only a relatively modest
impact on total Maui County property tax receipts.
Moving to market valuations, however, will have a material impact on taxes owed by all small farmers,
regardless of the intensity of land use. Thus, while market value assessments might reduce what some
might argue is an abuse of the system, it would also materially affect small entities who farm for a living.
If tax abuse is concern, a far less distortive alternative to major tax changes would be for the County to
target property inspections.
Q. DO YOU HAVE ANY CONCLUDING REMARKS?
A. Only this. Economists uniformly agree that prices determined in a competitive market result in the most
efficient allocation of goods and resources. Agricultural land valuation however is one exception to this
prescription. Because agriculture presents important external benefits to local populations, all 50 states
have decided that the appropriate action is to tax agriculture at preferential rates. Assessing land at market
value will accelerate the incentives for Maui property holders to develop their land. This can have adverse
consequences on food security, quality of life and property valuations and employment in Maui County.
Q. DOES THIS CONCLUDE YOUR TESTIMONY?
A. Yes, it does. Thank you.

December 12, 2015 [Type here] Stumpp Exhibit_#1
1
Summary of Study Results.
1. Most alternatives to current assessments have modest effects on Maui Co. revenues, mostly raised from a few large operations. 2. Shifting to market value assessments would have a large impact on tax revenues and also have material effects on farms and ranches of
all sizes.
Table 1 Summary of Various Alternatives to Current Agricultural Assessments
August 2015
Tax Increase For
Assessment Methodology
Total Increase in Maui Co.
Agricultural Property Tax
Bills ($millions)
Median 1‐2 Acre Farm
Median >100 Acre Farm Distributional Effects
1 Increase All Assessments by Inflation since 1965 1.2 $10 $930 Increase mostly falls on large farms 2 Use NASS Average Valuation Rates 1.2 $0 $0 Increase mostly falls on large farms 3 Use Hawaii County Valuation Rates 1.3 $0 $950 Increase mostly falls on large farms 4 Use Oahu Agricultural Valuation Rates 3.8 $30 $4,360 Increase mostly on mid and large farms 5 Assess All Agricultural Land At Market Value 19.0 $960 $16,110 Large increases across all farms

December 12, 2015 [Type here] Stumpp Exhibit_#2
1
Alternative #1: Increase all assessed values by CPI inflation since 1965.1
1. Average assessments increase by about 44%2. 2. The median change in taxes is zero. 3. However, there are distributional effects. No one’s tax bill declines. Some large property holders experience large increases.
Table 1 Average Impact of Increasing Current Assessed Values by CPI Inflation
Agricultural Use Properties Only August 2015
Average Net Assessed Land
Value
Average Assessment Change
New Average Net Assessed Land Value
New Total Net Taxable
ValueTotal Acres
Number of Farms / Ranches
$ $ $ $ Acres Min Median Max Number0 to 1 Acres 120,567 1,029 121,596 252,230 507 0 0 20 8931 to 2 Acres 119,192 3,828 123,020 308,576 1,572 0 10 3720 1,0172 to 5 Acres 100,832 5,136 105,967 266,325 3,117 0 0 2160 9585 to 15 Acres 75,661 8,848 84,509 233,440 7,293 0 0 210 862
15 to 100 Acres 82,522 82,068 164,590 272,691 22,199 0 0 86,350 633Above 100 Acres 358,282 644,560 1,002,843 1,492,628 247,888 0 930 57,660 257
Average 115,804 50,857 166,662 335,854 282,576 0 0 86,350 4,620
Farm/Ranch SizeChange in Taxes ($)
1 A basket of consumer goods prices, as measured by CPIU has risen by 750% since 1965. Other inflation measures, such as the GDP deflator have increased at different rates. 2 The median assessment increase is less than the 750% inflation because total net land assessments include other elements such as homesite, primary site, exemptions and waste land, none of which are being changed.

December 12, 2015 [Type here] Stumpp Exhibit_#2
2
Alternative #1: Increase all assessed values by CPI inflation since 1965 (cont). Aggregate land assessments for agricultural properties increase by approximately 44%, or by $235M. Total property tax billings increase by 19%, or $1.2M, the vast majority of which comes from parcels exceeding 100 acres.
Table 1‐a Aggregate Impact of Increasing Current Assessed Values by CPI Inflation
Agricultural Use Properties Only August 2015
Total Net Assessed Land
Value
Total Assessment Change
New Total Net Assessed Land
Value
New Total Net Taxable Value
Total Acres Total Change in Tax Billings
$ $ $ $ Acres $0 to 1 Acres 107,666,200 918,944 108,585,144 225,241,244 507 2,0401 to 2 Acres 121,218,000 3,893,520 125,111,520 313,822,020 1,572 11,6202 to 5 Acres 96,596,800 4,920,000 101,516,800 255,139,200 3,117 11,1505 to 15 Acres 65,220,000 7,627,029 72,847,029 201,225,029 7,293 15,680
15 to 100 Acres 52,236,700 51,948,754 104,185,454 172,613,354 22,199 235,510Above 100 Acres 92,078,600 165,651,987 257,730,587 383,605,487 247,888 945,090
Total 535,016,300 234,960,232 769,976,532 1,551,646,332 282,576 1,221,090
Farm/Ranch Size

December 12, 2015 [Type here] Stumpp Exhibit_#2
3
Alternative #2: Apply NASS valuations to Maui County agricultural properties3
1. No impact on the medial tax bill for any parcel size; 2. Small swings in property tax collections from some small and mid‐sized properties. 3. Material distributional effects among larger properties.
Table 2 Average Impact of Using NASS Assessment Methodology by Parcel Size
Agricultural Use Properties Only August 2015
Average Net Assessed Land
Value
Average Assessment Change
New Average Net Assessed Land Value
New Total Net Taxable
ValueTotal Acres
Number of Farms / Ranches
$ $ $ $ Acres Min Median Max Number0 to 1 Acres 120,567 2,156 122,723 253,357 507 ‐10 0 40 8931 to 2 Acres 119,192 4,265 123,457 309,013 1,572 ‐10 0 80 1,0172 to 5 Acres 100,832 6,578 107,410 267,767 3,117 ‐330 0 160 9585 to 15 Acres 75,661 11,599 87,260 236,191 7,293 ‐10 0 490 862
15 to 100 Acres 82,522 32,070 114,592 222,693 22,199 ‐6,600 0 2,910 633Above 100 Acres 358,282 669,967 1,028,250 1,518,036 247,888 ‐760 0 74,860 257
Average 115,804 46,546 162,351 331,543 282,576 ‐6,600 0 74,860 4,620
Farm/Ranch SizeChange in Taxes ($)
3 Average NASS rates are $6,000/acre for Diversified Ag; $15/acre Pasture; $4,392 Sugar; $5,435 Pineapple.

December 12, 2015 [Type here] Stumpp Exhibit_#2
4
Alternative #2: Apply NASS valuations to Maui County agricultural properties (cont.)
1. $215M, or 40%, increase in aggregate assessed values; 2. $1.2M, or 18%, increase in tax billings for agricultural land.
Table 2‐a Aggregate Impact of Using Hawaii County Assessment Methodology by Parcel Size
Agricultural Use Properties Only August 2015
Total Net Assessed Land
Value
Total Assessment Change
New Total Net Assessed Land
Value
New Total Net Taxable Value
Total Acres Total Change in Tax Billings
$ $ $ $ Acres $0 to 1 Acres 107,666,200 1,925,066 109,591,266 226,247,366 507 4,3301 to 2 Acres 121,218,000 4,337,389 125,555,389 314,265,889 1,572 13,1702 to 5 Acres 96,596,800 6,301,548 102,898,348 256,520,748 3,117 15,1105 to 15 Acres 65,220,000 9,998,231 75,218,231 203,596,231 7,293 27,370
15 to 100 Acres 52,236,700 20,300,165 72,536,865 140,964,765 22,199 98,540Above 100 Acres 92,078,600 172,181,624 264,260,224 390,135,124 247,888 1,003,420
Total 535,016,300 215,044,022 750,060,322 1,531,730,122 282,576 1,161,940
Farm/Ranch Size

December 12, 2015 [Type here] Stumpp Exhibit_#2
5
Alternative #3: Use Hawaii County assessment approach for Maui County Agricultural Properties4
1. Small impacts on small and mid‐sized Ag properties. 2. Small impact on the median large property. However, some distributional effects.
Table 3 Average Impact of Using Hawaii County Assessment Methodology by Parcel Size
Agricultural Use Properties Only August 2015
Average Net Assessed Land
Value
Average Assessment Change
New Average Net Assessed Land Value
New Total Net Taxable
ValueTotal Acres
Number of Farms / Ranches
$ $ $ $ Acres Min Median Max Number0 to 1 Acres 120,567 1,465 122,032 252,666 507 0 0 30 8931 to 2 Acres 119,192 3,000 122,191 307,748 1,572 0 0 60 1,0172 to 5 Acres 100,832 4,885 105,716 266,074 3,117 ‐330 0 110 9585 to 15 Acres 75,661 9,632 85,293 234,223 7,293 0 0 320 862
15 to 100 Acres 82,522 30,380 112,902 221,003 22,199 ‐7,590 0 1,940 633Above 100 Acres 358,282 823,656 1,181,938 1,671,724 247,888 0 950 66,610 257
Average 115,804 53,734 169,538 338,731 282,576 ‐7,590 0 66,610 4,620
Farm/Ranch SizeChange in Taxes ($)
4 $4,000/acre for Diversified Ag, Pineapple and Sugar. $400 for pasture.

December 12, 2015 [Type here] Stumpp Exhibit_#2
6
Alternative #3: Use Hawaii County Assessment Approach (cont.)
1. Aggregate ag land assessed values rise by $248M or, 46%. 2. Aggregate tax billings for agricultural land rise by $1.3M, or 21%.
Table 3‐a
Aggregate Impact of Using Hawaii County Assessment Methodology by Parcel Size Agricultural Use Properties Only
August 2015
Farm/Ranch SizeTotal Net
Assessed Land Value
Total Assessment Change
New Total Net Assessed Land
Value
New Total Net Taxable Value
Total Acres Total Change in Tax Billings
$ $ $ $ Acres $0 to 1 Acres 107,666,200 1,308,073 108,974,273 225,630,373 507 2,8701 to 2 Acres 121,218,000 3,050,721 124,268,721 312,979,221 1,572 9,1202 to 5 Acres 96,596,800 4,679,382 101,276,182 254,898,582 3,117 10,6505 to 15 Acres 65,220,000 8,302,508 73,522,508 201,900,508 7,293 18,430
15 to 100 Acres 52,236,700 19,230,471 71,467,171 139,895,071 22,199 70,000Above 100 Acres 92,078,600 211,679,540 303,758,140 429,633,040 247,888 1,208,910
Total 535,016,300 248,250,696 783,266,996 1,564,936,796 282,576 1,319,980

December 12, 2015 [Type here] Stumpp Exhibit_#2
7
Alternative #4: Apply the Oahu modified market valuation approach to Maui agricultural property.5
1. Moving to market assessments with an $8,000/acre assessed value cap causes most properties to be assessed at the cap because market value exceeds the cap for most parcels.
2. Dedication has little impact for small and mid‐sized properties because (a) few owners dedicate and (b) a 95%‐99% reduction from market value often results in valuations in the neighborhood of $8,000/acre.
3. Most of the impact is on large farms/ranches – primarily those with low current assessments relative to market value, or the cap. 4. Very small farms are often taxed at minimums ($250/year), so changes in assessments have very little impact.
Table 4 Average Impact of Modified Market Value Assessment by Parcel Size
Agricultural Use Properties Only August 2015
Average Net Assessed Land
Value
Average Assessment Change
New Average Net Assessed Land
Value
New Total Net Taxable Value
Total Acres Number of Farms/Ranches
$ $ $ $ Acres Min Median Max Number0 to 1 Acres 120,567 4,217 124,784 255,418 507 0 0 501 to 2 Acres 119,192 11,213 130,405 315,961 1,572 0 30 110 1,0172 to 5 Acres 100,832 22,743 123,575 283,933 3,117 ‐240 0 250 9585 to 15 Acres 75,661 55,978 131,639 280,570 7,293 0 140 670 862
15 to 100 Acres 82,522 207,124 289,646 397,747 22,199 ‐5,610 810 4,220 633Above 100 Acres 358,282 2,066,965 2,425,248 2,915,033 247,888 ‐2,900 4,360 367,520 257
Average 115,804 161,803 277,607 446,800 282,576 ‐5,610 30 367,520 4,620
Farm/Ranch Size
Change in Taxes ($)
5 Market value assessments and reductions of: 99% for diversified ag; 97% for pineapple & sugar; 95% for pasture if the land is dedicated (regardless of dedication term). Agricultural land valuations are capped at $8,000/acre.

December 12, 2015 [Type here] Stumpp Exhibit_#2
8
Alternative #4: Apply the Oahu modified market valuation approach to Maui agricultural property (cont).
1. Total assessments rise by 140%. 2. Property tax billings on agricultural use land rise by $3.8 million – mostly affecting larger operations.
Table 4‐a Aggregate Impact of Modified Market Value Assessment by Parcel Size
Agricultural Use Properties Only August 2015
Total Net Assessed Land
Value
Total Assessment Change
New Total Net Assessed Land
Value
New Total Net Taxable Value
Total Acres Total Change in Tax Billings
$ $ $ $ Acres $0 to 1 Acres 107,666,200 3,765,555 111,431,755 228,087,855 507 7,5501 to 2 Acres 121,218,000 11,403,612 132,621,612 321,332,112 1,572 31,0302 to 5 Acres 96,596,800 21,788,179 118,384,979 272,007,379 3,117 44,2405 to 15 Acres 65,220,000 48,253,087 113,473,087 241,851,087 7,293 141,190
15 to 100 Acres 52,236,700 131,109,292 183,345,992 251,773,892 22,199 616,470Above 100 Acres 92,078,600 531,210,017 623,288,617 749,163,517 247,888 3,001,960
Total 535,016,300 747,529,742 1,282,546,042 2,064,215,842 282,576 3,842,440
Farm/Ranch Size
December 12, 2015 [Type here] Stumpp Exhibit_#2
9
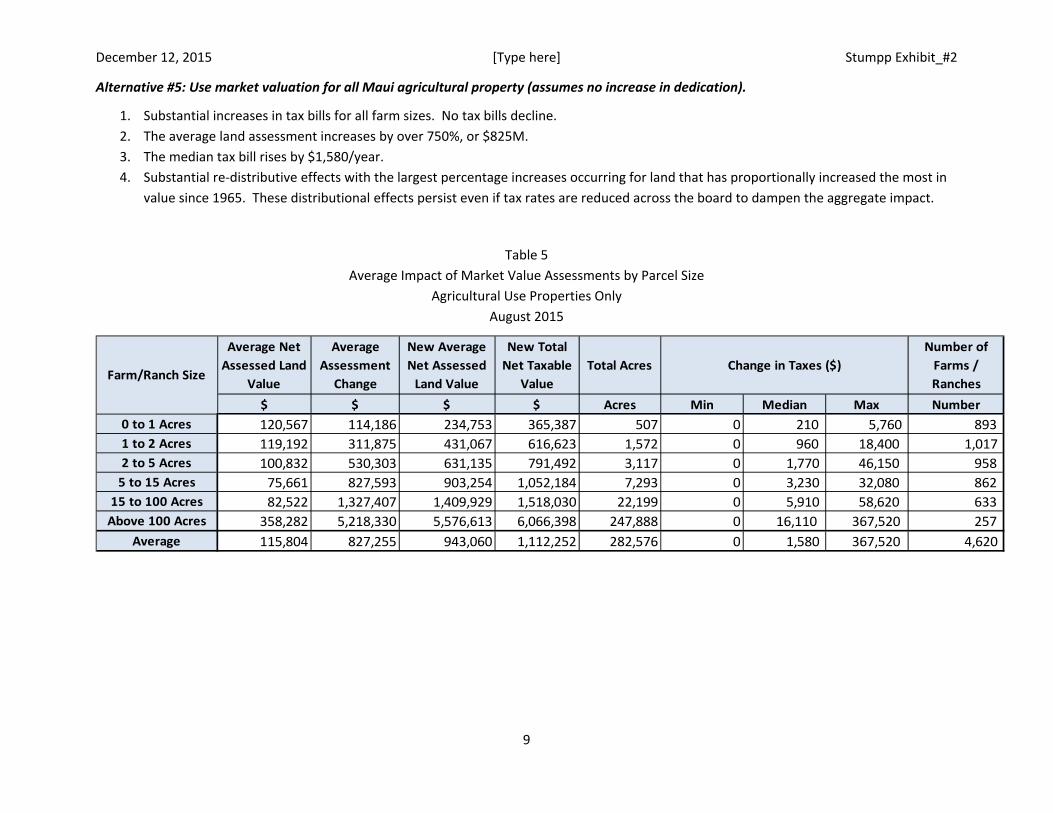
Alternative #5: Use market valuation for all Maui agricultural property (assumes no increase in dedication).
1. Substantial increases in tax bills for all farm sizes. No tax bills decline. 2. The average land assessment increases by over 750%, or $825M. 3. The median tax bill rises by $1,580/year. 4. Substantial re‐distributive effects with the largest percentage increases occurring for land that has proportionally increased the most in
value since 1965. These distributional effects persist even if tax rates are reduced across the board to dampen the aggregate impact.
Table 5 Average Impact of Market Value Assessments by Parcel Size
Agricultural Use Properties Only August 2015
Average Net Assessed Land
Value
Average Assessment Change
New Average Net Assessed Land Value
New Total Net Taxable
ValueTotal Acres
Number of Farms / Ranches
$ $ $ $ Acres Min Median Max Number0 to 1 Acres 120,567 114,186 234,753 365,387 507 0 210 5,760 893 1 to 2 Acres 119,192 311,875 431,067 616,623 1,572 0 960 18,400 1,017 2 to 5 Acres 100,832 530,303 631,135 791,492 3,117 0 1,770 46,150 958 5 to 15 Acres 75,661 827,593 903,254 1,052,184 7,293 0 3,230 32,080 862
15 to 100 Acres 82,522 1,327,407 1,409,929 1,518,030 22,199 0 5,910 58,620 633 Above 100 Acres 358,282 5,218,330 5,576,613 6,066,398 247,888 0 16,110 367,520 257
Average 115,804 827,255 943,060 1,112,252 282,576 0 1,580 367,520 4,620
Farm/Ranch SizeChange in Taxes ($)

December 12, 2015 [Type here] Stumpp Exhibit_#2
10
Alternative #5: Use market valuation for all Maui agricultural property (assumes no increase in dedication).
1. Aggregate assessed net land values increase by over 700% 2. Tax bills increase by over 300%, or by $19million.
Table 5‐a Aggregate Impact of Market Value Assessments by Parcel Size
Agricultural Use Properties Only August 2015
Total Net Assessed Land
Value
Total Assessment Change
New Total Net Assessed Land
Value
New Total Net Taxable Value
Total Acres Total Change in Tax Billings
$ $ $ $ Acres $0 to 1 Acres 107,666,200 101,968,122 209,634,322 326,290,422 507 349,9901 to 2 Acres 121,218,000 317,176,800 438,394,800 627,105,300 1,572 1,197,0802 to 5 Acres 96,596,800 508,030,210 604,627,010 758,249,410 3,117 2,166,4405 to 15 Acres 65,220,000 713,384,738 778,604,738 906,982,738 7,293 3,297,820
15 to 100 Acres 52,236,700 840,248,327 892,485,027 960,912,927 22,199 4,370,270Above 100 Acres 92,078,600 1,341,110,896 1,433,189,496 1,559,064,396 247,888 7,631,650
Total 535,016,300 3,821,919,093 4,356,935,393 5,138,605,193 282,576 19,013,250
Farm/Ranch Size

December 12, 2015 [Type here] Stumpp Exhibit_#3
1
Impact of market value assessments on property taxes by neighborhood for agricultural properties of 5 acres, or less.
Table 1 Percentage Change in Average Tax Bill Under Market Value Assessments for Agricultural Properties ≤ 5 acres
By Neighborhood August 2015
NEIGHBORHOOD
AVERAGE PARCEL ACRES
NUMBER OF PARCELS
AVG CHANGE IN
TAXES PELEKUNU‐WAILAU‐HALAWA 0.9 147 2.5%POHAKUPILI‐MOAKEA‐KEOPUKALOA NO ACCESS 0.6 30 4.8%UALAPUE 0.3 11 9.0%SHORELINE & ALONG KAHAKALOA STREAM 1.2 28 10.6%CLIFFS OF KAHAKULULOA & MALUHIA CNTRY 1.7 15 17.4%MAUNALOU SUBD. 0.8 13 20.7%MAKAPUU TO WAKIU 2.9 11 37.5%KAWELA PLANTATION 1.4 12 41.1%LAUNIAPOKO 2.7 19 42.3%KEOPUKALOA TO MOANUI 1.8 57 46.9%HALEHAKU ACRES/KULOLI SUBD/STUBBS SUBD 1.2 29 47.1%AG KULEANAS ‐ HONOKALA ROAD 1.3 25 56.0%KULA NANI ESTATES 2‐2‐010 1.3 15 56.8%LAUNIUPOKO 2 ACRE UNDERGRND UTIL. 0.9 31 57.9%ALL ZONE 1 ‐ CONS LOTS (NON‐FOREST RSVS) 1.8 32 58.3%NON CONF AG (+/‐ 1 AC) MOPUA ST 0.7 23 58.4%KULA GLEN (PULEHU RD) 2‐3‐060 1.5 32 65.5%KULA 200 1.3 39 66.7%GOOD ACCESS W/ UTILITIES 1.8 113 71.9%KEANAE ‐ WAILUA 1.4 122 75.6%KULA RURAL 1/2 TO 1 ACRE/ NON CONFORM AG 0.7 51 77.4%HANA TOWN TO MAKAALAE 2.5 38 78.0%HANA AG PARK 3.3 35 79.1%PAU HANA ESTATES 1.5 59 80.5%WAILUKU COUNTRY ESTATES 1.6 99 86.4%GENERAL AG LOTS 1.8 22 88.7%NON‐CONF AG LOTS (+/‐ 1 ACRE) 0.7 14 90.8%KEAWANUI/KAPUALEI = AG HBU 1.4 25 103.7%`OMA`OPIO & PULEHU/NUI, BELOW KULA RD 2.3 68 104.1%MAUI RANCH EST/ TAKITANI FARM LOTS 1.7 35 106.0%HAIKU HILL,HAIKU CTRY EST 1.7 16 107.4%SOUTH HANA GENERAL AG 2.3 64 109.7%
December 12, 2015 [Type here] Stumpp Exhibit_#3
2
PAVED W/ UTILITIES 2.0 379 111.7%KULA RURAL >1 ACRE 2.0 154 118.7%GENERAL AG (2441/2481) 2.2 131 122.2%HUELO ‐ CHURCH ROAD 1.8 65 124.6%NON‐CONG AG (+/‐1.0 AC) HUELO RD 0.7 14 126.5%BELOW LOWER KULA RD ‐ NAALAE & CALASA 2.0 53 126.7%KALUAAHA & HALAWA/ RURAL NON OCEAN 1.9 14 128.2%KULA GENERAL 2+ ACRES AG 2.5 91 141.4%KULA SOUTH GENERAL AG 2.7 53 151.2%NON‐CONFORMING AG (+/‐ 1.0 AC) HANA HWY 0.7 14 153.5%HAIKU KOKOMO ROAD 2.3 14 171.1%KAANAPALI COFFEE SUBD 4.5 28 175.0%AG ‐ NO UTILITIES POOR ACCESS 3.2 28 187.7%EAST HANA SHORELINE 1.9 18 223.0%SCATTERED AG LOTS 2.4 23 227.5%NON CONFORMING SMALL AG LOTS 0.9 22 242.0%GENERAL AG (2541/2547/2581) 1.7 31 307.7%AG KULEANAS ‐ HANA HWY 1.8 15 322.5%KAMAOLE UPPER ‐ THOMPSON RD PASTURES 2.6 96 355.7%PUUIKI TO KOALI RURAL INT LOTS 1.8 14 385.8%SPREKS THRU MAALAEA/KIHEI 2.2 14 570.3%