1 q. what assumptions are required for the constant …
TRANSCRIPT

1 Q. WHAT ASSUMPTIONS ARE REQUIRED FOR THE CONSTANT GROWTH
2 DCF MODEL?
3 A. The Constant Growth DCF model assumes: (1) earnings, book value, and dividends
4 all grow at the same, constant rate in perpetuity; (2) the dividend payout ratio remains
5 constant; (3) the Price to Earnings ("PIE") multiple remains constant in perpetuity;
6 (4) the discount rate (that is, the estimated Cost of Equity) is greater than the
7 expected growth rate; and (5) the Cost of Equity remains constant, also in perpetuity.
8 Q. WHAT MARKET DATA DID YOU USE TO CALCULATE THE DWIDEND
9 YIELD IN YOUR DCF MODEL?
10 A. The dividend yield is based on the proxy companies current annualized dividend and
11 average closing stock prices over the 30-, 90-, and 180-trading day periods as of
12 October 14, 2016.
13 Q. WHY DID YOU USE THREE AVERAGING PERIODS TO CALCULATE AN
14 AVERAGE STOCK PRICE?
15 A. I did so to ensure that the model's results are not skewed by anomalous events that
16 may affect stock prices on any given trading day. At the same time, the averaging
17 period should be reasonably representative of expected capital market conditions over
18 the long term. In my view, using 30-, 90-, and 180-day averaging periods reasonably
19 balances those concerns.
20 Q. DID YOU MAKE ANY ADJUSTMENTS TO THE DIVIDEND YIELD TO
21 ACCOUNT FOR PERIODIC GROWTH IN DIVIDENDS?
DIRECT TESTIMONY PUC DOCKET NO. 46449 33 ROBERT B. REVERT
700

1 A. Yes, I did. Since utility companies tend to increase their quarterly dividends at
2 different times throughout the year, it is reasonable to assume that dividend increases
3 will be evenly distributed over calendar quarters. Given that assumption, it is
4 appropriate to calculate the expected dividend yield by applying one-half of the long-
5 term growth rate to the current dividend yield. That adjustment ensures that the
6 expected dividend yield is, on average, representative of the coming twelve-month
7 period, and does not overstate the dividends to be paid during that time.
8 Q. IS IT IMPORTANT TO SELECT APPROPRIATE MEASURES OF LONG-TERM
9 GROWTH IN APPLYING THE DCF MODEL?
10 A. Yes. In its Constant Growth form, the DCF model (i.e., as presented in Equation [2]
11 above) assumes a single growth estimate in perpetuity. Accordingly, to reduce the
12 long-term growth rate to a single measure, one must assume a fixed payout ratio, and
13 the same constant growth rate for earnings per share ('EPS"), dividends per share,
14 and book value per share. Since dividend growth can only be sustained by earnings
15 growth, the model should incorporate a variety of measures of long-term earnings
16 groWth. That can be accomplished by averaging those measures of long-term growth
17 that tend to be least influenced by capital allocation decisions that companies may
18 make in response to near-term changes in the business environment. Because such
19 decisions may directly affect near-term dividend payout ratios, estimates of earnings
20 growth are more indicative of long-term investor expectations than are dividend
21 growth estimates. For the purposes of the Constant Growth DCF model, therefore,
22 growth in EPS represents the appropriate measure of long-term growth.
DIRECT TESTIMONY PUC DOCKET NO. 46449 34 ROBERT B. REVERT
701

1 Q. PLEASE SUMMARIZE THE FINDINGS OF ACADEMIC RESEARCH ON THE
2 APPROPRIATE MEASURE FOR ESTIMATING EQUITY RETURNS USING
3 THE DCF MODEL.
4 A. The relationship between various growth rates and stock valuation metrics has been
5 the subject of much academic research.32 As noted over 40 years ago by Charles
6 Phillips in The Economics of Regulation:
7 For many years, it was thought that investors bought utility stocks
8 largely on the basis of dividends. More recently, however, studies
9 indicate that the market is valuing utility stocks with reference to total
10 per share earnings, so that the earnings-price ratio has assumed
1 1 increased emphasis in rate cases.33
12 Phillips conclusion continues to hold true. Subsequent academic research
13 has clearly and consistently indicated that measures of earnings and cash flow are
14 strongly related to returns, and that analysts' forecasts of growth are superior to other
1 5 measures of growth in predicting stock prices.34 For example, Vander Weide and
16 Carleton state that "[our] results ... are consistent with the hypothesis that investors
17 use analysts' forecasts, •rather than historically oriented growth calculations, in
32 See, Harris, Robert, Using Analysts' Growth Forecasts to Estimate Shareholder Required Rate of Return, Financial Management (Spring 1986).
33 Charles F. Phillips, Jr., The Economics of Regulation, at 285 (Rev. ed. 1969). 34 See, e.g., Christofi, Christofi, Lori and Moliver, Evaluating Common Stocks Using Value Line's
Projected Cash Flows and Implied Growth Rate, Journal of Investing (Spring 1999); Harris and Marston, Estimating Shareholder Risk Premia Using Analysts' Growth Forecasts, Financial Management, 21 (Summer 1992); and Vander Weide and Carleton, Investor Growth Expectations: Analysts vs. History, The Journal of Portfolio Management (Spring 1988).
DIRECT TESTIMONY PUC DOCKET NO. 46449 35 ROBERT B. HEVERT
702

1 making stock buy-and-sell decisions."35 Other research specifically notes the
2 importance of analysts growth estimates in determining the Cost of Equity, and in
3 the valuation of equity securities. Dr. Robert Harris noted that "a growing body of
4 knowledge shows that analysts' earnings forecasts are indeed reflected in stock
5 prices."36 Citing Cragg and Malkiel, Dr. Harris notes that those authors "found that
6 the evaluations of companies that analysts make are the sorts of ones on which
7 market valuation is based."37 Similarly, Brigham, Shome, and Vinson noted that
8 "evidence in the current literature indicates that (i) analysts' forecasts are superior to
9 forecasts bašed solely on time series data, and (ii) investors do rely on analysts'
1 0 forecasts."38
1 1 To that point, the research of Carleton and Vander Weide demonstrates that
1 2 earnings growth projections have a statistically significant relationship to stock
1 3 valuation levels, while dividend growth rates do not.39 Those finding§ suggest that
1 4 investors form their investment decisions based on expectations of growth in
1 5 earnings, not dividends. Consequently, earnirigs growth, not dividend growth, is the
1 6 appropriate estimate for the purpose of the Constant Growth DCF model.
35 Vander Weide and Carleton, Investor Growth Expectations: Analysts vs. History, The Journal of Portfolio Management (Spring 1988). The Vander Weide and Carleton study was updated in 2004 under the direction of Dr. VanderWeide. The results of the updated study were consistent with the original study's conclusions..
36 Robert S. Harris, Using Analysts' Growth Forecasts to Estimate Shareholder Required Rate of Return, Financial Management (Spring 1986).
37 Ibid. 38 Eugene F. Brigham, Dilip K. Shome, and Steve R. Vinson, The Risk Premium Approach to
Measuring a Utility's Cost of Equity, Financial Management (Spring 1985). 39 See, Vander Weide and Carleton, Investor Growth Expectations: Analysts vs. History, The Journal
of Portfolio Management (Spring 1988).
DIRECT TESTIMONY PUC DOCKET NO. 46449 36 ROBERT B. HEVERT
703

1 Q. PLEASE SUMMARIZE YOUR INPUTS TO THE CONSTANT GROWTH DCF
2 MODEL.
3 A. I applied the DCF model to the proxy group of electric utility companies using the
4 following inputs for the price and dividend terms:
5
• The average daily closing prices for the 30-trading days, 90-trading days, and
6
180-trading days ended October 14, 2016, for the term Po; and
7 • The annualized dividend per share as of October 14, 2016 for the term Do.
8 I then calculated the DCF results using each of the following growth terms:
9 • The Zack's consensus long-term earnings growth estimates;
10 • The First Call consensus long-term earnings growth estimates; and
11 • The Value Line earnings growth estimates.
12 Q. HOW DID YOU CALCULATE THE DCF RESULTS?
13 A. For each proxy company, I calculated the mean, mean high, and mean low results.
14 For the mean result, I combined the average of the EPS growth rate estimates
15 reported by Value Line, Zacks, and First Call with the subject company's dividend
16 yield for each proxy company and then calculated the average result for those
17 estimates. I calculated the high DCF result by combining the maximum EPS growth
18 rate estimate as reported by Value Line, Zacks, and First Call with the subject
19 company's dividend yield. The mean high result simply is the average of those
20 estimates. I used the same approach to calculate the low DCF result, using instead
21 the minimum of the Value Line, Zacks, and First Call estimate for each proxy
22 company, and calculating the average result for those estimates.
DIRECT TESTIMONY PUC DOCKET NO. 46449 37 ROBERT B. BEVERT
704

1 Q. WHAT ARE THE RESULTS OF YOUR DCF ANALYSES?
2 A. The Constant Growth DCF results are summarized in Table 4 below (see also
3 EXHIBIT RBH-1). As discussed in more detail in Section III, the proxy companies
4 have traded at P/E ratios well in excess of their historical average and in excess of the
5 market. Because that condition is unlikely to persist, it violates two principal
6 assumptions of the Constant Growth DCF model, i.e., that the P/E ratio will not
7
change, and that the ROE stays constant in perpetuity. As such, the model's results
8
should be viewed with considerable caution. Therefore, I have also considered the
9
results of the Multi-Stage form of the DCF model as well as the CAPM and the Bond
10
Yield Plus Risk Premium approaches.
11
Table 4: Constant Growth DCF Results4°
Mean Low Mean Mean High
30-Day 'Average 8.17% 8.77% 9.40%
90-Day Average 8.10% 8.70% 9.33%
180-Day Average 8.22% 8.82% 9.45%
12 B. Multi-Stage DCF Model
13 Q. WHAT OTHER FORMS OF THE DCF MODEL HAVE YOU USED?
14 A. In order to address certain limiting assumptions underlying the Constant Growth
15 form of the DCF model, I also considered the Multi-Stage (three-stage) DCF
16 Mode1.41 The Multi-Stage model, which is an extension of the Constant Growth
17 form, enables the analyst to specify growth rates over three distinct stages. As with
40
See, EXHIBIT RBH-1. 41
The use of a Multi-Stage DCF model has been supported by Commission Staff in prior cases. See, for example, Direct Testimony of Slade Cutter filed October 28, 2013 in PUC Docket No. 41474.
DIRECT TESTIMONY PUC DOCKET NO. 46449 38 ROBERT B. REVERT
705

1 the Constant Growth form of the DCF model, the Multi-Stage form defines the Cost
2 . of Equity as the discount rate that sets the current price equal to the discounted value
3 of future cash flows. Unlike the Constant Growth form, however, the Multi-Stage
4 model must be solved in an iterative fashion.
5 Q. PLEASE GENERALLY DESCRIBE THE STRUCTURE OF YOUR MULTI-
6 STAGE DCF MODEL.
7 A. The Multi-Stage DCF model sets the subject company' s stock price equal to the
8 present value of future cash flows received over three "stages." In the first two
9 stages, "cash flows" are defined as projected dividends. In the third stage, "cash
10 flows" equal both dividends and the expected price at which the stock will be sold at
11 the end of the period (i.e., the "terminal price"). I calculated the terminal price based
12 on the Gordon mode1,42 which defines the price as the expected dividend divided by
13 the difference between the Cost of Equity (i.e., the discount rate) and the long-term
14 expected growth rate. In essence, the terminal price is defined by the present value of
15 the remaining "cash flows" in perpetuity. In each of the three stages, the dividend is
42 See Morningstar, Inc., 2013 Ibbotson Stocks, Bonds, Bills and In:flation Valuation Yearbook, at 48-52.
DIRECT TESTIMONY PUC DOCKET NO. 46449 39 ROBERT B. HEVERT
706

1
the product of the projected earnings per share and the expected dividend payout
2
ratio. A summary description of the model is provided in Table 5 (below).
3
Table 5: Multi-Stage DCF Structure
Stage 0 1 2 3 Cash Flow Component
Initial Stock Price
Expected Dividend
Expected Dividend
Expected Dividend + Terminal Value
Inputs Stock Price EPS;
Dividends Per Share (DPS")
Expected EPS; Expected DPS
Expected EPS; Expected DP S
Expected EPS; Expected DPS;
' Terminal Value
Assumptions 30-, 90-, and 180-day average stock price
EPS Growth Rate; Payout Ratio
Growth Rate Change; Payout Ratio Change
Long-term Growth Rate; Long-term Payout Ratio
4 Q. WHAT ARE THE ANALYTICAL BENEFITS OF YOUR THREE-STAGE DCF
5 MODEL?
6 A. The principal benefits relate to the flexibility provided by the model's formulation.
7 S ince the model provides the ability to specify near, intermediate, and long-term
8 growth rates, for example, it avoids the sometimes limiting assumption that the
9 subject company will grow at the same, constant rate in perpetuity. In addition, by
10 calculating the dividend as the product of earnings per share and the dividend payout
11 ratio, the model enables analysts to reflect assumptions regarding the timing and
12 extent of changes in the payout ratio to reflect, for example, increases or decreases in
13 expected capital spending, or transition from current payout levels to long-term
DIRECT TESTIMONY PUC DOCKET NO. 46449 40 ROBERT B. HEVERT
707

1 expected levels. In that regard, because the model relies on multiple sources of
2 earnings growth rate assumptions, it is not limited to a single source, such as Value
3 Line, for all inputs, and mitigates the potential bias associated with relying on a
4 single source of growth estimates.43
5 The model also enables analysts to assess the reasonableness of the inputs and
6 results by reference to certain market-based metrics. For example, the stock price
7 estimate can be divided by the expected EPS in the final year to calculate an average
8 P/E ratio. Similarly, the terminal P/E ratio can be divided by the terminal growth rate
9 to develop a Price to Earnings Growth (PEG") ratio. To the extent that either the
10 projected P/E or PEG ratios are inconsistent with either historical or expected levels,
11 it may indicate incorrect or inconsistent assumptions within the balance of the model.
12 Q. PLEASE SUMMARIZE YOUR INPUTS TO THE MULTI-STAGE DCF MODEL.
13 A. I applied the Multi-Stage model to the proxy group described earlier in my Direct
14 Testimony. My assumptions with respect to the various model inputs are described
15 - in Table 6 (below).
43 See Harris and Marston, Estimating Shareholder Risk Premia Using Analysts Growth Forecasts, Financial Management 21 (Summer 1992).
DIRECT TESTIMONY PUC DOCKET NO. 46449 41 ROBERT B. REVERT
708

1 Table 6: Multi-Stage DCF Model Assumptions
Stage Initial First Transition Terminal Stock Price 30-, 90-, and
180-day average stock price as of October 14, 2016.
Earnings Growth
2015 actual EPS escalated by Period 1 growth rate
EPS growth as average of (1) Value Line; (2) Zacks; and (3) First Call
Transition to Long-term GDP44 growth
Long-term GDP growth
Payout Ratio Value Line company- specific
Value Line company- specific
Transition to long-term industry payout ratio
Long-term expected payout ratio
Terminal Value
Expected dividend in final year divided by solved Cost
- of Equity less long-term growth rate
2 Q. HOW DID YOU CALCULATE THE LONG-TERM GROSS DOMESTIC
3 PRODUCT (GDP") GROWTH RATE?
4 A. The long-term growth rate of 5.27 percent is based on the real GDP growth rate of
5 3.24 percent from 1929 through 2015,45 and an inflation rate of 1.97 percent. The
6 GDP growth rate is calculated as the compound growth rate in the chain-weighted
7 GDP for the period from 1929 through 2015. The rate of inflation of 1.97 percent is
44 Gross Domestic Product. 45 See Bureau of Economic Analysis, "Current-Dollar and 'Real Gross Domestic Product,"
September 29, 2016 update.
DIRECT TESTIMONY PUC DOCKET NO. 46449 42 ROBERT B. HEVERT
709

1 an average of two components: the compound annual forward rate starting in ten
2 years (i.e., 2026, which is the beginning of the terminal period) based on the 180-day
3 average spread between yields on long-term nominal Treasury Securities and long-
4 term Treasury Inflation Protected Securities, known as the "TIPS spread" of
5 1.74 percent;46 and the projected Blue Chip Financial Forecast of CPI for 2023 —
6 2027 of 2.20 percent.47 I averaged these two measures of inflation because nominal
7 Treasury yields are related to inflation, and given commodities (such as oil) effect on
8 inflation, the current TIPS spread may somewhat understate long-term expected
9 infl ation.
10 In essence, the real GDP growth rate projection is based on the assumption
11 that absent specific knowledge to the contrary, it is reasonable to assume that over
12 time real GDP growth will revert to its long-term mean. Moreover, since estimating
13 the Cost of Equity is a market-based exercise, it is important to reflect the sentiments
14 and expectations of investors to the extent possible. In that important respect, the
15 TIPS spread represents the collective views of investors regarding long-term inflation
16 expectations. Equally important, by using forward yields we are able to infer the
17 level of long-term inflation expected by investors as of the terminal period of the
18 Multi-Stage model (that is, ten years in the future).
19 Q. WHAT WERE YOUR SPECIFIC ASSUMPTIONS WITH RESPECT TO THE
20 PAYOUT RATIO?
46
See Board of Governors of the Federal Reserve System, "Table H.15 Selected Interest Rates." 47 Blue chip Financial Forecasts, Vol. 35. No. 6, June 1, 2016, at 14.
DIRECT TESTIMONY PUC DOCKET NO. 46449 43 ROBERT B. HEVERT
710

1 A. As noted in Table 6, for the first two periods, I relied on the first year and long-term
2 projected payout ratios reported by Value Line48 for each of the proxy companies.
3 I then assumed that by the elld of the second period (i.e., the end of year 10), the
4 payout ratio will converge to the historical industry average payout ratio of
5 66.88 percent.49
6 Q. WHAT WAS YOUR PRINCIPAL ASSUMPTION REGARDING THE TERMINAL
7 VALUE?
8 A. Although I performed a series of analyses in which the terminal value is calculated
9 based on the assumed long-term nominal GDP growth rate,5° I also performed a
10 series of analyses in which the terminal value is based on the current P/E ratio.51 The
11 results of those analyses are shown in Table 7, below.
12 Table 7: Multi-Stage DCF Model Results52
Mean Low Mean Mean High
30-Day Average 9.14% 9.50% 9.88%
90-Day Average 8.95% 9.31% 9.69%
180-Day Average 9.28% 9.64% 10.02%
13 Q. DID YOU UNDERTAKE ANY ADDITIONAL ANALYSES TO SUPPORT YOUR
14 RECOMMENDATION?
15 A. Yes. As noted earlier, I also applied the CAPM and Risk Premium approaches.
48 As reported in the Value Line Investment Survey company reports as "All Div'ds to Net Prof." 49 Source: Bloomberg Professional 50 See, EXHIBIT RBH-2, pages 1-9. 51 Defined as the 30-day average of the proxy group P/E ratio, calculated as an Index. 52 See, EXHIBIT RBH-2, pages 11-19.
DIRECT TESTIMONY PUC DOCKET NO. 46449 44 ROBERT B. HEVERT
711

1 C. CAPM Analysis
2 Q. PLEASE BRIEFLY DESCRIBE THE GENERAL FORM OF THE CAPM.
3 A. The CAPM is a risk premium method that estimates the Cost of Equity for a given
4 security as a function of a risk-free return plus a risk premium (to compensate
5 investors for the non-diversifiable or "systematic" risk of that security). As shown in
6 Equation [3], the CAPM is defined by four components, each of which theoretically
7 must be a forward-looking estimate:
8 K,= rf+ [3(rm — rj) Equation [3]
9 where:
10 ke = the required market ROE;
11, 13 = Beta of an individual security;
12 rf= the risk free rate of return; and
13 I'm = the required return on the market as a whole.
14 In Equation [3], the term (r„, — rf) represents the Market Risk Premium.53
15 According to the theory underlying the CAPM, since unsystematic risk can be
16 diversified away by adding securities to investment portfolios, investors should be
17 concerned only with systematic or non-diversifiable risk. Non-diversifiable risk is
18
measured by the Beta coefficient, which is defined as:
19 p =11--vx
Equation [4]
53
The Market Risk Premium is defined as the incremental return of the market portfolio over the risk-free rate.
DIRECT TESTIMONY PUC DOCKET NO. 46449 45 ROBERT B. HEVERT
712

1 Where cri is the standard deviation of returns for company ̀ `j,” (7„, is the standard
2 deviation of returns for -die broad market (as measured, for example, by the S&P 500
3 Index), and pj,,„ is the correlation of returns in between company j and the brdad
4 market. The Beta coefficient therefore represents both relative volatility (i.e., the
5 standard deviation) of returns and the correlation in returns between the subject
6 company arid the overall market.
7 -Intuitively, higher Beta coefficients indicate that the subject company' s
8 'returns have moved in tandem with the overall market. Consequently, if a company
9 has a Beta coefficient of 1.00, it is as risky as the market and does not provide any
10 diversification benefit.
11 Q. WHAT ASSUMPTIONS DID YOU INCLUDE IN YOUR CAPM ANALYSIS?
12 A. Since utility equity is a long-duration investment, I used two different measures of
13 the risk-free rate: (1) the current 30-day average yield on 30-year Treasury bonds
14 (i.e., 2.38 percent); and (2) the projected 30-year Treasury yield (i.e., 2.80 percent).
15 Q. WHY HAVE YOU RELIED UPON THE 30-YEAR TREASURY YIELD FOR
16 YOUR CAPM ANALYSIS?
17 A. In determining the security most relevant to the application of the CAPM, it is
18 important to select the term (or maturity) that best matches the life of the underlying
19 investment. Electric utilities typically are long-duration investments and, as such, the
20 30-'year Treasury yield is more suitable for the purpose of calculating the Cost of
21 Equity.
DIRECT TESTIMONY PUC DOCKET NO. 46449 46 ROBERT B. REVERT
713

1 Q. PLEASE DESCRIBE YOUR. EY-ANTE APPROACH TO ESTIMATING THE
MARKET RISK PREMIUM.
3 A. The approach is based on the market-required return, less the current 30-year
4 Treasury yield. To estimate the market-required return, I calculated the market
5 capitalization weighted average ROE based on the Constant Growth DCF model. To
6 do so, I relied on data from two sources: (1) Bloomberg; and (2) Value Line.54 With
7 respect to Bloomberg-derived growth estimates, I calculated the expected dividend
8 yield (using .the same one-half growth rate assumption described earlier), and
9 combined that amount with the projected earnings growth rate to arrive at the market
10 capitalization weighted average DCF result. I performed that calculation for each of
11 the S&P 500 companies for which Bloomberg provided consensus growth rates.
12 I then subtracted the current 30-year Treasury yield from that amount to arrive at the
13 market DCF-derived ex-ante market risk premium estimate. In the case of Value
14 Line, I performed the same calculation, again using all companies for which five-year
15 earnings growth rates were available. The results of those calculations are provided
16 in EXHIBIT RBH-3.
17 Q. HOW DID YOU APPLY YOUR EXPECTED MARKET RISK PREMIUM AND
18 RISK-FREE RATE ESTIMATES?
19 A. I relied on the ex-ante Market Risk Premia discussed above, together with the current
20 and near-term projected 30-year Treasury yields as,inputs to my CAPM analyses.
54
See EXHIBIT RBH-3.
DIRECT TESTIMONY PUC DOCKET NO. 46449 47 ROBERT B. REVERT
714

1 Q. WHAT BETA DID YOU USE IN YOUR CAPM MODEL?
2 A. As shown in EXHIBIT RBH-4, I considered the Beta coefficients reported by two
3 sources: BlOomberg and Value Line. While both of those services adjust their
4 calculated (or "raw") Beta coefficients to reflect the tendency of the Beta coefficient
5 to regress to the market mean of 1.00, Value Line calculates the Beta coefficient over
6 a five-year period, while Bloomberg's calculation is based on two yeais of data.
7 Q. WHAT ARE THE RESULTS OF YOUR CAPM ANALiTSES?
8 A. As shown in Table 8 (below) the CAPM analyses suggest an ROE range of 9.26
9 percent to 11.41 percent (see also EXHIBIT RBH-5).
10 Table 8: Summary of CAPM Resu1ts55
Bloomberg Value Line Derived Derived
Market Risk Market Risk Premium Premium
Average Bloomberg Beta Coefficient
Current 30-Year Treasury (2.38%) 9.26% 9.90%
Near-Term Projectecf 30-Year Treasury (2.80%) 9.67% 10.32%
Average Value Line Beta Coefficient
Current 30-Year Treasury (2.38%) 10.26% 10.99%
Near-Term Projected 30-Year Treasury (2.80%) 10.67% 11.41%
1 1 D. Bond Yield Plus Risk Premium Analysis
12 Q. ,PLEASE DESCRIBE THE BOND YIELD PLUS RISK PREMIUM APPROACH.
13 A. This approach is based on the basic financial tenet that equity investors bear the
14 residual risk associated with ownership and therefore require a premium over the
55
See EXHIBIT RBH-5.
DIRECT TESTIMONY PUC DOCKET NO. 46449 48 ROBERT B. REVERT
715

1 return they would have earned as a bondholder. That is, since returns to equity
2 holders are more risky than returns to bondholders, equity investors must be
3 compensated for bearing that additional risk. Risk premium approaches, therefore,
4 estimate the Cost of Equity as the sum of the equity risk premium and the yield on a
5 particular class of bonds. Since the equity risk premium is not directly observable, it
6 typically is estimated using a variety of approaches, some of which incorporate ex-
7 ante, or forward-looking estimates of the Cost of Equity, and others that consider. _
8 historical, or ex-post, estimates. A commonly used ex-post approach is to use actual
9 authorized returns for electric utilities to estimate the Equity Risk Premium.
10 Q. PLEASE EXPLAIN HOW YOU PERFORMED YOUR BOND YIELD PLUS RISK
11 PREMIUM ANALYSIS.
12 A. As suggested above, I first defined the Risk Premium as the difference between the
13 authorized ROE and the then-prevailing leVel of long-term (i.e., 30-year) Treasury
14 yield. I then gathered data for 1,483 electric utility rate proceedings between Januaiy
15 1980 and October 14, 2016. In addition to the authorized ROE, I also calculated the
16 average period between the filing of the case and the date of the final order (the "lag
17 periocr). In order to reflect the prevailing level of interest rates during the pendency
18 of the proceedings, I calculated the average 30-year Treasury yield over the average
19 lag period (approximately 201 days).
20 Because the data cover a number of economic cycles, the analysis also may be
21 used to assess the stability of the Equity Risk Premium. Prior research, for example,
22 has shown that the Equity Risk Premium is inversely related to the level of interest
DIRECT TESTIMONY PUC DOCKET NO. 46449 49 ROBERT B. REVERT
716

1
rates.5 6 That analysis is particularly relevant given the relatively low, but increasing
2 level of current Treasury yields.
3 Q. HOW DID YOU ANALYZE THE RELATIONSHIP BETWEEN INTEREST
4 RATES, AND THE EQUITY RISK PREMIUM?
5 A. The basic method used was regression analysis, in which the observed Equity Risk
6 Premium is the dependent variable, and the average 30-year Treasury yield is the
7 independent variable. Relative to the long-term historical average, the analytical
8 period includes interest rates and authorized ROEs that are quite high during one
9 period (i.e., the 1980s) and that are quite low during another (i.e., the post-Lehman
10 bankruptcy period). To account for that variability, I used the semi-log regression, in
11 which the Equity Risk Premium is expressed as a function of the natural log of the
12 30-year Treasury yield:
13 RP =.oc + r3(LN(T30)) Equation [5]
14 As shown on Chart 5 (beloW), the semi-log form is useful when measuring an
15 absolute change in the dependent variable (in this case, the Risk Premium) relative to
16 a proportional change in the independent variable (the 30-year Treasury yield).
56 See, for example, Robert S. Harris and Felicia C. Margton, EstiMating Shareholder Risk Premia Using Analysts Growth Forecasts, Financial Management, Summer 1992, at 63-70; Eugene F. Brigham, Dilip K. Shome, and Steve R. Vinson, The Risk Premium Approach to Measuring a Utility's Cost of Equity, Financial Management, Spring 1985, at 33-45; and Farris M. Maddox, Donna T. Pippert, and Rodney N. Sullivan, An Empirical Study of EX Ante Risk Premiums for the Electric Utility Industry, Financial Management, Autumn 1995, at 89-95.
DIRECT TESTIMONY PUC DOCKET NO. 46449 50 ROBERT B. HEVERT
717

1 Chart 5: Equity Risk Premium57
y= -0.02771n(x)-0.0268
8.00% • le =0.7160
6.00%
4.00%
2.00% a.
0.00%
0.00% 2.00% 4.00% 00% 8.00% 10.00% 12.00% 0% 18.00%
-200% '
-4.00%
•
-6.00%
Treasury yield
2
3 As Chart 5 illustrates, over time there has been a statistically significant,
4 negative relationship between the 30-year Treasury yield and the Equity Risk
5 Premium. Consequently, simply applying the long-term average Equity Risk
6 Premium of 4.52 percent would significantly understate the Cost of Equity and
7 produce results well below any reasonable estimate. Based on the regression
8 coefficients in Chart 5, however, the implied ROE is between 10.01 percent and
9 16.38 percent (see Table 9 and EXHIBIT RBH-6).
10 Table 9: Summary of Bond Yield Plus Risk Premium Results58
Return on Equity
Current 30-Year Treasury (2.38%) 10.04%
Near-Term Projected 30-Year Treasury (2.80%) 10.01%
Long-Term Projected 30-Year Treasury (4.45%) 10.38%
57
See EXHIBIT RBH-6. 58
Id.
DIRECT TESTIMONY PUC DOCKET NO..46449 51 ROBERT B. HEVERT
718

1 VII. BUSINESS RISKS AND OTHER CONSIDERATIONS
2 Q. DO THE MEAN MODEL RESULTS FOR THE PROXY GROUP PROVIDE AN
3 APPRÖPRIATE ESTIMATE FOR THE COST OF EQUITY FOR SWEPCO?
4 A. No, the mean model,results do not necessarily provide an appropriate estimate of
5 SWEPCO's Cost of Equity: In my view, there are additional factors that must be
6 taken into consideration when determining where SWEPCO's Cost of Equity falls
7 within the range of results. These factors include: (1) the regulatory environment in
8 which SWEPCO operates; (2) the Company's rate mechanisms; and (3) the
9 proportion of wholesale load customers. Those factors, which are discussed below,
10 should be considered in terms of their overall effect on SWEPCO's business risk and,
11 therefore, its Cost of Equity.
12 A. Regulatory Environment
13 Q. HOW DOES THE REGULATORY ENVIRONMENT IN WHICH A UTILITY
14 OPERATES AFFECT ITS ACCESS TO AND COST OF CAPITAL?
15 A. The regulatory environment can significantly affect both the access to, and the cost
16 of, capital in several ways. First, the proportion and cost of debt capital available to
17 utility companies are influenced by the rating agencies assessment of the regulatory
18 environment. Regulatory decisions regarding the authorized ROE and capital
19 structure have direct consequences for the subject utility's internal cash flow
20 generation (sometimes referred to as "Funds from Operations," or "FFO"). Since
21 credit ratings are intended to reflect the ability to meet financial obligations as they
22 come due, the ability to generate the cash flows required to meet those obligations
DIRECT TESTIMONY PUC DOCKET NO. 46449 52 ROBERT B. HEVERT
719

1 (and to provide an additional amount for unexpected events) is of critical importance
2 to debt investors. Two of the most important metrics used to assess that ability are
3 the ratios of FFO to debt, and FFO to interest expense, both of which are directly
4 affected by regulatory decisions regarding the appropriate rate of return and capital
5 structure.
6 Investors recognize, however, that an authorized ROE that is reasonable, but
7 subject to earnings attrition due to unfavorable regulatory or economic factors, does
8 not provide any assurance that the utility will have a reasonable opportunity to
9 recover its costs, or to earn a reasonable return. The authorized ROE affects not only
10 the cash flow-related metrics that measure financial strength, but also provides an
11 indication of the degree of regulatory support, and risk, associated with a given utility
12 and jurisdiction. It is, therefore, an important rneasure of regulatory support and
13 financial integrity from several perspectives.
14 Similarly, ratings agencies also recognize the importance of the regulatory
15 environment when assessing a utility's business risk profile. S&P, for example,
16 states that ,̀ One significant aspect of regulatory risk that influences credit quality is
17 the regulaiory environment in the jurisdictions where a utility operates."59 S&P
18 explains that "[w]hen we evaluate U.S utility regulatory environments, we consider
19 financial stability to be of substantial importance. Cash takes precedence in credit
59
S&P Global Ratings, RatingsDirect, "Assessing U.S. Irivestor-Owned Utility Regulatory Environments," August 10, 2016, at 2.
DIRECT TESTIMONY PUC DOCKET NO. 46449 53 ROBERT B. I-IEVERT
720

1 analysis. A regulatory jurisdiction that recognizes the significance of cash flow in its
2 decision-making is one that will appeal to creditors."6°
3 Q. ARE THERE SPECIFIC ISSUES RELATING TO THE COMMISSION THAT ARE
4 A CONSIDERATION FOR EQUITY INVESTORS?
5 A. Yes, I believe so. Regulatory Research Associates (RRA") rates the Commission as ,
6 having a "Below Average / 1" regulatory environment from an investor viewpoint. 61
7 As RRA has noted, Texas law establishes a high hurdle for utilities to include
8 Construction Work in Progress (CWIP") in the rate base, and the Commission has
9 generally not permitted CWIP in rate base.62 As a consequence, SWEPCO's ability
10 to maintain its cash flow is disadvantaged relative to others that have the ability to
1 1 include CWIP in rate base during general rate cases (and therefore earn a cash return
12 on that investment). When the revenue per dollar of assets decreases, the earned
13 return on common equity also will decrease. Because net income is a principal
14 element of cash flow, the dilution in earnings resulting from not receiving a cash
15 return on CWIP diminishes the Company's financial profile and increases its relative
16 risk.
17 In addition, Texas utilities set rates based on an historical test year, with
18 adjustments permitted for post-test-year plant additions and retirements, under certain
19 circumstances. In contrast; other utilities, including utilities in the proxy group, have
60 Ibid., at 6. 61 Source: Regulatory Research Associates, Regulatory Focus, "State Regulatory Evaluations
Including an Overview of RRA's Ranking Process," October 18, 2016, at 2. Five other jurisdictions also have a "Below Average /1" ranking.
62 Tex. Util. Code Ann. § 36.054 (West 2007 & Supp. 2014); Regulatory Research Associates, Regulatory Focus,"Texas Regulatory Review — April 26, 2016," at 4.
DIRECT TESTIMONY PUC DOCKET,NO. 46449 54 ROBERT B. REVERT
721

1 the ability to recover rate base additions through forecast test years or alternative rate
2 plans (see, for example, EXHIBIT RBH-9). As with the inability to include CWIP in
3 its rate base, because it is subject to the regulatory lag otherwise mitigated by foiecast
4 test years or alternative rate plans, SWEPCO's ability to generate earnings and cash
5 flow is disadvantaged relative to its peers.
6 Q. WHAT ARE YOUR CONCLUSIONS REGARDING THE REGULATORY
7 ENVIRONMENT AND THE COMPANY'S RISK PROFILE?
8 A. The regulatory environment is one of the most important issues considered by both
9 debt and equity investors in assessing the risks and prospects of utility companies.
10 From the perspective of debt investors, the authorized return should enable the
11 Company to generate the cash flow needed to meet its near-term financial
12 obligations, make the capital investments needed to maintain and expand its system,
13 and maintain sufficient levels of liquidity to fund unexpected events. This financial
14 liquidity must be derived not only from internally-generated funds, but also by
15 efficient access to capital markets. Moreover, because investors have many
16 investment alternatives, even within a given market sector, the Company's financial
17 profile must be adequate on a relative basis to ensure its ability to attract capital
18 under a variety of economic and financial market conditions.
19 From the perspective of AEP, the parent company of. SWEPCO, the
20 authorized return must be sufficient to provide an incentive to allocate equity capital
21 to SWEPCO in order to fund capital investments that will assure the Company's
22 ability to continue to provide safe and reliable service. From the perspective of
DIRECT TESTIMONY PUC DOCKET NO. 46449 55 ROBERT B. HEVERT
722

1 equity investors, the authorized return must be adequate to provide a risk-comparable
2
return on the equity portion of the Company's capital investments. Since equity 4
3
investors are the residual claimants on the Company's cash flows (which is to say
4 that the equity return is subordinate to interest payments), they are particularly
5 concerned with regulatory uncertainty and its effect on future cash flows.
6 Because of the regulatory lag created by the exclusion of CWIP in the rate
7 base and the use of historical test periods, SWEPCO is at a disadvaritage in terms of
8 its ability to earn its authorized return. In light of those' risks, I believe that an ROE
9 at the low end of my recommended range (i.e., the Company's proposed ROE of
10 10.00 percent) is reasonable, if not somewhat conservative.
11 B. Wholesale Customer Concentration
12 Q. PLEASE DISCUSS SWEPCO'S DEGREE OF WHOLESALE . CUSTOMER
13 CONCENTRATION.
14 A. SWEPCO serves ten wholesale customers, primarily municipalities and electric
15 cooperatives, through power purchase agreements.63 Sales to wholesale customers
16 represented approximately 33.70 percent of SWEPCO's total disposition in 2015,
17 which ranks second among the proxy companies, as shown in Chart 6, below.64
63
Company provided data. 64 Source: SNL Financial. See EXHIBIT RBH-8.
DIRECT TESTIMONY PUC DOCKET NO. 46449 56 ROBERT B. REVERT
723

rn o 77
% o
f To
tal 1
6N
h
11.7Y:6
9355
8096
7056
50%
4-156
X3;6
1096
Uri • MB
1 Chart 6: Proxy Group 2015 Wholesale Sales65
rn
5, ri
> 10 Xç ,A < rn r-
• WilnleSale El Retail & Oth ef-
HOW DOES CUSTOMER CONCENTRATION AFFECT SWEPCO'S BUSINESS
RISK?
First, wholesale customers have the ability to switch to alternative suppliers; as such,
revenues from that customer segment are less certain. Second, SWEPCO enters into
purchase power agreements with wholesale customers, which are subject to FERC
approval and expose the Company to counterparty risk and commodity price
volatility.66 Furthermore, as noted above, only ten customers represent more than
30.00 perdent of SWEPCO's total load. This customer concentration poses an
incremental element of business risk because a loss or disruption to their demand — or
even one of the ten — would have a disproportionate effect on SWEPCO's revenue.
Therefore, SWEPCO's comparatively greater dependence on sales to wholesale
2
3 Q.
4
5 A.
6
7
8
9
10
1 1
12
13
65 EXHIBIT kBH-8. 66 See, American Electric Power Company, Inc., SEC Form 10-K at 17, 21 (Dec. 31, 2015).
DIRECT TESTIMONY PUC DOCKET NO. 46449 57 ROBERT B. HEVERT
724

1 customers subjects its operations to higher earnings and cash flow volatility, and to
2 greater risk of demand erosion relative to the proxy group.
3 Q. WHAT ARE YOUR CONCLUSIONS REGARDING THE EFFECT OF
4 WHOLESALE CUSTOMER CONCENTRATION ON THE COMPANY'S
5 RELATIVE RISK?
6 A. Wholesale customer concentration is a significant business risk that exposes
7 SWEPCO to higher credit risks and to increased earnings and cash flow volatility
8 relative to the proxy group. Further, the potential for switching suppliers, and the
9 associated demand destruction are additional factors that should be talen into
10 consideration in assessing the Company's relative risk. I therefore have considered
11 SWEPCO's wholesale customer concentration in my assessment of business risks in
12 order to determine where, within a reasonable range of returns, SWEPCO's required
13 ROE appropriately falls.
14 C. Rate Mechanisms
15 Q. HOW COMMON ARE REVENUE STABILIZATION AND COST RECOVERY
16 MECHANISMS?
17 A. There is little question that revenue stabilization and cost recovery structures are
18 becoming increasingly common. The increased interest in such mechanisms has
19 generally resulted from the growing cost of maintaining system reliability, coupled
20 with the flat or declining sales volume brought on by energy efficiency and relatively
21 slow economic growth. Adjustment mechanisms to recover fuel costs, purchased
22 power expenses, energy efficiency and demand-side program costs, new plant
DIRECT TESTIMONY PUC DOCKET NO. 46449 58 ROBERT B. HEVERT
725

1 investment, and other expenses are common.67 In addition, decoupling has been
2 implemented by electric utilities in 25 jurisdictions.68 Consequently, the
3 implementation of alternative rdgulation mechanisms has become an increasingly
4 visible issue to investors.
5 Q. DO THE COMPANY'S COST RECOVERY MECHANISMS REDUCE ITS COST
6 OF EQUITY?
7 A. No, they do not. The principal analytical issue is whether the Company is so less
8 risky than its peers as a direct result of its recovery mechanisms that investors would
9 specifically and measurably reduce their return requirements. The fact that the
10 Company s existing recovery mechanisms may, to a degree, stabilize the Company's
11 revenues will not affect its Cost of Equity unless it can be demonstrated that (1) the
12 Company is materially less risky than the proxy group by virtue of those
13 mechanisms; and (2) investors are likely to react to the ificremental effect Of those
14 mechanisms. EXHIBIT RBH-9 provides a 'summary of revehue stabilization
15 0 mechanisms and cost trackers currently in-effect at each electric utility subsidiary of
16 the proxy group companies. As EXHIBIT RBH-9 demonstrates, there are a
17 substantial number of such mechanisms in place at the proxy companies. EXHIBIT
18 RBH-9 also includes a summary of the alternative regulation and incentive plans
19 currently in effect at the proxy companies. Those regulatory constructs include
20 formula-based rate plans, which provide comprehensive adjustment mechanisms that
67 See EXHIBIT RBH-9. 68 See, Regulatory Research Associates, Adjustment Ciauses: A State-by-State Overview, August 22,
2016, at 3-13.
DIRECT TESTIMONY PUC DOCKET NO. 46449 59 ROBERT B. HEVERT
726

1
automatically . adjust rates in the evefit that earned return is above or below an
2
authorized range.
3
Becd'use revenue stabilization and cost recovery mechanisms are common among the
4
proxy companies, there is no reason to assume that SWEPCO would be materially
5
less risky, and that its Cost of Equity woUld be lower than its peers as a result of its
6
recovery mechanisms.
7
VIII. CAPITAL STRUCTURE
9 Q. WHAT IS SWEPCO'S RECOMMENDED CAPITAL STRUCTURE?
10 A. SWEPCO's recommended capital structure consists of 48.50 percent common equity
11 and 51.50 percent long-term debt.
12 Q. DOES SWEPCO HAVE À SEPARATE CAPITAL STRUCTURE THAT IS
13 RECOGNIZED BY INVESTORS?
14 A. Yes. SWEPCO is a separate corporate entity that has its own capital structure and
15 issues its own" debt. SWEPCO's proposed capital structure is reflected in
16 registrations of its debt with the SEC.
17 Q. HOW DOES THE CAPITAL STRUCTURE AFFECT THE COST OF EQUITY?
18 A. It is well understood that from a financial perspective, there are two general
19 categories of risk: business risk and financial risk. Businegs risk includes operating,
20 market, regulatory, and competitive uncertainties, whereas financial risk associated
21 with additional levels of debt. The capital structure relates to financial risk, which
22 represents the risk that a company may not have adequate cašh flows to mreet its
DIRECT TESTIMONY PUC DOCKET NO. 46449 60 ROBERT B. HEVERT
727

1 financial obligations, and is a function of the percentage of debt (or financial
2 leverage) in its capital structure. In that regard, as the percentage of debt in the
3 capital structure increases, so do the fixed obligations for the repayment of that debt.
4 Consequently, as the degree of financial leverage increases, the risk of financial
5 distress (i.e., financial risk) also increases. In essence, even if two firms face the
6 same business risks, a company with meaningfinly higher levels of debt in its capital
7 structure is likely to have a higher cost of both debt and equity.
8 It is important to recognize that business and financial risk are related in that
9 additional financial leverage has the effect of further concentrating business risk on
10 equity investors. By way of example, if a firm were capitalized with 100.00 percent
11 common equity, there would be no financial risk and individual equity holders would
12 hold pro rata shares of business risk. If the firm were capitalized with 50.00 percent
13 "eqi,iity and 50.00 percent debt, the equity investors would continue to bear residual
14 business risk, even though they represent only one-half of the capital structure. As
15 Brigham and Gapenski point out, "...the use of debt, or financial leverage,
16 concentrates the firm's business risk on its stockholders."69 Since the capital
17 structure can affect the subject company's overall level of risk, it is an important
18 consideration in establishing a just and reasonable rate of return.
19 Q. IS THERE SUPPORT FOR THE PROPOSITION THAT CAPITAL STRUCTURE
20 IS A KEY CONSIDERATION IN ESTABLISHING AN APPROPRIATE ROE?
69 Eugene F. Brigham, Lo-uis C. Gapenski, Financial Management Theory and Practice, 1994, The Dryden Press, at 528.
DIRECT TESTIMONY PUC DOCKET NO.146449 61 ROBERT B. HEVERT
728

1 A. Yes. Dr. Roger Morin states that:
2 [t]he mix of debt and equity employed in computing the weighted
3 average cost of capital influences the return required by debt and
4 equity capital suppliers. For example, increasing the proportion of
5 low-cost debt financing lowers the overall cost of capital but
6 increases the financial risk of the company to the detriment of
7 shareholders who require a higher return in compensation for the
8 increased risk. As the utility employs relatively more debt capital, the
9 low-cost advantage of debt may be more than offset by the increased
10 cost of equity.7°
11 Because the capital structure can affect the subject company's overall level of
12 risk, it is an important consideration in establishing a fair rate of return: The higher
13 the proportion of senior capital in the capital structure, the higher the financial risk
14 that must be factored into the Cost of Equity.
15 The Commission itself has recognized the interrelationship between the level
16 of debt in the utility's capital structure and the authorized ROE. In Docket
17 No. 22355, for example, the Commission concluded that, as a general proposition,
18 "an increase in debt should result in an increase in ROE unless offset by lower
19 business risk."71
20 Q. HOW DID YOU ASSESS THE REASONABLENESS- OF SWEPCO'S
21 RECOMMENDED CAPITAL STRUCTURE WITH RESPECT TO THE PROXY
22 GROUP?
23 A. The prdxy group has been selected to reflect comparable companies in terms of
24 financial, busipess, and regulatory risks. Therefore, it is appropriate to compare the
70 Roger A. Morin, New Regulatory Finance, Public Utilities Report, Inc., 2006, at 25. 71 Application of Reliant Energy for Approval of Unbundled Cost of Service Rate Pursuant to PURA
§ 39.201 and Public Utility Commission Substantive Rule § 25.344, Docket No. 22355, Order at
DIRECT TESTIMONY PUC DOCKET NO. 46449 62 ROBERT B. HEVERT
729

1 capital structures of the utility operating companies held ,by the proxy group
2 companies to that of the subject company in order to assess whether the
3 proposed capital structure is consistent with industry standards for companies with
4 commensurate risk profiles. To the extent that SWEPCO's actual capital structure
5 differs from industry standards, or that the Company's authorized capital structure
6 differs from actual, tlie difference in financial risk should be considered when
7 estimating its required ROE.
8 Q. PLEASE DESCRIBE YOUR ANALYSIS OF SWEPCO'S CAPITAL STRUCTURE
• 9 RELATIVE TO INDUSTRY PRACTICE.
10 A-. As a measure of industry practice, I calculated the average capital structure for each
11 of the utility operating companies held by the proxy companies over the last eight
12 fiscal quarters. As shown in EXHIBIT RBH-7, the proxy group average capital
13 structure over that period includes 52.04 percent common equity and 47.96 percent
14 long-term debt; the average common equity ratios (on a company-specific basis)
15 range from 45.67 percent to 58.09 pbrcent. Based on that review, it is apparent that
16 SWEPCO's capital structure is consistent with, although somewhat more leveraged,
17 those in place at the proxy companies.
18 Q. WHAT IS THE BASIS FOR USING AVERAGE CAPITAL COMPONENTS'
19 RATHER THAN A POINT-IN-TIME MEASUREMENT?
20 A. Measuring the capital components at a particular point in time can skew the capital
21 structure by the specific circumstances of a particular period. Therefore, it is more
DIRECT TESTIMONY PUC DOCKET NO. 46449 63 ROBERT B. REVERT
730

appropriate to normalize the relative relationship between the components over a
2 period of time.
3 Q. WHAT IS YOUR CONCLUSION REGARDING AN APPROPRIATE CAPITAL
4 STRUCTURE FOR SWEPCO?
5 A. Considering the range of proxy compariy average equity ratios from 45.67 percent to
6 58.09 percent, I believe that SWEPCO's proposed 48.50 percent common equity
7 ratio is appropriate. Considering the Company' s proposal is soniewhat more
8 leveraged than the proxy group average, increasing SWEPCO's debt leverage would
9 potentially reduce investor confidence in the regulatory support for its Tekas
10 operations and increase SWEPCO's financial risk. Combined with the continuing
11 risk-aversion in the current capital market, I believe it is likely the increased financial
12 and regulatory risk would increase investors required return.
13
14 IX. CONCLUSION
15 Q. WHAT IS YOUR CONCLUSION REGARDING THE COMPANY'S COST OF
16 EQUITY AND CAPITAL STRUCTURE?
17 A. As discussed throughout my Direct Testimony, all of the models used to estimate the
18 Cost of Equity are subject to certain assumptions, which may become more or less
19 relevant as market conditions, and market data, change. It therefore is important to
20 consider a variety of empirical and qualitative information in reviewing analytical
21 results and arriving at ROE recommendations. That review includes an assessment
22 of the various models used, and the consistency of their underlying assumptions with
DIRECT TESTIMONY PUC DOCKET NO. 46449 64 ROBERT B. HEVERT
731

1 current and expected market conditions. In the end, it is the reasonableness and
2 consistency of the ROE determination that is of principal concern to investors. With
3 those points in mind, I applied and reviewed the following models:
4 • Constant Growth DCF Model — As discussed earlier in my Direct
5 Testimony, the proxy companies have traded at P/E ratios well in
6 excess of their historical average and in excess of the market.
7 Because that condition is unlikely to persist, it violates two principal
8 assumptions of the ConStant Growth DCF model, i.e., that the P/E
9 ratio will not change, and that the ROE stays constant in perpetuity.
10 As a practical matter, the Constant Growth DCF results are well
11 below a highly observable and relevant benchmark: the returns
12 authorized for vertically integrated electric utilities. As such,
13 considering multiple methods, including the Multi-Stage DCF model,
14 the CAPM aphroach, and the Bond Yield Plus Risk Premium model,
15 is more appropriate in current market conditions.
16 • Multi-Stage DCF Model — Because the Multi-Stage DCF Model
17 provides the ability to specify near-, intermediate-, and long-term
18 growth rates, it avoids the sometimes limiting assumption that the
19 subject company will grow at the same, constant rate in perpetuity.
20 The model also enables analysts to assess the reasonableness of the
21 inputs and results by reference to certain market-based metrics.
22 Using the Gordon model to calculate the terminal stock price, the
DIRECT TESTIMONY PUC DOCKET NO. 46449 65 ROBERT B. HEVERT
732

1
Multi-Stage DCF analysis produces a range of results from 8.76
2
percent to 10.02 percent
3
• CAPM Approach — Unlike the DCF-based methods, the CAPM, is a
risk premium-based method, assumes that investors must be
5
compensated for the time value of money and for taking on additional
6 , risk. The time value of money is measured by long-term Treasury
7
yields; compensation for additional risk is measured by the stock's
8
Beta coefficient and the expected Market Risk Premium. The Market
9
Risk Premium reflects the additional return that investors expect to
10
receive by investing in the market as a whole over. the return they
11
would receive by. investing only in long-term Treasury bonds. The
12
CAPM analyses produce an ROE range of 9.26 percent to 11.41
13
percent.
14- • Bond Yield Plus Risk Premium Analysis — This risk premium-based
15
method assumes that the Cost of Equity equals the sum of (1) long-
16
term Treasury bond yields, and (2) an Equity Risk Premium, which
17
represents the additional risk associated with investing. in utility
18
stocks. This model focuses on the relationship between interest rates
19
and the Equity Risk Premium and demonstrates that over time, there
20
has been a statistically significant, negative relationship between the
DIRECT TESTIMONY PUC DOCKET NO. 46449 66 ROBERT B. HEVERT
733

1 two. Based a regression analysis of that relationship, the estimated Cost
2 of Equity is for an electric utility is between 10.01 percent and 10.38
3 percent.
4 Reviewing the results of the DCF, CAPM, and Bond Yield Plus Risk
5 Premium models, I believe that an ROE in the range of 10.00 percent to 10.60
6 percent represents the range of equity investors required ROE for investment in
7 vertically integrated electric utilities like SWEPCO in today's capital markets.
8 Within my recomfnended range, I believe that an ROE of 10.30 percent is reasonable
9 and apprõpriate. Therefore, the Company' s proposed ROE of 10.00 percent (that is,
10 the low end of my recommended range) is a reasonable, if not conservative, estimate
11 of the ROE required to invest in a company with a risk profile comparable to
12 SWEPCO.
13 Q. DOES THIS CONCLUDE YOUR PRE-FILED DIRECT TESTIMONY?
14 A. Yes, it does.
DIRECT TESTIMONY PUC DOCKET NO. 46449 67 ROBERT B. HEVERT
734

scottrnadden VANAG EN' CON ,L was
PUC Docket No. 46449 ATTACHMENT A
Page 1 of 14 Resumè of
Robert B. Hevert Partner
Summary
Bob Hevert is a financial and economic consultant with more than 30 years of broad experience in the energy and utility industries. He has an extensive background in the areas of corporate finance, mergers and acquisitions, project finance, asset and business unit valuation, rate and regulatory matters, energy market assessment; and corporate strategic planning. He has provided expert testimony on a wide range of financial, strategic, and economic matters on more than 100 occasions at the state, provincial, and federal levels.
Prior to joining ScottMadden, Bob served as managing partner at Sussex Economic Advisors, LLC. Throughout the course of his career, he has worked with numerous leading energy companies and financial institutions throughout North America. He has provided expert testimony and support of litigation in various regulatory proceedings on a variety of energy and economic issues. Bob earned a B.S. in business and economics from the University of Delaware and an M.B.A. with a concentration in finance from the University of Massachusetts at Amherst. Bob also holds the Chartered Financial Analyst designation.
Areas of Specialization
a Regulation and rates a Utilities U Fossil/hydro generation a Markets and RTOs n Nuclear generation L Mergers and acquisitions U Regulatory strategy and rate case support ✓ Capital project planning fl Strategic and business planning
Recent Expert Testimony Submission/Appearance
▪ Federal Energy Regulatory Commission — Return on Equity n New Jersey Board of Public Utilities — Merger Approval n New Mexico Public Regulation Commission — Cost of Capital and Financial Integrity • United States District Court — PURPA and FERC Regulations Et Alberta Utilities Commission — Return on Equity and Capital Structure
Recent Assignments
• Provided expert testimony on the cost of capital for i-atemaking purposes before numerous state utility regulatory agencies, the Alberta Utilities Commission, and the Federal Energy Regulatory Commission
• For an independent electric transmission provider in Texas, prepared an expert report on the economic damages with respect to failure to meet gtjaranteed completion dates. The report was filed as part of an arbitration proceeding and included a review of the ratemaking implications "of economic damages
• Advised the board of directors of a publicly traded electric and natural gas combination utility on dividend policy issues, earnings payout trends and related capital market considerations
• 'Assisted a publicly traded utility with a strategic buy-side evaluation of a gas utility with more than $1 billion in assets. The assignment included operational performance benchmarking, calculation of merger synergies, risk analysis, and review of the regulatory implications of the transaction
ts Provided testimony before the Arkansas Public Service Commission in supOort of the acquisition of SourceGas LLC by Black Hills Corporation. The testimony addressed certain balance sheet capitalization and credit rating issues
U For the State of Maine Public Utility Commission, prepared a report that summarized the Northeast and Atlantic Canada natural gas power markets and analyzed the potential benefits and costs associated with natural gas pipeline expansions. The independent report was filed at the Maine Public Utility Commission
735

PUC Docket No. 46449 ATTACHMENT A
Page 2 of 14
736
IU
BJEC
T I R
egu
lato
ry C
o mm
issi
on o
f Ala
s ka_
Ret
urn
on E
q uity
Ret
urn
on E
quity
I, Alb
erta
Ut il
it ies
Com
mis
sio
n
Rat
e of
Ret
u rn
I Ar iz
ona
Cor
pora
tion C
omm
issi
on
1
Ret
urn
on
Equ
ity
Ret
urn
on E
quitS
t •
Ar k
ansa
s P
ublic
Ser
v ice
Com
mis
sion
Ret
urn
on E
quity
Ret
urn
on E
quity
Ret
urn
on E
q uity
Ret
urn
on E
quity
I C
alifo
rnia
Pub
lic U
tilit i
es C
omM
issi
on
Sou
t hw
est G
as C
orpo
ratio
n f
12/1
2 f
Sou
t hw
est G
as C
orp o
ratio
n f D
ocket N
o. A
-12- 1
2-02
4 J R
etu
rn o
n E
q uity
Col
orad
o Pu b
lic U
tilit i
es C
o mm
issi
on
Pub
lic S
erv i
ce C
ompa
ny of C
olor
ado
Doc
ket N
o. 1
5AL-
0135
G
Ret
urn
on E
q uity
(g
as)
Pub
lic S
erv i
ce C
ompa
ny of C
olor
ado f D
ocke
t No.
14A
L-06
60E
J Re t
urn
on E
quity
(ele
ctric
) I
Pub
lic S
ervi
ce C
omp a
ny o
f Co l
orad
o D
ocke
t No.
12A
L-12
68G
R
etur
n on
Eq u
ity
(gas
)
Pub
lic S
ervi
ce C
omp a
ny of C
olor
ado f D
ocke
t No.
11A
L-94
7E
J Re
turn
on
Equ
ity (e
lect
ric)
Pub
lic S
ervi
ce C
ompa
ny of C
olor
ado
Doc
ket N
o. 1
0AL-
963G
f R
etur
n on
Equ
ity (e
lect
ric)
Atm
os E
nerg
y C
o lor
ado-
Kan
sas
Div
isio
n D
ocke
t No.
09A
L-50
7G
Ret
urn
on E
q uity
(g
as)
DO
C KE
T N
o.
Ma t
ter N
o. TA
285-
4
Mat
ter N
o. T
A 26
2-4
2016
Gen
era l
Cos
t of C
apita
l, P
roce
edin
g I D
. 2062
2
Doc
ket N
o. G
-015
51A
- 16-0
17
Doc
ket N
o. G
-015
51A
- 10-04
58
Doc
ket N
o. 1
6-05
2-U
Doc
ket N
o. 1
5-09
8-U
Doc
ket N
o. 1
5-01
1-U
Doc
ket N
o. 0
6-16
1-U
CA
SE/ A
PP
L IC
ANT
EN
STA
R Nat
ural
Gas
Com
pany
EN
STA
R Nat
ura l
Gas
Com
p any
Alta
link,
L.P
. :and
EP
CO
R D
istri
butio
n &
,
Tran
smis
sion
, Inc
.
Sou
t hw
est G
as C
orp o
ratio
n
Sou
thw
est G
as C
orp o
ratio
n
Okl
aho m
a G
as a
nd E
lec t
ric C
ompa
ny
Cen
terP
oint
Ene
rgy
Res
ourc
es C
orp.
d/b /a
C
ente
rPo i
nt E
nerg
y A
r kan
sas
Gas
Sou
rceG
as A
r kan
sas,
Inc
.
Cen
terP
oint E
nerg
y R
esou
rces
Cor
p. d/
b/a
Cen
terP
oin t
Ene
rgy
Ark
ansa
s G
as
0
1 C.C. "T.-. --_,
0 08/1
&
CO 'l. ......
0
CO • l-. -. . ..
0
CD .'l. . . . .. . . .s.
. _
• ,--
CD <-
6.75
LC) •l . ...... l....- .‘.-
In 'I' (.....75 C)
r.-- C.)
C5
.
03/1
5 <3. ..,•• ,......
C)
r CV •L ......
'l
,- •l . ....... .,.. ,t
0 `..... ....... Cq •,- 07
/09
SP O
NSO
R
EN
ST
AR
Nat
u ral
Gas
Com
p any
EN
STA
R N
a tur
al G
as C
ompa
ny
Alta
link,
L.P
., an
d E
PC
OR
Dis
tribu
tion
& Tr
ansm
issi
on, I
nc.
Sou
t hw
est G
as C
orpo
ratio
n
Sou
thw
est G
as C
orpo
rat io
n
Okl
a hom
a G
as a
nd E
lec t
ric C
ompa
ny
Cen
terP
oint
Ene
rgy
Res
ourc
es C
orp.
d/b/
a C
ente
rPoi
n t E
nerg
y A
rka n
sas
Gas
Sou
rceG
as A
rkan
saS,
Inc
.
Cen
terP
oint
Ene
rgy
Res
ourc
es C
orp.
d/b/
a C
ente
rPoi
nt E
nerg
y A
r kan
sas
Gas
Xce
l Ene
rgy,
Inc.
Xcel
Ene
rgy,
Inc.
Xce
l Ene
rgy,
Inc
.
Xcel
Ene
rgy,
Inc
.
Xcel
Ene
rgy,
Inc.
Atm
os E
nerg
y C
orpo
rat io
n

SUB
JEC
T
Ret
u rn
on E
quity
(g
as)
Ret
urn
on E
q uity
(ele
ctric
)
Ret
u rn
on E
quity
(st
eam
)
Re t
urn
on E
quity
(g
a s)
Con
nect
icut
Pub
lic
Ut il
it ies R
egu
lato
ry A
utll
ority
Ret
urn
on E
q uity
• R
etur
n on
Equ
ity
Re t
urn
on E
q uity
Ret
urn
on E
qui
ty
Del
awar
e Pu
blic
Ser
vice
Co m
mis
sion
Ret
urn
on E
qu i
ty
Ret
urn
on E
qui
ty
Re t
urn
on E
qui
ty
Ret
urn
on E
q uity
Ret
urn
On
Equ
ity
Dis
tric
t of C
olum
bia
Pu
blic
Ser
vice
Com
mis
sion
Ret
urn
on
Equ
ity
Ret
urn
on E
q uity
Ret
urn
on E
q uity
Re t
urn
on E
q uity
Fe
dera
l Ene
rgy R
egul
ator
y C
omm
issi
on
_.._
Ret
urn
on E
quity
Ret
urn
on E
q uity
Ret
urn
on E
qui
ty
Ret
urn
on E
quity
Re t
urn
on E
q uity
DO
CK
ET
No.
Doc
ket N
o. 0
6S-6
56G
Doc
ket N
o. 0
6S- 2
34E
G
Doc
ket N
o. 0
5S- 3
69S
T
Doc
ket N
o. 0
5S-2
46G
Doc
ket N
o. 1
4-05
- 06
Doc
ket N
o. 0
8-08
- 17
Doc
ket N
o. 0
5-03
- 17P
H02
Doc
ket N
o. 0
6-03
- 04PH
02
Cas
e N
o. 1
6-6 4
9 ( E
lect
ric)
Cas
e N
o. 1
6-65
0 ( G
as)
Cas
e N
o. 1
3-11
5
Cas
e N
o. 1
2-54
6
Cas
e N
o. 1
1-52
8
Form
a l
Cas
e N
o. F
C11
39
Form
al C
ase
No.
FC
1137
For
mal
Cas
e N
o. F
C11
03- 20
13-E
_
Form
al Cas
e N
o. F
C10
87
Doc
ket N
o. R
P15-
1322
-000
Doc
ket N
o. E
R15
- 223
9-00
0
Doc
ket N
o. R
P15
- 102
6-00
0
Doc
ket N
o. E
R13
- 685
- 000
Doc
ket N
o. E
R11
- 1915
-000
CA
SE/A
PPL
ICA
NT
Pub
lic S
erv i
ce C
ompa
ny of C
olor
ado
Publ
ic S
ervi
ce C
ompa
ny o
f Co l
orad
o
Publ
ic S
erv i
ce C
ompa
ny of C
olor
ado
Pub
lic S
ervi
ce C
ompa
ny of C
olor
ado
Con
nec t
icut
Lig ht
an
d Po
wer
Com
pany
Sou
ther
n C
onne
ctic
ut G
as C
ompa
ny
Sou
ther
n C
onne
ctic
ut G
as C
ompa
ny
Co n
nect
icut N
atur
a l G
as C
orpo
ratio
n
Poto
ma c
Ele
ctric
Pow
er C
ompa
ny
Pot
omac
Ele
c tri
c Po
wer
Com
p any
Del
mar
va P
ower
& L
ight
Co m
pany
Del
mar
v a P
ower
& L
ight
Com
pany
Del
mar
va P
ower
& Li
g ht C
omp a
ny
Poto
mac
Ele
ctri
c Po
wer
Com
pany
Was
hing
ton
Gas
Lig
ht C
ompa
ny
Pot
omac
Ele
ctr ic
Pow
er C
omp a
ny
Pot
omac
Ele
ctri
c Po
wer
Com
pany
Sab
ine
Pipe
line,
LLC
Nex
tera
Ene
rgy
Tra
nsm
iss i
on W
est, L
LC
Mar
itim
e s &
Nor
thea
st Pi
p elin
e, L
LC
Publ
ic S
ervi
ce C
ompa
ny of N
ew M
exic
o
Pub
lic S
ervi
ce C
ompa
ny of N
ew M
exic
o
SP
ON
SOR
D
ATE
Xcel
Ene
rgy,
Inc.
12
/06
Xce
l Ene
rgy,
Inc
. 0
4/0
6
Xce
l Ene
rgy,
Inc
. 08/0
5
Xce
l Ene
rgy,
Inc.
,0
5/05
'cr ..-- (B 0
CO 0 0) 0
h- 0 CV .L.—
h- 0 Cs1 a—
CO ,— i"..6 0
CO •L-- -Lis CO
cn 1— ;-.3 0
CNI <—
•,---
CN1 N— --c,-5
(0 N—
(D C., •,-- LC)
0-, LO
N- LO
LO
CV
Cs, 10/1
0
Con
nect
icut
Lig ht
an
d Pow
er C
ompa
ny
Sou
ther
n C
onn
ectic
ut G
as C
o mpa
ny
Sou
t her
n C
onne
ctic
ut G
as C
ompa
ny
Con
nect
icut
Nat
ural
Gas
Cor
pora
tion
Pot
omac
Ele
ctric
Pow
er C
omp a
ny
Pot
omac
Ele
c tric
Pow
er C
ompa
ny
Del
mar
va P
ower
& L
igh
t Com
pany
.
De l
mar
va P
ower
& Li
g ht C
ompa
ny
Del
mar
va P
ower
& L
ight C
ompa
ny
Pot
omac
Ele
ctric
Pow
er C
ompa
ny
Was
hing
ton
Gas
Lig ht
Com
pany
Pot
omac
Ele
c tric
Pow
er C
ompa
ny
Pot
omac
Ele
ctric
Pow
er C
omp a
ny
Sab
ine
Pip
elin
e, LL
C
Nex
tera
Ene
rgy
Tran
smis
s ion
Wes
t, LL
C
Mar
it im
es &
Nor
thea
st P
ipel
ine,
LLC
Pub
lic S
ervi
ce C
o mpa
ny o
f New
Me x
ico
Pub
lic S
ervi
ce C
o mpa
ny o
f New
Mex
ico
PUC Docket No. 46449 ATTACHMENT A
Page 3 of 14
' 737

PUC Docket No. 46449 ATTACHMENT A
Page 4 of 14
738
I SU
BJE
CT
Re t
urn
on E
quity
Ret
urn
on E
q uity
Ret
urn
on E
quity
Ret
urn
on E
quity
Res
pons
e to
dra
ft po
licy
stat
eme n
t reg
ardi
ng in
c lus
ion
of M
LPs
in p
roxy
gro
ups
for
dete
rmin
atio
n of
gas
pip
elin
e R
OE
s
Ret
urn
on E
quity
Re t
urn
on E
quity
Ret
urn
on E
quity
Ret
urn
on
Eq u
ity
Mar
ket P
ower
Stu
dy
I Flo
rida
Pu
bli
c S
erv
ice C
omm
iss i
on
Re t
urn
on E
quity
Ret
urn
on E
quity
I
Geo
rgia
Pu
blic
Se rv
ice C
omm
issi
on
Atla
nta
Gas
Lig
ht C
omp
any
05/1
0 A
tlant
a G
as L
ight
Co m
pany
D
ocke
t No.
316
47- U
R
e tur
n on
Equ
ity
Haw
aii P
ubl
ic U
tilit ie
s C
omm
issi
on
Ret
urn
on E
quity
Ret
urn
on
Eq u
ity
Ret
urn
on E
quity
Ret
urn
on E
q uity
IIl
lino is
CO
mm
erce
Com
mis
s ion
Ret
urn
on E
q uity
. I
Re t
urn
on E
q uity
DO
CK
ET N
o.
Doc
ket N
o. R
P10
- 729-
000
Doc
ket N
o. R
P10
-21-
000
Doc
ket N
o. R
P09
-809
-000
Doc
ket N
o. R
P08
- 257-
000
Doc
ket N
o. P
L07-
2-00
0
Doc
ket N
o. R
P07
- 541- 0
00
Doc
ket N
o. R
P07
-34-
000
Doc
ket N
o. R
P0 7
-513-
000
Doc
ket N
o. R
P06
-614
- 000
Doc
ket N
o. E
C01
-24-
000
Doc
ket N
o. 1
6002
1-El
Doc
ket N
o. 1
3004
0-El
Doc
ket N
o. 2
015-
0170
1 D
ocke
t No.
20
14-0
318
Doc
ket N
o. 2
013-
0373
Doc
ket N
o. 20
12- 0
099
Doc
ket N
o. 1
5-0 1
42 -
Doc
ket N
o. 1
4-03
71
CA
SE/A
PPLI
CAN
T
Por
tland
Nat
ural
Gas
Tra
nsm
issi
o n S
yste
m
Flor
ida
Gas
Tra
nsm
iss i
on C
ompa
ny, L
LC
Mar
itim
es a
n d N
orth
east
Pip
el ine,
LL
C
Sal
tvill
e G
as S
tora
ge
Pan
hand
le E
nerg
y P
ipel
ines
Sou
thw
est G
as S
tora
ge C
ompa
ny
Sou
thw
est G
as S
tora
ge C
ompa
ny
Sea
Ro
bin
Pip
el ine
LLC
Tran
s wes
tern
Pip
elin
e C
ompa
ny
GP
U In
tern
atio
nal
Flor
ida
Pow
er &
Light C
ompa
ny
Tam
pa E
lec t
ric C
ompa
ny
Haw
ai'l
Ele
ctric
Lig
ht C
ompa
ny, I
nc.
Maui El
ectri
c C
ompa
ny, L
imited
Haw
aiia
n E
lect
ric
Lig h
t C
ompa
ny
Haw
a iia
n E
lect
ric
Lig h
t Com
pany
Am
eren
Illi
nois
Com
pany
d/
b/a
Am
eren
Ill i
nois
Libe
r ty U
tilit ie
s (M
ids ta
tes
Na t
ural
Gas
) Co r
p.
d/b/
a Li
ber ty
Util
ities
DAT
E
•)-
c) 0
..-- 0 cz) 0
2/0
8
08/0
7
08/0
7
06/0
7
06
/07
0
c:. 11/0
0
a-
0 04/13
a--
0 12/14
N-.
0 08/1
2 —
I
Ir---N- 03
/14
SPO
NSO
R
Por
tland
Nat
ural
Gas
Tra
nsm
issi
on S
y ste
m
Flor
ida
Gas
Tra
nsm
iss i
on C
ompa
ny, L
LC
Mar
itim
es a
nd N
orth
east
Pip
elin
e, LL
C
Spec
tra E
nerg
y
Pan
handl
e E
nerg
y P
ippl
ines
Sou
thw
est G
as S
tora
ge C
ompa
ny
Sou
thw
est G
as S
tora
ge C
ompa
ny
Sea
Rob in
Pip
elin
e L
LC
Tran
swes
tern
Pip
elin
e C
ompa
ny
GP
U In
tern
atio
nal
and A
quila
Flor
ida P
ower
& L
igh
t Com
pany
Tam
pa E
lect
ric C
o mpa
ny
Haw
ai'l El
ectr
ic L
ight
Co m
pany
, Inc
.
Maui E
lect
ric C
ompa
ny, L
imited
Haw
aiia
n E
lect
ric C
ompa
ny
Haw
aii E
lect
ric
Lig h
t Com
pany
Am
e ren
Illi
nois
Com
pany
d/
b/a A
mer
en Ill
ino is
Li
ber ty
Util
ities
(M
ids ta
tes
Nat
ural
Gas
) C
orp.
d/b/
a Li
berty
Util
it ies

PUC Docket No. 46449 ATTACHMENT A
Page 5 of 14
•
739
I
SU
BJEC
T
Ret
urn
on
Equ
ity
Ret
urn
on
Equ
ity (e
lect
ric)
Re t
urn
on E
quity
(gas
)
I In
dia n
a Uti
lity R
egu
lato
ry C
omm
issi
on
Re t
urn
on E
quity
R
ètur
n o
n E
q uity
Ass
ess m
ent o
f Va l
uatio
n A
ppro
ache
s K
ansa
s C
orpo
rat i
on C
omm
issi
on
1 K
ansa
s C
ity P
ower
& L
igh
t Com
pany
J
01/1
5 J
Kan
sas
City
Pow
er &
Lig ht
Co m
pany
D
ocket N
o. 1
5-K
CP
E-1
16- R
TS
J Re
tuin
on
Eq
uity
Mai
ne P
u bli
c U
tilit ie
s C
omm
issi
on
Res
pons
e to
Ben
ch A
naly
s is
p rov
ide d
by C
omm
issi
on S
taff
rela
t ing
to th
e C
ompa
nys
cred
it an
d co
llect
ions
pro
cess
es
Mar
ylan
d Pu
blic
SeN
ice
Com
mis
sion
06/1
6 J
Po t
omac
Ele
ctr i
c P
ower
Co m
pany
J C
ase
No.
941
8 R
etur
n o
n E
quity
12/1
3 P
otom
ac E
lec t
ric
Pow
er C
o mpa
ny
Cas
e N
o. 93
36
J Re
turn
on
Equ
ity
03/1
3 . D
elm
arva
Pow
er &
Lig
ht C
ompa
ny
J C
ase
No.
9317
l Re
turn
on
Equ
ity
11/1
2 P
otor
nac
Ele
c tri
c P
ower
Com
pany
J C
ase
No.
9311
J Re
turn
on
Equ
ity
12/1
1 P
otom
ac E
lec t
ric
Pow
e r C
ompa
ny
J C
ase
No.
9286
J Re
turn
on
Equ
ity
12/1
1 D
elm
arva
Pow
er &
Lig
ht C
ompa
ny J Cas
e N
o. 9
285
Ret
urn
on
Equ
ity
12/1
0 D
elm
arva
Po w
er &
Light C
ompa
ny
Cas
e N
o. 92
49
Ret
urn
on E
quity
I
DO
CKE
T N
O.
Doc
ket N
o. 1
3-01
92
Doc
ket N
o. 1
1-02
7 9
Doc
ket N
o. 1
1-02
8 2
Cau
se N
o. 44
7 20
Cau
se N
o. 4
4526
Cau
se N
o. 43
894
Doc
ket N
o. 20
10- 32
7
CA
SE/A
PP
LIC
ANT
Am
e ren
Illin
ois
Com
pany
d/
b/a A
me r
en Ill
ino is
Am
e ren
Illin
ois
Com
pany
d/
b/a A
mer
en I
llino
is
Am
eren
Illi
nois
Com
pany
d/
b/a A
mer
en Il
lino i
s
Duk
e E
nerg
y In
dian
a, I
nc.
Duk
e E
nerg
y In
d iana
, Inc
.
No r
ther
n In
dia n
a P
ublic
Se r
vice
Com
pany
Cen
tral M
a ine
Pow
er C
ompa
ny
1.1:1 I- CZ CI 01
/13 ••-•
r-- -..,
0
1- ,t- -....
0
LC) ••-• ....... ••-• 12
/14
05/0
9 ••-• ••-• .......
0
SPO
NSO
R
Am
eren
Ill in
ois
Co m
pany
•
d/b/
a Am
eren
Illin
ois
Am
eren
Ill in
ois
Co m
pany
d/
b/a A
mer
en I
llino
is
Am
eren
Illi
nois
Co m
pany
d/
b/a
Am
eren
Ill i
nois
Du k
e E
nerg
y In
d iana
, Inc
.
Duk
e E
nerg
y In
dian
a, I
nc.
Nor
ther
n In
dian
a P
ubl ic
Ser
vice
Com
pany
Cen
tral M
aine
Po w
er C
ompa
ny
Pot
omac
Ele
ctric
Po w
er C
ompa
ny
Pot
omac
Ele
ctric
Pow
er C
ompa
ny
De l
mar
va P
o wer
& Lig
ht C
ompa
ny
Pot
omac
Ele
c tric
Pow
er C
o mpa
ny
Pot
omac
Ele
c tric
Pow
er C
o mpa
ny
Del
mar
va P
ower
& L
ight C
ompa
ny
Del
mar
va P
o wer
& Li
ght C
ompa
ny

PUC Docket No. 46449 ATTACHMENT A
Page 6 of 14
740
DO
CK
ET
No
. I
S
UB
JEC
T
Re t
urn
on
Equ
ity
Re t
urn
on E
qui
ty
Ret
urn
on E
quity
Ret
urn
on
Eq
uity
Cap
ital
Co
st R
eco
very
Re
ven
ue
Deco
upl
ing
and
R
eturn
on
Equ
ity
Ret
urn
on E
qui
ty —
Sol
ar
Genera
tio
n
Ret
urn
on
Equ
ity
1 D
ive
stitu
re o
f P
ow
er
Pu
rchase
A
gre
em
e nt
Div
est
iture
of
Po
wer
Pu
rchase
A
gre
em
e nt
1 D
ive
stitu
re o
f P
ow
er
Pur
chase
A
gre
em
ent
Div
es t
iture
of
Po
wer
Pu
rchase
A
g ree
ment
1 D
ives t
iture
of
Pow
er
Pu
rchase
A
gre
em
en t
Inte
gra
ted R
eso
ur c
e P
lan; G
as
Dem
an d
Fore
cast
Div
estit
ure
of
Sh
elf R
egi
s tra
tion
I
Div
est
iture
of
Sh
elf
Reg
istr
atio
n
Mas
sach
uset
ts D
epar
tmen
t of P
ublic
Utih
t ies
DP
U 15- 1
55
DP
U 1
5-8
0
DP
U 14
- 150
DP
U 13- 9
0
DP
U 1
2- 25
a) cn ch
M a. 0 D
PU
09
-38
DP
U 09
- 30
DT
E 0 4
-85
DT
E 04
- 78
DT
E 04
- 68
DT
E 04
- 61
DT
E 0 4
-60
DT
E 03
- 52
DP
U 9
3-1
4
DP
U 9
1- 2
5
CA
SE/
AP
PLI
CA
NT
Mas
sach
use
tts E
lect
ric
Co
mpa
ny
and
Nant
uck
et E
lect
ric C
om
pa
ny
d/b
/a N
atio
nal
Grid
Fitc
hbu rg
Gas
and
Ele
ctri
c L
ight C
om
pany
d/b
/a U
niti
l
NST
AR
Gas
Com
pan
y
Fitc
hburg
Gas
and
Ele
ctr ic
Ligh
t Co
mpa
ny
d/b
/a U
nitil
Bay
Sta
te G
as
Co
mpa
ny
d/b
/a C
olu
mbia
Gas
of M
ass
ach
use
tts
Mas
sach
use
tts
Ele
ctric
Com
pany
d/b
/a
Nat
ion
al
Grid
Mas
sach
use
tts
Ele
ctric
Com
pany
an
d
Nan
tuck
et E
lect
ric
Com
pan
y d/b
/a N
atio
nal
Gri d
Bay
Sta
te G
as
Co
mp
any
NS
TA
R E
lec t
ric
NST
AR
Ele
ctric
pt-T
AR
Ele
ctric
NST
AR
Ele
c tri
c
NST
AR
Ele
ctric
Fitc
hbu rg
Gas
and
Ele
ctric
Bay
Sta
te G
as
Com
pany
Bay
Sta
te G
as
Com
pan
y
IF
1.0 .‘— %--
1--- -..., 0 1
2/1
4
07
/13
CNA ,-. -..... 0
Ch 0 CO 0
0) 0 CO 0
0) 0 .1- 0 0
9/0
4
08
/04
07/0
4
07/0
4
'1' 0 CO 0 0
1/0
4
cn a) ,-
,- 0) „-
SP
ON
SO
R
Nat
ion
al
Grid
Fitc
hb
urg
Gas
and
Ele
ctric
Lig
ht C
ompa
ny
d/b /a
Uni
til
NS
TAR
Ga s
Co
mpa
ny
Fitc
hbu rg
Ga
s a
nd Ele
ctri
c L
ight C
om
pan
y d/
b/a U
nitil
Bay
Sta
te G
as
Com
pany
d/b
/a C
olu
mbi
a
Gas
of M
ass
ach
usetts
Nat
ion
al G
rid
Nat
ion
al
Grid
Bay
Sta
te G
as
Com
pan
y
NS
TA
R E
lect
ric
NS
TA
R E
lec t
ric
NS
TA
R E
lec t
ric
NS
TA
R E
lec t
ric
NS
TA
R E
lec t
ric
Uni
til C
orp
oratio
n
Bay
Sta
te G
as
Co
mpa
ny
Bay
Sta
te G
as
Com
pan
y

PUC Docket No. 46449 ATTACHMENT A
Page 7 of 14
741
I
SU
BJEC
T I M
inne
sota
Pu b
lic
Ut il
it ies C
omm
issi
on
Re t
urn
on E
quity
Ret
urn
on E
q uity
Ret
urn
on E
quity
Ret
urn
on E
quity
Ret
urn
on E
quity
Ret
urn
on E
quity
Ret
urn
on
Eq u
ity
Re t
urn
on E
quity
Ret
urn
on E
q uity
Ret
urn
on
Eq u
ity
Ret
urn
on E
quity
(ele
ctric
)
Ret
urtfo
n E
quity
(gas
) I M
issi
ssip
pi Pu
blic
Ser
vic
e C
omm
issi
on
Ret
urn
on
Equ
ity
I Mis
sou
ri Pub
l ic S
erv i
ce C
omm
iss i
on
Ret
urn
o n E
quity
(ele
ctric
)
Ret
urn
on E
quity
(ele
ctric
)
Ret
urn
on E
quity
(ele
ctric
)
Ret
urn
on E
q uity
(ele
ctric
)
I
DO
CKE
T N
o.
Doc
ket N
o. E
017
/GR
- 15-10
33
Doc
ket N
o. G
-011
/GR
- 15-7
36
Doc
ket N
o. G
-008
/GR
-15-
424
Doc
ket N
o. E
002/
GR
- 13-86
8
Doc
ket N
o. G
-008
/GR
-13-3
16
Doc
ket N
o. E
002/
GR
-12-
961
Doc
ket N
o. E
-017
/GR
-10- 23
9
Doc
ket N
o. E
-015 /G
R-0
9-11
5 1
Doc
ket N
o. G
-008/
GR
-08- 10
75
Doc
ket N
o. E
-017
/GR
-07-
1178
Doc
ket N
o. E
-002
/GR
- 05-1
428
Doc
ket N
o. G
-002/
GR
-04-
1511
Doc
ket N
o. 0
9-U
N-3
3 4
Cas
e N
o. E
R-2
016-
0 179
Cas
e N
o. E
R-2
016-
0285
Cas
e N
o. E
R-2
016-
015 6
Cas
e N
o. E
R-20
14- 03
70
CAS
E/A
PP
LICA
NT
Ot te
r Tail P
ower
Co m
pany
Min
neso
ta E
nerg
y R
esou
rces
Cor
pora
tion
Ce n
terP
oint
Ene
rgy
Res
ourc
es C
orp.
d/b
/a
Cen
terP
o int E
nerg
y M
inne
sota
Gas
Nor
ther
n St
ates
Pow
er C
o mpa
ny
Cen
terP
oint
Ene
rgy
Res
ourc
es C
orp.
d/b
/a
Cen
terP
oint
Ene
rgy
Min
neso
ta G
as
Nor
ther
n St
ates
Po w
er C
ompa
ny
Otte
r Tai
l Po w
er C
ompa
ny
Min
neso
ta P
ower
Cen
terP
oint
Ene
rgy
Min
neso
ta G
as
Otte
r Tai
l Po w
er C
ompa
ny
Nor
t her
n St
ates
Po w
er C
ompa
ny -
Min
neso
ta
Nor
ther
n St
ates
Pow
er C
o mpa
ny -
Min
neso
ta
Cen
terP
oint
Ene
rgy
Mis
siss
ippi
Gas
Uni
on E
lect
r ic C
ompa
ny d
/b/a
Am
eren
M
isso
uri
Kans
as C
ity P
owe r
& Li
g ht C
o mpa
ny
Kan
sas
City
Pow
er &
Light C
ompa
ny
Kans
as C
ity P
ower
& L
igh
t Com
pany
1.1I2
CI
CO `,.. ......,
CD 09/1
5
08/1
5 0'5 't ...... •C- C.- 08
/13 CNI
--..... ..l "l . 04/1
0
6)
•,- •[..
r
11/0
8
10/0
7
11
/05
09/0
4
6) C D
1"-- , C5
CO "l.
f,- C)
CO a-- -__ C5 02
/16 •Cr ,-- ....._
a-
SPO
NSO
R
Otte
r Tai
l Po w
er C
orpo
ratio
n
Min
neso
ta E
nerg
y R
esou
rces
Co r
pora
tion
Cen
terP
o int
Ene
rgy
Res
ourc
es C
orp.
d/b /a
C
ente
rPoi
nt E
nerg
y M
inne
sota
Gas
Xce
l Ene
rgy,
Inc.
Cen
ter P
oint
Ene
rgy
Res
ourc
es C
orp.
d/b/
a C
ente
r Poi
nt E
nerg
y M
inne
sota
Gas
Xce
l Ene
rgy,
Inc.
Otte
r Tai
l Pow
er C
o rpo
ratio
n
Min
neso
ta P
o wer
a d
ivis
ion
of A
LLET
E, I
nc.
Cen
terP
oint E
nerg
y R
esou
rces
Co r
p. d/
b/a
Cen
terP
o int E
nerg
y M
inne
sota
Gas
Otte
r Tai
l Pow
er C
o rpo
ratio
n
Xce
l Ene
rgy,
Inc
.
Xce
l Ene
rgy,
Inc.
Cer
iterP
oint
Ene
rgy
Res
ourc
es, C
o rp.
d/b /a
C
ente
rPoi
nt E
nerg
y E
ntex
an d
Cen
terP
oint
E
nerg
y M
issi
ssip
p i G
as
Uni
on E
lect
ric C
o mpa
ny d
/b/a
Am
e ren
M
isso
uri
Kan
sas
City
Pow
er &
Lig h
t Com
pany
Kan
sas
City
Po w
er &
Lig
ht C
o mpa
ny
Kan
sas
City
Pow
er &
Lig
ht C
ompa
ny

PUC Docket No. 46449 ATTACHMENT A
Page 8 Of 14
742
SU
BJEC
T
Ret
urn
on E
quity
(ele
dric
)
Ret
urn
on E
quity
(el
ectri
c)
Ret
urn
on E
quity
Ret
urn
on E
quity
Ret
urn
on E
quity
(ele
ctric
)
Ret
urn
on E
quity
(ele
ctric
)
Ret
urn
on E
quity
(gas
)
I M
on t
ana
Publ
ic S
e rvi
ce C
o mm
issi
on
Ret
urn
on E
quity
(gas
)
I N
ev a
da P
ublic
Util it
ies
Com
mis
sion
Ret
urn
on
Equ
ity (g
as)
Ret
urn
on E
quity
(el
ectr
ic)
I
New
Ha m
p shi
re P
ublic
Util
it ies C
o mm
issi
o
Ret
urn
on E
quity
Ret
urn
on E
quity
Ret
urn
on E
quity
Ret
urn
on E
quity
DO
CKE
T N
o.
Cas
e N
o. E
R-20
14-0
258
Cas
e N
o. E
C-20
1 4-02
23
Cas
e N
o. G
R-2
014-
0152
Cas
e N
o. G
R-20
13-0
171
Cas
e N
o. E
R- 2
012-
0166
Cas
e N
o. E
R-2
011-
0028
Cas
e N
o. G
R-2
010-
0363
I D
ocke
t No.
D20
12.9
.94
Doc
ket N
o. 1
2-04
005
Doc
ket N
o. 1
1-06
0 06
Doc
ket N
o. DE
16-3
8 4
Doc
ket N
o. D
G 14
-180
Doc
ket N
o. D
E 13
-063
nocke
t No.
D
G 1
0-01
7
CA
SE/ A
PP
LICA
NT
Uni
on E
lect
ric C
ompa
ny d
/b/a
Am
eren
M
isso
uri
Uni
on E
lect
ric C
ompa
ny d
/b/a
Am
eren
M
isso
uri
Libe
rty U
tiliti
es (
Mid
stat
es N
atur
al
Gas
) Cor
p.
d/b/
a Lib
e rty
Util
ities
Lacl
ede
Gas
Com
pany
Uni
on E
lect
ric C
ompa
ny d/
b/a A
mer
en
Mis
sour
i
Uni
on E
lect
ric C
ompa
ny d/
b/a A
mer
enU
E
Uni
on E
lect
ric C
ompa
ny d/
b la A
mer
enU
E
Nor
thw
este
rn C
orpo
ratio
n d /b
/a N
orth
wes
tern
E
nerg
y
Sou
thw
est G
as C
orpo
ratio
n
Nev
ada
Pow
er C
ompa
ny
Uni
til
Ene
rgy
Sys
tem
s, Inc
.
Libe
rty U
tiliti
es d
/b/a
Ene
rgyN
orth
Nat
ural
Gas
Libe
r ty U
tiliti
es d
/b/a
Gra
nite
Sta
te E
lect
ric
Com
pany
Ene
rgyN
orth
Nat
ural
Gas
d/b
/a N
atio
nal G
rid
NH
DAT
E I
— 77
71
1
Azr
02/1
4 CV , CV .......
o C) -..,
c) C> ......
o CV
a) o CV ---. C)
A-
C3 z.,-5.
CD ......
08/1
4 C•3
C3 02/1
0
CC 0 (i) Z CI CL CA U
nion
Ele
ctric
Com
pany
d/b
/a A
mer
en
Mis
sour
i
Uni
on E
lect
ric C
ompa
ny d/
b/a
Am
eren
M
isso
uri
Libe
rty U
tiliti
es (
Mid
stat
es N
atur
al
Gas
) C
orp.
d/b/
a Li
berty
Util
ities
Lacl
ede
Gas
Com
pany
Uni
on E
lect
ric C
ompa
ny d/
b /a A
mer
en
Mis
sour
i
Uni
on E
lect
ric C
ompa
ny d
/b/a
Am
eren
UE
Uni
on E
lect
ric C
ompa
ny d /b
/a A
mer
enU
E
Nor
thw
este
rn C
orpo
ratio
n
rS
outh
west G
as C
orpo
ratio
n
Nev
ada
Pow
er C
ompa
ny
Uni
til E
nerg
y S
yste
ms,
Inc
.
Libe
rty U
tiliti
es d/
b /a E
nerg
yNor
th Nat
ural
Gas
Libe
rty U
tilit ie
s d/
b/a
Gra
nite
Sta
te E
lect
ric
Com
pany
Ene
rgyN
orth
Nat
ural
Gas
d/b
/a N
atio
nal
Grid
N
H

PUC Docket No. 46449 ATTACHMENT A
Page 9 of 14
743
SPO
NSO
R I
DA
TE
CA
SE/A
PPLI
CANT
I
DO
CK
ET N
o.
I S
UBJ
ECT
Uni
til E
nerg
y S
yste
ms,
Inc.
, Ene
rgyN
o rth
08/0
8 U
nitil
Ene
rgy
Sys
tem
s, In
c., E
nerg
yNor
th
Doc
ket N
o. D
G 07
-072
C
arry
ing
Cha
rge
Rat
e on
Cas
h N
atur
al G
as, I
nc. d
/b/a
Nat
iona
l Gr id
NH
, N
a tur
al
Gas
, Inc
. d/b/
a N
atio
nal
Grid NH
, W
orki
ng C
apita
l G
rani
te S
tate
Ele
ctric
Com
pany
d/b/
a G
rani
te S
tate
Ele
ctric
Com
p any
d/b
/a N
atio
nal
Nat
ional
Grid
, and
Nor
ther
n U
tilit i
es, I
nc. —
G
rid, a
nd N
orth
ern
Util
it ies
, Inc
. — N
ew
_N
ew H
amps
hire
Div
isio
n H
amps
hire
Div
isio
n
I New
Jer s
ey B
o ard
of Pu
blic
Utili
t ies
Mer
ger A
ppro
val
Re t
urn
on E
quity
Re t
urn
on E
quity
Ret
urn
on E
quity
Re t
urn
on E
quity
Re t
urn
on E
quity
Div
estit
ure
and Val
uatio
n of
E
lect
ric G
e ner
atin
g A
sset
s
Mar
ket V
alue
of E
lect
ric
Gen
erat
ion
Ass
ets;
Auc
tion
Mar
ket V
a lue
of E
lect
ric
Gen
erat
ion
Ass
ets;
Auc
tion
Pro
cess
I N
ew M
e xico
Pu
blic
Reg
ulat
ion
Com
mis
sion
Re t
urn
on E
quity
(ele
ctric
)
Ret
urn
on E
q uity
(ele
ctric
)
Cos
t of C
apita
l and
Fin
anc i
al
Inte
grity
Re t
urn
on E
quity
(ele
ctric
) I R
etu
rn o
n E
quity
(ele
ctric
)
Ret
urn
on E
q uity
(ele
ctric
)
Re t
urn
on E
qui ty
(ele
ctric
)
BPU
Doc
ket N
o. G
M15
1011
96
LD
ocket
No. E
R16
0302
5 2
Doc
ket N
o. E
R14
0302
4 5
k)o
cke
t No.
ER
1311
113 5
Doc
ket N
o. E
R12
1210
71
Doc
ket N
o. E
R11
0804
69
Doc
ket N
o. E
M06
0906
38
Doc
ket N
o. E
M05
1210
58
Doc
ket N
o. E
0030
2009
1
Cas
e N
o. 1
5-00
261-
UT
Cas
e N
o. 1
4-00
332-
UT
Cas
e N
o. 1
3-00
390-
UT
Cas
e N
o. 1
0-00
395-
UT
•
Cas
e N
o. 1
0-00
086-
UT
I C
ase
No.
08-
0027
3-U
T
Cas
e N
o. 0
7-00
319-
UT
The
Sou
ther
n C
ompa
ny; A
GL
Re s
ourc
es In
c.;
AMS
Cor
p. a
nd Piv ot
al H
old i
ngs,
Inc
. d/b /a
E
lizab
etht
o wn
Gas
Atla
ntic
City
Ele
ctri
c C
omp a
ny
At la
ntic
City
Ele
ctric
Co m
pany
Roc
klan
d E
lect
ric C
ompa
ny
Atla
n tic
City
Ele
ctric
Co m
pany
Atla
n tic
City
Ele
ctric
Com
pany
Atla
ntic
City
Ele
c tric
Com
pany
At la
ntic
City
Ele
ctric
Com
p any
Atla
ntic
City
Ele
ctric
Com
pany
Publ
ic S
ervi
ce C
ompa
ny of N
ew M
exic
o
Publ
ic S
ervi
ce C
ompa
ny of N
ew M
exic
o
Pub
l ic S
ervi
ce C
ompa
ny of N
ew M
exic
o
Sou
thw
este
rn P
ublic
Se r
vice
Com
pany
Publ
ic S
ervi
ce C
ompa
ny o
f New
Mex
ico
Publ
ic S
ervi
ce C
omp a
ny of N
ew M
exic
o
Sou
t hw
este
rn P
ublic
Ser
vice
Com
pany
CO (O "cr C,) CV
08/1
1
(O LC) cn LC) •Cr
1 2/1 4
a— 0 CO Ns a— ......
o a— .......
o a— .....
o a— .......
,--- ,a— ......
,-- 0 CY) o
0 CV .,---
0 CO o
N•••• -.....
o •l. .......
,-- "C\-i o "("13 o ‘ ''.-
cr) o r•-• o
The S
out h
ern
Com
pany
; AG
L R
esou
rces
In
c.; A
MS
Co r
p. a
nd Piv ot
al H
oldin
g s, In
c.
d/b/
a Eliz
abet
htow
n G
as
Atla
n tic
City
Ele
ctri
c C
omp a
ny
Pep
co H
oldi
ngs,
Inc.
Ora
nge
and R
ockl
a nd Ut
ilitie
s
Atla
ntic
City
Ele
ctric
Com
pany
Atla
ntic
City
Ele
ctric
Co m
pany
Pep
co H
oldi
ngs,
Inc
.
Pep
co H
oldin
gs, I
nc.
Con
ectiv
Pub
l ic S
ervi
ce C
ompa
ny of N
ew M
exic
o
Pub
lic S
ervi
ce C
omp a
ny o
f New
Mex
ico
Pub
lic S
e rvi
ce C
ompa
ny o
f New
Mex
ico
Sou
thw
este
rn P
ublic
Ser
vice
Co m
pany
Pub
lic S
e rvi
ce C
ompa
ny o
f New
Mex
ico
Pub
lic S
ervi
ce C
omp a
ny o
f New
Mex
ico
Xce
l Ene
rgy,
Inc
.

C Docket No. 46449 ATTACHMENT A
Page 10 of 14
744
I
DO
CKE
T.N
O.
I
SUBJ
ECT
I N
ew Y
ork S
tate
Pub
lic S
ervi
ce C
omm
issi
on
1
Ret
urn
on E
q uity
(ele
ctric
)
Ret
u rn
on E
quity
(ele
ctric
and
ga
s)
Ret
urn
on E
quity
(ele
ctric
)
Ret
urn
on E
quity
(e
lect
ric)
Re t
urn
on E
quity
(g
as)
Ret
u rn
on E
quity
(ele
ctric
)
Ret
u rn
on E
quity
(ele
ctric
)
Re t
urn
on E
quity
(gas
)
Re t
urn
on E
q uity
(ste
am)
Pow
er P
urc h
ase
and
Sale
A
g ree
men
t; S
tand
ard
Offe
r S
ervi
ce A
g ree
men
t I
Nor
t h C
arol
ina
Util
it ies
Com
mis
sion
I
03/1
6 P
ublic
Ser
vice
Co m
pany
of N
orth
Car
olin
a,
Doc
ket N
o. G
-5, S
u b 56
5 R
etur
n o
n E
q uity
In
c.
03/ 1
6 D
omin
ion
Nor
t h Car
olin
a P
ower
D
ocket N
o. E
-22,
Sub
532
R
e tur
n on
Equ
ity
Du k
e E
nerg
y C
a rol
inas
, LLC
í
02/1
3 D
uke
Ene
rgy
Car
olin
as, L
LC
Doc
ket N
o. E
-7, S
u b 10
26
Ret
urn
on E
q uity
10/1
2 C
a rol
ina
Pow
e r &
Lig ht
Com
pany
d/b
/a
Doc
ket N
o. E
- 2, S
ub 10
23
Re t
urn
on E
q uity
P
rog r
ess
Ene
rgy
Car
o lin
as, I
nc.
Cas
e N
o. 1
5-E
-0050
Cas
e N
os. 1
4-E
-0493
an d
14- G
-0 4
94
Cas
e N
o. 1
3-E
-0030
Cas
e N
o. 1
2-E
-020
1
Cas
e N
o. 1
2-G
-0202
Cas
e N
o. 1
1-E
-0408
Cas
e N
o. 1
0-E
-0362
Cas
e N
o. 0
9-G
-0795
Cas
e N
o. 0
9-S
-079
4
Cas
e N
o. 01
- E-10
46
CAS
E /AP
PLIC
ANT
Con
solid
a ted
Ed i
son
Com
p any
of N
ew Y
ork,
In
c.
Ora
nge
and
Roc
kla n d
Utili
t ies,
Inc
.
Con
solid
a ted
Edi
son
Com
pany
of N
ew Y
ork,
In
c.
Nia
gara
Mo h
awk
Co r
pora
tion
d/b /
a N
atio
nal
Grid
for E
lec t
ric S
ervi
ce
Nia
gara
Mo h
awk
Co r
pora
tion
d/b/
a Nat
iona
l G
rid fo
r Gas
Ser
v ice
Ora
nge
and
Roc
klan
d U
t iliti
es, I
nc.
I Ora
nge
and R
ockl
and
Ut il
ities
, Inc
.
Con
solid
a ted
Edi
son
Com
pany
of N
ew Y
ork,
In
c.
Con
solid
a ted
Ed i
son
Com
pany
of N
ew Y
ork,
In
c.
Nia
gara
Mo h
awk
Pow
er C
o rpo
ratio
n
C
1]-1_
01/1
5 .. I. ,,. ....... •,.. •,-
C., .a— —..... 0 04
/12
04/1
2
•
..... <-- ....., 0
0 1— ........ 0
(7) 0 ...._ v--
1:3) 0 N--- < --
,--
l'•-• 0
SPO
NSO
R
Con
solid
a ted
Ed i
son
Com
pany
of N
ew Y
ork,
In
c.
Ora
nge
a nd
Roc
klan
d U
tilit ie
s, I
nc.
Con
solid
a ted
Edi
son
Com
pany
of N
ew Y
ork,
In
c.
Nia
gara
Mo h
awk
Co r
pora
tion
d/b /
a N
atio
nal
Gr id fo
r Ele
c tric
Ser
vice
Nia
gara
Mo h
awk
Co r
pora
tion d
/b/a
Nat
iona
l G
rid fo
r Gas
Ser
v ice
Ora
nge
a nd R
ockl
and
Utili
t ies,
Inc.
Ora
nge
a nd R
ockl
and
Util
ities
, Inc
.
Con
solid
a ted
Edi
son
Com
pany
of N
ew
Yor
k, Inc
.
Con
solid
a ted
Edi
son
Com
pany
of N
ew Y
o rk,
In
c.
Nia
gara
Moh
awk
Pow
er C
o rpo
ratio
n
Pub
lic S
ervi
ce C
o mpa
ny o
f Nor
th Car
olin
a,
Inc.
Dom
inio
n N
o rth
Car
olin
a P
ower
Car
olin
a P
o wer
& Li
g ht C
ompa
ny d
/b/a
P
rogr
ess
Ene
rgy
Car
o lin
as, I
nc.

PUC Docket No. 46449 ATTACHMENT A
Page 11 of 14
745
SP
ON
SOR
I
DA
TE
I C
ASE
/APP
LIC
AN
T I D
OC
KET
No.
I SU
BJE
CT
Virg
inia
Ele
ctric
and
Pow
e r C
ompa
ny d/
b/a '
03/1
2 V
irgin
ia E
lect
ric a
nd P
ower
Com
p any
d /b/
a D
ocke
t No.
E-22
, Sub
479
Ret
urn
on E
quity
(el
ectr
ic)
Dom
inio
n N
orth
Car
olin
a P
owe r
D
omin
ion
Nor
th C
arol
ina
Pow
er
,
Duk
e E
nerg
y C
arol
inas
, LLC
07
/11
Duk
e E
ner
gy C
aro l
inas
, LL
C
j Do
c ket
No.
E-7
, Sub
989
j R
etur
n on
Eq
uity
(el
ectr
ic)
Nor
th Da k
ota P
ubl
ic S
ervi
ce C
omm
issi
on
Ott
er T
ail P
ower
Com
pany
11
/08
Ott
er T
ail P
ower
Com
pany
Doc
ket N
o. 0
8-86
2 R
etur
n on
Eq
uity
(el
ectr
ic)
Ok la
hom
a C
orp o
rati
on C
omm
issi
on
Ret
urn
on E
quity
Ret
urn
on E
quity
Ret
urn
on E
quity
Ret
urn
on E
q uity
Ret
urn
on E
quity
I Pe
nnsy
lvan
ia P
ubl
ic U
tili
ty C
omm
issi
on
Ret
urn
on E
quity
(el
ectr
ic &
ga
s)
Ret
urn
on E
q uity
(s
team
) I
Rho
de
Isla
nd Pu
blic
Utili
t ies
Com
mis
s ion
Ret
urn
on E
q uity
(ele
ctric
&
gas)
Rev
enue
Dec
oupl
ing
and
Ret
urn
on E
q uity
I S
outh C
arol in
a P
ubl
ic S
ervi
ce C
omm
issi
on
Ret
urn
on E
q uity
Re t
urn
on E
quity
Ret
urn
on
Equ
ity
Ret
urn
on E
quity
Ret
urn
on E
quity
Cau
se N
o. P
UD
2016
0009
4
Cau
se N
o. P
UD
2015
0027
3
Cau
se N
o. P
UD
2015
0020
8
Cau
se N
o. P
UD
2011
0008
7
Cau
se N
o. P
UD
2009
0005
5
Doc
ket N
o. R
-2013
- 2397
237
Doc
ket N
o. R
-2013
- 2386
293
Doc
ket N
o. 43
23
Doc
ket N
o. 3
943
Doc
ket N
o. 20
16- 22
7-E
Doc
ket N
o. 2
013-
59- E
Doc
ket N
o. 2
012-
218-
E
Doc
ket N
o. 2
011-
271-
E D
Ock
et N
o. 2
009-
489-
E
Cen
terP
oint E
nerg
y R
esou
rces
Cor
p., d/
ti/a
C
ente
r Poi
nt E
nerg
y O
kla ho
ma
Gas
O
kla ho
ma
Gas
& E
lect
r ic C
ompa
ny
Publ
ic S
erv i
ce C
ompa
ny of
Okl
ahom
a
Okl
a hom
a G
as &
Ele
c tri
c C
ompa
ny
Cen
terP
oint E
nerg
y O
klah
oma
Gas
Pik
e C
o unt
y L ig
ht &
Pow
er C
ompa
ny
Veo
lia E
nerg
y P
hila
delp
hia,
Inc.
The N
arra
gans
ett E
lect
ric C
6mpa
ny d/
b/a
Nat
iona
l G
rid
Nat
iona
l Grid
RI —
Ga s
Duk
e E
nerg
y P
rogr
ess,
LLC
Duk
e E
n erg
y C
arol
inas
, LLC
Sou
th C
aro
lina
Ele
c tri
c &
Gas
"
Du k
e E
nerg
y C
arol
inas
, LLC
Sou
th C
aro l
ina
Ele
ctric
& G
as
C.0 a- ....._ 0 1
2/1
5
07
/1
5
,-- '‘-- PZ: 0
CZ 0 (+3 0
.0- A- ....... N-- o 1
2/1
3
04/1
2 03 0 03 0
C.0
17:-.7 0
03
..C.--"75 0 0
6/1
2
08
/1
1
03/1
0
Cen
ter P
oint E
nerg
y R
esou
rces
Cor
p., d/
b/a
Cen
terP
oint
Ene
rgy
Okl
a hom
a G
as
Okl
ahom
a G
as &
Ele
ctric
Com
pany
Public
Ser
vice
Co m
pany
of O
klah
oma
Okl
a hom
a G
as &
Ele
ctric
Com
p any
Cen
ter P
oint E
nerg
y R
esou
rces
Cor
p., d/
b/a
Cen
terP
oint
Ene
rgy
Okl
ahom
a G
as
Pik
e C
ount
y Li
g ht &
Pow
er C
ompa
ny
Veo
lia E
nerg
y P
hila
delp
hia,
Inc.
The
Nar
raga
nset
t Ele
ctric
Com
pany
d/b/
a N
atio
nal
Gri
d
Nat
ional
Grid
RI —
Gas
Duk
e E
nerg
y P
rogr
ess,
LLC
Duk
e E
nerg
y C
arol
inas
, LLC
Sou
th Car
olin
a E
lect
ric &
Gas
Duk
e E
nerg
y C
arol
inas
, LLC
Sou
th Car
olin
a E
lec t
ric &
Gas

PUC Docket No. 46449 . ATTACHMENT A
Page 12 of 14
746
SUB
JEC
T
So
uth
Da ko
ta P
ubl
ic U
tilit
ies C
omm
issi
on
I R
etur
n on
Equ
ity (e
lect
ric)
Ret
urn
on
Eq u
ity (el
ectr
ic)
Ret
urn
on
Equ
ity (e
lect
ric)
E E o
_
.0 r = 1/3 RS
63
Ret
urn
on E
qui
ty
(ele
ctric
) I
Ret
urn
on
Equ
ity
Ret
urn
on E
q uity
Ret
urn
on
Eq
uity
(e
lect
ric)
Ret
urn
on
Eq u
ity
Ret
urn
on
Eq
uity
Ret
u rn
on E
quity
Ret
u rn
on E
quity
Ret
urn
on E
quity
(el
ectr
ic)
Ret
urn
on E
quity
I
Ret
urn
on E
q uity
(el
ectr
ic)
Ret
urn
on E
qui
ty (e l
ectr
ic)
Ret
urn
on E
quity
(ele
ctric
)
I Te xa
s R
ailr
oad
Co
mm
iss i
on
Ret
urn
on E
quity
Ret
urn
on E
quity
DO
CK
ET N
O.
I Do
cket N
o. E
L10-
011
Doc
ket N
o. E
L09-
009
Doc
ket N
o. E
L08-
030
Doc
ket N
o. 44
5 24
I D
ocke
t No.
447 4
6
Doc
ket N
o. 4
3950
Doc
ket N
o. 4
3695
I Do
cke
t No.
414
74
Doc
ket N
o. 40
606
Doc
ket N
o. 40
443
Doc
ket N
o. 38
929
Doc
ket N
o. 38
480
Doc
ket N
o. 38
339
I D
ocke
t No.
381
47
Doc
ket N
o. 36
025
Doc
ket N
o. 3
2766
GUD
1043
2
GUD
1018
2
CA
SE/A
PPLI
CA
NT
Otte
r Tail P
ower
Com
pany
Sou
th Dak
ota
Div
isio
n of N
orth
ern
Sta
tes
Pow
er
Ott
er T
a il P
ower
Com
pany
Sou
thw
este
rn P
ublic
Ser
vice
Com
pany
Win
d E
nerg
y Tr
ansm
issi
on T
exas
, LL
C
Cro
ss T
exas
Tra
nsm
issi
on
I
Sou
thw
este
rn P
ublic
Ser
vice
Com
pany
Sha
ryla
nd U
tiliti
es, L
.P.
I W
ind E
nerg
y Te
xas
Tran
smis
sion
, LL
C
Sou
thw
este
rn E
lect
ric P
ower
Com
pany
Onc
or E
lect
ric D
eliv
ery
Com
pany
, LL
C
rfex
as-N
ew M
exic
o P
ower
Com
pany
Cen
terP
oint
Ene
rgy
Hou
ston
Ele
ctri
c L
LC
Sou
thw
este
rn P
ubl
ic S
ervi
ce C
ompa
ny
Texa
s-N
ew M
exic
o P
ower
Com
pany
Sou
thw
este
rn P
ublic
Ser
vice
Com
pany
Cen
terp
oint
Ene
rgy
Res
ourc
es C
orp.
d/b/
a C
ente
rpo i
nt E
nerg
y E
ntex
and
Cen
terp
oint
E
nerg
y Te
xas
Gas
Cen
terP
o int
Ene
rgy
Res
ourc
es C
orp.
d /b/
a C
ente
rPoi
nt E
nerg
y E
n tex
and
Cen
terP
oint
E
nerg
y T
e xas
Gas
UJ I-
08/ 1
0
65 0 (O c=,
CO 0 0
CO
05/1
5
12/14
12/1
4
05/13
08
/12
I 07
/12
v- .3- -..._ .3-
0 .3-- -.... CO 0
6/1
0
I 05/1
0
08/0
8
63 0 LC)
1/5
cn C31
n.
cc u) z 0 0.
(3/) Otte
r Tai
l Pow
er C
ompa
ny
Nor
ther
n S
tate
s P
ower
Com
pany
Otte
r Tai
l Pow
er C
ompa
ny
Sou
thw
este
rn P
ublic
Ser
vice
Com
pany
Win
d E
nerg
y Tr
ansm
issi
on T
exas
, LLC
Cro
ss T
exas
Tra
nsm
issi
on
Sou
thw
este
rn P
ublic
Ser
vice
Co
mpa
ny
Sha
ryla
nd U
tiliti
es, L
.P.
Wind E
nerg
y Te
xas
Tran
smis
sion
, LL
C
Sou
thw
este
rn E
lect
ric P
ower
Com
pany
Onc
or E
lec t
ric D
eliv
ery
Com
pany
, LLC
Texa
s-N
ew M
exic
o P
ower
Com
p any
Cen
terP
oint
Ene
rgy
Hou
ston
Ele
ctri
c L
LC
Xce
l Ene
rgy,
Inc.
Texa
s-N
ew M
exic
o P
ower
Com
pany
Xce
l Ene
rgy,
Inc.
Cen
terp
oint E
nerg
y R
esou
rces
Cor
p. d/
b/a
Cen
terp
oint
Ene
rgy
Ent
ex a
nd C
ente
rpoi
nt
Ene
rgy
Texa
s G
as
Cen
terP
oint
Ene
rgy
Res
ourc
es C
orp.
d/b/
a C
ente
rPoi
nt E
nerg
y E
ntex
and
Cen
terP
oint
E
nerg
y Te
xas
Gas
trt

PUC Docket No. 46449 ATTACHMENT A
Page 13 of 14
747
SU
BJE
CT
R
etur
n on
Eq
u ity
Re t
urn
on E
quity
Ret
urn
on
Equ
ity
Ret
u rn
on E
quity
Ret
urn
on E
q uity
Ret
urn
on
Equ
ity
I U
tah
Publ
ic S
erv i
ce C
omm
issi
on
Que
star
Gas
Com
pany
j
12/0
7 Q
uest
ar G
as C
ompa
ny
Doc
ket N
o, 07
- 057-
13
j R
etur
n on
Equ
ity
Ver
mon
t Publ
ic S
ervi
ce B
o ard
Mer
ger P
o lic
y
Ret
u rn
on E
quity
(e l
ectr
ic)
Ret
urn
on
Equ
ity (el
ectr
ic)
Re t
urn
on E
quity
(g a
s)
IV
irgin
ia S
tate
Cor
pora
tion
Com
mis
sion
-
Ret
urn
on E
q uity
Ret
urn
on E
quity
Ret
urn
on E
quity'
Cap
ital S
truct
ure
Mer
ger S
y ner
gies
DO
CK
ET N
o.
GU
D 1
0175
GU
D 1
017 1
GU
D 1
0038
GU
D 10
00
0
CV 0
1--
Doc
ket N
o. 77
7 0
Doc
ket N
o. 76
27
Doc
ket N
os. 7
175
and
7176
Doc
ket N
os. 7
109
and
7160
Cas
e N
os. P
UE
- 2016
- 0006
3;
PU
E-2
015-
0058
; PU
E- 2
015-
005 9
; P
UE
-201
5-00
60; P
UE
- 201
5-006
1;
PU
E-2
015-
0075
; PU
E-2
015-
0089;
PU
E-20
15- 01
02; P
UE
-201
5-010
4
Cas
e N
o. PU
E-2
015-
0002
7
Cas
e N
o. P
UE
-201 3-
0002
0
Cas
e N
o. P
UE
-201 0-
0014
2
Cas
e N
o. P
UE
- 2005
-0009
8
a> 1`..- fa> a) CI CD M = (..D (..0
CA
SE /
AP
PLI
CA
NT
Atm
os E
nerg
y C
orpo
ratio
n — W
est T
e xas
D
ivis
ion
Atm
os E
nerg
y C
orpo
ratio
n — M
id-T
exas
D
ivis
ion
Cen
ter P
oint E
nerg
y R
esou
rces
Cor
p. d
/b/a
C
ente
rPoi
nt E
nerg
y E
n tex
and
Cen
terP
oin t
E
nerg
y Te
xas
Gas
Atm
os P
ipel
ine
- Tex
as
Cen
ter P
oint E
nerg
y R
esou
rces
Cor
p. d/
b /a
Cen
terP
oint
Ene
rgy
Ent
ex a
nd C
ent
erP
oint
E
nerg
y T
exas
Gas
]
Cen
terP
oin t E
nerg
y R
esou
rces
Cor
p. d
/b/a
C
ente
rPoi
nt E
nerg
y T
exas
Gas
Cen
tral V
erm
ont P
ublic
Ser
vice
Cor
pora
tion;
G
reen
Mou
ntai
n P
owe r
Cen
tral V
e rm
ont P
ublic
Ser
vice
Cor
pora
tion
Gre
en M
ount
ain
Pow
er
Ver
mont G
as S
yste
ms
Virg
inia
Ele
ctric
and
Pow
er C
ompa
ny
Virg
inia
Ele
ctric
and
Pow
er C
ompa
ny
Virg
inia
Ele
ctric
and
Pow
er C
ompa
ny
Virg
inia
Nat
ural
Gas
, Inc
.
Col
umbi
a G
as o
f Virg
inia
, Inc
.
DA
TE
CV CV 0 0
07/0
9
03/0
8
,
CV 0 CO
12/0
5
LO
03
/15
cn .V-7 (0 .— ....... N— •-..... •-- --..... N— ....... 'a — ...... ,— sci,
•Zr a— ....... CSJ i0".
N — V—
-F1
C:1
CO 0 0 .— 0 0 .— 0 .— 0 0 0
Ce
Atm
os E
nerg
y C
orpo
ratio
n —
West Te
xas
Div
isio
n
Atm
os E
nerg
y C
o rpo
ratio
n —
Mid
- Texa
s D
ivis
ion
Cen
terP
oint
Ene
rgy
Res
ourc
es C
orp.
d/b
/a
Cen
terP
oint
Ene
rgy
Ent
ex a
nd C
ente
rPoi
nt
Ene
rgy
Texa
s G
as
Atm
os P
ipel
ine
— T
exas
Cen
terP
oint
Ene
rgy
Res
ourc
es C
orp.
d/b
/a
Cen
terP
oint E
nerg
y E
ntex
and
Cen
terP
oint
E
nerg
y Te
xas
Gas
Cen
terP
oint
Ene
rgy
Res
ourc
es C
orp.
d/b
/a
Cen
ter P
oint
Ene
rgy
Texa
s G
as
Cen
tral
Ver
mon
t Publ
ic S
e rvi
ce C
orpo
ratio
n;
Gre
en M
ount
ain
Pow
er
Cen
tral
Ver
mon
t Pub
lic S
ervi
ce C
orpo
ratio
n
Gre
en M
ount
ain
Pow
er
Ver
mont G
as S
yste
ms,
Inc
.
Virg
inia
Ele
ctric
and
Pow
er C
omp a
ny
Virg
inia
Ele
ctric
and
Pow
er C
omp a
ny
Virg
inia
Ele
ctric
and
Pow
er C
omp a
ny
Virg
inia
Nat
ura l
Gas
, Inc
.
Col
umbi
a G
as of V
irgin
ia, I
nc.
0 CA Z 0 a- C4
0

Cas
e N
o. P
UE
0005
84
Virg
inia
Ele
ctric
an
d Po
we r
Com
p any
C. A
. N
o. A
-09- C
A- 9
17-S
S
Sou
t hw
este
rn P
ubl
ic S
erv
ice
Com
pan
y
PUC Docket No. 46449 ATTACHMENT A
Page 14 of 14
U.J
CA
SE/A
PP
LIC
AN
T
Dom
inio
n R
esou
rces
0 CI)
748

PUC Docket No. 46449 EXHIBIT RBH- I
Page 1 of 3
z z,,eggeggge e g 8.̀ e= e e en co 2,, o r- r- .cr co co N. 6 co. c— co co rw .0 0
ee 0 0 91- cr;
c7)
eeeeeeeeeeeeeeeee - LO CO CD OD CD 0 LO N
3̀1; Nr 10 (0 4- 91- 10 0 4- CO OD co a; 6 6 a) 6 N; 6 a; r- ° co ca 0 cc;
eeeeeeeeeeeeeeeee LO 0 CO CV 0) 0 0 4- C9
10 4- CO 91- 0 0) OA 0 10 N- CI CO CD N. r--: 6 6 6 6 6 6 cci cc; ct; o6 o6 r-: oi cc;
Lu a, 0 2
0 0 -J
ee N- CD
@
- CO Ce)
Cr) a co° =
co N 0
CI
eeeeeeeeeeeee-e CI 0 CV N- CO N- 0 r-oc000r).- co Ol r- CD 1`.. CO CO LO 0 0 01 CO C9 C9 91-
91: CO LC) 1i9 (0 49 4 ci Lei 4 CO 4 N.: @ C0 c.c; tri
ggigg ;g3L7gIgge3gIggg321:g 00000cr 0 10 ocoototoolo 4 cc; to cc; cq ci C0 r) C0 o) lc) 4<0 ai
e e,ee e-eeeeeeeeeeee CD 0 C3 CD r- CD 0 CD 0 CD Q1 C) CD CD CV Nt • QD 04 C) CV Q1 C) 0 CD Cl C) CD CD 0) CD N- ▪ ai C0 ui N. 4 to cc; ci C0 kri cc;
eeeeeeeeee eeeee 0000000000<000000 CO CD co 0 0 Z CO N- ,L9 N
LO 4 4 @ @ C0C0C0C0 C0
eeeeeeeeeeeeeeeee • CO CD 10 CD CO 0) 4 co LO CO CO N. 03 111 N: Co) CO CO 4 CO • Ci Ci Ci Cr,5 CI CI 01 01 CO C1
eeeeeeee eeeeeeeee • CO CO CO (00 N C0 0) (0 0 CI CNI ma: 0 10 q N- CO 4 CC CO o cv co co • ei ci CV ri csi csi ri C C c‘i
0 N O1. .0. 0 c0 N- CO 0 0 4- 0 C- O CO 0 CV CO CO CO 'I- 4 CO . . . . . . . . . . . cr; cc; csi co to r- LO CV CV •- ,- 1.0 C 0) 92- r•-• 10 CO C9 91- t•-• C0er 69 49 49 49 49 49 69 69 43 49 49 49 49 64 49 49 49
ee 6 6
0 N 1/1 @ Lei
e.g.= cc) Lc)
4- 0 10 10 105
CI CD CO CO • ei
o cv • ri
co on «0 r- 4 co 91- 0 0 10 0 CO CO 0 CO CO CI 7 r csi c • ! c?. cs! cs! co. cs! 01. 0? CI csi CO N 4-010 69 49 49 te 69 49 49 69 69 49 49 69 69 69 69 69 69
wi-L.u<coLu <LLIt.u2xoc..)_j -)zu.i>21- 1McsOrzzOouJui <-J<<ciCi - -zOoo_o_o_coX
c L" o as
'It° o. E C o .°
c C" 5 ,..... 0 c
as 2
E TO2- c '1 q 1 <i): •c 5 tu g.c• o EL 12 c g 21 0 E- ci ii i L.7, t, <-2 0 „ . g (2, 0 [1_3 0 0 :5 C 5 ,- 0
w >-• — 2 0 g- 45 Fo-ri 0-T" .c5 C") 2 0 0 c 0 Lii. Lu c ci o c 0. IX .-,a' C F) 0 0 -0 1. 1 z ,...0) 2 ww 6) 05.wi-Zcf c<c c Z 0 L1J
Cl ie.4i2E il6 gQ;(1) -I -3- E *> 2 <<<<00L.7.1z00)0-o_0_co>>c
• co co 0 4- 01 C9 9r 1.0 CO CO 0 0 4-
01 CQ N
g' --.=-.
i5 r- cii
roz 's
LT; 'ff
E E
c = "SZ E
c co
1Z .. 2 2 +
S + ..O e N.
A F• ri
3- i
tic ic o
7, Ta .5 E
IC ic --- E -5.1
r E
rz:" "E
S.' .92 Et 8 ..., 2
2 2 x c S. x x
a. 41
,.., c,„ 0
@- .6 +
Jo az) + - =1 'di + 07 ,_ oE g. E. ..-.. re 8 2 g 7.:. 7' ';'<'' -2 2 --- x iii "c7) ra c) >' 7 :=0 ctI 7 F") N >- > .,' Fo- ,- ,,,‘•
2 8 1 i ,, .1!) ic:} I 1 4a 6 <6 g '5 . . , . . . . .- 0 cr.-0-...,,,Li,
;) w ,,, Li, Li, ,,, CO CO L11 L11 0 ,--
2 ,- N CO V LO CD N- CO CO
N NI. 10 CD • OD 03 0 4- OA C9 4 10 0.1 N NNNNCOCICOCICICO
c (a a) a) 2 2 o. 2 • 2 0 0
2 2
749

.c 1.1.1
2 cc
u j Ccg 0 2 ct
UJ . 3 o _1 cc
ee 60• 3
ee 0 6--C- CO co cd
0 CO cb
e e ▪ o V. Le') Lei Li
ee , O - 04 0 O 0
'ae N. .- 60 60 ui cb
- o 0 0 • Lci
ee cocr, (sic, <6 C6
6 co o
a7.
To a .c o .O., • E 2
LL° 0
to
7). L• TJ
7c.
ft.; 12 cu
co co cb co 0 , N. E, Ot• r-000 .cor-000).- N-0 .ON CO CO cri co e ac cr; cc; oi ac oi o ° co
e eeeeeeeeeeeeeeee 0, cl 00 0 CO sr CO 0 CO 00 CO h. 0) 0 0
cOVICOst0.- CO 6006 CF.000 o6 a; co co cr; o r-: cb cO cc; oi 05 oo ai
e eeeeeeeeeeeeeeee N 00 60 01 CO sr 0) CO
N 0) CO 0.1 CO V CO C-4 CO 0 r- CO h: 00 CO 00 CO 0 0 00 cc; cri N: co .35 N: oi co
eeeeeeez,-;•-eeeeeeeee mcf) 0-004 6-- CON-Or-0 CO 00 01.- s-OONC-e-01.--000.-c00 <-4 00 co. 00 4 4 cc; Lti tri tri Lei 4 co ui 4 cci 4 N: cb Lo cc; Lc;
e eeeeeeee eeeee 00000000000000000 0000000000000 60000 SI- CO 0 0 00 cy cci ci cb 4 oi cb
e eeeeeeeeeeeeeeee 0000h...-004 000 6000 gloNst OCONON 60000 0100)000C--.0) e Co 0 0 0 P.: Lti 4 co oi Lc; Lci cb cci cb
eeeeeeeeee eeeeee oc:)..cpc). to co 4 o o Ciz r- O to N
tri cc; u5 Lci co Lc; 4 4 tri Lci 4 cbcbcb<0 cb
e eeeeeeeeeeeeeeee CO 60 CO st 00 0 CO c0 0 CO r- <O 0 (0)
sr 0 CO 0 co. sr N 01 CO CO 0) CO N 00 C4 C0 CO 04
eeeeeeeeeeeeeeeee CONN-V. 0.00N r- COsi CO h.CDO V- 0 V. 04 CO 01 co to co co CO 04 CO 0) N • 00 ri <si <NI ei oi (.6
N-cbcbcoOCi CiN-cb.-acsr 01 CO 01 N CO sT 461.. 0 el CO CO 0 0 sr
ci Ld u5 oi 4 r-: cs.1 co▪ co to co 4 N. 0 CO CO st h. CO sr 69 69 69 4.9 69 69 44 69 te 69 64 64 49 69 49 69 44
00000r•- •croov-oo•- u0000c00000 '0 7 Is: CI Cs! q N Cs! CI Cs! Cs! LI? Cs! Cq 0! cl cy cy cy c‘i 04 s- .- 69 64 64 69 *4 69 64 69 69 64 69 69 49 69 64 69 69
PIJC Docket No. 46449 EXHIBIT RBH- 1
Page 2 of 3
-J• ZLIJ > 21-111,„pOpzZOOLU....ul <-1 <<0 07 -z00o_n_a.C.05X
›.. c c .2 co
1:c! 0. E o
c
2- (.) 7..:1
g C" c g 2 o o
-gi 2. ›., a rT) - .. 2.
o c E e 2 t = 3 d 15) e e- o c 0 a o E- •213-27J8 0 o ',.. .2 g. E 0 0 0- 701 ,71 .
›.. ,I12 %>. o e-a-, -; c • -,s§LE'e6).--,z. 0 0 .0 ece ulfr.o= 2 .= ?a' 2 -CI 4' 2 -= c) `°' p. ,,,w.c?....iiii- -ucc c% 1 g L5
n' 2 §cia'- g L(')J -4] li'E'Lz):`1" 76 < .7 «uorTr.9zor5cni.
2 f
2 ic• t
= tit' to
043'
to LT; ..-.-
T ,.. o o 'FT
- E =
Nc `'
I --. E co • .2
2 2 ;-7,' . E_E
2 2 — o <
EL EL X C 5...I X 0 Lc) m ,-,.- ‘...) •
22 E, - .s a, Lc) • 0
01 a) ° u- G c:.= ° _ +
.cv .o + - _1 cp + co ....
g e 0 ... c>4 g ''- 3
2 2 — co g wi----- 0 0 a-6 .c = 2 - + x
co n 1 lin -I 'll, 0 . cr CT 0 0 o cr cr 1.11 ILI
Ci) CO IJJ 1.1./ u) co V) LLI LLI — ,-,.. .- cs.1 cc) NI. c 0 0 r- c o Co .2 .-
co N. co 0) •4- cb <0 t- co ac o CV CO sr 60 CO 6-- OD ac o N CI sr 0 NN CiCi NNNC\INNOI 010)01010)
750

e 8e 8e -e e -4! 8e 8e eeeee 8e 8e e 8e co 'Z'a. " ;7'0 6 co o co " 1.1 CO " • cO r 0 4 co o o r- co "- oo 6 6 6 6 ci 6 6 6 6 6 6 ci 6
eeeeeeeeeee 8e e 8e 8e e 8e co co 4 co co (NI to r- o o r- o o 6 ea o cv 4. o CO 7 o cr) o co 6 ca 6 6 a; r- 6 cc; 6 ° N: 6 6 cc; oi 6
•
8e 8e -e eeee 8e eeeee 8e 8e 8e e (..) *) CO CO CD CD N. CD CD LO CD 40 CO e- COD4C061. 0001061:6- .COCICOODCON-r-: 6 6 6 6 6 co 6 co r r co 6 r 6 6
QEQE
QE QE Ncs. CO CD OD CO
8e 8e csi co CS! CO OD 6
e eeeeeeeeeeeeeeee. 0 CV Cs- CO 1- 0 I.-. 0 0 0 0 co
CO r co. co Cl CO CO CO 67 ▪ OD LC) LD CD cci ri 6 4 6 4 r- co 6 6 6
e eeeeeeeeeeeeeeee 0 0 0 0 0 0 0 0 0 0 0 0 0 0 0 0 0 0 0 0 0 0 0 0 0 0 0 0 0 0 0 0 0
6 6 6 6 6 0.1 M CC5 M 6 4 o 6 4 to oi
e eeeeeeeeeeeeeeee. CD 0 CD CD c, CD 0 cf, CD o cio CV et CD VD CV CD 01 Ul 0 0 0 01 C) 6 CD CD t- 0 0 0 0 N: co r- 4 6 6 6 o 6 6 6 6
eeeeeeeeee eeeeee cocc,cgv. o. ocvzm N.: 0 .41 Csl
LDC(SCOLDCD 61- 6/UiLD 61: CDCOLD 6 ica
e eeeeeeeeeee e co . N- Cs! I, CO CO CD Cs-
C‘l CD 61 0 st CO 0) •-• Is, CO CO CO co 6 6 6 6 6 ni (-4 6 4 4 6 ni 6 6
e eeeeeeeeeeeeeeee ▪ LO CO 0 CI Is- 0 CI 0 0 Cl CD N CV 6 6 6 6 DI Di Csi 61' CI CO 04 Oi 6 6
CSIDI61 ,-COCICOst OD CDCOCOCON-COODOO st CO CO CD 0) Cs1 co M. cO sr. CO I,: Ci c‘i 4 6 6 6 4 CV 6 6 a-) co 4 44ovraanicor ols/N-0.4. 69 69 64 49- 69 69 69 69 69 69 69 49 69 69 69 49
00 CO 0 1-.7 CO 6100.-LLOOCOCOOCO 63 CI Cs/ 0 C4 DI 0 Di CI 03 Cs/ CO 0 CO
csi oi Csi Csi csi .- 69 69 69 69 69 69 69 69 69 69 69 69 69 69 69 69 64
.9, 0 2 cc
cuJ
z
Oc
,47
CT'
3 Li o
'ge 0
0 0
ee r- .-cr) o 6 6
QEQE .a co 0 0
QEQE o
CV CO
6 6
QE QE ea o co co ni 6
QEQE . Oc Csl CS/ • ni
o
o o
ca
ca
co
cc IZA‘
ca "ot
O
tr)
"E .92
o- co. a) iri Ta Ta' c c EE 00
°0 1 2 E- -a, 2
x x co Lca ua • i? .9 LO 6 ° a) a) ° 11- .c) .0 + +
Fag 58 7; Fa; P2),:,
'5 g ̀5 2 2 & 0 0- 0- 0 0 0- or u, w co (.0 L.L1 11.1 co W CO LIJ —. 0
to 0 co CD
m
PUC Docket No. 46449 EXHIBIT RBH-1
Page 3 of 3 E
xhib
it R
BH
-1
-121-LI>21-(uLurn0zZ00 LU
C C 9 ra
E e-
g `6'
.2 o • 0 to
1.12 c To 0
g- 8ag -9-I&)ff,so • E e- E (-) 0
( ( r‘-' ,„-• -TT;
;). 3 8 -2 (5 ,) g F., EL E., -
1; C5 g" g EP di 0-- "a' &';') g 0 cf) c EP (Li c 2 0 ce E 0 0 _., E 2
tr, -c La al 005. 0.1 C g Lu
ocacoui rf°ELLIer)g2 -2<,LT., < 00,-.'-'CZ 00S @zoo6..- o_a.u)sx
it) 9
CO 13 CD CD 2 2
2 • 2 0 0
0
2 2 ',4
0_ 0- Z
DJ co • cc, o CSI CO 61. In CO CO CD 0 CS/ CO 61OICON- 03 00.-01COst CNI CNI CNI (NI N Csl C6 DI Cs1 VI CO CO CO CO CO
751

PUC Docket No. 46449 EXHIBIT RBH-2
Page 1 of 20
Line No 1 Inputs 111 121 131 141
Mulb-Stage Grovith 5/5000nted Cash Flow Model 30 Day Average Stock Pnce
Average EPS Growth Rate Estimate in First Stage
151 161 171 I81 191 101 1111 1121 1131 2 Stock EPS Growth Rate Estuntes
Long-Tenn
Payout Ratio tterattve Solution Tarawa! Terminal
P/E PEG Value 3 Company Tidier Pnce asks Frrst Cell Line Average Growth 2016 2020 2026 Proor IRR Rat. Raba 4 ALLETE, Inc ALE $59 60 5 50% 5 00% 4 00% 4 83% 5 27% 66 00% 65 CO% 66 88% po ob 47% 16 77 3 18 5 Allaant Energy Corporaban LNT $35 14 6 10% 6 60% 6 00% 6 23% 5 27% 62 00% 61 00% 66138% 50 ob 82% 19 87 3 77 6 Ameren Corporabon AEE 549 12 6 10% 5 20% 6 0596 5 77% 5 27% 66 00% 63 00% 06 88% po 01) 06% 18 58 3 52 7 Ayrsla Corpsration AVA 54120 5 30% 5 00% 5 00% 5 10% 5 27% 67 00% 65 00% IP 88% = ob 72% 20 41 3 87 8 CMS Energy Comorabon CMS $41 94 6 00% 7 27% 6 00% . 5 27% 64 00% 62 00% 66 88% (so 01) 95% 15 98 3 60 9 DTE Energy Company DTE $93 34 5 80% 5 51% 6 00%
6.77
62: 5 27% 62 00% 60 CO% 66 M% 50 al) 97% 19 08 3 62
10 El Paso Electno Company EE 645 64 4 40% 7 CO% 2 50% 4 63% 5 27% 63 00% 59 OD% 66 88% 90 ob 47% 22 05 4 18 11 IDACORP, Inc IDA 177 00 4 00% 4 OD% 3 00% 3 67% 5 27% 53 00% 80 00% 66 88% Po ot) 63% 20 96 3 97 12 NalbWestem Corporabon NWE 15727 5 00% 5 00% 6 50% 5 90% 5 27% 63 00% 59 00% 66 M% pa 01) 12% 18 30 3 47 13 OGE Energy Corp OGE $31 36 5 20% 4 30% 3 00% 4 17% 5 27% 66 00% 74 OD% 8855% po os) 17% 18 10 3 43 14 Otter Tail Corporal.= OTTR $3467 NA 6 00% 6 00% 6 00% 5 27% 82 00% 64 00% 86 88% (so or) 91% 19 35 3 67 15 =nacre West Caprtal Cerporaton PNW 575 68 4 30% 3 95% 4 00% 4 08% 5 27% 63 00% 64 00% 66 88% po or) 90% 19 42 3 68 16 PPM Resources Inc PNM $32 49 6 70% 5 90% 9 00% 7 20% 5 27% 51 00% 55 00% 66 88% 110 001 46% 16 83 3 19 17 Portland General Electric Company POR $42 40 6 00% 5 90% 5 50% 5 80% 5 27% 59 OD% 5500% 88 88% po oil 98% 19 00 3 60 18 SCANA CorpOrahon SCG 571 41 5 50% 6 00% 4 50% 5 33% 5 27% 55 00% 59 00% 66 88% (so et) 26% 17 65 3 35 19 Wrsconsin EnergY CoM.4198 WEC $59 69 6 20% 6 72% 6 00% 6 31% 5 27% 67 00% 67153% 66 88% po oil 48% 2206 4 19 20 Xoel Energy Inc XEL 641 17 5 40% 5 34% 5 50% 5 41% 5 27% 62 00% 62 00% 66 88% rso 01) 15% 18 17 3 44 21 , r 5 44% Mown 97% 19 16 22 Mu 47% 23 Mm 46% 24 Protected Annual 25 Earninps per Share 1141 1151 1161 1171 118I 1191 1201 1211 1221 1231 1241 1251 1261 1271 1261 1291 1301
26 Company Ticker 2015 2016 2017 2018 2019 2020 2021 2022 2023 2024 2025 2029 2027 2025 2029 2030 2031 27 ALLETE Inc ALE l 93 36 53 54 P 71 63 89 5405 $4 28 34 49 54 71 94 95 55.21 35 415 95 77 56 07 66 39 56 73 17 00 97 45 28 Allant Energy Corporaban LNT 31 OP 51 80 SI 91 52 03 52 15 5229 52 43 52 57 52 72 92 87 53 02 93 18 $3 35 33 53 53 72 53 91 54 12 29 Anpren Corporatan AEE 92.38 52 52 62 06 32 82 62 W $3 15 63 33 93 52 63 71 93 91 54 12 64 34 $4 57 54 81 55 06 55 33 65 61 30 Abet. Corporation AVA 31 89 51 99 52 09 52 19 52 31 52 42 52 55 32 68 52 82 52 97 53 12 $3 29 53 48 53 64 53 83 54 04 6425 31 CMS Energy Corporation CMS 31,89 62 02 92 15 52 29 52 44 $2 60 52 77 52 94 53 12 33 30 63 413 P 66 53 85 64 06 54 27 94 50 14 73 32 DTE Energy Coepany DTE 14.49 94 71 34 95 $527 55 57 $5 89 96 23 56 57 36 94 57 32 $7 71 58 11 58 54 56 99 $9 47 59 97 510 49 33 El Paso Electric Company EE 3203 52 12 52 22 62 33 62 43 92 55 52 67 32 80 52 93 53 06 53.24 33 41 $3 59 53 78 63 95 54 19 5441 34 IDACORP, Inc IDA $3 87 64 01 54 16 94 31 94 47 $4 63 64 82 $5 02 55.24 55 49 $5 77 56 07 96 39 $6 73 $7 08 57 46 67 85 35 NorthWestern Corporabon NWE 3290 63 06 $3 23 53 41 33 69 $3 79 $4 00 64 21 5444 $4115 $4 93 $5 19 55 48 55 75 56 05 56 37 56 71 36 OGE Energy Corp OGE 51% $1 76 91 83 51 91 91 99 32 07 $2 16 6226 52 37 32 48 52 61 92 75 $2 69 63 05 6321 53 38 63 55 37 Otter Tar Corporal= OTTR 6156 61 65 SI 75 $1 86 51 97 52 09 32 21 $2 34 32 47 $2 61 32 75 $2 89 63 04 63 20 63 37 53 55 63 74 38 Prnnacle West Caprtal Corporation PNW 33,92 34 08 54 25 64 42 54 60 54 79 64 99 $522 15 46 55 73 56 02 36 341 56 67 17 02 57 39 57 78 68 19 39 PPM Resources, Inc PNM 51 64 91 76 51 88 32 02 52 17 02 32 52 4t5 52 64 92 81 92 90 53 14 53 31 13 43 63 67 53 86 9.4 06 $428 40 Portland General Elednc Company POR 52 04 92 16 6228 92 42 52 56 $2 70 $2 66 P 02 63 19 63 36 63 54 $3 73 63 92 94 13 04 35 54 58 64 82 41 SCANA Corporation SCG 33-81 64 01 5423 5445 54 89 94 94 55 20 5548 55 77 56 08 66 40 $6 73 57 09 37 48 P 86 $827 38 71 42 Wrsconsm EnergY C9199808 43 Xoer Energy Inc
C 922 34 32 49 52 64 52 81 E
L
. E
,
52 21 $2 33 62 46 62 99 92 59
P 18 $2 73
53 37 $2 88
$3 57 33 04
33 70 63 20
33 99 $44 21 63 37 63 55
54 43 93 73
54 67 33 93
34 91 54 14
65 17 64 36
$S 44 $4 59
55 73 54 83
43 Prcrected Annual 44 Dwytlend P4yout 0.90 [311 ]32) (33] 1341 135/ 1361 1371 155) 1191 1401 1411 1421 1431 1441 145) 1461
45 Company roker 2018 2017 2018 2019 2020 2021 2022 2023 2024 2025 2026 2027 2528 2029 2030 2031 46 ALLEM, Inc ALE 68 00% 65 75% 65 60% 6525% 65 00% 65 31% 85 53% 65 94% 66 26% 66 57% 66 65% 86 88% 66 88% 66 65% 86 55% 6,6 88% 47 Alliant En•rgy Corporatism LNT 62 03% 61 75% 61 50% 6125% 131 00% 61 95% 62 W% 63 94% 64 92% 85 90% 66 813% 55 86% 86 66% 66 W% 66 88% 66 58% 46 Ameren Corporal= AEE 66 00% 85 25% 64 50% 63 75% 8300% 63 65% 6429% 64 94% 65 59% 66 24% 66 85% 66 66% 66 88% 66 MX 66 88% 06 88% 49 Awsla Corparation AVA 67 00% 66 50% 66 00% 65 50% 65 00% 65 31% 65 63% 65 94% 6626% 66 57% 66 58% 66 88% 66 88% 66 88% 6585% 66 88% 50 CMS Energy Corporation CMS 84 00% 63 50% 63 00% 62 50% 62 00% 62 81% 63 63% 6444% 65 26% 66 07% 66 88% 06 86% 66 68% 66 55% W M% 66 88% 51 DTE Energy CoMPany DTE 62 00% 61 50% 61 OM OD 50% 6130D% 61 15% 6229% 63 44% 64 59% 65 74% 66 53% 66 815% 66 813% 66 68% 86 88% 05 88% 52 El Paso Electric Company EE 63 OD% 62 00% 61 CP% 60 OM 59 00% 60 31% 61 63% 62 94% 6426% 65 57% 66 88% 6653% 86 68% 96 88% 66 88% 66 88% 53 IDACORP, Inc IDA 53 00% 54 75% 56 50% 5825% 60 00% 61 15% 6229% 63 44% 64 59% 65 74% 86136% 66 88% 66 M% 56 86% 06 88% 66 55% 54 Northwestern Consorahon NWE 63 00% 62 00% 61 00% 60 00% 59 OD% 60 31% 61 63% 62 94% 6426% 65 57% 66 55% 06 88% 66 85% 66 88% W 88% 66 88% 55 OGE Energy Corp OGE 56 53% 69 00% 70 00% 72 00% 74 00% 7281% 71 63% 70 44% 69 26% 63 07% 66 85% 06 88% 66 85% W M% 56 88% 66 85% 56 Otter Tall Corporabon OTTR 82 00% 77 50% 73 00% 66 50% 64 00% 6448% 84 96% 65 44% 65 92% 66 40% W M% 66 88% 66118% 66 85% 06 88% 66 le% 57 Pinnacle West Capital Corporation PNW 53 00% 63 25% 63 50% 63 75% 84 00% 64 48% 64 96% 85 44% 65 92% 66 40% W 86% 66 88% 66 88% 06138% 65 58% 66155% 58 PNM Resources, Inc PNM 51 00% 52 00% 53 00% 54 CO% 55 00% 56 95% 53 96% 60 94% 62 92% 64 90% 66 86% 66 88% 86 W% 66 88% 66 88% 66 65% 59 Portland General Electnc Company POR 50 00% 58 75% 58 50% 5825% 55 00% 59 46% 60 96% 62 44% 63 92% 65 40% 66 88% 66 W% 06 85% 86 88% 66 88% 66 85% 60 SCAPA Corporation SCG 58 OD% 58 25% 58 50% 58 75% 59 00% 60 31% 61 63% 62 94% 6428% 65 57% 05 88% 66 88% W 55% 66 88% 66 88% 66 88% 61 Wsconsin Energy Corporatron WEC 67 00% 67 OD% 67 00% 67 00% 67 DO% 68 98% 66 96% 86 94% 66 92% 66 90% 66 88% W 86 88% 65 88% 66 58% 66 86% 62 Xcel Energy Inc XEL 62 00% 62 00% 62 00% 62 00% 62 00% 6281% 63 63% 6444% 85 26% 66 07% W 85% 66 88% 66 813% 66 85% 66 88% 66 88%
62 Proiected Annual 63 Cash Flows 1471 1461 1491 1501 1511 1521 153/ 1541 1551 1561 1571 1561 1591 1601 1611 1621 1631
Ter-mewl 64 Company lIcker 2015 2017 2018 2019 2020 2021 2022 2023 2024 2025 2026 2027 2028 2029 2030 2031 Value 65 ALLETE, Inc ALE 52 34 02 44 52 55 62 66 52 78 92 93 63 09 53 27 $3 45 53 85 63 86 54 06 5427 54 50 54 74 54 99 $124 99 66 Albant Energy Corporaton LNT $1 11 SI 18 5125 $1 32 51 39 01 50 SI 62 $1 74 31 86 51 99 32 13 3224 52 36 52 ia $2 62 62 75 961 80 67 Arnwen Corporation AEE 61 66 11 74 91 82 91 90 $1 98 6212 52 26 3241 92 57 12 73 52 90 53 05 6322 53 39 92 56 P 75 5104 23 68 Absta Corporation AVA SI 33 $1 39 61 45 51 51 $1 55 61 76 $1 56 61 96 $2 00 92.20 62 31 62 44 62 56 52 70 52 84 $86 72 69 CMS Energy Corporabon CMS 29 51 51 36 61 44 01 53 $1 61
$11 6674 . 3187
62 01 52 15 52 30 52 45 62 55 $2 71 52 66 P 01 53 17 589 84
70 DTE Energy Company DTE $2 92 53 06 $321 $3 37 63 53 63 81 94 10 54 40 94 72 95 07 55 43 W 71 66 01 $8 33 W 67 $7 02 $200 15 71 El Paso Elecbc Conpany EE 61 34 $1 38 51 42 $1 46 S1 50 91 61 51 72 61 85 SI 95 62 13 $228 92 40 52 53 92 66 62150 62 95 997 33 72 IDACORP, Inc IDA 52 13 5226 $2 44 92 60 52 78 52 94 53 13 53 33 63 55 $3 79 54 06 0427 $4 50 54 74 $4 99 $525 3164 55 73 NorthWestern Corporabon NWE 51 93 92 00 $2 08 32 16 3224 52 41 52 60 62 80 53 01 5323 63 47 $3 65 $3 85 94 05 54 26 94 49 5122 76 74 OGE Energy Com OGE $1 16 $1 25 SI 34 $1 43 $1 53 61 57 51 et 91 67 SI 72 91 75 $I 84 $1 93 92 04 52 14 52.26 62 38 364 30 75 Otter Tall Comorahon OTI)13 61 36 51 36 51 36 61 35 51 34 SI 43 51 52 91 62 S1 72 51 82 61 93 52 04 $2 14 52 26 52 38 52 50 572 47 76 Prnnacle WeP Capital Corporatan PNW $2 57 9269 52 81 92 93 $3 06 5322 63 39 $3 57 53 78 $430 94 24 94 46 64 70 54 94 5521 55 45 $159 12 77 PNM Resources, Ino PNM SO 90 SO 98 51 07 61 17 SI 28 31 41 SI 56 51 71 31 87 $2 04 9221 12 33 ,. 52 45 52 58 62 72 92 86 971 97 78 PortAnd General Electnc Company POR 61 2
.37 01 34 51 41 $1 49 $1 57 SI 70 $1 84 $1 99 62 15 $2 32 12 49 $2 62 62 76 52 91 53 06 5312 591 59
79 SCANA Corporation SCG .2
12 46 $2 OD $2 76 52 91 63 14 53 38 53 63 63 90 54 19 54 50 $4 74 $4 99 6526 35 63 05 82 9153 74 80 Wisconsin Energy Corporation WEC 51 67 SI 77 91 88 62 00 $2 13 5226 $2 39 62 53 32 67 52 152 52 96 53 12 03.79 63 46 33 64 $3 83 $126 54 81 Xcel Energy Inc XEL 51 37 $1 45 51 53 51 61 $1 59 SI 81 $1 93 62 06 52 20 $2 34 52 50 12 63 62 77 52 91 63 07 63 23 657 70
81 Propoted Annual Date 82 Investor Cash Flows 1641 (851 1661 1671 r 1651 1691 1701 1711 172/ [73] 1741 1751 1761 1771 1781 1791 1801 1811
India! 83 ComPany Ticker Outlbw 10/14/16 1291/16 6/30/17 6/30/18 6/30/19 6/30/20 6/30/21 00/22 6/30/23 6/3094 6/30/25 6/30/26 6/30727 6/30/28 6/30/29 6/30/30 6/30/31 84 ALLEM, Inc ALE (659 61) 30 00 W 50 52 40 $2 55 52 66 32 78 $2 93 63 09 53 27 63 45 33 65 $3 86 94 06 64.27 $4 50 $4 74 5129 96 65 Alhant Energy Corporahon LNT (938 14) 5000 $0 24 51 15 $125 SI 32 61 39 $1 50 61 62 $1 74 51 86 $1 99 $2 13 5224 $2 36 12 46 52 62 554 56 86 Armen Corporahon AEE (649 12) W CO W 36 31 71 51152 SI 90 $1 98 52 12 6226 32 41 $2 57 52 73 52 90 63 05 5322 63 39 63 56 5107 96 87 =rata Corporation AVA (941 21) 50 00 5028 91 36 61 45 $1 51 $1 58 61 66 $1 76 91 56 SI 96 52 08 5220 $2 31 $2 44 62 S6 52 70 659 56 85 CMS Energy CorPerat= CMS ($41 95) $0 00 5025 SI 33 21 44 51 53 91 61 S1 74 31 87 62 01 $2 15 62 30 52 45 52 58 62 71 62 86 53 01 $93 00 89 DTE Energy Company DTE ($93 36) W 00 50 62 53 00 $321 63 37 53 53 63 81 34 10 $4 40 64 72 35 07 55 43 55 71 56 01 16 33 $6 67 $207 16 90 El Paw Electric Company EE (945 64) W 00 $0 29 51 37 $1 42 61 46 $1 50 SI 61 $1 72 51 85 $1 98 52 13 $228 3210 92 53 92 66 52 80 S100 28 91 IDACORP, Inc IDA (677 01) $0 00 5045 52 17 92 44 62 60 52 78 52 94 , $33 13 53 33 53 55 $3 79 94 06 54 27 $4 50 54 74 $4 99 S169 80 92 NorthWeatem CorpOmbon NWE 1557 28) $0 00 90 41 6198 92 08 92 16 3224 52 41 52 60 $2 80 53 01 6323 63 47 53 65 53 85 54 05 9426 6127 25 93 OGE Erprgy Corp OGE (631 39) SO 00 5025 51 19 $1 34 51 43 51 53 $1 57 51 62 SI 67 $1 72 $1 78 51 64 51 93 5204 52 14 $2 26 $66 615 94 Otter TM Corporahon OTTR (934 67) SO CO 6529 $1 40 51 36 61 35 91 34 61 43 61 52 $1 52 61 72 $1 82 SI 93 52 04 52 14 52.26 62 38 674 97 95 Pinnacle West Capital Corporation PNW (975 %) W 00 W 55 92 62 52 81 62 93 63 06 5322 53 39 53 57 63 78 54 00 94 24 64 46 64 70 34 94 5521 $164 60 96 PNM Resources, Inc PNM (632 50) W 00 SO 19 90 93 SI 07 51 17 SI 28 $1 41 $1 56 61 71 $1 87 62 04 52 21 52 33 92 45 32 58 $2 72 874 83 97 Portland General Electric Company POR 1542 41) SO 00 6527 S1 31 91 41 51 49 61 57 51 70 $1 84 51 99 62 15 52 32 52 49 $2 62 52 76 $2 91 63 06 $94 81 98 SCAPA Corporation SCG ($71 42) SO 00 50 50 62 39 $2 60 92 76 S2 91 33 14 53 38 63 63 53 90 34 19 54 50 54 74 94 99 5526 35 53 5159 56 99 Wisconsin Energy Corporabon WEC (959 90) 6500 W 36 51 72 $I 88 $2 OD 12 13 6226 92 39 52 53 52 67 52 82 62 95 63 12 63 29 53 46 $3 64 6130 38
100 Xcel Energy Inc XEL (941 17) 65 CO 5029 91 41 $1 53 $1 61 SI 69 $1 81 $1 93 5205 6220 52 34 52 50 62 83 52 77 32 91 63 07 S90 93
752

PUC Docket No. 46449 EXHIBIT RBH-2
Page 2 of 20
MulteStage Grogh rssea vied Cash Ebro Modal 30 Day Average Stock Nice
Une High EPS Growth Rate Estrange 111 First Stage No 1 Inputs NI 121 131 [41 16 161 171 181 19 1101 1111 1121 0131 2 Stock EPS Growth Rate Esranistes Long-Term Peyote Ratio /Wage Soluhon Terminal Terminel
Value High P/E PEG 3 Company Ticker Prce Zacks First Cal 00. Growth Growth 2016 2020 2026 Proof IRR Ratio Rag 4 ALLETE, Inc ALE 959 60 5 50% 5 CO% 4 03% 5 50% 5 27% 66 00% 65 CO% 66 88% (so 01 1 9 66% 5 Allart Energy Corporation LNT $30 14 6 10% 6 CO% 6 CO% 6 60% 5 27% eg 00% 61 03% 65 65% (so or) 8 93% 6 Arneren Corporation AEE 649 12 6 10% 5 20% 6 CO% 6 10% 5 27% 66 00% 63 00% 66 6(1% (so or) 9 15% 7 Amsta Capra/aeon AVA 141 20 5 30% 5 00% 5 CO% 5 30% 5 27% 67 CO% 65 CO% 66 88% go 01) 8 77% 8 CMS Energy Corporation CMS 641 94 6 60% 7 27% 6 00% 7 27% 5 27% 64 CO% 62 00% 66 63% go 00 9 14% 9 DTE Energy Company DTE 893 34 5 60% 5 51% 6 CP% 6 00% 5 27% 62 03% 69 OM 66 63% (so Olt 9 02%
10 El Paso Electric Company EE 645 64 4 40% 7 CO% 2 50% 7 00% 5 27% E3 00% 59 02% ' 66 63% (so or) 9 CO% 11 IDACORP, Inc IDA 577 03 4 00% 4 CO% 3 CO% 4 00% 5 2rh 53 CO% 60 00% 66 88% les 01) 8 71% 12 Northwestern Corporation NWE 657 27 5 00% 5 00% 6 50% 6 50% 5 27% 63 00% 59 CO% 66 Ed% go el) 9 30% 13 OGE Energy Corp OGE $31 38 5 20% 4 33% 3 OD% 5 20% 5 27% 66 00% 74 00% 6663% No CO) 9 44% 14 Otter Tail Corporace OTTR 634 67 NA 6 CO% 6 CO% 6 CO% 5 27% 82 CO% 64 00% 66 63% go 01) 8 91% 15 PInnacle West Capita Corporaton PNW 175 68 4 30% 3 95% 4 00% 4 30% 5 27% 63 CO% 64 CO% 66158% (so 00 8 95%
16 C6 3 04 19 40 3 68 18 18 3 45 20 14 3 82 18 21 3 45 18 79 3 56 18 90 3 58 20 50 3 89 17 16 3 25 16 89 3 20 19 38 3 67 19 14 3 63
16 PNM Resodrceakno PNM 132 49 6 70% 5 93% 9 00% 9 03% 5 27% 51 CO% 55 CO% 65 88% (so 00) 9 95% 15 C6 2136 17 Portland Genera Electric Osnpany POR $4240 6 00% 5 90% 5 50% 6 00% 5 27% 59 00% 58 CO% 66 66% (so 01 1 9 03% 18 SCANA Corporator) SCG 571 41 5 50% 6 CO% 4 50% 6 CO% 5 27% 58 00% 59 00% 66 88% (so or) 9 44% 19 Woman Energy Corporation WEC $59 89 6 20% 6 72% 6 CO% 6 72% 5 27% 67 00% 67 CO% 66 88% go 00 8 55% 20 Xcel Enemy inc XEL 641 17 5 40% 5 34% 5 50% 5 50% 5 27% 62 CO% 62 03% 86 88% 6000 9 1714 21 Mew 9 13% 22 Mac 9 95% 23 Min 8 55% 24 Prqedad Arguer 25 Earrings per Share N 41 M51 1161 1171 1181 1191 120 1211 1221 1231 1241
26 Company Ticker 2015 2016 2017 2018 2019 2020 2021 2022 2023 2024 2025 27 ALLETE, Inc ), ALE $3 38 • 63 57 63 76 $3 97 64 19 $4 42 $4 66 $4 91 $5 18 $5 45 65 74 28 Alert Energy Corporatice LNT 91 69 1 $1 60 $1 92 62 05 32 18 52 33 $2 47 62 63 32 78 $2 94 $3 10 29 Amgen Corporation AEE 62 35 I $2 53 52 66 52 84 $3 02 $3 20 63 39 13 59 $3 79 14 00 $4 22 30 Avata Corporation AVA 51 89 1 11 99 62 10 52 21 62 32 62 45 62 58 62 71 62 06 93 01 63 17 31 CMS Energy Corporation CMS 31 63 62 03 $2 17 12 33 62 50 52 68 $210 53 06 63 25 13 45 13 64 32 DTE Energy Congany DTE 64 45 • 34 72 55 00 65 30 $5 62 $5 96 96 31 $6 67 97 04 57 43 4 67 83 33 El Paso Electric Caelpany EE 62 03 $2 17 $2 V 92 49 92 66 $2 85 93 04 63 23 $3 43 13 63 $3 83 34 IDACORP Inc IDA 63 87 ' 54 02 54 19 94 35 94 53 $4 71 14 91 95 12 55 35 35 62 65 91 35 Northglestem Corporation NWE 9290 63 09 13 29 63 50 63 73 $3 97 $4 22 st 48 64 74 15 01 15 29 36 OGE Energy Corp OGE 31 69 61 70 61 87 61 97 $2 07 52 16 $2 29 62 41 $2 54 $2 67 52 81 37 Otter Tad Cam-atm OTTR 11 56 $1 65 $1 75 61 86 61 97 62 09 $2 21 $2 34 $2 47 $2 61 $2 75 35 Pranacie West Capital Corporetoce PNW 13 52 54 09 $4 26 $4 45 54 64 $4 84 55 05 $5 29 - $5 54 55 82 $6 11 39 PNM Resources Inc PNM 61 64 61 79 61 95 $2 12 62 31 $2 52 32 73 $2 95 $3 16 13 35 $3 56 40 Portland General Electra Company POR 3204 $2 16 62 23 62 43 $2 63 $2 73 $2 89 $3 C6 $3 23 $3 41 53 59 41 SCANA Caporagn SCG $3 81 54 04 54 28 14 54 84 81 $5 10 65 40 $5 71 16 03 $6 36 56 71 42 Wacoranra Energy Corporal.) WE
LC 12 34 52 60 $2 67 52 84 $3 04 $3 24 63 45 $3 66 53 136 $4 11 54 33
43 Xcel Energy N XE o $2 10 ' 62 22 62 34 $2 47 62 60 62 74 62 89 53 05 $3 22 53 39 $3 57
18 76 3 56 16 91 3 21 21 49 4 07 18 07 3 42
1251 1261 1271 1281 1291 1301
2026 2027 2028 2029 2030 2031 16 05 56 36 $6 70 57 05 $7 43 17 e2 $3 27 $3 44 $3 62 63 81 $4 01 14 23 $4 44 54 68 $4 92 15 18 $5 46 $5 74 53 33 13 51 53 69 33 89 54 09 54 31 13 83 $4 03 $4 25 $4 47 64 71 54 95 63 25 $8 Ea 69 14 $9 62 $10 13 610 66 94 04 $4 25 54 47 $4 71 $4 96 $5 22 96 22 16 55 16 89 $7 25 67 64 $8 04 $5 57 55 66 66 17 36 50 66 84 67 20 $2 95 $3 12 $3 25 $3 45 $3 63 $3 83 $2 89 $3 04 53 20 63 37 $3 55 $3 74 56 44 66 77 $7 13 $7 51 67 90 68 32 63 75 $3 95 $4 16 64 37 64 61 $4 85 53 78 $3 98 64 19 $4 41 $4 64 $4 89 67 06 67 43 $7 83 $8 24 $8 67 59 13 $4 56 94 ao $5 06 15 32 65 60 55 90 63 76 $3 96 14 16 $4 33 14 61 64 86
[41] 1421 [431 [441 1451 140
2026 2027 2028 2029 2030 2031 66 68% 66 65% 66 80% 66 65% 66 88% 66 88% 6665% 66 88% 66 88% 66 80% 65 88% 66 158% 66 68% 66 88% • 66 86% 66 88% 66 63% 66 601% 66 ea% 66 66% 65 88% 66 88% 66 86% 66 88% 66 88% 66 661% 66 861% 66 861% 66 88% 66 88% 66 66% 66 861% 66 885. 66 63% 66 88% 66 88% 66 88% 66 88% 66 88% 65 88% 66 63% 66 63% 65 88% 66 88% 66 80% 66 88% 66 815% 66 65% 66 643% 66 88% 66 88% 66 Le% 66 63% 66 66% 66 88% 66 68% 66 80% 66 65% 66 88% 6668% 66 65% 66 86% 66 88% 66 88% 66 66% 66 MI% 65 88% 66 88% 66133% 66 88% 66 043% 66 645% 66 63% 66 63% BS 63% 66 93% 66 80% 68 88% 66 88% 66 88% 66 861% 6688% 66 88% 66 88% 66 88% 66 815% 66 88% 65 88% 66 643% 66 63% 66 63% 66 68% 66 88% 66 88% 156 865. 66 88% 6688% 66113% 66 88% 66 63% 66 88% 66 88%
151 [50 159 [601 [61] 1€21 16431 Teraina
2026 2027 2028 2529 2030 2031 Value
2'. 8
88
,-54
88
88:1
8 8
8981
8i8
43 Protected Annual 44 Dnedend Payout Ratio [31] [32] [33] 134] [35] 1361 [37] [38] [391 1401
45 Company Toker 2016 2017 2018 2019 2020 2021 2022 2023 2024 2025 46 ALLETE kg ALE 66 00% 65 75% 65 50% 65 25% 66 CO% 65 31% 66 63% 65 94% 66 26% 66 57% 47 gent Energy Corporation LNT 62 00% 61 755. 61 50% 61 25% 61 CO% 61 93% eg 56% 63 94% 64 92% 65 93% 48 Amgen Corporation AEE 66 00% 65 25% 64 50% 63 75% 63 03% 62 65% 64 29% 64 94% 65 59% 66 24% 49 Agate Corgraation AVA 67 CO% 66 01% 66 00% 65 50% 65 00% 65 31% 65 63% 65 94% 66 26% 66 57% 50 CMS Energy Caporabon CMS 64 00% 63 50% 63 CO% 62 50% 62 CO% 62 81% 63 63% 64 44% 65 26% 66 07% 51 DTE Energy Compare' DTE 62 00% 61 505. 61 CO% 60 50% 60 CO% 61 15% 62 29% 63 44% 64 595. 65 74% 52 El Paso Electric Company EE 63 CO% 62 CO% 61 03% 63 00% 59 OD% 60 31% 61 63% 62 94% 64 26% 65 57% 53 IDACORP, Inc IDA 53 00% 54 75% 56 50% 58 25% 60 00% 61 15% 62 29% 63 44% 64 59% 65 74% 54 Northwestern Corporation NWE 63 03% 62 00% 61 00% 60 CO% 59 00% 60 31% 61 63% 62 94% 64 26% 65 57% 55 OGE Energy Corp OGE 66 CO% 156 00% 70 OD% 72 00% 74 CO% 72 am 71 63% 70 44% 69 26% 68 07% 56 Otter Tail Corpora. OTTR 82 CO% 77 50% 73 00% 65 50% 64 03% 64 48% 64 96% 65 44% 66 92% 66 40% 57 Annecle West Capta Cap/ration PNW 63 00% 63 25% 63 50% 63 75% 64 005. 64 48% 64 96% 65 44% 65 92% 66 405. 68 PNM Resources, Inc PSIM 51 00% 52 00% 53 00% 54 00% 55 00% 56 90% 58 96% 60 94% 62 92% 64 90% 59 Portland Genaal Electnc Company POR , 59 CO% 58 75% SS 60% 58 25% 58 CO% 59 48% 60 96% 62 44% 63 92% 65 40% 60 SCANA Corporgon SCG l 58 CO% 58 25% 58 50% 58 75% 59 OD% 60 31% 61 63% 62 94% 64 26% 65 57% 61 Wiseman Energy Corporgon WEC 67 00% 67 OD% 67 00% 67 03% 67 00% 66 955. 66 56% 66 94% 66 92% 65 90% 62 Xcel Energy Inc XEL 62 00% 62 00% 62 00% U 00% 62 00% 62 81% 63 63% 64 44% 65 26% 66 07%
1471 141 1491 [501 1511 [521 151 1541 155/ [561
Company Ticker 2015 2017 zole 2019 2020 2021 2022 2023 2024 2026 ALLETE, Inc ALE l 62 35 62 47 62 60 $2 73 62 87 53 04 63 22 93 41 53 61 $.382 64 04 94 26 14 48 94 72 $4 97 65 23 6125 51 Alga Energy Corporation LNT $1 12 $1 19 61 26 $1 34 61 42 $1 53 61 65 $1 78 $1 91 52 05 62 19 62 30 52 42 52 55 52 66 12 83 $151 98 Amaral Corporation AEE $1 67 61 75 $1 83 61 92 62 02 62 16 52 31 12 46 62 63 12 79 52 97 53 13 53 29 $3 47 63 65 53 84 $104 44 Aga. Corporation AVA 61 33 $1 39 91 46 61 52 61 59 $1 68 $1 78 61 861 $1 99 62 11 $2 23 12 35 $2 47 52 60 62 74 $2138 906 81 CMS Energy COOM1465,1 CMS E 61 30 61 30 61 47 $1 56 $1 66 51 60 51 95 $2 10 62 25 $2 40 $2 56 32 70 52 84 $2 96 63 15 53 31 $90 19 DTE Energy Company DTE 32 92 $3 C6 $3 23 $3 40 63 57 $3136 14 15 $4 47 54 63 $5 15 $5 52 $5 81 $6 11 $6 44 56 78 $7 13 6203 43 EJ Paw Electric Company EE $1 37 $1 44 $1 52 $1 60 $1 68 61 63 $1 99 62 16 52 33 $2 51 52 70 62 84 $2 93 13 15 $3 32 $3 49 $98 67 IDACORP, Inc IDA 12 13 $2 23 62 46 62 64 52 83 $3130 $3 19 13 40 $3 63 $3 86 54 16 $4 33 54 61 54 85 65 11 55 35 6164 85 Northwestern Caporal= NWE 61 95 62 04 $2 14 52 24 12 34 $2 55 62 76 $2 99 $3 22 $3 47 $3 72 $3 92 $4 13 $4 34 64 57 $4 82 $123 57 OGE Energy CON, OGE $1 17 $1 27 $1 38 $1 49 61 61 61 67 61 73 $1 79 61 05 $1 91 61 35 62 08 $2 19 62 31 $2 43 32 56 $64 63 Otter Tara Corporation OTTR $1 36 61 36 $1 36 61 35 61 34 61 43 $1 52 61 62 $1 72 61 82 $1 93 62 04 $2 14 62 26 $2 38 $2 50 672 47 Prnnacle West Caprta Corporation PNW 62 SS $2 70 62 82 62 56 $3 10 53 26 $3 44 63 63 63 83 $4 06 $4 30 64 53 $4 77 $5 C2 65 29 65 57 $159 31 PNM Resources Inc PNM $0 91 61 01 $1 13 $1 25 51 39 $1 56 61 74 $1 92 62 12 $2 31 $2 51 $2 64 $2 78 62 93 53 015 $3 24 $73 01 grartkind General Electra Company POR $1 28 $1 35 $1 42 61 50 $1 55 $1 72 61 86 $2 02 62 18 $2 35 62 53 $2 66 62 63 12 95 $3 11 $3 27 691 70 SCANA Corporation SCG $2 34 $2 49 $2 65 $2 83 53 01 53 26 $3 52 $3 63 64 09 $4 40 64 72 14 97 $5 23 65 51 $5150 56 11 $154 43 Wixom,/ Energy CcrIgracn WEC $1 67 61 79 $1 91 62 03 62 17 52 31 52 45 62 60 52 75 62 50 $3 05 63 21 $3 39 63 56 $3 75 $3 95 S126 80 Xcel Energy Ino XEL 61 37 61 45 61 53 51 61 $1 70 61 82 91 94 $2 07 $2 21 52 36 $2 51 32 64 62 78 62 93 63 09 13 25 $87 75
62 Prqected Amoral 63 Cash Eggs
81 Protected Ann.* Data 132 Investor Cash Flows
83 Company
841 ALLETE, Inc 85 Allan( Energy Corporate:0 135 Amgen Caporaton 87 Aunts Corporation 65 CMS Energy Coporation 89 DTE Energy Company 90 El Paso Electric Company 91 IDACORP Inc 92 NorgWestern CorPorgOn 93 OGE Energy Corp 94 Otter Tail Corpora= 95 Pinnacle West Capra' Corporation 56 PNM Resources, Inc 97 Portland General Electric Company 98 SCANA Corporattan 89 Wscomen Energy CorPottra0F
100 Xcal Energy Inc
184/ [651 1661 ]671 1681 [69] [701 [71] 1721 [73] 174/ 170 [76] [771 [781 1791 MI [81] Ina*
lIcker Outraos 10/14/16 12/31/16 6/30/17 6/30/18 6/30/19 62320 6030021 62302 643023 6/3324 03325 613326 613327 613328 03329 633133 03321 ALE (159 61) SO 00 $0 50 52 42 62 60 62 73 62 87 53 04 63 22 13 41 53 61 53 82 54 04 $4 26 64 48 54 72 54 97 5133 74 LNT ($33 14) $O 00 $0 24- 61 15 61 26 $1 34 $1 42 61 53 $1 E6 $1 78 61 91 $2 05 52 19 62 30 12 42 52 55 $2 68 584 81 AEE (549 12) 50 00 SO 35 61 72 11 83 $1 92 $2 02 $2 16 52 31 62 46 $2 63 62 79 $2 97 53 13 53 29 $3 47 $3 65 6108 28 AVA (541 21) 50 03 50 28 $1 37 $1 46 61 52 $1 59 61 63 61 78 $1 63 61 99 62 11 92 23 12 35 $2 47 52 60 52 74 589 69 CMS (641 95) 50 CO 60 28 51 34 91 47 91 56 61 06 51 83 61 95 32 10 $2 25 62 40 62 56 52 70 $2 84 $2 99 93 15 $93 50 DTE (593 36) 50 00 50 62 63 01 13 23 63 40 13 57 53135 $4 15 $4147 $4150 15 15 55 52 55 81 16 11 $6 44 16 78 5207 56 EE ($45 64) SO 00 10 29 61 42 $1 52 51 60 $1 66 61 83 51 99 92 16 62 33 $2 51 52 70 62 84 12 99 53 15 $3 32 610216 IDA ($77 01) SO 00 50 46 62 18 $2 46 $2 64 52 83 53 DD 93 19 53 40 13 63 63 63 54 16 S4 35 64 61 34 85 65 11 9170 23
NWE (657 28) 50 00 10 42 $2 01 $2 14 62 24 $2 34 62 55 $2 76 $2 99 63 22 13 47 93 72 63 92 54 13 $4 34 54 57 6128 39 OGE (531 39) SO 03 $0 25 $1 20 $1 33 61 49 61 61 61 67 $1 73 51 79 $1 85 61 91 61 98 $2 08 62 19 $2 31 $2 43 667 19
OTTR (634 67) 50 00 60 29 61 40 61 36 51 35 $1 34 61 43 SI 52 $1 62 61 72 $1 02 $1 93 $2 04 $2 14 $2,26 $2 38 $74 97 PNW (575 69) 50 00 2055 62 63 52 82 52 96 63 10 53 26 53 44 63 62 53 83 $4 06 64 30 94 53 $4 77 65 62 65 29 5164 88
P146 (632 49) 10 00 SO 19 50 95 61 13 61 25 61 39 $1 56 $1 74 61 92 $2 12 62 31 $2 51 12 64 62 78 52 93 $3 08 676 25 POR (942 41) 50 00 SO 27 91 31 61 42 61 50 61 58 $1 72 61 OS 12 02 92 18 32 35 52 53 62 66 62 80 $2 95 $3 11 $94 97 SCG (671 42) 60 CO $0 50 62 41 62 65 12 83 $3 01 $3 26 $3 52 63 80 64 09 94 40 64 72 54 97 65 23 $5 51 55 8C1 6163 54 WEC (659 93) SO 00 $O 3S $1 73 $1 91 52 03 $2 17 92 31 62 45 $2 60 62 75 52 90 $3 05 53 21 $3 38 53 56 63 75 9130 74 XEL (641 17) 50 03 SO 29 61 41 61 53 $1 61 61 70 61 82 $1 94 62 07 6221 62 36 62 51 62 64 92 78 62 93 $3 CB $91 00
753

Company ALLETE Inc Alert Energy Corporation Amman Caporal,. Atesta Corporation CMS Energy Corporation DTE Energy Company El Paso Electric ComPetty IDACORP, Inc Northwestern Corporation OGE Energy Corp Ottw Tail Corpora.. Pumecle West Gadd Corporation PNM Resources, Inc Porteind General Electric Company' SCAPA Caporation Ws/6nm Energy Carporatan Xcel Energy Inc tt̀
,-!:5
8‘4
NW
iSLI
8I8
fii
PUC Docket No. 46449 EXHIBIT RBH-2
Page 3 of 20
WM-Stage Growth Dtscounled Cash Flow Model $0 Day Average Stock Price
UM Low EPS Growth Rate Estimate in Fest Stage No 1 Inputs 2
3 CattPeny 4 ALLETE, Inc 5 AIM. Energy Corporabon 6 Arneren Corporation 7 Aosta Cappratron 8 CMS Energy Corporation 9 DTE Energy Company
10 El Paso Electric ComPanY 11 IDACORP, Ir. 12 Northwestern Corporation 13 OGE Energy Corp 14 Otter Tail Corporation 15 Pinnecle West Capital Corporatiat 16 PNM Resources, Inc 17 Portlercl General Elect. Ccrirpeny 18 SCANA Corporal.. 19 Waconsin Energy Corp.:rah. 20 Xcel Energy Inc . 21 22 23 24 Prqected Annual 25 Earnings per Share
111 121 PI 141 151 161 171 181 191 N 01 1111 1121 1131 stak EPS Growth Rate Estimates Long-Term Payout Rabe Iterative Solution Terminal Terminal
Value Low P/E PEG Ticker Price Zacks Fast Call Lone Growth Growth 2016 2020 2026 Proof IRR Ram Rat* ALE 659 60 5 50% 5 CO% 4 00% 4 CO% 5 27% E6 00% 65 OD% 65 65% (so Ott 25% 17 71 3 36 LNT $38 14 6 10% 6 CO% 6 00% 6 CO% 5 27% 62 CO% 61 CO% 66 66% Oto op 77% 20 17 3 82 AEE $49 12 6 10% 5 20% 6 CO% 5 23% 5 27% 66 CO% 63 CO% 66 26% 190 PG 93% 19 28 3 66 AVA 541 20 5 30% 5 CO% 5 CO% 5 00% 5 27% 67 00% 65 CO% 66 26% (so Po 70% 20 55 3 90 CMS 541 94 6 60% 7 27% 6 CO% 6 CU% 5 27% 64 00% 62 00% ' 66 621% NO 08 84% 19 76 3 75 DIE 593 34 5 80% 5 51% 6 00% 5 51% 5 27% 62 00% 60 OD% 66 68% MO or) 90% 19 40 3 65 EE $45 64 4 40% 7 00% 2 50% 2 50% 5 27% 63 00% 59 00% 66 26% MI Po 04% 25 46 4 63 IDA 677 00 4 OD% 4 CO% 3 00% 3 CO% 5 27% 53 00% 60 00% 66 215% 36 Po 49% 21 92 4 16
NVVE 65727 5 00% 5 00% 6 50% 5 00% 5 27% 63 00% 59 00% 66161% No Gil CO% 18 91 3 58 OGE $31 38 5 20% 4 33% 3 00% 3 00% 5 27% 66 00% 74 00% 66 16% 90 Pot 87% 19 58 3 71 OTTR 534 67 NA 6 00% 6 CO% 6 CO% 5 27% 82 00% 64 00% 66 88% (so col 91% 19 39 3 67 P196 $75 68 4 30% 3 95% 4 CO% 3 95% 5 27% 63 00% 64 00% 136 88% (so Go 87% 1966 3 71 PNM $32 49 6 70% 5 90% 9 CO% 5 90% 5 27% 51 CO% 55 CCM 66 66% M.) 13% 16 27 3 46 POR 542 40 6 CO% 5 93% 5 50% 5 50% 5 27% 59 CO% 58 00% 65 86% tso PG 91% 19 38 3 67 SCG 571 41 5 50% , 6 00% 4 50% 4 50% 5 27% 58 00% 59 CO% 65 68% Pm DI) me; 1 a se 3 53 WEC $59 89 6 20% 6 72% 6 00% 6 MX 5 27% 67 CO% 67 C.0% 136 66% (so or) 40% 22 53 4 27 XEL 641 17 5 40% 5 34% 5 93% 5 34% 5 27% 62 OD% 62 OD% 66 88% 90 or) 13% 18 26 3 46
4 Mean 83%
Max Min
25% 04%
1141 11 51 1161 1171 1181 1191 1201 1211 1221 am 1241 (251 1261 271 1261
Ticker 2015 2016 2017 2018 2019 2020 2021 2022 2023 2024 2025 2020 2027 2028 2029 ALE 83 36 33 52 53 66 53 60 53 95 24 11 54 29 54 48 34 68 54 91 65 16 $5 43 95 72 56 02 96 34 LNT 51 69 61 79 51 90 52 01 22 13 52 26 52 39 $2 53 52 68 $2 e2 62 96 33 13 53 30 $3 47 63 65 AEE 62.35 52 50 $2 63 22 77 52 92 33 07 33 23 $3 40 $3 57 63 76 53 96 34 17 54 39 94 62 94 86 AVA 91 16 $1 96 92 015 52 19 62 30 52 41 $2 53 92 65 62 80 92 94 63 10 53 26 53 43 53 62 63 81 CMS 91 19 52 CO 52 12 5225 52 39 22 53 52 68 52 83 62 99 53 16 53 33 53 50 33 69 53 88 $4 09 DTE 94 45 54 70 64 95 55 23 55 51 55 82 56 14 $6 47 66 62 57 18 37 57 37 97 56 39 38 63 69 29 EE 6203 52 C6 52 13 52 19 62 24 32 30 $2 36 62 45 52 54 $2 65 $2 78 32 93 53 08 $3 24 53 41 IDA 63 87 53 99 94 11 $4 23 S436 $4 49 64 64 94 81 $5 01 $5 24 $5 49 $5 78 56 CO 56 41 66 75
NWE 9290 53 05 53 20 $3 36 23 52 $3 70 $3 89 $4 09 64 30 54 52 54 75 S5 01 25 27 $5 55 $5 84 OGE 51 69 61 74 $1 79 51 85 31 90 $1 96 52 03 32 10 62 19 52 29 52 40 52 53 $2 65 52 80 52 95 OTTR SI 58 91 65 61 75 51 86 51 97 5209 52 21 62 34 52 47 32 61 32 75 $2 /19 53 04 63 20 S3 37 PNW 53 92 54 07 $4 24 24 40 $4 58 $4 76 $4 96 55 17 $5 41 55 67 $5 96 $6 28 56 61 56 95 67 32 PNM $1 64 51 74 $1 84 51 95 52 06 92 18 S2 31 52 44 22 58 52 72 52 87 53 02 33 18 53 34 23 52 POR I $2 04 52 15 $2 27 52 40 62 53 $2 67 52 81 52 96 53 12 53 29 53 47 63 65 $3 84 $4 04 54 26 SCG 53 51 63 98 64 16 64 35 34 54 $4 75 $4 97 35 20 55 46 65 73 36 03 96 35 56 65 37 03 37 40 WEC 22 34 92 48 62 63 62 79 52 95 $3 13 63 32 33 51 P 70 93 91 24 12 $4 34 34 57 54 81 65 05 XEL $2 10 't 62 21 52 33 $2 45 $2 59 $2 72 $2 87 53 02 63 18 63 35 P 53 53 71 33 91 54 12 $4 33
1291 1301
2030 2031
56 67 57 02
63 85 2.4 05
$5 12 55 39
54 01 SA 22
94 33 34 53 $O 78 510 30
63 59 53 78
$7 10 $7 48
66 15 56 47
63 10 63 27
$3 55 $3 74
67 71 58 11
53 71 53 90
54 46 54 72
37 79 38 2D
25 33 $5 61
$4 56 $4 60
22,'80f8
£blil
a'g
t&tt
&
43 Prqected Annual 44 Denclend Pay.' Ratio
UMW), ALLETE, Inc Mart Energy Corporation kneren Corporation Ante Caporation CMS Energy Corporation DTE Energy Company El Paso Electric Company IDACORP, Inc NorthWestem Corporation OGE Energy Corp Otter Tail Corporal.. Pinnacle West Capital Coiperakcn ROA Resources Inc Portland General Elect= Company SCAPA Corpaation Wisconsn Energy CorPoralmo Xcel Energy Inc
1311 132/ 1331 1341 [35] PM 1371 136 1391 1401 1411 421 1431 1441
Ticker 2016 2017 2018 2019 2020 2021 2022 2023 2024 2025 2026 2027 2028 2029 ALE 66 00% 65 75% M 50% 65 25% 65 CO% 65 31% 65 63% M 94% 66 26% 66 57% 26 125% 66 88% 66 08% 66 88% LNT EC CO% 61 75% 61 50% 61 25% 61 CO% 61 98% 132 96% 63 94% 64 92% M 90% 66 ft% 66 88% 66 86% 66 63% AEE 66 00% 65 25% 64 50% 63 75% 63 00% 63 65% 64 29% 64 94% 65 59% 66 24% 66 86% 65 M% 65 60% 66 95% AVA 67 CO% 66 50% 66 CO% M 50% 65 OD% 65 31% 65 63% 65 94% 66 26% 66 57% 66 88% 66153% 66 80% 66 88% CMS 64 00% 63 50% 66 OD% 62 50% 132 00% 62 81% 63 63% 64 44% 65 26% 66 07% 66 66% 66 88% 66156% 66 88% DTE 62 00% 61 50% 61 00% 93 50% 60 CO% 61 15% 62 29% 63 44% 64 59% 65 74% 66 M% 66 88% 66 66% 66 68% EE 63 00% 132 CO% 61 CO% 60 CO% 59 CO% 60 31% 61 63% 62 94% 64 26% 1 65 57% 66 68% 66 88% 66 68% 66 ea% IDA 53 CO% 54 75% 56 50% 58 25% 60 00% 61 15% 62 29% 63 44% 64 59% 65 74% 66 68% 66 66% 65 65% 66 88%
NWE 63 GO% 62 00% 61 OD% 60 00% 59 MX 60 31% 61 63% 62 94% 64 26% 65 57% 66 MI% 66 80% 66 861% 66 1713% OGE 66 00% 93 00% 70 CO% 72 CO% 74 CIO% 72 el x 71 63% 70 44% 69 26% 65 07% 66 66% 66158% 66 86% 66 60% OTTR 22 00% 77 50% 73 DO% 65 50% 64 03% 64 40% 64 96% M 44% M 92% 66 40% 66 08% 65 M% 66 80% 136 66% NAN 23 CO% 63 25% 63 50% 63 75% 64 CO% 64 48% 64 96% 65 44% M 92% 66 40% 65 88% 66 68% 66 88% 66 63% PNM 51 OD% 52 CO% 53 00% 54 OD% 55 00% 56 98% 55 96% 93 94% 62 92% 64 90% 65 SS% 66 155% 60 26% 66 68% POR 59 00% 58 75% 58 50% 58 25% 58 CO% 59 48% 130 56% 132 44% 63 92% ES 40% 66 88% 66 ems 66 05% 66 88% SCG 68 CO% 58 25% 58 50% 58 75% 59 CO% 130 31% 61 63% 62 94% 64 26% 65 57% 66 Be% 26 88% 66 65% 66 OM WEC 67 00% 67 CIO% 67 OD% 67 CO% 67 CO% 136 90% 66 96% 66 94% 65 92% 66 90% 66 68% 66 66% 66 88% 66 66% XEL 62 00% 62 CO% 62 CO% 62 CO% II2 00% 62 81% 63 63% 64 44% 65 26% 66 07% 136 66% 66 6.5% 66 88% 66 65%
146 1461
2030 2031 1 136 68% 66 88% 66 88% 66 88% 66 66% 66 68% 66 65% 66 86% 66 66% 66 88% 66 88% 66 66% 66 68% 66 ft% 66 88% 66 86% 66 88% 66 88% 66 OM 66 661% 66 86% 66 66% 26 80% 66 86% 66 86% 66 88% 65 65% 66 60% 66 86% 136 88% 66158% 66 88% 66 88% 65 88%
62 Prqected Annual 63 Cash Fkows
64 Company 66 ALLETE, Inc 66 Mari Energy Corporation 67 Ameren Ccrporatton 66 Avata Corporalon 69 CMS Energ y Caporaton 70 DTE Energy Cornpeny 71 El Paso Elea. Company
72 IDACORP, Inc 73 NorthWestern Corporatten 74 OGE Energy Corp 75 Otta Tad Caporal.. 76 Pinnacle West Coped Corporation 77 PNM Resources, Inc 78 Portland General Elect. Company 79 SCANA Corporalmn 80 Wisconsin Energy CorporMion 151 )(eel Enem y I.
(471 1481 .91 P01 1511
Ticker 2015 2017 2018 2019 2020 ALE 52 32 $2 40 52 46 62 58 52 67 LNT 91 11 31 17 61 24 61 31 $1 38 AEE $1 E6 91 72 91 79 51 156 61 93 AVA 51 33 61 39 51 44 51 50 91 57 CMS 61 28 $1 35 51 42 61 49 51 57 DTE 32 91 $3 05 33 19 63 34 53 49 EE 51 31 51 32 91 33 51 34 51 36
IDA $2 11 $2 25 52 39 52 54 92 69 MAT $1 92 51 98 62 05 $2 11 52 18 OGE 61 15 $1 22 61 29 51 37 31 45 OTTR 91 36 51 35 61 W 51 35 61 34 PMAI 52 57 92 66 52 00 62 92 V 05 PNM V 69 50 96 $1 03 $1 11 $1 20 POR 91 27 31 33 61 40 91 47 91 55 SCG 62 31 92 42 32 54 52 67 62 CO WEC 51 26 51 76 91 87 51 95 62 10
L 51 37 $1 44 21 52 51 60 51 69
1521 1531 1541 1551 1561 1571 1581 1591 1601 61I 1621 1631 Terminal
2021 2022 2023 2024 2025 2026 2027 20221 2029 2030 2031 Value $2 6D 32 94 63 09 $3 25 33 43 63 63 83 62 34 03 64 24 54 46 31 48 $1 59 $1 71 61 83 61 96 92 09 92 21 32 32 52 44 62 57 $2 05 92 18 32 32 92 47 52 62 52 79 $2 93 63 09 53 25 63 42 51 E6 51 75 61 66 51 95 22 C6 52 18 $2 30 52 42 S2 55 52 68 $1 65 II ao el 93 $2 06 52 20 $2 34 $2 47 62 60 52 73 52 88 $3 75 $4 03 $4 33 $4 64 54 97 $5 33 55 61 65 90 $6 22 $6 54 es es 6199 83 $1 43 $1 51 $1 60 51 70 91 62 $1 96 $2 06 $2 17 $2 28 $2 40 $2 63 $96 33
92 84 23 00 13 18 53 35 53 61 33 87 $4 CR 54 29 64 51 54 75 65 00 5163 96 52 34 32 52 $2 70 52 90 $3 12 33 35 63 52 $3 71 23 91 54 11 $4 33 3122 35 $1 47 $1 51 51 54 $1 58 61 63 51 E9 51 78 31 87 31 97 52 (8 $2 18 $63 96 31 43 91 52 $1 62 51 72 91 82 51 93 32 02 92 14 $2 26 62 38 62 50 $72 47 $3 20 U 36 ,53 54 53 74 53 95 64 20 54 42 54 ES 64 SO 55 16 $5 43 5159 01 51 32 31 44 $1 57 31 71 $1 86 92 02 V 12 62 24 52 36 52 48 52 61 $71 29 51 67 31 81 21 95 62 10 32 27 $2 44 22 57 $2 70 $2 65 53 00 53 16 291 42 63 CO $3 21 83 44 53 65 $3 95 94 24 54 47 54 70 ' 54 95 55 21 55 49 915292 92 22 52 35 $2 48 52 62 52 76 52 90 63 05 63 21 $3 36 $3 56 P 75 912635 51 60 $1 92 52 C6 52 19 52 33 52 4a 52 61 52 75 52 90 P 05 63 21 $57 66
64 70 5124 38 52 71 661 69 53 60 $103 60 52 82 $86 67 63 03 $89 51
81 Projected Annual Deta 82 Investor Cacti Flows 1641 OM/ 1661 671 MI 1691 1701 1711 1721 176 PM 1751 1761 1771 P81 1701 PM 181/
Waal 83 Company Ticker Outflow /26266 12/31/16 63007 6/33118 6/30/19 6/30/20 6/33/21 6/3322 6/30/23 6/30/24 6/30/25 6/30/26 6/3327 6/30/25 yams maw 6/3631 84 ALLETE Inc ALE 1$59 61) 50 CO 60 50 92 37 52 49 52 68 62 67 92 60 62 94 93 09 $3 25 53 43 63 63 53 82 64 03 64 24 54 46 6129 08 es MEN Energy Caporabon LNT (638 14) $0 00 SO 24 51 14 $1 24 $1 31 21 38 51 48 91 59 51 71 51 83 51 96 62 09 52 21 $2 32 62 44 32 57 634 40 66 Amwen Corporation AEE (549 12) 30 00 SD 35 51 70 el 7s 61156 51 93 52 05 52 18 62 32 52 47 32 62 92 is 62 93 63 Ce $3 25 $3 42 $107 50 87 Av.. Corporation AVA (541 21) 50 00 50 28 $1 36 S1 44 31 50 21 57 91 65 51 75 51 es $1 95 $2 OS 52 18 92 30 32 42 $2 55 92 65 $89 49 88 CMS Energy Corperation CMS 1641 95) 60 CO 60 27 $1 32 $1 42 $1 49 91 57 91 66 $1 es $1 93 $2 06 $2 20 $2 34 $2 47 92 60 62 73 32 88 $9254 89 DTE Energy Company DTE (993 36) 50 00 50 62 52 99 P 19 P 34 $3 49 53 75 54 03 54 33 54 64 64 97 55 33 55 61 55 90 66 22 $6 54 9206 72 90 El Paso Electric Company EE ($45 65) $0 CO 50 26 51 33 31 33 $1 34 51 36 31 43 61 51 51 60 31 70 91 62 51 96 $2 06 52 17 62 28 52 40 598 86 91 IDACORP, Inc IDA (577 01) $0 00 $0 45 62 14 52 39 52 52 $2 69 $2 84 53 00 53 18 63 30 63 61 53 87 34 07 94 29 84 51 54 75 3168 96 92 NorthWestem Caporal.. NWE ($57 28) 50 CO 90 41 61 97 92 05 92 11 $2 18 $2 34 $2 52 92 70 $2 90 53 12 53 35 53 52 53 71 53 91 54 11 2126 71 93 OGE Energy Cap OGE (831 39) ID 00 50 25 91 17 5129
$ 51
1 . 37 . 51 45 51 47 $1 51 51 54 51 58 51 63 $1 69 51 78 61 87 51 97 32 08 566 15
Ott 94 w Tail Corporation OTTR (534 67) 50 00 50 29 51 40 31 36 51 34 $1 43 51 52 $1 62 $1 72 51 82 $1 93 52 D4 52 14 22 26 52 35 974 97 95 Pinnacle West Coped Corporation PIAN (675 69) $0 00 50 55 32 EC? 92 80 $2 92 53 C6 33 20 $3 36 63 54 53 74 93 96 54 20 34 42 54 65 14 61 65 16 3164 44 95 PNM Raources, Inc PNM ($32 50) 50 00 90 19 30 91 21 03 51 11 31 20 91 32 91 44 51 57 $1 71 51 06 52 02 92 12 $2 24 52 35 $2 48 973 90 97 Portland General Electne Campany POR ($42 41) 60 00 50 27 51 30 $1 40 51 47 91 55 51 67 $1 81 51 55 $2 10 62 27 52 44 $2 57 $2 70 52 66 53 CO $94 57 95 SCANA Corporation SCG (971 42) 30 00 60 49 52 36 32 54 62 67 52 60 53 CO 83 21 53 44 53 65 63 95 54 24 $4 47 54 70 34 95 35 21 5158 41 99 Wisconsin Energy Corporation WEC (559 90) 90 00 50 36 51 71 91 87 51 96 52 10 32 22 52 35 62 48 $2 62 62 76 52 61 33 05 33 21 53 38 63 56 5130 11
100 Xcel Energy Inc XEL (541 17) SO CO 90 29 $1 41 91 52 $1 63 $1 69 $1 80 61 92 92 05 $2 19 62 33 52 48 32 61 $2 75 $2 90 53 05 $90 87
754

PUC Docket No. 46449 EXHIBIT RBH-2
Page 4 of 20
Mole-Stage Growth Chscountoti Cash Flow Model 90 Dey Average Stcck Puce
Lone Average EPS Growth Rate Estrnate in Fest Stage
_. 1 kiwis 16 121 131 141 MI 2 Stock EPS Growth Rate Estomsfes
Value 3 Cornpeny Ticker Price Zacks Forst Call Lthe Average 4 ALLETE Inc ALE $61 27 5 50% 5 00% 4 00% 4 83% 5 Alhari Energy Corporation LNT 538 96 6 10% 6 60% 6 00% 6 23% 6 Ammon Corporatoon AEE 950 76 6 10% 5 20% 6 00% 5 77% 7 Assta Cooperation AVA 64221 5 30% 5 CO% 5 CO% 5 10% a CMS Energy CorPorahon CMS 643 38 6 60% 7 27% 6 OD% 6 62% 9 DTE Enemy Company DTE 595 20 Sao% 5 51% 6 00% 5 77% 10 El Paso Electro Company EE $46 22 4 40% 7 CO% 2 50% 4 63% 11 IDACORP Inc IDA 977 91 1 CIO% 4 CO% 3 CO% 3 67% 12 NerthWestem Corporaton NWE 659 41 5 00% 5 OD% 6 50% 5 50% 13 OGE Energy Corp OGE 531 43 5 20% 4 30% 3 00% 4 17% 14 Otter Tad Corporation OTTR 634 02 NA 6 00% 6 00% 6 00% 15 Pre-mole West CoPtal Cotheraeon PNW 577 37 4 30% 3 95% 1 00% 4 06% 16 PNM Resources, Inc PNM $33 36 6 70% 5 90% 9 CO% 7 20% 17 Portland GenerW Electnc Company POR 642 91 6 CO% 5 90% 5 50% 5 26% 18 SCANA Corporation SCG $7251 5 50% 6 00% 4 50% 5 33% 19 Wisconsin Energy Caminito, WEC $6204 6 20% • 6 72% 6 CIO% 6 31% 20 Xcel Energy Inc XEL 942 49 5 40% 5 34% 5 50% 5 41% 21 22 23 24 Prqected Annual 25 Earnings per Share
1141 1151 1161 171 1181 1191 1201 1211 12211 1231 1241 1251 1261 1271 1281 1291 1331
161 171 MI 191 M 01 1111 1121 1131 Long-Term Payout Ratio emotive Sohmon Terminal Termonal
P/E PEG Growth 2016 2020 2026 Proof IRR Ratm Ratio 5 27% 66 00% 65 00% 66 68% (so oh 9 36% 17 24 3 27 5 27% 62 00% 61 00% 66 65% rth 01) a 74% 20 30 3 as 5 27% 66 00% 03 CO% 65 88% (so 011 8 94% 19 20 3 64 6 27% 67 00% 65 00% 66 86% (so 011 8 64% 20 93 3 97 5 27% 64 00% 62 00% 55 66% wa ou 8 66% 19 63 3 72 5 27% 62 CO% 60 00% 66 88% (so 011 8 esii 19 45 3 69 5 27% 63 00% 59 CO% 66 88% (So 01) 8 43% 22 34 1 23 5 27% 53 CO% BD 00% M 88% po 01) 8 59% 21 21 4 02 5 27% 63 CO% 59 00% 65 66% 110011 8 Se% 18 53 3 60 5 27% 66 00% 74 00% 66 MX mo co) 9 16% 18 12 3 41 5 27% 62 oox 64 00% 66 88% (so oth 6 96% 19 02 3 60 5 27% 63 CO% 64 00% 66 86% tso oh 8 82% 19 26 3 77 5 27% 51 CO% 55 00% 65 85% (so oth 9 35% 17 26 3 27 5 27% 59 CO% 56 00% 66 63% (so 01) 8 9354 19 24 3 65 5 27% 58 00% 59 00% 66 66% (so oh 9 20% 17 92 3 40 5 27% 67 00% 67 00% ssaax moor) a 3sx 22 82 4 34 5 27% 62 00% 62 CO% 66 66% (so ot) 9 03% 18 75 3 56
Mean 8 90% Max 9 M% Mill 8 35%
ttittlt1
8151
1iN
WN
`2,'S
ti6
INS
i
Company ALLETE, Inc Meant Energy CaMmatoin Arneren Corporation Asst. Corporabon CMS Energy Censor*. DTE Energy Company El Paso Electric ComPkny IDACORP, Inc Northwestern Corperatmn OGE Energy CorP Otter Tml Cmporation Pinnacle West Catotal Corporation PNM Resourc44, Inc Portland Genera EMcinc Company SCANA Corporation Waconsin Energy Cooporaton /the' Energy Inc
43 Protected Annul 44 Dividend Payout Raba
15 Company 46 AL1E7E, Irs 47 Alkart Energy CorPorrt. 48 Armen Corporation 49 Amato Corporation 50 CMS Energy Corporaton 51 DTE Energy Cornimny 52 a Peso Electric ComP.,Y 53 IDACORP, Inc 54 Northwestern Cofles.e. 55 OGE Energy Corp ' 56 Otter Tad Corporatton 57 Pinnacle West Caplet Corporation 58 PNM Resources Inc 59 Portlend General Bistro Company CO SCANA Corporation 61 Wieconsin Energy Corporabon 62 Xcel Energy Inc
62 Protected MAW 4 63 Cash Fbws
61 Company 65 ALLETE, Inc 66 Meant Energy Corporation 67 Atherton Corporation 65 Aosta Caporabon 69 CMS Energy Corporation 70 DIE Energy Corropany 71 El Paso Electric ComP4nY
72 IDACORP, Inc 73 NorthWestem Corporation 74 OGE Energy Corp 75 Otter Tool Corporation 76 Pirracle West Caprtal Corporation 77 PNM Resatthes Inc 78 Portland General Elestnc Company 79 SCANA Corporatton 80 Waconse Energy Corporation 61 Xcel &orgy Xs
81 Protected AnnuM DMa 82 Investor Cash Flows
83 Company 84 AL1E7E Inc 26 Anent Energy Corporates) 86 Ammon Corporation 87 Aunts Corpcfation 88 CMS Energy Caporabon 89 DTE Ermrgy COMpany 90 El Paso Elecinc Com11605 91 IDACORP, Inc 92 NorthWestern Corporation 93 OGE Energy Corp 91 Otter Tail Corporatom 55 Pinnacle West Capotal Capone:1n 56 PNM Resources, Inc 97 Portland General Elect= Company 98 SCANA Corpmshon 99 Wisconsin Energy Corporation 100 Xal Energy Inc
Toker 2015 2616 2017 2018 2019 2020 2021 2022 2023 2024 2025 2026 2027 2025 2029 2030 2031 ALE 53 33 53 54 53 71 s3 as 51 Ce 54 213 94 /9 $4 71 54 95 $5 21 55 48 65 77 56 07 56 39 56 73 $7 06 67 45 LNI 51 69 51 50 51 91 $2 03 $2 15 52 29 $2 13 $2 57 $2 72 $2 87 15 02 53 16 53 35 63 53 $3 72 53 91 61 12 AEE 52 38 $2 52 92 66 62 82 02 98 $3 15 53 33 $3 52 63 71 $3 91 81 12 54 34 $4 57 64 81 65 06 66 33 55 61 AVA 31 89 $1 93 52 09 $2 19 52 31 52 42 $2 55 82 68 52 82 62 97 53 12 $3 29 53 46 53 64 53 83 54 01 $4 25 CMS 31 66 $2 02 52 15 52 29 02 41 62 60 82 77 $2 94 $3 12 53 30 63 48 53 66 $3 E15 54 C6 14 27 54 50 $4 73 DTE 61 45 it 71 64 96 55 27 55 57 55159 66 23 $6 57 $6 94 57 32 97 71 11 58 51 RI 99 59 47 59 97 910 19 EE 52 CO 52 12 52 22 52 33 52 13 $2 55 52 67 $2 80 82 93 63 06 63 24 63 41 $3 59 53 78 63 98 $4 19 54 11 IDA 53 87 54 01 51 16 54 31 04 17 54 63 61 02 55 02 65 24 65 19 65 77 56 07 M 39 $6 73 57 03 07 46 57 65
NWE 6290 63 06 53 23 53 11 53 59 $3 79 61 00 $4 21 51 /4 51 621 54 93 $5 19 55 16 $5 75 56 05 56 37 06 71 OGE 3169 $1 76 $1 83 $1 91 51 99 $2 07 $2 16 52 26 52 37 52 48 82 61 62 75 $2 69 $3 05 $3 21 53 35 53 55 OTTR $1 55 61 65 $1 76 51 86 $1 97 02 09 02 21 52 34 $2 17 52 61 52 75 $2 69 $3 CM 53 20 53 37 53 55 63 74 PhlW 53 92 94 08 54 25 54 42 VI CO 61 79 04 99 $5 22 $5 46 $5 73 56 02 56 31 56 67 67 D2 57 39 $7 715 68 19 PNM 51 61 $1 76 51 89 $2 02 $2 17 52 32 $2 18 62 64 $2 81 $2 96 $3 11 63 31 $3 16 63 67 $3 86 64 06 51 28 POR 5204 $2 16 52 2$ $2 42 62 56 52 70 82 as 53 02 63 19 53 35 63 51 63 73 $3 92 $4 13 54 35 01 58 $1 62 SCG 33 61 s4 cn 61 23 54 45 51 66 $4 94 95 20 55 18 55 77 16 C6 56 40 56 73 $788 97 46 57 86 $6 27 $a WEC 52 31 $2 49 52 64 $2 81 62 99 $3 18 53 37 $3 57 $3 78 53 99 54 21 54 43 $4 67 54 91 55 17 $5 11 $5 73 XEL 52 10 52 21 62 33 92 46 52 59 $2 73 52 66 $3 01 $3 20 $3 37 53 55 $3 73 $3 93 51 14 $4 36 $4 69 61 83
1311 1321 1331 1311 1351 1361 371 1331 1391 1101 1411 1421 1131 1141 451 1461
Ticker 2016 2017 2018 2019 2020 2021 2022 2023 2024 2025 2026 2027 2028 2029 2030 2031 ALE 66 CO% 66 75% 65 50% 65 25% 65 00% 65 31% 65 63% 65 91% 66 26% 66 57% 66 63% 66 88% 66 88% 66 86% 66 68% 66153% INT 150 00% 61 75% 61 50% 61 25% 61 00% 61 53% 62 96% 63 94% 61 92% 66 90% 66 ea% M WIG 66 158% 66 88% 66 63% 66 56% AEE 66 CO% 65 25% 64 50% 63 75% 63 00% 63 65% 64 29% 64 94% 65 59% 66 24% 65 26% 66 6814 66 MI% 66 66% 66 88% 66 86% AVA 67 CO% 66 50% 66 MX 65 50% 66 CO% 65 31% 65 63% 66 94% 66 26% 66 57% 66 86% 66 66% 66 53% 65 86% 66 88% 66 66% CMS 64 05% 63 50% 63 00% 62 50% 62 CO% 62 81% 63 63% 64 44% 65 26% 66 07% 65 66% 66 66% 66 66% 65 153% 66 66% 66 68% DTE 62 00% 61 50% 61 00% 60 50% 69 00% 61 15% 62 299. 63 41% 64 59% 65 74% 66153% 66 66% M 68% 66 53% 65 66% 66 IN% EE 0 63 05% 152 00% 61 00% BO CO% 59 CO% 60 31% 61 63% 62 94% 64 26% 66 57% 66 66% 66 88% 66 68% 66 86% 66 88% 66 68% IDA 53 00% 54 75% 56 50% 58 25% 150 00% 61 15% 62 29% 63 14% 64 59% 26 74% 66 66% 66 55% 66 66% 66 88% 66 53% 66 6654
NWE 63 C:0% 62 00% 61 00% 60 00% 59 CO% 60 $1% 61 63% 62 94% 61 26% 65 57% 66 88% 66 53% 66 613% 66 63% 66 88% 66 66% OGE 66 00% 68 00% 70 CO% 72 00% 74 CO% 72 81% 71 63% 70 44% 69 26% 66 07% 66 68% 66 86% 66 86% 66156% 66156% 66 653% orrR 62 (XI% 77 50% 73 00% 65 50% 64 00% 64 46% 64 96% 65 14% 65 92% 66 40% 66 68% 66 66% 66 66% 66 66% 66 88% 66 83% PNW 63 CO% 63 25% 63 50% 63 75% 61 6/3% 64 16% 61 56% 65 41% 65 92% 66 40% 66 66% 66 68% 66153% 66 88% 66 SS% 66 66% PNM l 51 00% 52 00% 53 CO% 54 00% 55 00% 56 96% 56 96% 63 94% 62 92% 64 90% 66 66% 66 NM 66 eex 66 66% 66 55% 66 68% POR 59 00% 56 75% 58 50% 58 25% 56 00% 59 48% 60 96% 62 11% 63 92% 65 40% 66 86% 66 53% 66 66% 65 88% 65 66% 66 66% SCG 58 00% 58 25% 58 50% 59 75% 59 00% 613 31% 61 63% 22 91% 64 26% 65 57% 66 66% 66 66% 66 66% 66 153% 65 88% 6516% WEC 67 00% 67 CO% 67 00% 67 00% 67 CO% 65 93% 66 56% 66 91% 66 92% 66 90% 66 6)3% 65 66% 66 66% 66 66% 66 66% 66153% XEL 62 CO% 62 00% 62 00% et CO% 150 CO% 62 81% 63 63% 64 44% 65 26% 66 07% 66 68% 66 52% 66 6.3% 66 86% 66 615% 66 66%
1471 461 1491 1501 1511 1521 1531 1541 M51 1561 1571 1561 [59) MP 1611 1621 1631 Terminel
Ticker 2015 2017 2018 2019 2020 2021 2022 2023 2024 2025 2026 2027 20231 2029 2030 ALE 52 3/ $2 41 S2 55 62 66 $2 715 $2 93 $3 C6 53 27 $3 46 $3 65 $3 66 SA C6 64 27 54 50 54 74 51 59 $128 54 LN7 51 11
i 51 18 $1 25 $1 32 $1 30 51 50 01 62 $1 74 61 86 61 99 52 13 $2 24 52 36 $2 48 $2 62 52 75 563 57
AEE $1 66 $1 71 91 62 $1 93 51 96 52 12 $2 26 52 41 $2 57 $2 73 $2 90 33 05 $3 22 53 39 $3 56 $3 75 5107 71 AVA $1 33 $1 39 $1 15 61 51 $1 58 $1 66 51 76 51 86 $1 96 52 06 $2 20 $2 31 12 44 $2 56 52 70 $2 84 558 93 CMS 61 29
1: $1 36 51 44 $1 53 $1 61 61 74 51 67 62 01 52 15 52 30 $2 15 52 58 $2 71 52 86 63 01 $3 17 $9290
DTE 52 92 $3 06 53 21 $3 37 53 53 53 81 54 10 $4 40 54 72 $5127 55 13 55 71 56 01 06 33 $6 67 57 02 6201 11 EE $1 34 $1 38 51 12 $1 46 $1 50 51 61 $1 72 $1 es $1 98 52 13 $2 28 62 40 $2 53 $2 66 $2 80 $2 55 598 58 IDA 52 13
1
52 28 $2 44 $2 60 $2 78 52 91 63 13 $3 33 53 55 53 79 64 OS $4 27 94 50 54 74 $4 99 55 25 5166 415 NM/6 $1 93 32 00 62 06 $2 16 62 21 52 41 52 60 52 80 63 01 $3 23 $3 17 $3 65 $3 65 ft 05 64 26 $4 49 5127 33 0GE 61 16 $1 25 51 34 $1 13 $1 53 61 57 51 62 $1 67 $1 72 51 76 $1 61 $1 93 $2 01 52 14 $2 26 $2 38 564 40 .
$1 36 61 36 51 36 51 35 61 34 $1 43 $1 52 $1 112 51 72 51 62 61 93 $2 04 52 14 52 26 92 38 62 50 571 09 PNW 62 57 52 69 $2131 $2 93 $3 C6 $3 22 $3 39 53 57 63 713 $4 00 51 21 $4 16 $4 70 64 94 $5 21 55 18 616272 PNM $0 90 $0 96 $1 07 91 17 $1 28 51 41 $1 56 $1 71 51 87 $2 01 02 21 $2 33 52 15 $2 56 52 72 $2 as $73 82 POR $1 27 $1 34 $1 11 51 49 51 57 $1 70 51 81 $1 99 52 15 62 32 52 49 $2 62 $2 76 62 91 $3 06 63 22 $92 74 SCG 62 33 $2 46 52 67 62 76 $2 91 53 14 53 36 63 63 53 90 $4 19 $4 50 $4 71 64 93 55 26 55 53 65 22 $156 09 WEC 51 67 $1 77 $1 66 $2 00 $2 13 $2 26 $2 39 $2 53 32 67 $2 62 $2 96 53 12 $3 29 53 46 63 61 63 63 $131 12 XEL $1 37 51 45 $1 53 01 61 51 69 $1 81 51 93 52 06 S2 20 $2 34 52 50 $2 63 52 77 $2 91 53 07 63 23 530 53
1611 1651 1661 161 Mai 1691 1701 1711 1721 1731 1741 1751 1761 1771 P51 1791 1601 1611 tratal
Ticker Outflos 10/14/16 12/31/16 e193117 6/3518 6/30/19 6/30/20 6/30(21 6130122 6/30/23 6/30/21 6/30/25 6/30/26 6/30/27 6/30/28 530/29 6/30/30 6/30/31 ALE (561 27) $0 00 $0 50 62 40 52 55 52 66 62 713 52 93 53 09 53 27 53 45 $3 65 53 56 $4 06 54 27 61 50 $4 74 5133 52 LNT (538 97) $0O 00 60 21 51 15 51 25 51 32 $1 39 $1 50 51 62 $1 74 51 95 61 99 $2 13 $2 24 $2 36 62 415 62 62 6156 33 AEE (550 76) $00 CO 50 36 51 71 51 82 61 90 51 55 $2 12 $2 26 $2 41 $2 57 $2 73 52 90 $3 D5 53 22 63 39 $3 56 5111 19 AVA ($4224) $0O 00 $00 28 $1 36 $1 45 $1 51 51 58 $1 65 $1 76 $1 86 $1 96 02 06 52 20 $2 31 52 44 52 56 $2 70 591 77 CMS (513 39) $0 00 50 26 61 33 $1 44 $1 53 $1 61 51 74 61 87 $2 01 $2 15 $2 30 $2 45 $2 58 12 71 $2 86 $3 01 $96 07 DTE (595 21) 60 00 50 62 13 00 63 21 63 37 63 63 53 81 61 10 51 10 54 72 55 07 $6 43 $5 71 16 01 56 33 $6 67 5211 13 EE (046 23) 60 00 60 29 51 37 51 42 51 16 61 50 51 61 $1 72 51 66 51 56 52 13 $2 28 62 40 52 53 $2 66 62 80 5101 53 IDA ($77 92) $00 CO $00 45 $2 17 $2 44 52 60 52 78 52 94 53 13 $3 33 53 55 63 79 54 06 $4 27 54 50 64 74 $4 99 6171 73
NWE ($59 41) 60 00 $00 11 91 96 $2 53 ' 62 16 52 24 $2 41 52 60 52 80 $3 01 63 23 53 17 53 65 $3155 54 05 51 26 $131 81 OGE ($31 43) 60 CO $00 26 $1 19 $1 34 $1 43 $1 53 51 57 51 62 $1 67 61 72 51 76 $1 61 $1 93 $2 04 22 14 52 26 $66 77 OITR (531 D2) $0 00 $00 29 01 10 61 35 $1 35 $1 34 01 13 61 52 51 62 51 72 61 22 $1 93 52 04 62 14 52 26 02 36 $73 59 PNW 577 38) $0 00 90 55 $2 62 $2 81 $2 93 53 06 $3 22 15 33 53 57 53 78 64 00 54 24 $4 46 It 70 51 91 55 21 5169 20 PNM M33 36) $00 CO $0 19 50 93 $1 07 51 17 61 25 $1 41 $1 56 $1 71 $1 87 $2 01 62 21 $2 33 62 45 02 56 $2 72 676 68 POR ($42 95) $00 00 $00 27 $1 31 61 41 51 19 51 57 61 70 $1 84 61 99 52 15 62 32 52 49 52 62 52 76 52 91 53 06 $96 96 SCG (57253) SD 00 60 50 92 39 52 60 $2 76 52 91 93 11 53 38 63 63 $3 90 $4 19 54 50 61 71 54 99 55 26 55 53 6161 92 WEC (662 05) $0 00 60 36 $1 72 51 88 62 00 52 13 62 26 52 73 $2 53 $2 67 52 62 $2 96 63 12 53 29 $3 46 63 61 5134 95 XEL (54250) RI 00 50 29 51 41 $1 53 $1 61 61 69 $1 81 51 93 52 06 62 20 $2 31 $2 50 52 63 52 77 02 91 53 07 693 76
•
755

3 Compony 4 ALLETE, Inc 5 Mont Energy Corporotion 6 Amman Corporatron 7 Argot. Corporation 8 CMS Erwrgy Corporsoon 9 DTE Energy Company
10 El Paso Electric Company 11 IDACORP, Inc 12 NorthWestern Corporation 13 OGE Energy Corp 14 Otter Tad Corporation 15 PIIIIIOCIO West Capita Corporation 16 PNM Resources, Inc 17 Portland General ElwAnc Company 18 SCANA Corporation 19 Waconsn Energy Corpora.. 20 Xcel Energy Inc 21 22 23 24 Prqected Annual 25 Earrangs per Shore
Compare/ ALLETE, Inc Alhart Energy Corporation Alllefell Caporaton Ansta Corporation CMS Energy Corporatton DTE Energy Company El Paso Electric Company IDACORP, Inc NorthWestern Corporawn OGE Energy Corp Otter Tod Corporation Pinnacle West Capital Corporation PNM Resources, Inc Portland General Elect= Company SCANA Corporation Wacoran Energy CoMm04341 Xcel EMMY 10O tl
,',S
iSP•l
igib
tfe
gi13
218t3
6,
Si
PUC Docket NO: 46449 EXHIBIT RBH-2
Page 5 of 20
MulteStage Growth Dwootrited Cash Flow Model 90 Day Average Stock Price
Line High EPS Growth Role Estimate wt Foot Stage No 1 Inputs 2
1141 113 1161 1171 11151
Tweet 2015 2016 2017 2018 2019 ALE 93 38 63 57 33 76 53 97 54 19 LetT 31 69
1 61 CO $1 92 62 05 62 18
AEE 1 $2 30 62 53 $2 68 $2 84 63 02 AVA i $.1 519 ' $1 99 52 10 92 21 52 32 CMS : 31 69 $2 03 $2 17 52 33 62 50 DTE 64 45 64 72 55 00 95 30 55 62 EE 52 03 62 17 62 32 $2 49 $2136 IDA $3 87 $4 02 54 19 54 35 $4 53
NWE $2 git $3 09 63 29 T $3 50 $3 73 OGE 1 61 66 $1 78 $1 87 61 97 $2 07 OTTR $1,56 61 65 $1 75 $1 86 $1 97 PNW $3 92 $4 09 54 26 5.4 45 14 64 PNM POR
5 912
64 04
91 79 $2 16
61 95 $2 29
$2 62
12 43
62 31 $2 58
SCG 33 81 $4 04 $4 25 $4 54 $4 81 WEC $234 $2 50 $2 67 32 614 53 04 XEL 52 113 52 22 62 34 $2 47 62 60
111 121 131 141 151 Stook EPS Growth Rate Est !males
Va. High Ticker Price Zack. Fast Call Une Growth
ALE 561 27 5 50% 5 00% 4 OD% 5 50% LNT 63896 6 10% 6 60% 6 CO% 6 60% AEE $50 76 6 10% 5 20% 6 00% 6 10% AVA $42 24 5 33% 5 00% 5 00% 5 30% CMS 643 38 6 60% 7 27% 6 CO% 7 27% DTE 535 20 5 80% 5 51% 6 DO% 6 CIO% EE 946 22 4 40% 7 00% 2 50% 7 00% IDA 977 91 4 00% 4 00% 3 00% 4 CO% NNE 659 41 5 00% 5 CO% 6 50% 6 50% OGE 631 43 5 20% 4 30% 3 CO% 5 2C%
OTTR 934 02 NA 6 00% 6 00% 6 CO% PNW $77 37 4 30% 3 95% 4 00% 4 30% PNM $33 36 6 70% 5 90% 9 00% 9 00% POR $42 94 6 CO% 5 SO% 5 50% 6 00% SCG 972 51 5 50% 6 CO% 4 50% 6 00% WEC 562 D4 6 20% 6 72% 6 00% 6 72% XEL $42 49 5 40% 5 34% 5 50% 5 50%
13 171 161 191 1101 1111 1121 1131 Long-Term Payout Raw Iterative Saul ton Tenor* Tanana
P/E PEG GrOwth 2016 2020 2026 Proof IRR ROM. Ram 5 27% 66 00% 65 CO% 66 86% (SO 01) 9 54% 16 51 3 13 5 27% 62 CO% 61 00% 66 015% Wo on 8 83% 19 62 3 76 5 27% 66 00% 63 00% 66 88% M: 01) 9 02% 18 79 3 56 5 27% 67 OD% 65 OM 66 88% 01) 8 641% 20 66 3 92 5 27% 64 CO% 62 CO% 66 93% (3) og 9 01% 18 63 3 57 5 27% 62 00% 60 CO% 65 815% 6001) 8 95% 19 17 3 63 5 27% 63 00% 59 OM 66 86% (s0 01) 8 95% 19 14 3 63 5 27% 53 00% 60 00% 66 88% no 01) 67% 20 74 3 93 5 27% 63 00% 59 CO% 66 88% Mo or) 9 23% 17 80 3 37 5 27% 66 00% 74 00% 66 88% (50 00) 9 44% 16 92 3 21 5 27% 62 OD% 64 OD% 66 88% Iso mg 8 95% 19 02 3 60 5 27% 63 00% 64 00% 66 IP% (so go 8 87% 19 56 3 71 5 27% 51 CO% 55 CO% 66 88% MO 00) 9 83% 15 44 2 93 5 27% 59 CO% 58 CO% 66 86% (So tru t5 99% 18 99 3 60 5 27% 58 00% 59 00% 56 88% 60 01) 9 38% 17 17 3 26 5 27% 67 CO% 67 00% 66136% (So Dr) 8 44% 22 27 4 22 5 27% 62 00% 62 CO% 66 88% MO 01) 9 05% 18 65 3 54
Moon 9 05% Moo 9 53% Min 8 44%
1191 1201 1211 1221 1231 1241 1251 1281 1271 281 1291 f331
2020 2021 2022 2023 2024 2025 2020 2027 2028 2029 2036 2031 $4 42 $4 66 $4 91 $5 18 65 45 65 74 96 05 56 36 $6 70 57 05 57 43 97 82 92 33 62 47 $2 63 62 78 $2 94 $3 10 6327 53 44 $3 62 $3 81 94 01 $4 23 63 20 $3 39 $3 59 $3 79 34 00 54 22 $4 44 $4 68 64 92 55 18 95 46 55 74 62 45 $2 58 12 71 $2 66 $3 01 $3 17 $3 33 $3 51 $3 649 $3 89 $4 09 $4 31 52 66 $2 87 63 06 $3 25 $3 45 $3 64 63 63 $4 03 $4 25 $4 47 54 71 $4 95 $5 96 66 31 66 67 $7 04 $7 43 57 83 $8 25 58 63 59 14 69 62 510 13 610 66 62 85 $3 04 $3 23 $3 43 23 63 $3 83 $4 04 $4 25 $4 47 54 71 64 96 65 22 $4 71 $4 91 $5 12 $5 36 $5 62 $5 91 96 22 56 55 $6 59 $7 25 $7 64 $8 04 $3 97 $4 22 $4 48 $4 74 $5 01 $5 29 65 57 $5 86 66 17 $6 50 $6 04 57 20 12 115 52 29 $2 41 $2 54 62 67 52 81 $2 96 $3 12 $3 PI 53 45 $3 63 63 63 62 09 $2 21 $2 34 $2 47 $2 61 52 75 62 89 $3 04 $3 20 63 37 $3 55 63 74 64 84 $5 Oi $5 29 95 54 65 62 $6 11 $6 44 $6 77 67 13 $7 51 $7 90 $8 32 $2 52 $2 73 62 95 63 16 53 36 63 56 P 75 $3 95 $4 16 $4 37 $4 61 $485 $2 73 62 89 $3 C6 $3 23 $3 41 $3 59 63 78 $3 95 $4 19 64 41 $4E4 $4 89 65 10 $5 40 55 71 $6 03 56 36 5,6 71 67 06 $7 43 $7153 68 24 $8 67 59 13 63 24 53 45 $3 66 $3 86 $4 11 $4 33 64 56 $4 80 $5 C6 55 32 65 CO $5 90 $2 74 92 89 $3 C6 $3 22 53 39 53 57 $3 76 63 95 54 16 54 35 54 61 54 66
P3e1
30
@4
RS
TO
`3S
es&
tA&
43 Prmected Annual 44 Dividend Payout Ratio
COMP.)), Treer AL1ETE Inc ALE Albert Energy Corporogon LNT Amer. Corporation AEE Avesta Caporatton AVA CMS Ertorgy Commotion CMS DTE Energy Company DTE El Paso Electric Compww EE IDACORP Inc IDA NorthWestem Corporogon NWE OGE Energy Corp OGE Otter Tod Commotion OTTR Pinnacle Wea Copia/ Corporation PNW PNM Resources, Inc PNM Poniard Genera Boot= Company POR SCANA Corporation SCG Wisconsin Energy Caporahon WEC Xcel Energy Inc )(EL
1311 1321 1331 1341 1351 1361 1371 :361 1391 1401 1411 1421 1431 1441 1451 1461
2016 2017 2018 2019 2020 2021 2022 2023 2024 2026 2026 2027 2028 2029 2030 2031 ) 66 00% 65 75% 65 50% 65 25% 65 00% P 31% 65 63% 65 94% 66 26% 66 57% 66 86% 66 86% 66 33% 66 65% 66 56% 66 88% 132 CO% 61 75% 61 50% 6125% 61 1E% 61 9B14 62 96% 63 94% 64 92% 65 90% 66 88% 66 66% 66 ft% 66 88% 66 88% 66 95%
1
66 OD% 65 25% 64 50% 63 75% 63 CO% 63 I55% 64 29% 64 94% 65 59% 66 24% 66 88% 66 88% 56 65% 66 DM 66 88% 66 MX 67 OM 66 60% 66 00% 65 50% 65 CO% P 31% 65 63% 65 94% 66 26% 66 57% 65 88% 66 M% 6656% 66 88% 66 63% 66 86% 64 CO% 63 50% 63 OD% 62 SO% IV CO% 62131% 63 63% 64 44% 65 26% 66 07% 66 88% 66 95% 66 85% 66 88% 66 DM 66 88% 62 DO% 61 50% 61 00% OD 50% 63 00% 61 15% 62 29% 63 44% 64 59% 65 74% 66 56% 66 86% 56 65% 66 88% 66 88% 66 Le% 63 00% P CO% 61 00% 60 CO% 59 00% 60 31% 61 63% 62 94% 64 26% 56 57% 66 8854 66 88% 66 88% 66 ea% 66 88% 65 &A 53 DO% 54 75% 56 50% 58 25% 60 00% 61 15% 6229% 63 44% 64 59% 65 74% 66 88% 66 65% 66 88% 66 Le% 66 86% 66 88% 63 CO% 62 00% 61 00% 60 CO% 59 00% 60 31% 61 63% 62 94% 64 26% 65 57% 66 88% 66 68% 66 16% 66 88% 66 66% 66 88% 56 OD% 35 CO% 70 00% 72 CO% 74 CO% 72 81% 71 63% 70 44% 69 26% 68 07% P MX 65 86% 66 65% 66 86% 66 88% 66 86% 82 OD% 77 50% 73 00% 68 50% 64 00% 64 48% 64 96% 65 44% 65 92% 65 40% 66 M% 65 88% 66 88% 66 88% 66 88% 66 66% 53 1E% 63 25% 63 50% 63 75% 64 1E% 64 48% 64 9604 65 44% 65 92% 65 40% 66 56% 66 88% 66 68% 66 MIS 65 56% 66 88% 51 00% 52 00% 53 00% 54 CO% 55 CO% 56 98% 58 96% 50 94% 62 92% 64 90% 66 86% 66 88% 4 66 86% 66 8614 66 65% 66 56% 59 00% 58 7504 58 50% 58 25% 58 1E% 59 48% 60 95% 62 44% 63 92% 65 40% 66 88% 65 88% 66 MI% 66 68% 66 88% 66 63% 58 CO% 53 25% 58 50% 5575% 59 00% 50 31% 61 63% 62 94% 64 26% 65 57% 66 88% 66 551% 66 88% 66 56% 66 88% 66 MIS 67 CO% 67 CO% 67 CO% 67 00% 67 CO% 66 95414 66 96% 66 94% 66 92% 66 90% 65 88% 66 86% 66 MI% ES Et% 56 88% 66 88% T 62 CO% 62 OD% 62 CO% 62 CO% 62 C.0% 62 81% 63 61% 64 IA% 65 26% 66 07% 66 88% 66 88% 65 88% 66 88% 66 88% 66 88%
62 Prqeoted Annual 63 Cash Flows 1471 1481 1491 1501 1511 1521 1531 1541 1551 .1561 1571 1581 1591 1601 (611 1621 1631
Terminal 64 Company )cker - 2015 2017 2018 2019 2020 2021 2022 2023 2024 2025 2026 2027 2020 2029 2030 2031 Value 65 ALLETE, Inc ALE 52 35 52 47 52 60 $2 73 02 87 $3 04 33 22 53 41 $3 61 $3 82 $4 04 54 26 64 48 54 72 54 97 65 23 5129 06 66 Allure Energy Corporation LNT SI 12 61 19 $1 26 61 34 51 42 $1 53 91 65 $1 78 $1 91 $2 C6 62 19 $2 33 $2 42 $2 55 $2 68 S2163 333 75 67 Arneren Corporotoon AEE $1 67 SI 75 61 83 61 92 $2 02 $2 16 $2 31 $2 46 62 63 $2 79 $2 97 $3 13 53 29 $3 47 $3 65 $3 84 $107 94 68 Amato Corporahon AVA ' 91 33 51 39 61 46 $1 52 91 59 61 68 $1 78 61 86 61 99 92 11 $2 23 02 35 52 47 52 60 62 74 52 88 689 02 69 CMS Energy CorPorMlog CMS 7D DTE Energy Company DIE
1 61 30 $1 38 51 47 $1 56 61 E6 $1 80 61 95 $2 10 52 25 62 40 62 56 52 70 $2 64 52 99 53 15 53 31 $93 26
52 92 $308 $3 23 53 40 5357 53 86 54 15 $4 84 EC $S5 55 55 $6 47 15 52 81 11 66 44 66 78 $7 13 $204 39 71 El Paso Electric Company EE $1 37 61 44 $1 52 61 60 $1 68 $1 83 $1 99 $2 16 62 33 $2 51 62 70 62 84 $2 99 $3 15 63 32 63 49 $99 92 72 IDACORP, Inc IDA i 62 13 62 29 52 46 $2 64 52 513 63 00 53 19 63 40 53 63 63 613 54 16 64 38 $4 61 $4 85 65 11 95 36 6166 79 73 NorthWestem Corporagon NWE 61 95 52 04 $2 14 52 24 62 34 52 55 $2 76 $2 99 53 22 53 47 53 72 $3 92 $4 13 $4 34 $4 57 $4 82 , $128 14 74 OGE Energy Corp OGE 1 1 61 17 61 27 $1 38 $1 49 SI 61 $1 67 61 73 $1 79 $1 65 $1 91 $1 98 $2 05 52 19 $2 31 52 43 52 56 564 73 75 Otte. Tad Corporation OTTR I $1 36 $1 36 61 36 51 35 $1 34 61 43 $1 52 $1 62 61 72 $1 P $1 93 $2 04 $2 14 $2 26 $2 36 $2 50 571 09 76 Pinnacle West Copia Corporagon PMA/ 1 ll $2 58 $2 70 62 82 52 96 $3 10 63 26 63 44 53 63 53 83 $4 C6 $4 33 $4 53 $4 77 $5 02 $5 29 65 57 $162 91 77 PNM Resources, MO PNM I 50 91 $1 01 $1 13 $1 25• 51 39 $1 56 $1 74 $1 92 52 12 52 31 $2 51 32 64 $2 78 52 93 $3 Ca5 53 24 $74 87 78 Portland General Elergrao Company POR $1 28 $1 35 $1 42 51 50 51 58 $1 72 $1 83 52 02 52 18 52 35 52 53 $2 66 52 80 $2 95 53 11 53 27 $92 86 79 SCANA Corporaton SCG $2 34 $2 49 52 65 $2 63 53 01 53 26 53 52 53153 54 09 $44 40 54 72 54 97 55 23 95 51 $5 HD 56 11 $156 79 80 Wecorrom Energy Cr:coo-atm WEC 51 67 $1 79 51 91 $2 03 $2 17 52 31 $2 45 52 60 $2 75 $2 90 53 C6 $3 21 33 93 53 56 53 75 $3 95 5131 38 81 Xcel Energy Mc )(EL 61 37 $1 45 $1 53 $1 61 61 70 $1 IP 61 94 52 07 62 21 62 36 62 51 52 64 52 78 62 93 02 09 63 25 590 58
81 Prqooted Annul Data 82 Investor Cash Flaws
83 Company 64 ALLETE, Inc 86 Mont Energy Corporation 86 Arneren Corporotton 87 Asada Corporagon 88 CMS Energy Corporal/on 89 DTE Energy CornPmW 93 El Peso Electric Company 91 IDACORR Inc 92 NorthWeetern Corporaion 93 OGE Energy CoM 94 Otter Tad Corporation 95 Pirriage Wee Gonda Corporatoon 96 PNM Resources, Inc 97 Portland General Electnc Company 95 SCANA Corporabon 99 Wisconsin Energy Corporaan
100 Xcel Enorgy Inc
1641 1651 1661 1671 190 - 1691 1701 ru 1721 [731 1741 1753 1761 r771 1781 1791 ROI 1811 India
Ticker Outflow *4NW 12/31116 6/30/17 6/30/18 6/321/19 6/30/20 6/30/21 6/30/22 6/33/23 6/30/24 6/33/25 6/33/26 6/30/27 6/30/28 6/3129 6/30/33 6/30/31 ALE (551 27) 60 CO SO 50 $2 42 $2 60 52 73 52 87 63 04 $3 22 $3 41 63 61 63 82 64 CM 64 26 54 48 54 72 54 97 5134 29 LNT ($38 97) SO 00 SO 24 $1 15 $1 26 61 34 $1 42 $1 53 61 65 $1 78 $1 91 $2 C6 $2 19 62 33 62 42 52 55 52 68 $86 58 AEE (S50 76) $0 OD SO 36 51 72 51 63 61 92 52 02 52 16 52 31 12 46 62 63 52 79 62 97 63 13 $3 29 53 47 $3 65 5111 79 AVA 1542 24) SO 00 55 28 61 37 $1 46 51 52 51 59 $1 68 51 78 $1 86 51 99 $2 11 S2 23 52 35 52 47 $2 60 $2 74 591 90 CMS ($43 39) 60 00 55 28 61 34 $1 47 51 56 $1 65 61 110 61 95 02 10 62 25 62 40 52 56 62 70 52 84 $2 99 $3 15 696 57 DTE ($95 21) 60 OD 60 62 $3 01 $3 23 $3 40 53 57 53 86 54 15 54 47 64 80 $5 15 55 52 5O 81 $6 11 56 44 56 78 $211 53 EE ($46 23) 60 OD 64) 29 $1 42 $1 52 $1 60 91 68 61 63 $1 99 $2 16 52 33 $2 51 $2 70 $2 84 62 99 63 15 $3 32 $103 41 IDA (577 92) SO 00 50 46 52 18 $2 46 62 64 62 53 $3 CO 13 19 63 40 $3 63 63 88 64 16 94 38 64 61 64 85 65 11 $172 16 NWE (55941) WCO 6042 52 01 52 14 $2 24 $2 34 52 55 62 76 $2 99 53 22 63 47 53 72 $3 92 $4 13 34 34 54 57 $13295 OGE (531 43) 50 00 SO 25 $1 20 51 35 51 49 $1 61 $1 67 $1 73 91 79 $1 85 51 91 51 95 $2 08 $2 19 $2 31 $2 43 $67 29 OTTR ($34 02) SO CO SO 29 91 40 $1 36 $1 35 51 34 51 43 31 52 $1 62 $1 72 91 82 31 93 62 04 52 14 62 26 62 38 673 59 PNW (577 38) SO 00 60 55 $2 63 62 152 52 96 93 10 53 26 $3 44 63 63 $3 83 54 06 54 30 54 53 34 77 55 02 P 29 $133 46 P14M ($33 36) SO CO 50 19 50 95 51 13 $1 25 51 39 $1 56 $1 74 $1 92 52 12 $2 31 $2 51 62 64 52 78 52 93 53 08 578 11 POR (642 95) 60 00 $0 27 $1 31 91 42 51 50 51 58 51 72 $1 86 52 02 52 18 52 35 $2 53 52 66 $2 83 52 95 $3 11 $96 13 SCG (672 52) SO 03 SO 50 52 41 62 65 52 83 53 01 $3 26 $3 52 63 80 $4 09 64 40 94 72 64 97 $5 23 55 51 55 60 $162 93 WEC (562 05) 50 00 50 36 $1 73 $1 91 52 03 $2 17 $2 31 52 45 $2 60 62 75 12 90 63 05 63 21 53 38 53 56 53 75 $135 32 XEL ($4250) SO 00 50 29 51 41 $1 53 $1 61 61 70 61 82 $1 94 P 07 52 21 $2 35 52 51 52 64 52 78 32 93 $3 09 593 63
756

1281 1291 1331
2029 2030 2031 56 34 56 67 97 02 53 65 53 65 $4 05 94 86 55 12 55 39 53 81 14 01 54 22 54 09 54 30 54 53 39 29 59 78 $10 33 93 41 93 59 53 78 96 75 97 10 57 48 55 84 56 15 56 47 92 95 93 10 93 27 53 37 53 55 63 74 17 32 57 71 98 11 93 52 53 71 53 90 64 26 $4 46 5.4 72 97 40 97 79 58 20 55 06 55 33 55 61 64 33 54 56 54 80
1441 1451 1161
2029 2030 2031 66 86% 66 BB% 66 86% 65 88% 65 88% 66 M% 66 86% 65 63% 66 86% 66 86% 66 88% BS 813% 66 aum 66 aa% 66 88% 65 88% 66 MX 66 66% 66 63% 66 63% 66133% 66 96% 66 86% 66 86% 66 813% 6669% 6668% 66 88% 66 88% 66161% 66 96% 66 88% 66 Le% 66 86% 65 86% 65 66% 66 MX 66 63% 66 88% E6 88% 66153% 66136% 136 63% 66 63% 65 63% 66 aex 66 63% 66 86% - 66153% 66 86% 66 66%
1601 1611 c 1621 1521 Terminal
2029 2030 2031 Vane 54 24 54 46 54 70 $127 92 52 44 02 57 92 71 983 46 53 25 53 42 53 60 9107 40 $2 55 92 68 52 82 388 88 32 73 52 619 53 02 99258 $6 22 $6 54 as as 3203 93 92 28 52 40 $2 53 997 58 54 51 54 75 55 00 5165 65 13 91 54 11 54 33 9126 94 51 97 62 08 92 18 564 06 $226 52 38 92 50 571 09 54 90 65 16 55 43 916261 $2 36 $2 48 52 61 $73 16 52 85 53 00 53 16 59257 $4 95 55 21 55 49 9155 28 $ 63 38 ., 63 56 53 75 913394 5203 53 05 53 21 590 50
PUC Docket No. 46449 EXHIBIT RBH-2
Page.6 of 20
3 Compeny 4 ALLETE Inc 5 Alban Energy Corporation 6 Amara Coratation 7 Arra CorPonton 8 CMS Energy Corporation 9 DTE Energy Company
• 10 El Paso ESctro Company 11 IDACORP, Inc 12 Northwestern Corporator 13 OGE Energy Corp 14 Otter Tad Carport= 15 Parade War Cap% Corperaticr 16 PNM Resources. Inc 17 Portland General Beano Company 18 SCANA Unmet= 19 Wisconsin Energy Corpora= 20 Xcel Enemy Inc 21 22 23 24 Protected Armail 25 Erners per Share
tt
itS
aU
CN
; iWES
ki`A
8G3U
NBi
Colman' ALLEM. Inc Mont Energy Corporation Ameren Corporgon Aosta Corpora CMS Energy Corporator) DTE Energy Company El Paso Electric Corrals IDACORP. Inc NorthWestem Caporal«) OGE Energy Corp Otter Tail Corporation Pinnacle West Capdal Corpoaticr PNM Resources. Inc Portland Genesi Electa Conpeny SCANA Corporation Wsonnen Energy Corporation Xcel Energy In
43 Protected Ansel 44 Deradend Paycut
.22
28
0@
gR
EA
T4O
T.gtS
t&&
Cavan), ALLETE, Inc Allan Energy Corporation Amgen Corporation Awsta Capon«) CMS Energy Conomon DTE Energy Company B Paso Electric Compeny IDACORP Inc NothWestem Corporation OGE Energy Corp Otter Tgl Corporator Palacio West Celan Corporal= PNM Resources. Inc Portland General Eleoro Cornony, SCANA CorPorgon Wisconsin Energy Corporation Xcel Energy Inc
62 Protected Annual 63 Cash Flows
L"f4
M.i. ':
18838
Ifii
T CnrePen ALLETE, Inc Aral Energy Corporator A111.3.11 Conon= Aviga CoPorgon CMS Energy Caperation DTE Energy Company El Paso Electa Company IDACORP. Inc NorthWestern Corporation OGE Energy Carp Otter Tail Corporation Pinnacle West Candi Capone«) PNM Resources, Inc Poland General Beers Conn.)). SCANA Corporion Wsconsr Energy Corpora= Xcel Energy Inc
Mulh-Stage Growth Osmond Cash Flow Modal 90 Day Average Stock Price
Low EPS Growth Rate Estrange 41 First Stage
11) 121 131 141 151 161 171 181 191 1101 1111 1121 1131 Stock EPS Growth Rale Estranges Lorg-Term Peyout Ratio heroine Solution Terrnmel Terminal
Value P/E PEG Ticker Proe Zacks Fint Call Lone Low Growth Growth 2016 2020 2026 Proof IRR Rano Ratio ALE 961 27 5 50% 5 CO% 4 CO% 4 CO% 5 27% 66 00% 65 CO% 65 MI% so or 9 14% 18 22 3 45 LNT $38 96 6 10% 6 CO% 6 00% 6 00% 5 27% 62 00% 61 CPS 66 86% ISO 01) 8 69% 20 61 3 91 AEE 550 76 6 10% 5 20% 6 00% 5 20% 5 27% 65 00% 63 00% 66 86% 00 on 8 81% 19 93 3 78 AVA 54224 5 30% 5 00% 5 CO% 5 00% 5 27% 67 CO% 65 00% 65 88% 160 or) 8 62% 21 07 3 99 CMS 943 38 6 W% 7 27% 6 00% 6 CO% 5 27% 64 00% 62 CO% 66 Le% ($000 8 72% 20 44 3 87 DTE 995 20 5 80% 5 51% 6 00% 5 51% 5 27% 62 OD% CO 00% 66 88% 110 01) a 83% 19 79 3 75 EE 546 22 4 40% 7 00% 2 acoac 250% 5 27% 63 00% 59 CO% 66 86% nk 01) 8 00% 25 79 4 69 IDA $77 91 4 CO% 4 00% 3 00% 3 00% 5 27% 53 CO% 60 00% 66 88% (600.0 r 8 45% 22 18 4 20
NWE 559 41 5 CO% 5 CO% 6 50% 5 00% 5 27% 63 CO% 59 CO% 66 Le% (so oh 8 87% 19 61 3 72 OGE $31 43 5 20% 4 30% 3 00% 3 CO% 5 27% 66 00% 74 OM 66 88% tio om 8 86% 19 61 3 72 crn-R 534 02 NA 6 00% 6 00% 6 00% 5 27% 82 00% 64 00% 66 88% (g Orr 8 98% 19 02 3 63 PNW 577 37 4 30% 3 95% 4 CO% 3 95% 5 27% 63 CO% 64 00% 66 88% (so 51) 8 79% 20 04 3 CO PNIM 933 36 6 73% SO% 9 CO% 5 SO% 5 27% 51 00% 65 CO% 66 86% go oh 9 03% 18 74 3 55 POR 942 94 6 00% 5 90% 5 50% 5 50% 5 27% 59 03% 58 CO% 66 86% rso 01) 8665. 19 62 3 72 SCG 972 51 5 50% 6 00% 4 50% 4 50% 5 27% 58 00% 59 00% 66 88% 30 on 9 CO% 18 92 3 59 WEC $6204 6 2014 6 7214 6 00% 6 00% 5 27% 67 CO% 67 00% 66 88% (so on 8 29% 23 35 4 43 XEL 942 49 5 48% 5 34% 5 50% 5 34% 5 27% 62 CO% 62 CO% 66 86% so on 9 01% 18 84 3 57
Men 8 76% Max 9 14% Min 8 00%
1141 1151 1161 1171 pm 1191 1201 1211 1221 1231 1241 1251 563 1271
Ticker 2015 2016 2017 2018 2019 2023 2021 2022 2023 2024 2025 2026 2027 2028 ALE 53 38 53 52 53 66 53 eo 53 95 94 11 64 29 94 48 54 66 64 91 $5 16 55 43 55 72 $6 02 LNT 51 69 51 79 51 90 52 01 52 13 52 26 52 39 52 53 52 68 52 62 52 96 33 13 53 30 53 47 AEE 52 38 92 50 52 63 52 77 $2 92 53 07 53 23 $3 40 53 57 53 76 $3 96 54 17 54 39 54 62 AVA 51.89 51 98 we 92 19 92 30 92 41 92 53 92 66 52 93 52 94 93 10 53 26 53 43 53 62 CMS 51139 52 CO 52 12 $2 25 52 39 92 53 12 68 32 83 52 99 63 16 53 33 33 50 53 69 53 88 DTE 94 45 34 70 64 95 55 23 95 51 $5 82 56 14 56 47 $6 82 97 18 67 57 97 97 $8 39 58 63 EE 9203 92 06 62 13 92 19 32 24 52 33 92 36 92 45 92 54 52 65 92 78 62 93 53 08 53 24 IDA 93 87 53 99 54 11 64 23 94 36 54 49 54 64 54 81 55 01 $5 24 55 49 55 78 $6 09 56 41
SANE 52 93 $3 05 5325 93 36 53 52 53 70 53139 $4 09 54 30 54 52 54 75 95 01 55 27 65 55 OGE 51 631 51 74 91 79 51 85 51 93 51 96 5202, 92 10 92 19 $2 29 92 40 62 53 92 66 62 80 OTTR 91 56 51 65 51 75 91 86 91 97 52 09 92 21 12 34 92 47 92 61 62 75 12139 93 04 63 20 POW 63 92 64 07 94 24 54 40 94 56 54 76 54 96 $5 17 $5 41 95 67 $5 96 96 28 56 61 56 95 PNM 91 64 51 74 91 84 91 95 52 06 92 18 52 31 92 44 $2 58 92 72 52 87 $3 02 53 18 53 34 POR 32 04 $2 15 52 27 $2 40 62 53 92 67 52 81 62 96 $3 12 53 29 93 47 $3 65 53 84 $4 04 SCG 53 81 53 98 $4 16 54 35 $4 54 54 75 54 97 55 20 56 46 55 73 66 03 56 35 56 65 97 03 WEC 6234 92 48 $2 63 92 79 92 95 $3 13 93 32 $3 51 53 70 53 91 14 12 54 34 54 57 54 81 XEL 92 10 52 21 52 33 52 45 52 55 $2 72 $2 87 53 02 53 18 $3 35 $3 53 63 71 93 91 $4 12
1311 1321 1331 1341 1351 [361 1371 1381 1391 1401 1411 1421 1431
Toker 2016 2017 2018 2019 2020 2021 2022 2023 2024 2025 2026 2027 2028 ALE 66 00% 65 75% 65 50% 65 25% 65 OA 65 31% 65 63% 65 94% 66 26% 66 57% 66 88% 66 86% ), 66 86% LNT I 62 00% 61 75% 61 50% 61 25% 61 03% 61 98% 62 96% 63 94% 64 92% 66 SO% 66 88% 66138% 65 66% AEE 66 96% 65 25% 64 50% 63 75% 63 00% 63 65% 64 2914 64 94% 65 5914 66 24% 66 63% 66 SS% 66 66% AVA 67 00% 66 50% 66 00% 65 50% 65 00% 65 31% 65 63% 65 94% 66 26% 66 57% 66 88% 66 88% 66 86% CMS 64 00% 63 50% 63 OD% 62 50% 62 CO% 62 81% 63 63% 64 44% 65 26% 66 07% 65 88% 66 88% 66 1,3% DTE 62 CO% 61 50% 61 00% 60 50% 60 00% 61 15% 62 29% 63 44% 64 59% 66 74% 66 613% 66 63% 66 86% EE 63 CO% 62 CO% 61 CO% 60 00% 59 CO% 60 31% 61 63% 62 94% 64 26% 65 57% 65 63% 66 MI% 66 68% IDA 53 UM 54 75% 56 50% 58 25% 60 00% 61 15% 62 29% 63 44% 64 59% 65 74% 66 66% 66 Le% 66 88%
OGEE • 63 03% 62 03% 61 00% 63 00% 59 CO% 60 31% 61 63% 62 94% 6426% 6557% 6668% 13688% 66MI%
66 CO% 60 00% 70 00% 72 CO% 74 03% • 72 81% 71 63% 70 44% 69 26% 68 07% 66 166% 66 86% 66 93% OTTR 62 00% 77 50% 73 CO% 68 50% 64 00% 64 48% 64 96% 66 44% 66 92% 66 40% 66 6.3% 66 86% 66 66% PNW 63 CO% 63 25% 63 50% 63 75% 64 00% 64 48% 64 96% 65 44% 65 92% 66 40% 6686% 66 88% 66 813% PNM 51 00% 52 00% 53 00% 54 CO% 55 CO% 56 98% 58 96% I% 9414 62 92% 64 9014 6588% 66 813% 66 88% POR 59 00% 58 75% 58 50% 58 25% 58 03% 59 WS% 60 96% 62 44% 63 92% 65 40% 66 86% 66 88% 66 88% SCG 58 CO% 58 25% 58 50% 58 75% 59 CO% 03 31% 61 63% 62 94% 64 26% 65 57% 65 816% 66 66% 66 80% WEC 67 00% 67 03% 67 CO% 67 CO% 67 03% 66 98% 66 95% 66 94% 66 92% 66 90% 66 86% 66 88% 66 88% XEL E2 00% 62 00% 62 CO% 62 00% 62 CO% E2 81% 63 63% 64 44% 65 26% 66 07% 66 86% 65 88% 66 88%
1471 1481 1491 1501 1511 1521 1531 1541 1551 1561 1571 I56] PI
TIcker 2015 2017 2018 2019 2020 2021 2022 2023 2024 2025 2026 2027 2028 ALE 52 32 52 40 52 49 92 58 32 67 $2 80 52 94 53 09 $3 25 53 43 53 63 53 82 54 03 INT 51 11 51 17 $1 24 $1 31 $1 38 91 45 31 59 $1 71 51 83 51 96 $2 09 92 21 52 32 AEE $1 65 91 72 91 n 51 86 51 93 52 05 $2 18 92 32 32 47 $2 62 12 79 $2 93 93 09 AVA 91 33 91 39 91 IA 31 50 51 57 51 65 91 75 91 85 51 95 $2 C6 12 18 $2 33 92 42 CMS $1 28 51 35 $1 42 $1 49 $1 57 $1 65 51 60 51 93 $2 58 52 20 52 34 52 47 52 60 DTE 52 91 $3 05 53 19 53 34 '53 49 63 75 $4 03 54 33 $4 64 $4 97 $5 33 55 61 55 90 EE 91 31 51 32 31 33 91 34 11 36 51 43 91 51 61 60 91 70 91 82 51 96 $2 06 92 17 IDA $2 11 32 25 52 39 92 54 92 69 $2 84 53 00 53 18 53 38 53 61 53 87 54 07 64 29
MNE $1 92 91 Se 52 05 $2 11 32 18 92 34 92 52 62 70 92 90 93 12 53 35 53 52 53 71 OGE 51 15 51 22 $129 $1 37 51 45 $1 47 31 51 $1 54 $1 58 31 63 $1 69 51 78 51 87 OTTR 61 35 $1 36 51 36 $1 35 51 34 51 43 $1 52 $1 62 91 72 91 62 51 93 $2 04 $2 14 PIJW 92 57 62 68 62 60 32 92 53 C6 53 20 53 % 53 54 53 74 53 % 54 20 54 42 94 65 PNM 50 89 50 96 $1 02 $1 11 $1 20 51 32 51 44 $1 57 $1 71 51 M $2 02 52 12 52 24 POR 91 27 $1 33 $1 40 51 47 91 55 $1 67 $1 al So as 52 10 52 27 32 44 52 57 52 70 SCG $2 31 $2 42 52 54 $2 67 52 82 53 00 53 21 $3 44 $3 68 $3 95 94 24 54 47 $4 70 WEC XEL
5 .z 3
11 3
66 7
91 76 $1 44
61 87 51 52
91 96 $1 60
52 10 51 69
$2 22 91 ea
52 35 al 92
62 45 $2 05
52 62 52 19
52 76 52 33
12 90 52 48
$3 C6 52 61
$3 21 52 75
81 Protected kraal Data 82 Investor Cash Flaws
83 Company 84 ALLETE, Inc 86 Mart Energy Corporation 66 Arneren Carrel= 87 Aosta Corporator M CMS Energy Corpor.8., 89 DTE Energy Company 90 El Paso Electric Company 91 1DACORP, Inc 92 NorthWestern Corporates) 93 OGE Energy Ccn 94 Otter Tad CorPog= 95 Pinnacle West Cartel Corporahon 96 PNM Resources, Inc 97 Portion General Electric Company Se SCANA Cognation 99 Wisconsin Energy Corporation 100 Xcel Energy Inc
1641 1651 1661 1671 16131 1691 [701 1711 1721 [73] 1741 1751 1761 1771 [781 [791 1001 1811
Ticker Oallow SiNNAWI 1251/16 613717 613118 6/3119 6/30/20 6/33/21 6/30/22 6/3053 6/30/24 6/33/25 6/30/26 6/30/27 6/3528 650/29 6/30/30 6/30/31 ALE (561 27) 50 CO SO 50 02 37 52 49 $2 58 52 67 62 80 52 94 53 09 53 25 53 43 $3 63 63 82 54 03 54 24 54 46 $132 62
LIIT (933 97) 60 CO 50 24 51 14 61 24 $1 31 91 33 51 46 51 59 $1 71 51 83 $1 96 92 09 52 21 $2 32 $2 44 $2 57 536 17
AEE (950 76) $0 00 SO 35 61 70 51 79 51 66 91 93 $2 05 92 18 52 32 $2 47 $2 62 52 79 $2 93 53 09 53 25 $3 42 6111 CO AVA (94224) 50 00 50 28 al as al 44 91 50 $1 67 51 65 51 75 91 85 51 95 92 06 $2 18 32 30 $2 42 92 55 52 68 591 70
CMS (543 39) W 00 50 27 51 32 51 42 $1 49 51 57 $1 68 91 80 51 93 $2 06 52 20 62 34 92 47 52 60 52 73 $2 88 555 61
DTE (595 22) 50 00 SO 62 92 99 53 19 $3 34 $3 49 53 75 54 03 $4 33 54 64 94 97 $5 33 55 61 55 90 $6 22 56 54 9210 69 EE (546 221) 50 CO $O 26 51 33 51 33 61 34 31 36 $1 43 SI 51 $1 60 91 70 31 82 51 96 52 06 62 17 32 28 52 40 9196 11 IDA (977 92) 50 (0 50 45 52 14 $2 39 $2 54 62 69 $2 84 63 (XI $3 18 $3 38 53 61 53 87 54 07 54 29 $4 51 64 75 6170 90
NWE (959 41) 50 CO SO 41 91 97 92 05 $2 11 52 18 52 34 92 52 52 70 5203 53 12 53 35 53 52 93 71 53 91 $4 11 5131 27 OGE ($31 43) 50 OD 25 51 17 $1 29 $1 37 61 45 $1 47 $1 51 $1 54 $1 58 51 63 51 69 51 78 51 87 51 97 52 CS 566 25
OTTR (534 02) SO 03 50 29 $1 40 51 36 51 35 91 34 31 43 $1 52 91 62 51 72 91 82 SI 93 32 04 52 14 62 26 92 33 573 59
PlIW (577 38) SO CO 50 55 62 62 32 03 52 92 53 05 53 20 93 36 $3 54 53 74 $3 96 $4 20 54 42 14 65 94 90 65 16 9168 D4
PNM (633 36) SO 00 SO 19 50 91 91 03 91 11 51 20 $1 32 91 44 51 57 51 71 51 66 52 02 $2 12 52 24 52 36 52 48 575 76
POR (642 95) 50 CO $0 27 51 30 $1 40 61 47 51 55 $1 67 51 81 51 95 62 10 52 27 92 44 52 57 52 70 52 85 53 CO 595 72
SCG ($7253) 50 00 50 49 32 36 $2 54 52 67 52 92 93 OD 33 21 53 44 63 68 53 95 54 24 54 47 54 70 34 95 55 21 5160 76
WEC (96205) SO 00 $0 36 91 71 $1 87 51 98 52 10 62 22 92 35 52 48 52 62 92 76 32 90 53 05 53 21 53 36 $3 56 6134 69 XEL (542 50) 50 CO SO 29 51 41 51 52 51 60 $1 69 $1 60 51 92 52 C6 $2 19 52 33 52 48 92 61 32 75 62 90 53 05 593 71
757

PUC Docket No. 46449 EXHIBIT RBH-2
Page 7 of 20
Muth-Stage Growth Discounted Cash Flow Model 1160 Goy Average Stock Pnce
Une Average EPS Gruorth Rate Estimate in Fest Stage
Inputs 2
121 131 MI 151 161 171 181 191 101 1111 1121 1131 EPS Growth Rate Estimates Long-Terrn Poraot Ratio fteraeve Solution Muncie Termer]
Value P/E PEG 3 Company Ticker Prce Zacke Fest Call Line Average Growth 2016 2020 2026 Proof IRR Ratio Rao 4 ALLETE, Inc ALE 558 42 5 50% 5 CO% 4 00% 4 83% 5 27% 66 03% 65 00% 66 ea% (so oh 9 56% 16 43 3 11 5 %Writ Energy Corporation LW' 537 32 6 10% 6 60% 6 03% 6 23% 5 27% 62 CO% 61 00% 66 66% 60 ch 8 90% 19 44 3 69 6 Ameren Corpora.. AEE 549 34 6 10% 5 20% 6 CO% 5 77% 5 27% 66 OD% 63 OM es ealc (so or 9 05% 16 66 3 54 7 Aidsta Corporaton AVA 640 91 5 30% 5 03% 5 CO% 5 10% 5 27% 67 CC% 65 CO% 66 813% 60 01) 8 75% 20 27 3 84 8 CMS Energy Caporataa CMS $4213 6 60% 7 27% 6 00% 6 62% 5 27% 64 CO% 52 03% 66165% 9001) 8 97% 19 07 3 61 9 DTE Energy Company DTE $91 72 5 80% 5 51% 6 00% 5 77% 5 27% 62 00% 60 CO% 66 Ca% (scuth 9 03% 18 75 3 55
10 El Paso Electric Company EE $44 96 40% 7 00% 2 50% 4 63% 5 27% 63 00% 59 00% 66 68% ce301) 8 52% 21 72 4 12 11 IDACORP, Inc IDA $75 24 4 CO% 4 00% 3 00% 3 67% 5 27% 53 00% 60 00% 66 68% 60 00 71tt 20 48 3 88 12 NorthWeaem Corporator NWE $59 18 5 00% 5 CIO% 6 50% 5 50% 5 27% 613 00% 59 00% 66 ea% (so 01) 9 00% 18 91 3 59 13 OGE Energy Corp OGE $29 86 5 20% 4 30% 3 CO% 4 17% 5 27% 66130% 74 00% 66 66% (63 001 9 37% 17 19 3 26 14 Otter Teti Corpora., OTTR 531 33 NA 6130% 6 CO% 6 00% 5 27% 82 00% 64 00% 66 468% oto 9 30% 17 48 3 31 15 Pinnacle West Capital CorPmetan PNW 574 66 4 30% 3 95% 4 CO% 4 CO% 5 27% 63 00% 61 CO% 66 63% ($501) 8 95% 19 16 3 63 16 PNM Resources Inc PNM $32 96 6 70% 5 90% 900% 7 20% 5 27% 51 00% 55 00% 65 88% (so 00) 9 40% 17 C6 3 21 17 Potland General Electno Company POR 541 27 6 00% 5 90% 5 50% 5 80% 5 27% 59 CD% 58 CO% 66 66% (so of ) 9 08% 18 50 3 51 18 SCANA Corloratan SCG 670 23 5 50% 6 03% 4 50% 5 33% 5 27% 58 00% 59 00% 66 88% (so oh 9 33% 17 35 3 29 19 Weacnon Energy Corporation WEC $65 1 6 20% 6 72% 6 03% 6 31% 5 27% 67 CO% 67 00% 6655% oc oh 8 45% 22 19 4 21 20 Xc/.Energotrn XEL 541 48 5 40% 5 34% 5 50% 5 41% 5 27% 62 00% 62 CO% 66 68% (so oh 9 12% 18 31 3 47
tt
tSittn
tWi`
i8IN
Bi
21 Mean 9 03% 22 Mar 9 56% 23 Min 8 45% 24 Promoted Annul 25 Earnirate per Share
1141 1151 1161 [171 [151 191 201 1211 I29 1231 241 1251
Company Ticker 2015 2016 2017 zyla 2019 2020 2021 2022 2023 2024 2025 2026 ALLETE, Inc ALE i 33 38 $3 54 $3 71 83 89 $44 05 $4 28 54 49 $4 71 54 96 65 21 $5 48 55 77 Allard Energy Corporahon LNT 1 $1 69 1 51 80 61 91 $2 03 52 15 $2229 $2 13 62 57 52 72 $2 87 $3 02 53 18 Arneren Corporator ' AEE $2.36 52 52 $2 65 $2 82 52 96 $3 15 $3 33 63 52 53 71 33 91 64 12 64 34 Avesta Corporation AVA 01 69 $1 99 $2 09 32 19 62 31 $2 42 $22 55 62 68 62 82 $2 97 $3 12 $3 23 CMS Energy Corporaton CMS 51 89 1 52 02 62 15 $2 29 $2 44 52 60 52 77 62 91 $3 12 53 30 $3 46 $3 65 DTE Energy Company DTE $4 45 $44 71 64 98 $5 27 65 57 55 89 06 23 $6 57 06 94 57 32 P 71 $8 11 El Paso Electra Company EE 12.03 i $2 12 32 22 52 33 52 43 52 55 62 67 62 60 52 93 $3 08 63 24 63 41 IDACORP, Inc IDA 63 67 I 64 01 $44 16 64 31 $4 47 $4163 14 82 15 02 $5 24 $55 49 55 77 56 07 Northwestern Corporation kINIE 32 90 $3136 $3 23 $3 41 63 59 $3 79 SI 00 64 21 54 44 $44 65 51 93 65 19 OGE Energy Corp OGE 61 69 $1 76 51 83 $1 91 $1 99 52 07 $2 16 $2 26 52 37 52 48 62 61 62 75 Otter Tell Corloretan OTTR 31 56 51 65 51 75 61 85 61 97 62 09 52 21 62 34 $2 47 $2 61 62 75 52 59 Poirecle West Captal CorPorMca PNW $3 92 $4 C6 $4 25 6412 64 60 54 79 $4 99 65 22 55 46 65 73 96 02 06 34 PNM Resources, Inc PNM 1, 31 64 61 76 $1 88 52 02 $2 17 $2 32 62 46 52 64 $2 81 52 98 53 11 53 31 Portland General Electnc Company POR 1 02 04 , 62 16 62 28 52 42 92 56 52 70 $2 86 $3 CC $3 19 63 36 53 54 $3 73 SCANA Corporation SCG ' 63 81 $4 01 $4 23 $1 45 24 69 61 94 , SS 20 $5 Id $5 77 $s ce 56 40 56 73 Wleconain Energy Coporahon WEC 52 34 i $2 49 62 64 62 81 $2 99 $3 18 $3 37 53 57 63 78 63 93 $4 21 $4 43 Xcel Energy Inc XEL 32 10 ( $2 21 62 33 52 46 62 59 52 73 $2 /56 63 04 $3 20 $3 37 53 55 $3 73
1261 1271 PM 1291 IV
2027 2028 2023 2033 2031 $6 07 56 39 56 73 57 061 $7 45 53 35 $3 53 $3 72 $3 91 5412 64 57 64 61 65 C6 65 33 $5 61 53 46 53 64 $3 83 64 04 $4 25 $3 85 $4 06 $4 27 64 50 51 73 PI 54 58 99 59 17 39 97 610 49 P 59 $3 78 63 Se 64 19 64 41 56 39 06 73 57 06 $7 46 $7 55 $5 46 $5 75 66 05 $6 37 P 71 52 69 53 05 $3 21 53 36 63 55 $3 04 $3 20 $3 37 $3 55 $3 74 56 67 37 02 67 39 57 78 68 19 $3 45 53 67 $3 215 64 C6 94 28 $3 92 54 13 64 35 64 58 $4 82 57 09 57 46 $7 86 $8 27 56 71 51 67 51 91 35 17 55 44 55 73 53 93 $1 14 $4 36 $4 59 $4183
T.841
'6,4V
.:.'8
53
F£
4?£i3
T
13 Protected Arras' 44 Drddend Payout Ratio 131.1 1321 133) 341 13 [361 1371 IN 1391 1401 1411 421 1431 1441 [45] J461
45 Company Ticker 2016 2017 2018 2019 2020 2021 2022 2023 2024 2025 2026 2027 2028 2029 2030 2031 16 ALLETE, Ire ALE 66 CO% 65 75% 65 50% 65 25% 65 03% 65 31% 65 63% 65 94% 66 26% 66 57% 66 ID% 47 Mont Energy Corporation PIT 62 CO% 61 75% 61 50% 61 25% 61 CO% , 61 98% 62 96% 63 94% 64 92% 65 90% 65 88% 48 Ameren Corporation AEE 56 CO% 65 25% 64 53% 63 75% 63 00% 63 65% 64 29% 64 94% 65 59% 66 24% 66 ft% 49 Mots Caporahon AVA 67 00% 66 50% 66 CO% 65 sox e5 ow% 65 31% 136 63% 65 94% 66 26% 66 57% 66 88% 50 CMS Energy Caporal on CMS 64 00% 63 50% 63 00% 62 50% 62 CO% 62 81% 63 63% 64 14% 65 X% 66 07% 66 86% 51 DTE Energy ComPmy DTE 62 CO% 61 50% 61 00% 60 50% 60 03% 61 15% 62 23% 63 44% 64 59% 65 74% 66166% 52 El Paso Eleanc Company EE 63 CO% 62 CO% 61 00% 60 00% 59 00% 60 31% 61 63% 92 94% 64 26% 65 57% 66 8616 53 IDACORP, Inc IDA 53 00% 54 75% 56 50% 58 25% 60 OD% 61 15% 62 29% 63 44% 64 59% 65 74% 66 86% 54 NorthWestern Corporation NWE 63 00% 62 CO% 61 CO% 60 CCM 59 00% 60 31% 61 63% 62 94% 64 26% 65 57% 66 88% 55 OGE Energy Corp OGE 66 00% 68 00% 70 00% 72 CD% 74 00% 72 81% 71 63% 70 41% 69 26% 68 07% 66 88% 56 Otter Tail Corporation OTTR 02 CO% 77 50% 73 00% 66 50% 64 CO% 64 46% 64 96% 65 44% 65 92% 66 40% 66 86% 57 Panacle West Capital Corporation PNW 63 00% 63 25% 63 50% 63 75% 64 00% 64 48% U 96% 66 44% 65 92% 66 40% 66 86% 58 PNM Resources, Inc PNM 51 CO% 52 CO% 53 OD% 54 00% 55 OD% 56 96% 58 96% 60 94% 62 arh 64 90% 66 86% 59 Portland Genera Electnc Company POR 59 OM 58 75% 58 50% 58 25% 56 00% 59 48% 60 56% M 41% 63 92% 65 40% 66 88% 60 SCANA Corporaton SCG 58 CO% 58 25% 56 50% 58 75% 59 CO% 60 31% 61 63% 62 94% 64 26% 65 57% 66 88% 61 Waconso Energy Corporation WEC 67 CO% 67 CO% 67130% 67 00% 67 00% 66 96% 65 96% 65 94% 66 92% 66 90% 66 88% 62 Xcel Energy Inc XEL 92 CO% 62 00% 62 00% 62 00% 62 00% 62 81% 613 63% 64 44% 65 26% 65 07% 66 66%
471 1481 149 [501 1511 [521 [531 154] 1551 1561 157]
Company Ticker 2015 2017 2018 2019 2020 2021 2022 2023 2024 2029 2026 ALLETE, Inc ALE 1 62 34 62 44 62 55 82 66 $2 76 $2 93 53 09 53 27 53 45 53 65 $3 86 Marl Energy Caporal= LNT 51 11 61 18 51 25 51 32 51 39 51 50 01 62 $1 74 $1 86 51 99 62 13 Ameren Capotaton AEE $1 66 51 74 $1 62 $1 SO 61 96 $2 12 62 26 52 11 52 57 $2 73 52 SO Amato Corporatan AVA $1 33 61 39 51 45 51 51 $1 58 51 66 $1 76 51 65 01 96 $2 Ca 62 20 CMS Energy Corporaton CMS $1 29 $1 36 $1 44 51 53 51 61 61 74 51 87 $2 01 $2 15 $2 30 52 45 DTE Energy Company DTE 62 92 53 06 53 21 $3 37 $3 53 $3 81 64 10 $1 40 54 72 65 07 $5 43 El Paso Electra Company EE 31 34 $1 38 $1 42 51 46 $1 50 51 61 51 72 $1 65 $1 96 62 13 52 25 IDACORP, Inc IDA $2 13 62 28 52 44 62 60 $2 78 $2 94 53 13 53 33 63 55 13 79 64 06 Northwestern Corporation MNE I $1 93 $2 00 62 08 62 16 $2 24 $22 41 52 60 52 60 $3 01 $3 23 53 47 OGE Energy Corp OGE Otter Tal Corporation OTTR
1 $1 16 $1 25 $1 34 $1 43 $1 53 51 57 51 62 61 67 $1 72 $1 78 61 64
51 36 51 35 51 36 $1 35 61 34 51 43 $1 52 $1 62 61 72 51 82 $1 93 Palmate West Camtal Corporation PNW I
. $2 57 62 63 $2 81 62 93 53 06 53 22 53 39 53 57 $3 78 $4 00 54 24
PNM Resources, Inc PNM f $OO SO 60 96 51 07 51 17 51 28 61 41 $1 56 $1 71 61 87 62 04 $32 21 Portlend Genera Electnc ComPoW POR 1 $1 22 $1 34 $1 41 $1 49 $1 57 61 70 61 84 61 99 $2 15 $2 32 62 49 SCANA Corporaon SCG Wscown Energy Corporaton WEC
I $2 33 52 16 62 60 $2 76 62 91 $3 14 $3 38 63 63 53 90 54 19 $4 50
61 67 51 77 $1 fla 52 00 52 13 02 26 62 33 $2 53 52 67 52 82 $2,96 Xcel Energy Inc XEL ' 61 37 $1 45 61 53 $1 61 $1 69 $1 81 51 93 62 06 $2 20 62 34 $2 50
61 Protected Annul Data 62 Investor Cash Faws
[641 1651 1661 1671 f551 1691 1701 [711 [721 [73[ 1741 [751 1761 1771 1791 11101 (51) WOW
83 Conlony Ticker Outflow 10/11/16 12/31/16 6/6317 620/16 6/3219 6/30/20 6/3321 6/3322 6/30/23 62024 6r63/25 6/30/26 6/30/27 6/33/26 6783/29 6/30/30 6/30/31 64 ALLETE, Inc ALE ($56 43) SO 00 $0 50 62 40 52 55 .32 65 52 78 $2 93 63 09 53 27 53 15 53 65 53 66 64 C6 64 27 94 50 $41 74 6127 46 85 Alert Energy Corporation LOT (637 32) 60 00 50 24 $1 15 $1 25 61 32 $1 63 51 50 51 62 61 74 $1 86 51 99 $2 13 52 24 $2 35 $2 48 $2 62 $82 80 86 Amman Coloration AEE ($49 34) $0 00 50 36 61 71 $1 82 51 93 01 98 $2 12 $2 26 62 41 62 57 $2 73 62 90 63 05 $3 22 63 39 63 56 5185 46 87 Aida. Cormraton AVA (SP 92) 60 CO 60 28 $1 36 31 45 $1 51 $1 55 61 66 51 76 $1 65 61 96 52 06 52 20 52 31 62 41 62 56 $2 70 PS 94 86 CMS Energy Caporaton CMS ($42 14) $0 00 SO 28 61 33 31 41 31 53 51 61 $1 74 $1 87 52 01 62 15 52 30 $2 45 $2 58 $2 71 $2 86 $3 01 593 41 89 DTE Energy ConoNcy DTE (691 73) SO 00 00 62 $3 03 53 21 $3 37 $3 53 $3 el $44 10 64 40 64 72 55 07 $5 43 65 71 $6 01 $6 33 $6 67 5203 70 93 El Paso Electra Company EE (544 96) SO CO SO 29 $1 37 61 42 $1 46 $1 50 $1 61 51 72 51 85 $1 98 62 13 $2 28 S2 40 52 53 $2 66 52 80 698 83 91 IDACORP, Inc IDA ($75 25) $0 OD $0 45 $2 17 $2 44 $2 60 52 78 52 94 $3 13 53 33 53 55 53 79 64 06 51 27 64 50 $4 74 $4 99 6166 CO 92 NcathWestem Corporation NWE (559 19) SO CO 00 41 51 98 $2 05 $2 16 02 24 $2 41 52 60 52 80 53 01 $3 23 $3 47 23 65 53 65 $4 C6 $4 26 5131 33 93 OGE Energy Corp OGE ($23 66) SO 00 $0 25 61 19 61 34 61 43 61 53 61 57 $1 62 $1 67 31 72 51 78 $1 84 $1 93 $2 04 $2 14 52 26 663 44 94 Otter Tail Capcoahoi OTTR (531 33) 60 00 60 29 61 40 $1 36 $1 35 61 34 $1 43 51 52 51 CD $1 72 $1 52 51 93 $2 04 $2 14 62 26 62 36 $67 85 95 Pcnacle West Copia Corporation PNW ($74 67) 00 00 $0 55 62 62 $2 81 62 93 53 05 53 22 $3 63 $3 57 63 78 54 00 $4 24 64 46 64 70 54 94 55 21 $162 42 96 PNM Resources, Inc PNM ($3297) 50 CO $0 19 50 93 61 07 61 17 51 26 61 41 61 56 $1 71 61 87 52 04 62 21 $2 33 62 45 $2 58 $2 72 $75 84 97 Poland Genera Electra Company POR 1541 28) $O0 00 SO 27 $1 31 $1 41 $1 49 $1 57 $1 70 61 64 51 93 $2 15 $2 32 $2 49 $2 62 62 76 62 91 53 06 $9239 98 SCANA Corporation SCG (PO 24) 50 CO 50 53 52 39 52 60 52 76 62 91 63 14 $3 36 $3 63 53 93 64 19 64 50 64 74 54 99 $5 26 $5 53 $157 03 99 Wisconsin Energy Corporaton WEC (560 19) $0 00 $0 35 61 72 $1 86 62 00 $2 13 $2 26 52 33 32 53 $2 67 $2 62 $2 96 13 12 63 23 $3 46 P 64 $130 99
100 Xcel Energy Ira XEL (641 48) SO CO 60 29 $1 41 $1 53 61 61 $1 69 51 51 61 93 $2 06 62 20 52 34 $2 50 $22 63 $2 77 $2 91 $3 07 591 59
62 Pr qeded Annual 63 Cash Flows
65 86% 66 ea% 66 88% 66 88% 66 88% 66 68% 66 63% 66 88% 66 68% 66 88% 66 86% 66 88% 66 88% 66 88% 66 M% 66 86% 66 88% 66 86% 136 616% 66 88% 66 88% 66 ea% 66 86% 66 88% 66 68% 66 66% 66 66% 86 88% 66 88% 65 68% 66 CD% 66 MI% 66 88% 66 86% 66 66% 66 66% 66 63% 66 86% 66 DM 66 88% 65 66% 66 66% 65 88% 66 66% 66 88% 66 86% 66 68% 66 68% 66 68% 66 88% 66 66% 6655% IP ea% 66 86% 66 86% 66 86% 66166% 66 88% 66 88% 66 816% 66 88% 156 88% 66 88% 66 M% 66 68% 66 68% 66176% 65 66% 66 66% 136 MI6 66 88% 66 86% 66116% 66 66% 661M% 66 86% 66 86% 66 68% 66 68% 66 68% 66 86% 66 88% 66 DEM 66 88% 66 88%
158,1 1591 1901 1611 NZ 153/ Termonel
2027 2028 2029 2030 2031 VWooe
758
51 06 54 27 54 50 $4 74 54 99 $12248 $2 24 52 36 $2 46 52 62 52 75 PO 05 $3 C6 53 22 $3 39 $3 56 $3 75 8104 70 $2 31 52 44 52 56 $2 70 52 84 $86 10 52 58 $2 71 $2 86 $3 01 $3 17 $93 21 65 71 $O6 01 56 33 56 67 $7 02 6156405 $2 40 $2 53 62 ee $2 651 $2 95 $95 87 $127 54 50 54 74 54 99 55 25 5160 78 $3 65 $3 55 5405 64 26 $4 49 $126 85 51 93 62 04 52 14 $2 26 02 38 $61 06 $2 04 52 14 52 26 62 36 52 50 565 35 64 46 64 70 64 94 $5 21 55 48 $156 94 $2 33 52 15 62 58 52 72 52 86 572 96 $2 62 $2 76 62 91 $3 06 $3 22 $85 17 $1 74 51 99 55 26 65 53 55 62 $151 20 53 12 $3 29 53 46 53 64 13 613 5127 16 $2 63 $2 77 $2 91 63 07 $3 23 Pa 36

PUC Docket No. 46449 EXHIBIT RBH-2
Page 8 of 20
Line No 1 hots 2
3 Compony 4 ALLETE Inc 5 Mont Energy Corporation 6 Mem Corporelson 7 Awsta Caseation 8 CMS Enemy Corporatson 9 DTE Energy Company
10 El Paso Electric Company 11 IDACORP, Ire 12 Northwestern Cap:sewn 13 OGE Energy Corp 14 Otter Tel Corporahon 15 Maack West Capital Corporabon 16 PNM Resources Inc 17 Portend Generel Eloctno Company 18 SCANA Caporaton 19 Wsconen Energy Corporator 20 Xcel Enema Inc 21 22 23 24 Protected Annual 25 Mimeos per Share
tt,! •.
51
8%'iS
eiS
L183
SM
N
Company ALLETE, Ire Abet Energy Corporation Arneren Corporahon Awsta Corporator CMS Energy CaPtitMoo DTE Energy Company El Paso Electric Company IDACORP, Inc Northwestern Corporator OGE Energy Corp Otter Tail Corporator Penacle Wee Copal CorPorMon PNM Resources, Inc Portland General Elea= Company SCANA Corporabon Wearer, Energy Corporator Xcel Energy).
43 Preacted Annual 44 Deslend Payout Relio
45 Company 46 ALLETE, Inc 47 Med Energy Corporation 46 Armen Corporetion 49 Awsta Corpora. 50 CMS Energy Cs:Toreson 51 DTE Energy Company 52 El Paso Electrc Company 53 IDACORP, Inc 54 Northwestern Corporation 55 OGE Energy Cap 56 Otter Tail Corporshon 57 Ptnnsok West Gaped Corporation 58 PNM Resources, Inc 59 Portland General Electric Compeny 60 SCANA Corporatton 61 Macaws-1 Energy Corporator 62 Xcel Energy la
62 Protected Annual 63 Cash Fbyes
64 Company 65 ALLETE Inc 66 Alma Energy Corporator 67 Mersin Corporation 68 Aveta Corporation 69 CMS Energy Corporation 70 DTE Energy ComPmy 71 El Paso Electro Compery 72 IDACORP, Inc 73 Northwestern Corporator 74 OGE Energy Cap 75 Otter Tel Corporahon 76 Pinnacle Wee Cagle Corporaten 77 PNM Resources, Inc 78 Portland General Electric Calvert>, 79 SCMJA Corporatton 80 Wisconsin Energy Comore= 81 Xcel Energy Inc
01 121 131 141
Multi-Stage Growth Drscourted Cash Flow Model 180 Day Average Stook Price ,
High EPS Growth Rate Eshrnate in First Stage
MI MI 171 MI 191 1101 011 131 1131 Stock EPS Growth Rate Estimates Lorg-Tenn Payout Raho Iterative soknon Termite Ter:nine
/5 PEG Wk.* H Tclier Prce Zeck. First Call Ltne Growth Growth 2016 2020 2026 Proof IRR Ratio Ratio ALE 658 42 5 50% 5 CO% 4 00% 5 50% 5 27% 66 0011. 65 CO% 66 88% (so or) 75% 15 73 298 LNT $37 32 6 10% 6 60% 6 00% 6 60% 5 27% 62 00% 61 CO% 66 88% (62 01) 95% 18 99 3 63 AEE $49 34 6 10% 5 20% 6 00% 6 10% 5 27% 66 00% 63 00% 66135% ao or) 13% 18 26 3 46 AVA 640 91 5 30% 5 00% 5 CO% 5 30% 5 27% 67 00% 65 00% 66 MI% 90 Oh CO% 2020 3 79 CMS $42 13 6 60% 7 27% 6 00% 7 27% 5 27% 64 CO% 132 CO% M 88% ISO Oh 12% 18 29 3 47 DTE $91 72 5 80% 5 51% 6 CO% 6 00% 5 27% 62 CO% 60 00% 65 88% so or) 09% 18 47 3 50 EE $44 96 4 40% 7 CO% 250% 7 60% 5 27% 63 00% 59 00% 6656% 90 01) 06% 18 62 3 53 IDA $75 24 4 00% 4 CO% 3 00% 4 60% 5 27% 53 03% 60 CIO% 66 88% ISO rch 79% 20 04 3 80
NWE 959 113 5 00% 5 00% 6 50% 6 50% 5 27% 63 CO% 59 00% 6616% 69 Oh M% 17 73 3 36 OGE 529 86 5 20% 4 33% 3 CO% 5 20% 5 27% 66 00% 74 00% 56 69% (so oth 65% 16 05 3 04 OTTR 331 33 NIA 6 (0% 6 OE% 6 00% 5 27% 82 00% 64 00% M 88% iso a) 30% 17 48 3 31 POW 574 66 4 30% 3 95% 4 00% 4 33% 5 27% 63 00% 64 03% 66 M% Wort 00% 18 68 3 58 PNM $32 96 6 70% 5 90% 9 00% 9 CO% 5 27% 51 00% 55 CO% 66 88% No oo) 99% 15 27 2 89 POR $41 27 6 00% 5 90% 5 50% 6 CO% 5 27% 59 00% 58 00% 65 88% (so 06 13% 18 26 3 46 SCG 570 23 5 50% 6 00% 4 50% 6 00% 5 27% 58 00% 59 DO% 66 56% NO 0.0 51% 16 64 3 15 WEC 960 18 6 20% 6 72% 6 00% 6 72% 5 27% 67 00% 67 00% 66 56% aO 01) 54% 21 60 4 09 XEL 641 48 5 40% 5 34% 5 50% 5 50% 5 27% 62 00% 62 CO% 66 M% No or) 14% 119 20 3 45
Mean 18% 444. 89% Min 54%
1141 1151 1161 071 1181 091 1201 1211 1221 1231 1241 1251. 1261 1271 1281 1291 1301
Tcker 2015 2016 2017 2018 2019 2020 2021 2022 2023 2024 2025 2029 2027 2025 2029 2033 2031 ALE 93 36 53 57 53 76 53 97 54 19 54 42 54 66 $4 91 $5 18 55 45 55 74 56 05 $6 35 66 70 67 05 57 43 97 52 LNT 51 f6 $1 80 $1 92 52 05 52 18 52 33 $2 47 $2 63 52 78 52 94 53 10 53 27 $3 44 53 62 $3 81 54 01 $4 23 AEE 32 38 52 53 52 68 $2194 53 02 $3 20 $3 39 53 59 $3 79 54 CO 54 22 54 44 54 68 54 92 55 18 05 46 55 74 AVA 9102 51 99 52 10 52 21 52 32 52 45 52 58 $2 71 52 86 53 01 $3 17 $3 33 93 51 $3 69 53 Et9 54 09 54 31 CMS 91 69 I 52 03 52 17 52 33 $2 50 52 68 $2 87 93 06 93 X $3 45 53 64 53 83 54 03 $4 25 54 47 54 71 64 95 DTE 54 45 54 72 $5 $5 30 55 62 55 96 56 31 56 67 97 04 57 43 57 83 $8 25 38 65 56 14 59 62 510 13 510 66 EE 52 03 52 17 52 32 52 49 52 66 $2195 93 04 63 23 53 43 53 63 $3 83 54 04 6425 541 47 54 71 54 96 55 22 IDA 93 87 54 02 54 19 54 35 $4 53 54 71 54 91 95 12 55 36 $5 62 35 91 56 22 $6 55 56 69 $7 25 57 64 58 04
PIWE 52 90 93 09 53 29 $3 50 53 73 93 97 54 22 54 48 54 74 95 01 55 29 $5 57 55 195 66 17 56 50 56 84 67.20 OGE • 51 69 91 78 91 87 51 97 52 07 52 18 52 29 52 41 52 54 52 67 52 81 92 96 53 12 93 28 33 45 53 63 53 M OTTR $1 56 51 65 $1 75 51 86 91 97 $2 09 52 21 62 34 92 47 52 61 92 75 52 89 93 04 $3 20 $3 37 93 55 53 74 PPM UM UM UM 5445 6464 UM UM UM UM UM UM UM mn $713 $751 um mu mm $164 9179 vm un 5231 um um um PM 9336 UM UM $395 3416 UV UM UM MR UN 9216 5229 924 UM 9273 UM UM UM UM U59 5378 UM UM UM 5464 UM MG UM UN UM 5454 UM $510 5540 UM WM UM UM VM 5743 VM UN UV UM WM UM $250 UV VM UN UN UM 5366 MM UM UM UM UM UM UM UM UM XEL UM UM 5234 $247 U60 6274 5289 UM UM PM UV UM UM UM UM UM 5486
1311 [921 133/ 1341 1351 1361 - M71 (381 1391 1401 6411 1421 1431 1441 0451 1461
Ticker 2016 2017 2018 2019 2020 2021 2022 2023 2024 2025 2026 2027 2028 2029 2030 2031 ALE 66 00% 65 75% 65 50% 66 25% 65 00% 65 31% 65 63% 65 94% 66 26% 66 57% M 35% 66 M% 65 88% 66 88% 66 88% 66 88% LNIT 62 CO% 61 75% 61 50% 61 25% 61 00% 61 98% 62 96% 63 94% 64 92% 65 93% 66 88% 66 56% 66 MI% 66 56% 66 515% 66 56% AEE 66 00% 65 25% 64 50% 63 75% 63 00% 63 65% 64 29% 64 94% 65 59% 66 24% 66 58% 66 88% 66 63% 66 68% 66 BO% 66 Le% AVA 67 CO% 69 50% 66 CP% 65 50% 65 03% 65 31% 65 63% 65 94% 66 26% 66 57% 66 86% 66195% 66198% 66 88% 66 85% 66 56% CMS 64 DO% 63 50% 63 00% 62 50% 62 00% 62 81% es s3% 64 44% 65 26% M 07% M 35% 66 88% 66 88% 66 66% 66 68% 66 68% DTE 62 00% 61 501. 61 60% M 50% 60 00% 61 15% 62 29% 64 44% 64 59% 65 74% 66 88% 66 66% 66 33% 66 88% 66 56% 66 M% EE 63 03% 62 00% 61 00% 60 00% 59 00% 60 31% 61 63% 62 94% 64 26% 65 57% 66 M% 66 68% M 66% 66 33% 66 56% 66 35% IDA 53 00% 54 75% 56 50% 55 25% 50 CO% 61 15% 62 29% 63 44% 64 59% M 74% 66 Le% 66 88% 66 88% 66 8614 66 88% 66 68%
NWE 63 60% 62 CO% 61 00% 60 60% 59 00% 63 31% 61 63% V 94% 64 26% 65 57% 56 56% 66 35% 66 /35% 66 88% 66 88% 66 88% OGE 66 00% 68 00% 70 00% 72 CO% 74 20% 72 81% 71 63% 70 44% M 26% 66 07% 66 88% 66 35% 65 88% 66 M% 66 WM 66 86% OTTR 82 00% 77 50% 73 00% 68 50% 64 00% 64 48% 64 96% M 44% 65 92% 66 40% 66 88% 66 88% 66 86% 66 68% 66 68% 66 &A PNW 63 00% 63 25% 63 50% 63 75% M CO% 64 45% 64 96% 65 44% M 92% 66 40% 02 35% 66 MI% 66 88% M 88% 66 88% 66 88% PNM 51 00% 52 CO% 53 OD% 54 00% 55 00% 56 96% 58 96% 60 94% 62 92% 64 90% 66 88% 66 56% 66 66% 66 85% 66 88% 66 88% POR 59 00% 55 75% 58 50% 58 25% 58 20% 59 48% 60 96% 62 44% 63 92% 65 40% 66 39% 66 56% 66 88% 66 86% 66 86% 66 MI% SCG 58 00% 58 25% 58 50% 55 75% 59 00% 60 31% 61 63% 62 94% 64 26% 66 57% 65 68% 66198% 66 86% 66 86% 66 88% 66 SS% WEC 1 67 03% 67 CO% 67 0914 67 00% 67 X% 65 96% 66 96% 66 94% 66 92% 66 50% 65 33% 66 68% 66 88% 66 88% 66 88% 66 88% XEL 62 00% 62 00% 62 03% 62 6.0% 62 00% 62 81% 63 63% 64 44% 65 26% 66 07% 66 68% M 66% 66 M% 66 M% 66 88% 66 88%
1471 1481 1491 1501 1511 1521 I531 1541 1561 1561 1571 1581 1591 1601 1611 M421 1631 Terminal
Tooker 2015 2017 2018 2019 20213 2021 2022 2023 2024 2025 2026 2027 2028 2029 2030 2031 Value ALE $2 35 52 47 52 60 52 73 52 87 53 04 $3 22 53 41 63 61 93 82 54 04 54 26 54 48 54 72 54 97 55 23 $123 60 INT 51 12 51 19 $1 26 $1 34 $1 42 91 53 51 65 $1 78 91 91 52 05 52 19 92 33 52 42 62 55 $2 68 $2 83 $130 23 AEE 51 67 $1 75 51 83 51 92 62 32 52 16 52 31 $2 46 52 63 62 79 $2 97 53 13 53 29 $3 47 03 65 $3 64 5104 91 AVA 51 33 $1 39 51 46 $1 52 $1 59 $1 66 51 78 91 88 51 99 $2 11 52 23 $2 35 52 47 92 60 52 74 92 88 586 19 CMS 51 30 51 38 51 47 $1 56 51 66 91 80 $1 96 $2 10 52 25 $2 40 $2 56 $2 70 52 84 52 99 53 15 53 31 $90 60 DTE $2 92 53 05 53 23 53 40 53 57 53 86 $4 15 54 47 54 80 SS 15 95 52 65 81 $6 11 $6 44 56 76 57 13 $196 96 EE 51 37 51 44 $1 52 $1 60 $1 68 51 53 51 99 $2 16 S2 33 52 51 52 70 52 84 52 99 53 15 53 32 53 49 597 21 IDA 02 13 $2 29 $2 46 92 64 $2 83 53 00 53 19 93 40 53 63 $3 88 $4 16 54 38 $4 61 54 85 55 11 95 35 5161 08
NWE
OGE 5311 9517
52 04 51 27
62 14 $1 36
52 24 $1 49
52 34 $1 61
92 55 31 67
52 76 51 73
52 99 $1 79
$3 22 51 56
$3 47 51 91
53 72 61 96
63 92 52 08
54 13 52 19
54 34 62 31
$4 57 $2 43
54 E2 62 56
$127 66 561 40
OTTR $1 36 $1 M 51 36 51 35 51 34 $1 43 51 52 • 51 62 $1 72 $1 82 51 93 $2 04 52 14 92 26 92 38 52 50 $65 35 PNW 92 58 52 70 $2 V 52 66 53 10 $3 26 53 44 $3 60 53 63 54 06 $4 36 54 53 94 77 $5 02 55 29 $5 57 $157 13 PISM SO 91 $1 01 $1 13 51 25 91 39 $1 56 $1 74 $1 92 $2 12 $2 31 $2 51 $2 64 52 78 $2 93 53 08 $3 24 674 03 POR S1 28 $1 35 51 42 61 50 51 58 S1 72 51 86 $2 02 52 18 , 52 35 52 53 52 66 92 80 52 95 53 11 $3 27 $89 28 SCG $2 34 $2 49 52 65 92 83 53 01 $3 26 $3 52 $3 80 64 CB $4 40 54 72 64 97 $5 23 $5 51 55 60 $6 11 6151 56 WEC
3611 3
677
51 79 $1 91 92 03 $2 17 52 31 $2 45 $2 60 52 75 52 90 53 05 53 21 53 38 $3 56 $3 75 93 95 5127 41 XEL 51 45 91 53 $1 61 61 70 91 82 $1 94 52 07 52 21 52 36 92 51 $2 64 62 78 92 93 53 CS 53 25 568 41
81 Promoted ftrwottnl Data 82 Investor Cash Flows 1641 [66] 1661 [67] 1661 [661 1701 1711 1721 [731 [74] 1751 1761 1771 [781 1791 1891 1811
keel 83 Company Ticker Outflow 10/14/16 12/31/16 6/3517 6/32/18 6/30/19 6/3920 6/30121 6/30/22 6/39/23 6/30/24 6/30/25 660/26 6/30/27 6/30/28 6/3069 6/30/30 643001 84 ALLETE, Inc ALE (958 43) SO 00 50 50 $2 42 52 60 52 73 52 87 53 04 $3 22 53 41 93 61 $3 82 64 04 64 26 54 48 $4 72 $4197 5128 23 85 Allied Energy CoPF4O1F0 LNIT (537 32) 50 60 $0 24 51 15 51 26 51 34 51 42 $1 53 51 65 61 78 S1 91 52 05 $2 19 $2 32 52 42 52 55 S2 68 $83 05 66 Ameren COrPOreton AEE ($49 34) 50 00 $0 36 91 72 61 83 $1 92 S2 02 52 16 $2 31 92 46 $2 63 52 M 32 97 53 13 $3 29 53 47 53 65 9105175 87 Awe. Caporator AVA (540 92) $0 00 SO MI 51 37 $1 46 51 52 $1 59 61 65 $1 78 $1 193 51 99 52 11 $2 23 $2 35 62 47 52 60 52 74 $56 07 88 CMS Energy Corporanon CMS (542 14) 50 00 50 26 $1 34 61 47 51 56 51 66 $1 80 61 65 52 10 52 25 $2 40 S2 56 92 70 52 84 52 99 63 15 593 91 56 DTE Energy Company DTE ($91 73) 2020 $O 62 53 01 $3 23 $3 40 93 57 $3 86 54 15 54 47 $4 80 $5 15 95 52 $5 81 $6 11 56 44 $6 78 6204 CB 90 El Paso Electric Company EE (544 96) 50 00 50 29 51 42 51 52 51 M $1 65 $1 153 51 99 $2 16 92 33 92 51 $2 70 52 84 92 99 53 15 53 32 5100 70 91 IDACORP, Inc IDA (575 25) SO 00 50 46 $2 18 92 46 $2 64 52 83 53 00 $3 19 53 40 53 63 53 56 54 16 64 38 54 61 54 85 55 11 5166 46 92 NorthWestem Corporation NWE ($59 19) $0 00 50 42 52 01 $2 14 62 24 $2 34 $2 56 52 76 $2 99 $3 22 53 47 $3 72 93 92 54 13 $4 34 34 57 $132 47 93 OGE Energy Cap OGE (529 86) $0 00 50 25 51 20 51 38
611 5 35 49 91 61 51 67 51 73 61 79 51 85 $1 91 51 95 52 66 $2 19 52 31 92 43 56366
94 Otter Tai) Corporator OTTR ($31 33) $O OD 50 29 51 40 51 36 51 34 91 43 51 52 51 62 51 72 51 82 51 93 $2 D4 $2 14 52 26 52 38 567 65 95 Pinnacle West Capital Corporation PNW (574 67) SO 60 $0 55 $2 63 $2 82 52 96 53 10 $3 26 $3 44 53 63 $3 53 $4 06 $4 30 54 53 $4 77 $5 02 55,29 916270 96 PNM Resources Inc PNM ($32 97) $0 00 $0 19 $0 95 51 13 $1 25 51 39 51 56 51 74 51 92 52 12 52 31 62 51 02 64 $2 76 52 93 63 06 677 27 97 Patland Gwent Electric Compeny POR (541 28) 0020 SO 27 $1 31 $1 42 61 50 $1 55 51 72 51 56 $2 02 92 18 52 35 52 53 52 M 52 dD $2 95 53 11 $9255 99 SCAPA Corporation SCG (570 24) $0 00 $O 50 52 41 52 65 62 53 53 01 53 26 53 52 53 80 54 09 94 40 54 72 54 97 55 23 55 51 $5 80 $158 00 99 Wisconen Energy Corporation • WEC (960 19) SO 00 SO 35 51 73 51 91 $2 03 $2 17 12 31 52 45 $2 60 52 75 52 90 53 05 $3 21 53 36 53 56 $3 75 5131 36
120 Mel Energy kw XEL ($41 45) SO 00 50 29 $1 41 61 53 $1 61 $1 70 $1 82 $1 94 52 07 52 21 52 35 S2 51 92 64 $2 78 52 93 53 09 391 66
759

Lax No
InPuts 2
3 Calumny 4 ALLETE, Inc 5 Went Energy Corporation 6 Menai Corpcsatan 7 Austa Caporal.. 8 CMS Energy Corporation 9 DTE Energy Company 10 El Paso Electra Company 11 IDACORP, Inc 12 NorthWestern Corporal= 13 OGE Energy Corp 14 Otter TM Corporation 15 Pinnacle Watt Captal Corporabon 16 PNM Resources, Inc 17 Portland Genera EMetno Company 18 SCANA Corporation 19 Waooran Energy Capaation 20 Xcel Energy Inc M M M 24 Protected Actual 25 Earnings per Share
tir,“
tdtilfg
NW
tit
'8ki
tiN
N
Compeny ALLETE Inc Allart Energy Corporal% /Waren Corporatan Costa Corporation CMS Energy Corporation DTE Energy CornPany El Paso Electra Company IDACORP Inc NorthWestern Corporation OGE Energy Corp Otter Tail Corporetion Pinneole West Ceuta Corporatton PNM Resources, Inc Portland Genera EMotnc Compeny SCANA Corporatrori Waoznert Energy Corceraten Xcel Energy Inc
43 Rm.:dud Arntal 44 Outland Payout Ratio
45 Company 46 ALLETE Inc 47 Mart Energy Corporatoon 48 Ameren Corporation 49 Amt. Corporstan 50 CMS Energy Corporation 51 DTE Energy Company 52 B Paso Electric Company 53 IDACORP, lno 54 NorthWestern Caporatan 55 OGE Energy Corp 56 Otter Tail Cameron 57 %male West Gupta Corporation 58 PNM Resources, Inc 59 Portland General Eleotnc Company % SCAM Corporation , 61 Wscoran Energy Corporatan 62 Xcel Energy Inc
1611 1671 163/ Trammel
2030 2031 Velum 94 46 54 70 5121 87 82 57 $2 71 $79 94 53 42 53 60 8194 37 $2 60 93 62 966 06 82 65 $3 03 $89 92 56 54 56 89 5196 37 $2 40 32 53 394 88 $4 75 55 00 $150 19 54 11 5,4 33 9126 47 52 03 $2 18 $60 73 22 38 52 50 $65 35 95 16 55 43 3156 83 92 48 52 61 $72 31 63 M 53 16 589 00 $5 21 $5 19 $155 39 53 56 53 75 $126 96 $3 05 V 21 $88 33
1791 leg 1811
PUC Docket No. 46449 EXHIBIT RBH-2
Page 9' of 20
MMMWM
Mulb-Stage Growth Discourted Cash Flow Model 180 Day Average Stook Price
Low EPS Growth Rate Estimate in First SteLle
6117118191 001 MR 1121 031 Stock EPS Growth Rate atomics Long-Term Payout RM. Iterattve Solution Terms* Termrna
Vaue Low P/E PEG Ticker Puce Zacks First CWI Line Growth Growth 2016 2020 2026 Proof IRR Rata Ratio ALE 558 42 5 50% 5 CO% !CO% 4 %% 5 27% 66 00% % 00% 66 88% (so oil 9 33% 17 35 3 29 LNT 537 32 6 10% 6 OD% 6 03% 6 CO% 5 27% 62 00% 61 00% 66118% (so on 8 84% 19 74 3 74 AEE 649 34 6 10% 5 20% 6 00% 5 20% 5 27% 66 M% 63 W% 66 08% mo on 8 91% 19 37 3 67 AVA $40 91 5 30% 5 00% 5 CO% 5 CO% 5 27% 67 CO% 65 CO% 65 88% 90 oh 8 73% 20 40 3 87 CMS 14213 6 M% 7 27% 6 00% 6 CO% 5 27% 64 W% 62 M% 66 88% (so on 8 82% 19 85 3 76 DTE $91 72 5 M% 5 51% 6 M% 5 51% 5 27% 62 00% 60 00% 66 88% 90 on 8 97% 19 07 3 61 EE 544 96 4 V% 7 CO% 2 50% 250% 5 27% M W% M M% 65 86% iso on 8 08% 25 MI 4 75 IDA 575 24 4 03% 4 00% 3 00% 3 00% 5 27% 53 M% 60 CO% 66 86% (so oh 8 56% 21 42 4 06
NWE 659 18 5 00% 5 00% 6 50% 5 00% 5 27% 63 M% 59 00% 136136% mo on 8 M% 19 54 3 70 OGE 929 86 5 20% 4 W% „ 3 %% 3 00% 5 27% 66 00% 74 CO% 66 88% Ms on, 9 06% 18 59 3 52 OTTR $31 33 NA 6 CO% 6 00% 6 OM 5 27% 82 CO% 64 CO% 66 M% mo Dot 9 30% 17 48 3 31 PNW 574 66 4 XI% 3 95% 4 CO% 3 95% 5 27% 63 CO% 64 CO% 66 86% 60 on 8 92% 19 33 3 66 PNM $32 96 6 70% 5 90% 9 00% 5 90% 5 27% 51 00% 55 00% 66 86% iso cm 9 C6% 18 53 3 51 POR 541 27 6 CO% 5 90% 5 50% 5 50% 5 27% 59 00% 58 00% 66 88% 90 on 9 01% 18 86 3 58 SCG $70 23 5 50% 600% 4 50% 4 50% 5 27% 58 M% 59 00% 136 88% (as on 9 12% 18 33 3 17 WEC $60 18 6 20% 6 72% 6 CO% 6 00% 5 27% 67 M% 67 02% 66 618% mo on $ M% 22 61 4 29 XEL 941 48 5 40% 5 34% 5 50% 5 34% 5 27% 62 061% 62 00% 66 86% (so on 9 10% 18 39 3 49
Mean 8 89% 40 Max 9 33%
Min 8 08% •
MR 051 061 OR 081 1191 1201 121) 1= H231 1241 1251 1261 M M 1291 MA
Ticker 2015 MM 2017 2018 MM 2020 WM MM MM MN mm nn 2027 MM MM MM MM ALE 5336 VM $365 V% V% UR UM 5446 UM UM UU UV UM UM $634 $667 $702 LNT MM MM VM UM UM $226 5230 $253 CM UM UM UV $330 VC $385 VW UM AEE UM $250 um un um 5302 $323 9340 um um um um um um um um um AVA mm vas um um um um um $266 UM 5291 5310 $326 5343 5362 CM UM 9422 CMS VW/UM 5212 un um um um um um um um 5350 $369 VM UM' UM U53 DTE UV UM 9455 $523 UM UM $614 UV UV CM CM 9797 V% um :an ran mom EE umlum um um UN UM $230 5245 5254 um um um um VN $341 um um IDA um 1 um um un um um uu um um UN $549 6578 $609 $641 UM 5710 $748
NWE 6290 V% VM $336 V52 VM VW UM UM $452 UM UM 9527 um um um um OGE mm MN un um um um um um um pm um um um um um um un OTTR um'vm um um um um $221 uu 8247 um um um VN UM CV 5355 5374 PNW VW UM UN UV UM UM um um um um um un um um um pm um PNM mu mu mu mm um um um um um um um um um CU um PM 5390 POR $204 UM $227 5240 $253 UV 5281 5296 $312 5329 VC V% VW UN 9426 um un SCG um um um um uu um um um um um um um me pm pm pm um WEC 5234 me um um um um um um um um um uu um um um um um XEL um um um $245 5299 5272 5287 CM $318 V% VM 5371 5391 9412 UM 5456 $480
Mil 1321 1331 1341 1351 1351 1371 1361 1391 1101 1111 1421 1421 1441 1451 1461
Toker 2016 2017 2018 2019 2020 2021 2022 2023 2024 2025 2026 2027 2028 2029 2030 2031 ALE 66 M% 65 75% 65 50% 65 25% 60 W% 65 31% 66 63% 66 94% 66 26% 65 57% 66 86% 66 88% 66 88% 66 88% 66 68% 66 63% LNT 62 M% 61 mx 61 50% 61 25% 61 00% 61 98% 62 96% M 94% 64 92% 65 90% 66 88% 66 M% 66 88% 86 88% 66 88% 66 M% AEE 66 00% 65 25% 64 50% M 75% M OD% 63 %% 64 29% 64 94% 65 59% 66 24% 66 M% 66 Le% 36 88% 66 M% 66 53% 66 88% AVA 67 00% 66 50% 66 CO% 65 50% 65 %% 65 31% 65 63% 65 94% 66 26% 66 M% 66 M% 55 56% 66 88% 66 M% 66 88% 66 86% CMS 64 M% M 50% 63 CO% 62 50% 62 00% 62 81% 63 63% 64 44% 65 26% 65 07% 66 88% 66 88% 66 88% 65 88% 66 88% 66 88% DTE 62 CO% 61 50% 61 M% 60 50% 60 CO% 61 15% 62 M% 63 44% 64 59% 65 74% 65 88% 65 66% 65 66% 66 53% 66 80% 66 M% EE 63 00% 62 00% 61 00% 50 CO% 59 00% 60 31% 61 63% 62 94% 64 26% 65 57% 66 1!6% 66 86% 65 M% 66 SS% 66 Se% 66 88% IDA 53 CO% 54 75% 56 50% 56 25% 60 CO% 61 15% 62 29% 63 44% 64 59% 65 74% 66 88% 66 86% 66 86% 66 88% 66 86% 65 88%
NWE 63 00% 62 CO% 61 CO% 60 M CO% 60 31% 61 63% 62 94% 64 26% 65 M% 66 93% 66 88% 66 88% 66 88% 65 MI% 66 63% OGE 66 M% 65 CO% 70 CO% 72 00% 74 00% 72 81% 71 63% 70 44% 69 26% 68 07% 66 861% 66 86% 66 68% 66 88% 65 88% 66 86% OTfR M 00% 77 50% 73 M% 65 50% 61 M% 64 ia% 64 96% 65 44% 65 92% 66 40% 66 88% 66 93% 66 M% 66 86% 66 MX 65 88% PMN 63 00% 63 25% 63 50% 33 75% 61 DO% 64 48% 64 96% 65 44% 65 92% 66 40% 66 SP% 66 86% 66 M% 66 88% 66 66% 66 93% PNM 51 CO% 52 00% 53 CO% 54 00% 55 00% 56 98% 58 96% 60 94% 62 92% 64 90% 66 88% 65 88% M 88% 66 86% 66 88% 66 ea% POR 59 00% 53 75% 53 50% 58 25% 58 M% 59 48% CO 96% 62 41% 63 92% 65 40% 66 88% 6653% 66 M% 66 66% 66 88% 66 86% SCG 58 00% 58 25% M 50% 58 75% 59 00% 60 31% 61 63% 62 94% 64 26% 65 57% 66 M% 66 SS% 66 86% 66 88% 66 88% 66 80% WEC 67 W% 67 CO% 67 00% 67 03% 67 00% 66 96% 66 96% 66 94% 66 92% 65 90% 66 86% 66 86% 65 88% 66 68% 66 88% 66 86% XEL 62 CD% 62 00% 62 CO% 62 M% 62 W% 62 81% 63 63% 64 41% % 26% 66 07% 66 MI% 66 66% 66 53% 65 86% 65 SS% 66 M%
62 Prqecied Annul 63 Cash Fbws
64 Company 65 ALLETE Inc 66 Mont Energy Corporatan 67 Amman Corporation 66 Amt. Corpwatan 69 CMS Energy Corporation 70 DTE Energy Company 71 El Paso Electra ConlImny 72 1DACORP, Inc 73 NaMWestern Corporation 74 OGE Energy Corp 75 Otter Tal Corporation 76 Pinnacle West Caprtal Corporation 77 PNM Resourom, Inc 78 Pailand Genera Electra Company 79 SOMA Corporation 80 Wisconsn Energy CorPomition 81 Xcel Energy ifIC
147] Mt 14191 pol 1511
Taker 2015 2017 2018 2019 2020 ALE • 52 32 92 10 $2 49 $2 58 22 67 LNT $1 11 $1 17 $1 24 $1 31 $1 38 AEE I 91 65 91 72 61 79 51 85 51 93 AVA 51 33 51 39 31 44 91 50 $1 57 CMS 21 26 $1 35 51 42 51 49 51 57 DTE 32 91 53 05 $3 19 53 34 53 49 EE 51 31 51 32 91 33 91 34 51 36 IDA 52 11 52 25 52 39 $2 54 62 69
NWE $1 92 $1 93 52 05 $2 11 • 22 18 OGE $1 15 $1 22 51 29 $1 37 $1 45 OTTR 51 36 51 36 $1 36 91 35 51 34 PPM/ 62 57 $2 68 $2 610 $2 92 53 05 PNM 50 W 50 95 91 03 $1 11 51 20 POR 61 27 51 33 51 40 51 47 61 55 SCG 52 31 52 42 52 54 52 67 52 80 WEC 51 66 51 76 $1 87 $1 98 52 10 XEL 51 37 $1 44 91 le 51 60 91 69
1551 1561 1571 1551 1591 1601
2024 2025 2026 2027 2028 2029 53 25 $3 43 53 63 53 M 54 CO 64 24 51 83 91 96 5206 62 21 $2 32 52 44 22 47 52 62 62 79 62 93 53 09 53 25 $1 95 $2 06 52 18 $2 361 52 42 $2 55 92 05 52 20 52 34 52 47 92 60 32 73 54 64 PI 97 $5 33 55 61 $5 90 56 22 $1 70 51 82 51 96 52 06 $2 17 52 28 63 36 $3 61 53 87 54 07 51 29 64 51 52 SO 53 12 $3 35 93 52 53 71 $3 91 $1 58 51 63 51 69 $1 78 $1 87 $1 97 31 72 $1 62 $1 93 $2 04 32 14 52 26 53 71 53 96 54 20 54 42 54 65 $4 90 51 71 $1 M 92 02 92 12 92 24 62 36 $2 10 $2 27 52 44 $2 57 52 70 82 65 33 661 53 95 54 24 54 47 54 70 64 95 52 62 $2 76 52 93 53 05 $3 21 63 38 62 19 52 33 62 48 92 61 52 75 52 %
1521 1531 (541
2021 2022 2023 52 M 52 94 $3 C9 $1 48 $1 59 $1 71 $2 05 92 18 92 32 91 65 :I7S vas 51 68 $1 80 51 93 $3 75 54 03 94 33 91 43 51 51 91 M $2 84 $3 00 sala 52 31 32 52 92 70 $1 47 51 51 91 54 91 43 51 52 51 62 63 20 $3 35 63 54 51 32 61 44 $1 57 51 67 51 81 81 95 63 00 53 21 53 14 52 22 52 35 52 ia 51 M 81 92 $2 05
81 Protected Annual Data
. 82 Invest Cash Firms 1641 1851 1661 1671 1631 1691 or 170/ 1711 1721 1731 1741 1751 1761 1771 1781 WWI
83 Company Tooker Outflow 10/14/16 12/31/16 6/30/17 6/30/18 6/30/19 6/33/20 6/30/21 6/3022 6/3C923 6/33/24 6/30/25 6/30/26 6/3027 6/3028 62029 84 ALLETE, Inc ALE (558 43) 50 CO 50 50 52 37 32 49 32 58 62 67 62 80 52 94 63 09 $3 25 53 43 53 63 53 82 $4 03 81 24 85 Albert Energy Corporation LNT (637 32) SO % SO 24 $1 14 $1 24 $1 31 $1 36 51 48 81 59 $1 71 51 83 51 96 52 09 $2 21 62 32 62 44 66 Ameren Corporlan AEE (549 34) 50 M SO 35 51 70 51 79 51 86 51 93 $2 05 52 18 $2 32 52 47 52 62 52 79 $2 93 53 D9 53 25 87 Austa Corporation AVA (540 92) $0 00 50 28 $1 36 51 44 31 50 51 57 $1 65 51 75 51 65 51 95 52 06 52 18 92 30 52 42 52 55 M CMS Energy Corporation CMS ($4211) SO M 30 27 51 32 $1 42 $1 49 $1 57 $1 68 51 80 91 93 $2 06 92 20 52 34 52 47 $2 60 92 73 69 DTE Energy Company DTE (991 73) $0 00 SO 62 52 99 63 19 63 34 $3 49 $3 75 $4 03 54 33 54 64 $1 97 55 33 55 61 55 SO $6 22 90 El Paso Electra Consmny EE (644 97) 50 00 $0 28 51 33 51 33 51 34 51 36 51 43 $1 51 51 % 91 70 $1 82 51 % 62 05 52 17 $2 28 91 IDACORP, Inc „ IDA ($75 25) 50 CO V 45 32 14 $2 39 $2 54 $2 69 $2 84 $3 00 $3 18 $3 36 53 61 63 87 $4 07 $4 29 54 51 92 NorthWestern Corporetion NWE (559 19) SO 00 SO 41 $1 97 52 05 $2 11 52 18 92 34 52 52 $2 70 92 90 53 12 53 35 53 52 $3 71 $3 91
6/30/30 6/30/31 81 46 5126 56 52 57 $82 65 53 42 5107 97 92 68 988 66 $2 83 $92 95 16 54 9203 26 32 40 597 41 $4 75 $165 20 $4 11 9130 80
93 OGE Energy Corp OGE ($29 86) 50 00 V 25 51 17 51 29 51 37 51 45 $1 47 51 51 51 54 $1 56 51 M 51 69 $1 78 81 87 91 97 $2 OS $62 91 94 Otter Ted Corporation OTTR (531 33) $0 CO $0 29 51 40 61 35 21 35 51 34 $1 43 $1 52 $1 62 91 72 $1 82 $1 93 $2 04 52 14 52 26 52 38 $67 85 55 Porac)e West Capita/ Corporation PMN ($74 67) S0lE V 55 52 62 22 80 $2 92 53 05 63 20 53 36 $3 51 V 74 V 95 $1 20 $4 42 54 65 64 90 $5 16 5162.26 96 PNM Resources, Inc PNM ($32 97) SO 00 90 19 ID 91 51 CC 61 11 $1 20 51 32 $1 44 $1 57 $1 71 51 86 52 02 52 12 $2 21 52 36 92 48 574 92 97 Portland Genera/ Electric Company POR (641 28) 50 03 $0 27 51 M 51 40 51 47 91 55 51 67 61 81 $1 95 $2 10 52 27 92 44 $2 57 $2 70 52 65 $3 00 392 15 98 SCANA Corporation SCG (570 24) SO 00 V 49 32 36 62 54 $2 67 $2 80 $33 00 53 21 53 44 63 68 $3 95 54 24 54 47 54 70 64 95 $5 21 $155 I% 99 Wrsocrwn Energy Corporatan WEC (660 19) 8002 $0 36 51 71 $1 87 51 M 52 10 62 22 32 35 92 48 52 62 92 76 52 90 $3 C6 53 21 $3 38 $3 56 5130 73 100 Xcel Energy Mc XEL (541 48) $0 00 5026 51 41 81 52 81 CO $1 69 $1 80 51 92 52 05 $2 19 $2 33 . 52 48 52 61 52 75 $2 90 $3 05 $91 54
760

PUC Docket No. 46449 EXHIBIT RBH-2
Page 10 of 20 1 Multi-Stage DCF Notes 2 [1] Source Bloomberg, based on 30-, 90-, and 180-day histoncal average as of October 14, 2016 3 [2] Source Zacks 4 [3] Source Yahoo! Finance 5 [4] Source Value Line 6 [5] Equals indicated value (average, minimum, maximum) from Columns [2], [3], [4] 7 [6] Source Bureau of Economic Analysis, Federal Reserve, Blue Chip Financial Forecast 8 [7] Source Value Line 9 [8) Source Value Line 10 [9] Source Bloomberg Professional 11 [10] Equals Column [1] + Column [64] 12 [11] Equals result of Excel Solver function, goal Column [10] equals $0 00 13 [12] Equals Column [63] / Column [30] 14 [13] Equals Column [12] / (Column [6] x 100) 15 [14] Source Value Line 16 [15] Equals Column [14] x (1 + Column [5]) ' 17 [16] Equals Column [15) x (1 + Column [5]) 18 [17] Equals Column [16] x (1 + Column [5]) 19 [18] Equals Column [17] x (1 + Column [5]) 20 [19] Equals Column [18] x (1 + Column [5]) 21 [20] Equals (1 + (Column [5] + (((Column [6] — Column [5]) / (2025 — 2020 + 1)) x (2020 — 2019)))) x Column [19] 22 [21] Equals (1 + (Column [5] + (((Column [6] — Column [5]) / (2025 — 2020 +. 1)) x (2021 — 2019)))) x Column [20] 23 [22] Equals (1 + (Column [5] + (((Column [6] — Column [5]) / (2025 — 2020 + 1)) x (2022 — 2019)))) x Column [21] 24 [23] Equals (1 + (Column [5] + (((Column [6] — Column [5]) / (2025 — 2020 + 1)) x (2023 — 2019)))) x Column [22] 25 [24] Equals (1 + (Column [5] + (((Column [6] — Column [5]) / (2025 — 2020 + 1)) x (2024 — 2019)))) x Column [23] 26 [25] Equals Column [24] x (1 + Column [6]) 27 [26] Equals Column [25] x (1 + Column [6]) 28 [27] Equals Column [26] x (1 + column [6]) 29 [28) Equals Column [27] x (1 + column [6)) 30 [29] Equals Column [28] x (1 + column [6)) 31 [30] Equals Column [29] x (1 + column [6]) 32 [31) Equals Column [7] 33 [32] Equals Column [31] + ((Column [35] — Column [31]) / 4) 34 [33] Equals Column [32] + ((Column [35] — Column [31]) / 4) 35 [34] Equals Column [33] + ((Column [35] — Column [31]) / 4) 36 [35] Equals Column [8] 37 [36] Equals Column [35] + ((Column [41] — Column [35]) / 6) 38 [37] Equals Column [36] + ((Column [41] — Column [35]) / 6) 39 [38] Equals Column [37] + ((Column [41] — Column [35]) / 6) 40 [39] Equals Column [38] + ((Column [41] — Column [35]) / 6) 41 [40] Equals Column [39] + ((Column [41] — Column [35]) / 6) 42 [41] Equals Column [9] 43 [42] Equals Column [9] 44 [43] Equals Column [9] 45 [44] Equals Column [9] 46 [45] Equals Column [9] 47 [46] Equals Column [9] 48 [47] Equals Column [15] x Column [31] 49 [48] Equals Column [16] x Column [32] 50 [49] Equals Column [17] x Column [33] 51 [50] Equals Column [18) x Column [34] 52 [51] Equals Column [19] x Column [35] 53 [52] Equals Column [20] x Column [36) 54 [53] Equals Column [21] x Column [37] 55 [54] Equals Column [22] x Column [38] 56 [55] Equals Column [23] x Column [39] 57 [56] Equals Column [24] x Column [40] 58 [57] Equals Column [25] x Column [41] 59 [58] Equals Column [26] x Column [42] 60 [59] Equals Column [27] x Column [43] 61 [60] Equals Column [28] x Column [44] 62 [61] Equals Column [29] x Column [45] 63 [62] Equals Column [30] x Column [46] 64 [63] Equals (Column [62] x (1 + Column [6])) / (Column [11] — Column [6]) 65 [64] Equals negative net present value, discount rate equals Column [11], cash flows equal Column [65] through Column [81] 66 [65] Equals so bo 67 [66] Equals Column [47] x (12/31/2016 - 10/14/2016) / 365 68 [67] Equals Column [47] x (1 + (0 5 x Column [5])) 69 [68] Equals Column [49] 70 [69] Equals Column [50] 71 [70] Equals Column [51] 72 [71] Equals Column [52] 73 [72] Equals Column [53] 74 [73] Equals Column [54] 75 [74] Equals Column [55] 76 [75] Equals Column [56] 77 [76] Equals Column [57] 78 [77] Equals Column [58] 79 [78] Equals Column [59] 80 [79] Equals Column [60] 81 [80] Equals Column [61] 82 [81] Equals Column [62) + [63]
761
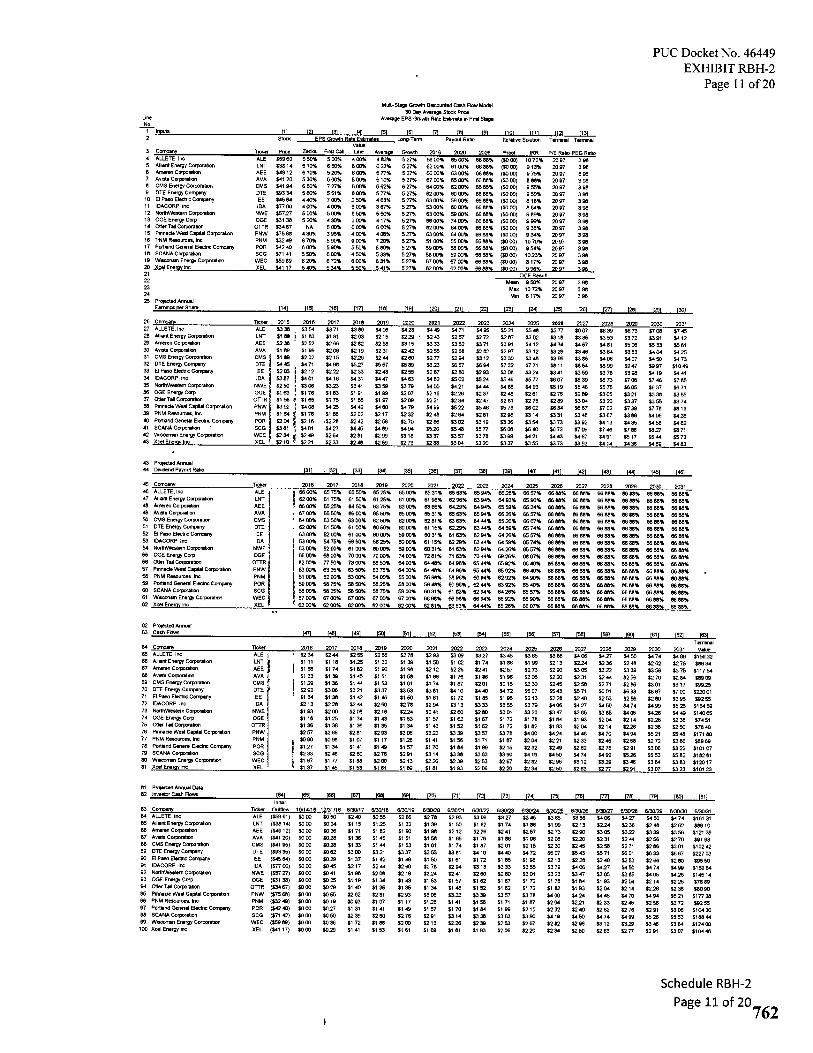
PUC Docket No. 46449 EXHIBIT RBH-2
Page II of 20
Une No 1 Inputs 2
3 ComPeny 4 ALLETE Inc 5 Rant Energy Corporation 6 Ameren Corpombon 7 Avista Corporation 8 CMS Energy Corporation 9 DTE Energy Corr-cony
10 El Paso Electric Company 11 IDACORP Inc 12 Northwestern Corporabon 13 OGE Energy Corp 14 Otter Tall Corporabon 15 Prnnacle West Capital Corporator, 16 PNM Resources, Inc 17 Portland General Electno Company IS SCANA Corporabon 19 Wisconwn Energy Corporatoon 20 Xcel Energy Inc 21 22 23 24 25 Protected Annual
Eaminos per Share
26 ComPanv 27 ALLETE, Inc 28 Allent Energy Corporation N Arneren Corporation 30 Nast. Corporation 31 CMS Energy Corporation 32 DTE Energy Company 33 El Paso Electric Company 34 IDACORP, Inc 35 NodhWeatem Corporabon 36 OGE Energy Corp 37 Otter Tall Corporabon 38 Pinnacle Wes( Capital Corporabon 39 PNM Re8ources, Inc 40 Portland General Electec Company 41 SCANA Corporation - 42 Wisconsin Energy Corporaton 43 Xcel Enemy Inc
43 Protected Annual 44 Dividend Payout Raho
222
82t
'RR
TE
P,a 'S
t4t,
&&
Company ALLETE, Inc Allont Energy Corporation Ameren Corporation Awsta Corporation CMS Energy Corporation DTE Energy Company El Paso ElecInc Company IDACORP Inc NorthWestem Corporabon OGE Energy Corp Otter Tail Corporabon Pinnacle West Capital Corporation PNM Resources Inc Portlend General Electnc Compeny SCANA Corporation Wisconsin Energy Corporation Xcel Energy Inc
62 Protected Annual 63 Cash Fbv.s
64 ComPwW 65 ALLETE Inc 66 Mont Energy Corporation 67 Ameren Corporation 68 Avesta Corporation 69 CMS Energy Corporation 70 DTE Energy Company 71 El Paso EIRInc Company 72 IDACORP Inc 73 Northwester,' Corporabon 74 OGE Energy Corp 75 Otter Tall Corporabon 76 Pinnacle West Capital Corporation 77 PNM Resources, Inc 78 Portland General Electric Compeny 79 SCANA Corporation 80 Wiseman Energy Corporation 81 XceI Energy Inc
81 Protected Annual Data 82 Investor Cash Flows
63 CornPany 84 ALLETE Inc 85 Alhant Energy Caporaton 136 Arneren Corporation 87 Awata Corporabon 88 CMS Energy Corporatm 89 DTE Energy Conpany 90 El Paso ElecInc Company 91 IDACORP Inc 92 Northwestern Corporabon 93 OGE Energy Corp 94 Otter Tail Con:matron 95 Ptnnacle Wee( Capital Corporation 96 PNM Resources, Inc 97 Portland General ElecInc Company 95 SCANA Corporation 99 Weconsin Energy Corporabon
100 Xcel Energy Inc
121 f31 141
Mu5Stage Growth Discounted Cash Flcow Model 30 Day Average Stock Pnce
Average EPS Growth Rate Eattnwte ri Fret Stage
151 171 tai [9] 1101 1111 [121 1131 l Srtlook EPS Growth Rate Estenetes 16 Long-1-1 Payout Rabo Iterabve Solution Temanal Termonal
Value Ticker Pnce Zacks First Call Line Average Growth 2016 2020 2026 Proof IRR P/E Retro PEG Rabo ALE 559 60 5 50% 5 00% 4 00% 4 83% 5 27% 66 CO% 65 00% 66 88% (50 00) 10 72% 20 97 3 98 LNT 538 14 6 10% 6 60% 6 00% 6 23% 5 27% 62 00% 61 00% 66 88% (90 00) 9 13% 20 97 3 96 AEE 949 12 6 10% 5 20% 6 00% 5 77% 5 27% 66 00% 153 00% 66 88% (90 00) 9 75% 20 97 3 96 AVA 941 20 5 30% 5 OD% 5 00% 5 10% 5 27% 67 00% 65 00% 66 ea% (50 00) 8 88% 20 97 3 98 CMS 541 94 6 60% 7 27% 6 00% 6 62% 5 27% 64 00% 62 00% 66 68% 150 00) 9 55% 20 97 3 98 DTE $93 34 5 MI% 5 51% 6 00% 5 77% 5 27% 62 00% 60 00% 86 63% 150 00) 9 50% 20 97 3 95 EE 545 64 4 40% 7 00% 2 50% 4 Ea% 5 27% 63 00% 59 00% 66 88% (50 CO) 8 18% 20 97 3 90 IDA 977 00 4 00% 4 00% 3 00% 3 67% 5 27% 53 00% 60 00% 66 68% (50 CO) 8 64% 20 97 3 98 NWE 55727 5 00% 5 00% 6 50% 5 50% 5 27% 63 CO% 59 00% 66138% 00 20 97 3 98 OGE 931 38 5 20% 4 30% 3 00% 4 17% 5 27% 66 00% 74 00% 66 88% (90 00) 9 99% 20 97 3 96
OTTR 534 67 NA 6 02% 6 CO% 6 00% 5 27% 82 00% 64 00% 66 88% (50 00) 9 35% 20 97 3 sa PNW 575 68 4 30% 3 95% 4 00% 4 08% 5 27% 153 00% 64 00% 66 88% (50 00) 9 34% 20 97 3 98 PNM 932 49 6 70% 5 90% 9 00% 7 20% 5 27% 51 00% 55 00% 66 88% (SO 00) 10 70% 20 97 3 98 POR $42 40 6 OD% 5 90% 5 50% 5 ao% 5 27% 59 00% 58 OD% 06 86% (50 00) 9 54% 20 97 3 98 SCG $71 41 5 50% 6 00% 4 50% 5 33% 5 27% 58 00% 59 00% 66 86% (90 CO) 10.23% 20 97 3 98 WEC $59 89 XEL 241 17
6 20% 5 40%
6 72% 5 34%
6 00% 5 50%
6 31% 5 41%
5 27% 5 27%
67 00% 62 00%
67 CO% 62 00%
66 88% 66 88%
(90 00) 150 00)
8 17% 9 96%
20 97 3 98 20 97 3 90
DC F Result Mean 9 50% 20 97 3 90
Max 10 72% 20 97 3 96 Min B 17% 20 97 3 9B
1141 55] [16] [17] 1181 [19] 1201 [21] [221 [23] [241 1251 1261 [271 128] [291 [30/
Ticker 2015 2016 2017 2018 2019 2020 2021 2022 2023 2024 2025 2020 2027 2028 2029 2030 2031 ALE 33 38 , 53 54 53 71 53 89 54 06 94 28 94 49 54 71 54 95 55 21 95 48 95 77 56 07 30 39 96 73 97 08 57 45 LNT 91 OD
/ 4 51 80 91 91 52 03 52 15 9229 92 43 92 57 92 72 92 87 93 02 53 18 53 35 53 53 $3 72 53 91 34 12
AEE 32 93 92 52 92 66 $2 82 92 98 $3 15 $3 33 53 52 23 71 53 91 54 12 54 34 54 57 $4 SI 55 06 55 33 95 61 AVA fl 89 51 99 52 09 52 19 52 31 02 42 92 55 92 68 92132 52 97 53 12 93 29 93 46 13 64 13 83 94 04 5425 CMS 91 85 $2 02 52 15 $229 52 44 92 OD 92 77 52 94 $3 12 53 30 93 48 53 66 $3 85 94 06 $4 27 $4 50 $4 73 DTE $4 45 54 71 54 96 9527 55 57 95 89 56,23 56 57 56 94 57 32 57 71 58 11 95 54 $8 99 59 47 99 97 910 49 EE 52 03 92 12 92.22 92 33 52 43 52 55 52 67 92 00 92 93 $3 08 93 24 $3 41 53 59 53 78 93 98 $4 19 54 41 IDA 53157 94 01 94 16 34 31 54 47 54 03 54 82 55 02 9524 55 49 95 77 56 07 56 39 56 73 97 08 97 46 37 85
NWE 52 90 53 (16 5323 83 41 53 59 53 79 54 00 5421 94144 54 58 94 93 55 19 55 46 55 75 56 05 56 37 56 71 OGE $1 69 51 76 91 83 $1 91 $1 99 92 07 $2 16 92.26 22 37 92 46 52 61 52 75 52 89 53 05 5321 53 38 53 55 OTTR 51 56 51 65 91 75 51 66 51 97 92 09 52 21 52 34 92 47 92 61 92 75 $2 59 53 04 53 20 53 37 53 55 53 74 PNW 93 62 54 08 54 25 54 42 $4 80 94 79 $4 99 95 22 55 46 55 73 56 02 56 34 96 67 97 02 97 39 97 78 98 19 PNM 01 64 $1 76 51 68 32 02 92 17 92 32 92 46 52 64 92 81 52 98 53 14 53 31 53 48 53 67 53 86 94 06 9428 POR $2 04 $2 16 .5228 92 42 52 56 92 70 92 86 $3 02 53 19 93 36 $3 54 53 73 $3 92 $4 13 64 35 94 58 $4 82 SCG 93 81 54 01 54 23 54 45 54 69 54 94 5520 se ea 95 77 96 08 96 40 56 73 97 09 57 46 97 86 5527 53 71 WEC $2 34 g 52 49 92 64 92 81 52 99 $3 18 53 37 53 57 $3 78 93 99 54 21 94 43 54 67 $4 91 55 17 55 44 55 73 XEL 0210 52 21 52 33 92 48 52 59 52 73 52 88 93 04 5320 53 37 53 55 53 73 13 93 54 14 N 36 94 59 94 83
131] 1321 [331 [34] [351 36] [371 [381 391 [401 1411 1521 143/ 144] 1451 [461
TON 2016 2017 2010 2019 2020 2021 2022 2023 2024 2025 2026 2027 2028 2029 2030 2031 ALE 56 00% 65 75% 65 50% 65 25% 65 CO% 05 31% 65 63% 65 94% 6626% 66 57% 66 136% 66 88% 66 86% 66 88% 66 88% 66 63% LNT 62 00% 61 75% 61 50% 6125% 61 00% 61 3651 62 96% 63 94% 64 92% 65 90% 06 16% 66 88% 66 86% 66 88% 66 86% 06 66% AEE 06 00% 6525% 84 50% 63 75% 63 00% 63 65% 6429% 64 94% 65 59% 6624% 66 IN% 66 68% 66 88% 86 88% 66 86% 60 18% AVA 67 00% 66 50% 66 00% 65 50% 05 00% 65 31% 65 63% 65 94% 66 26% 66 57% 66 66% 06 86% 66 66% 66118% 66 68% 66 65% CMS 84 00% 133 50% 63 00% 62 50% 62 00% 62 81% 63 63% 64 44% 8526% 66 07% 66 88% 66 88% 66 66% 136 88% 66 SS% 66 SB% OTE 62 00% 61 50% 61 00% 60 50% 60 00% 61 15% 6229% 63 44% 64 59% 65 74% 66 88% 06 88% 66 88% 66 66% 66 BB% 6655% EE 63 OD% 62 CO% 61 00% 60 00% 59 00% 510 31% 61 63% et 94% 64 26% 65 57% 86 66% 56 66% 66 88% 06 ea% 66 66% 66 88% IDA 53 00% 54 75% 56 50% 513 25% 60 00% 61 15% 62 29% 63 44% 64 59% 65 74% 66 88% 66 138% 66 88% 66 86% 66 88% 06 86%
h6NE 63 00% 62 00% 61 00% 60 00% 50 OD% 60 31% 61 63% 62 94% 64.26% 65 57% 66 86% 66 /16% 66 88% 66 88% 66 63% 66 65% OGE 66 00% 68 00% 70 00% 72 00% 74 CO% 72 81% 71 83% 70 44% 6926% 63 07% 66 88% 66158% 66 88% 66 88% 66 86% 66 66%
OTTR 52 00% 77 51)% 73 00% 66 50% 64 00% 64 a% 64 96% 65 44% 65 92% 66 40% 66 88% 66 68% 66 88% 6666% 95 66% 66 88% PNW 63 00% 63 25% 63 50% 63 75% 64 00% 84 48% ' 64 96% 65 44% 65 92% 66 40% 66 88% 66 88% 66 86% 66 88% 66 86% 05 68% v PNM 51 00% 52 00% 53 00% $44 00% 55 00% 56 98% 63 96% 60 94% 62 92% 64 90% 66 88% 66 aa% as ea% ea 88% 66 813% 86 88% POR 59 00% 58 75% 58 50% 5825% 58 00% 59 R% 60 96% , 62 44% 63 92% 66 40% 136 BB% 66 613% 66 88% 66 66% 06 813% 65 86% SCG 58 00% 58 25% 58 50% 58 75% 59 00% 60 31% 61 63% 62 94% 64 26% 65 57% 66 88% 66 63% 66 88% 66 86% 66 88% 65 88% WEC 67 00% 67 00% 67 00% 67 00% 67 00% 66 90% 66 96% 66 94% 66 92% 65 90% 66 88% 66 6151% 66 88% 66 88% 66 66% 65 88% XEL 62 00% 62 00% 62 DO% 62 00% 62 CO% 62 81% 83 63% 64 44% 85 26% 66 07% 66 55% 66 88% 66 88% 66 80% 66 88% 66155%
[47] (481 1491 1501 [511 [521 f 531 (54] 1551 1561 [571 (581 Ease [601 [61] 1621 1631 Terrrmal
Ticker 2016 2017 2018 2019 2020 2021 2022 2023 2024 2025 2026 2027 2028 2029 2030 2031 Value ALE 52 34 92 44 52 55 92 06 92 78 52 93 23 09 5327 93 45 93 65 53 86 34 06 5427 $41 50 64 74 94 99 9156 32 LNT ] 51 11 91 18 5125 $1 32 $1 39 51 50 51 62 91 74 51 86 91 99 52 13 5224 32 36 52 48 52 62 92 75 556 34 AEE 51 66 91 74 91 62 91 90 91 98 92 12 22 26 92 41 52 57 22 73 52 90 53 05 9322 53 39 93 56 53 75 9117 64 AVA 51 33 91 36 91 45 91 51 51 58 91 66 91 76 51 86 51 96 52 08 9220 92 31 92 44 32 56 92 70 92 84 589 09 CMS 1 91.29 91 36 51 44 91 53 51 61 91 74 51 87 52 01 22 15 92 30 92 45 92 58 52 71 92 86 53 01 93 17 $99.25 DTE 52 92 93 06 5321 53 37 93 53 23 81 54 10 54 40 24 72 95 07 55 43 55 71 56 01 96 33 96 67 97 02 2220 01 EE ' 91 34 51 38 91 42 51 46 51 50 91 61 91 72 91135 51 98 92 13 92 28 92 40 52 53 22 66 92 60 52 95 $92 55 IDA 52 13 32 28 52 44 52 03 52 78 52 94 53 13 53 33 53 55 93 79 94 06 9427 34 50 94 74 94 99 55 25 9164 59
NWE 51.93 92 DO az as 52 16 5224 52 41 52 60 92 60 93 01 53 23 53 47 63 65 53 85 54 05 5426 54 49 9140 65 OGE 51 16 91 25 $1 34 $1 43 91 53 51 57 91 62 51 67 51 72 91 78 51 84 51 93 52 04 52 14 52.26 92 38 974 51 OTTR 21 36 91 36 91 36 91 35 51 34 21 43 91 52 91 62 91 72 51 82 51 93 52 04 22 14 5226 52 38 52 50 9713 40 PNW 92 57 92 69 52 81 92 93 53 06 9322 53 39 53 57 53 78 34 00 9424 24146 54 70 54 94 95 21 55 48 9171 80 PNM SO 90 90 98 91 07 91 17 9128 51 41 91 56 51 71 91 87 92 04 92 21 92 33 52 45 92 58 92 72 92 66 589 69 POR $ 9127 51 34 91 41 51 49 91 57 91 70 91 84 91 99 52 15 52 32 52 49 92 62 52 76 22 91 53 06 5322 9101 07 SCG r 52 33 52 46 92 60 52 76 92 91 53 14 93 38 93 63 $3 90 14 19 94 50 54 74 94 99 5526 $5 53 55 82 9182 61 WEC 51 67 91 77 51 88 52 00 52 13 5226 92 39 52 53 92 67 92 82 52 96 93 12 5329 53 46 53 64 53 83 5120 17 XEL 51 37 $1 45 $1 53 $1 61 91 92 51 81 $1 93 52 06 92 20 92 34 52 50 52 63 52 77 52 91 53 07 53 23 5101 23
1641 [65] 1661 [67/ 1661 [931 [70/ 1711 1721 [731 1741 1751 [76/ 1771 1781 179 Pol [611 InNial
Ticker Outflow 10/14/18 12/31/16 6/30/17 6/30/18 6/30/19 6/30/20 6/30/21 6/30/22 6/30123 6/30/24 6/30/25 6/30/26 6/30727 6/30/28 6/30/29 6/30/30 6/30/31 ALE (559 61) 90 00 $0 50 52 40 92 55 52 66 52 78 92 93 53 09 53.27 53 45 53 65 93 86 $4 06 54 27 94 50 54 74 9161 31 LNT (9315 14) SO CO 90 24 91 15 5125 91 32 51 39 $1 50 51 62 $1 74 $1 86 91 99 22 13 5224 52 36 52 46 52 62 $89 10 AEE (949 12) 50 00 50 36 51 71 $1 62 91 90 91 961 52 12 5226 52 41 92 57 92 73 52 90 93 05 9322 53 39 93 56 9121 39 AVA (541 20) 50 00 5028 51 36 $1 45 91 51 91 58 $1 66 91 76 91 86 91 96 92 oa 5220 $2 31 92 44 92 56 $2 70 991 93 CMS (941 95) SO 00 50.23 51 33 91 44 $1 53 $1 01 $1 74 $1 67 92 01 52 15 52 30 92 45 92 58 92 71 52 06 93 01 9102 42 DTE (593 35) 90 00 50 62 53 00 5321 53 37 13 53 53 01 $4 10 94 40 14 72 95 07 55 43 15 71 96 01 96 33 56 67 9227 03 EE (945 64) 50 00 $029 $1 37 51 42 $1 46 91 50 51 61 $1 72 51 85 51 sa $2 13 52 28 92 40 $2 53 52 66 52 80 $95 50 IDA (577 00) 90 00 SO 45 92 17 92 44 92 60 52 78 92 94 53 13 53 33 93 55 33 79 54 06 5427 54 50 54 74 54 99 9169 84 NWE (557 27) 50 00 50 41 91 96 62 06 52 16 5224 12 41 $2 00 52 80 53 01 93 23 13 47 53 65 33 85 54 05 $ 426 5145 14 OGE (131 38) 50 CO 30 25 91 19 SI 34 51 43 51 53 91 57 91 62 51 67 91 72 91 78 f 1 84 51 93 92 04 92 14 92 26 576 89 OTTR (534 67) 60 02 SO 29 $1 40 91 36 01 35 51 34 21 43 91 52 $1 62 91 72 21 82 $1 93 52 04 52 14 5226 92 38 680 90 PNW (575 68) SO 00 90 55 52 62 5201 22 93 53 06 5322 53 39 53 57 $3 78 54 00 54 24 $4 46 $4 70 54 94 5.5 21 5177 28 PNM ($32 49) 30 00 50 19 50 93 $1 07 21 17 91.261 91 41 21 56 91 71 $1 87 52 04 5221 92 33 52 45 52 515 92 72 992 55 POR ($42 40) SG 00 50,27 51 31 51 41 91 49 91 57 51 70 $1 84 51 99 52 15 92 32 $2 49 $2 62 92 76 $2 91 $3 06 5104 30 SCG (971 42) 90 00 50 50 92 39 52 60 92 76 92 91 93 14 53 38 53 63 53 90 64 19 54 50 $4 74 94 99 95 26 95 53 9166 44 WEC (959 89) 90 00 50 36 01 72 $1 88 52 00 92 13 0226 92 39 52 53 52 67 52 82 92 96 53 12 5329 53 48 53 64 9124 00 XEL (941 17) 20 00 50.29 91 41 21 53 51 61 $1 65 91 81 91 93 52 05 52 20 92 34 $2 50 92 63 92 77 92 91 93 07 2104 46
Schedule RBH-2
Page 11 of 20 762

PUC Docket No. 46449 EXHIBIT RBH-2
Page 12 of 20
Line No 1 Inputs D 1 121 131 141
Mut-Stage Growth Dacounted Cash Flow Model 30 Day Average Stock Price
11mh EPS Growth Rate Esturne tn Foot Stage
151 161 171 1161 191 1101 1111 1121 1131
1281 126 pal
2
3 Conran
Stock
Ticker Pnce
EPS Mon, Rate Esbmates Long-Terni
2016
Payout Ram
2020 2026
Iterative Soluton
Proof IR R
Terme! Tenianal
P/E Rabo PEG Ratio Zack* Fost Catl Value Line
Fhgtt Growth Growth
4 ALLETE, Inc 5 Anent Energy Corporation 6 Ameren Corporation 7 Aosta Corporation 8 CMS Energy Corporabon 9 DTE Energy Compony
10 Et Pno Electnc Corrmeny 11 104C0RP, loc 12 NorthiNestem Cceporalion 13 OGE Energy Corp 14 Otter Tail Corporation 15 Pinnacle Wea Capital Corporation 16 PNM Resources, Inc 17 Portland General Elenc Conmany 18 SCANA Comoratron 19 Wisconsin Energy Corpordon 20 Xcer Enercv Inc
ALE 659 60 5 50% LNT 938 14 6 10% AEE 549 12 6 10% AVA $4120 5 30% CMS 941 94 6 60% DTE 593 34 5 50% EE 645 64 4 40% IDA 577 00 4 00%
NWE $5727 5 CO% OGE $31 38 5 20% OTTR 93467 NA PNW 975 68 4 30% PNM $32 49 6 70% POR 542 40 6 0016 SCG 071 41 5 50% WEC $69 69 6 20% XEL. 041 17 40%
5 00% 6 60% 5 20% 5 00% 7 27% 5 51% 7 00% 4 CO% 5 03% 4 30% 6 00% 3 95% 5 90% S 90% 6 00% 6 72% 5 34%
4 00% 6 00% 6 00% 5 00% 6 00% 6 00% 2 50% 3 00% 6 50% 3 CO% 6 00% 4 00% 9 00% 5 50% 4 50% 6 00% 5 50%
5 50% 6 60% 6 10% 5 30% 7 27% 6 00% 7 00% 4 00% 6 50% 5 20% 6 00% 4 30% 9 00% 6 00% 6 00% 6 72% 5 50%
5 27% 5 27% 5 27% 5 27% 5 27% 5 27% 5 27% 5 27% 5 27% 5 27% 5 27% 5 27% 5 27% 5 27% 5 27% 5 27% 5 27%
66 00% 62 00% 66 00% 67 00% 64 00% 62 00% 63 00% 63 00% 63 00% 66 00% 52 00% 1E3 00% 51 00% 59 00% 58 CO% 67 CO% 62 00%
65 00% 61 00% 63 00% 65 CO% 62 00% 00 00% 59 00% 60 00% 59 00% 74 00% 64 DO% 64 00% 55 00% 58 00% 59 00% 67 00% 62 00%
66 66% 66 88% 66 88% 66 88% 66 66% 66 68% 66 88% 66 88% 66 6a% 66 66% 66 661% 06 88% 66 68% 66 66% 66 68% 66 88% 86 88%
(10 00) (50 00) (60 00) (SO 00) (00 00) (00 00) (50 00) (60 00) (SO (10) (90 00) (90 00) (60 00) ($0 00) (50 00) (50 00) (SO 00) (60 00)
11 14% 9 35% 9 95% 9 00% 9 94% 9 64% 9 59% 6 64% 10 50% 10 64% 9 35% 9 47% 11 79% 9 66%
10 64% 8 41% 10 01%
20 97 20 97 20 97 20 97 20 97 20 97 20 97 20 97 20 97 20 97 20 97 20 97 20 97 20 97 20 97 20 97 20 97
3 98 3 95 3 98 3 96 3 98 3 96 3 98 3 98 3 96 3 96 3 66 3 98 3 96 3 9C 3 98 3 98 3 98
21 22 23 24 25 Projected Annual
Eamon per Share 1141 1151 1161 [17] 11611 1191 1201 1211 1221
DCF Result Mean
Man Ma
1231
9 88% 11 79% 8 41%
1241
20 97 20 97 20 97
1251
3 98 3 98 3 95
1261 1271
26 Cornoony Ticker 2015 2016 2017 2015 2019 2020 2021 2022 2023 2024 2025 2026 2027 20216 2029 2030 2031 27 ALLETE Inc 26 Anent Energy Corporation 29 Ameren corporation 30 Arno Corcorabon 31 CMS Energy Corporation 32 DTE Eneigy Conenny 33 El Paso Electro Corry:rimy 34 IDACORP, Inc 35 Northwestern Corporation 36 OGE Energy Coro 37 Otter Tail Corporabon 38 Panacle West Canal Corporation 39 PNM Resources Inc 40 Portland General Beano Cornpany 41 SCANA Corporation 42 Wiseman Energy Corporabon 43 Xcel Energy Inc
7E
ALE LNT AEE AVA Cp
MS
EE IDA
NWE OGE OT7R PNW PNM POR SCG WEC XEL
93 38 61 69 62 51.89 31 69 84 45 92 03 63 87 32 GO 01.69 31 56 53-92 SI 64 9204 53 al 52-34 32 10
$3 57 01 80
, 62 53 01 99 62 03 64 72 02 17 9.4 02 53 09
I 01 78 51 65
1 94 09 01 79 $2 16
1 94 04 1 92 50
62 22
93 76 51 92 02 68 52 10 62 17 65 00 52 32 04 19 53 29 61 87 91 75 0426 91 95 92 29 54 28 62 67 02 34
$3 97 62 05 52 84 6221 62 33 $5 30 52 49 94 35 63 50 31 97 S1 86 01 45 32 12 52 43 94 54 52 64 62 47
94 19 62 18 93 02 02 32 92 50 65 62 62 66 94 53 63 73 62 07 61 97 64 64 52 31 02 55 04 61 53 04 02 60
94 42 92 33 93 20 62 45 62 66 55 96 02 85 94 71 63 97 62 18 92 09 94 84 52 62 62 73 3510 5324 92 74
$4 66 52 47 93 39 62 58 02 87 56 31 03 04 34 91 9422 5229 02 21 $5 05 $2 73 92 89 $5 40 63 45 52 69
04 91 62 63 $3 59 62 71 53 06 96 67 9323 65 12 54 48 32 41 92 34 $529 62 95 63 06 55 71 53 66 63 05
55 18 62 78 63 79 52 56 9325 97 04 53 43 65 36 94 74 62 54 62 47 65 54 63 16 5323 36 CO 53 88 63 22
05 45 52 94 04 00 33 01 53 45 07 43 53 63 55 52 $5 01 62 67 02 61 $5 82 63 36 53 41 56 36 64 11 $3 39
55 74 93 10 94,22 $3 17 63 64 97 83 53 83 $5 91 $5 29 62 81 92 75 96 11 63 56 63 59 08 71 54 33 $3 67
06 05 63 27 $4 44 63 33 33 63 5825 64 04 $6 22 65 57 62 96 92 89 66 44 $3 75 53 78 97 06 64 56 63 76
56 36 33 44 94 68 63 51 04 03 Sie 68 5425 $6 55 is as 63 12 33 04 $6 77 63 95 93 98 67 43 94 80 63 95
66 70 63 62 64 92 63 69 64 25 69 14 64 47 66 89 56 17 $328 33 20 57 13 PI 16 34 19 97 83 55 06 04 16
67 05 63 81 15 18 53 89 04 47 69 62 34 71 5725 56 50 03 45 53 37 57 51 04 37 54 41 $824 $5 32 04 38
67 43 04 01 $5 46 54 09 94 71
510 13 04 96 57 64 $6 84 53 63 $3 55 57 90 04 61 SI 64
- 95 67 95 60 04 61
07 82 9423 65 74 94 31 94 95 910 66 $5 22 65 04 9720 $3 83 53 74 $8 32 64 85 54 89 59 13 55 90 SI 86
43 Protected Annual 44 Diadend Payout Ratio (31] pz in] 1341 1351 361 1371 Pal Pal 1401 1411 (421 (431 (44) (151 1461
45 Ccomany Ticker 2016 2017 2018 2019 2020 2021 2022 2023 2024 2025 2026 2027 2026 2029 2030 2031 46 ALLETE, Inc 47 Allant Energy Corporation 45 Ammon Corporation 49 Aosta corporation 50 CMS Energy Corporatmn 51 DTE Energy Company 52 El Paso Ent. Compony 53 IDACORP, Inc 54 NorthWestem Corporation 55 OGE Energy Corp 56 Otter Tad Corporabon 57 Ponnacle West Copal Corporation 58 PNM Resources Inc 59 Portland Cameral Eledno Cornpony 60 SCANA Corporation 61 Wisconsin Energy Corporabon 62 Xcel Energy Im
ALE LNT AEE AVA CMS DTE EE IDA
NWE OGE OTTR I PNW PNM POR SCG r WEC 1 XEL
,
r 66 00% 62 00% 65 00% 67 CO% 64 00% 62 00% 63 00% 53 00% 63 00% 66 DO% 82 00% 63 00% 51 00% 59 CO% 58 00% 67 61% 62 00%
65 75% 61 75% 6525% 66 50% 63 50% 61 50% 62 00% 54 75% e2 00% 68 00% 77 50% 6326% 52 00% 68 75% 6525% 67 00% 62 OD%
65 50% 61 50% 64 50% 66 00% 63 CO% 61 00% 61 00% 5650% 61 00% 70 00% 73 00% 63 50% 53 00% 56 50% 56 50% 67 CM% 62 OD%
65 25% 6125% 63 75% 65 50% 62 50% 60 50% 60 00% 5525% 00 00% 72 00% 68 50% 63 75% 54 00% 5825% 58 75% 67 00% 62 00%
66 00% 61 00% 63 03% 65 00% 62 00% 60 00% 59 00% 00 00% 59 00% 74 00% WO% 64 00% 55 DO% 58 DO% Se 00% 67 DO% 62 00%
65 31% 61 986. 63 65% 65 31% 62 81% 61 15% 60 31% 61 15% OD 31% 72 81% 64 48% 64 48% 56 96% 59 46% 60 31% 66 90% 62 81%
65 63% 62 96% 6429% 65 63% 113 63% 62 29% 61 63% 62296. 61 63% 71 63% 64966. 64 96% 58 96% 60 96% 61 63% 56 96% 63 63%
65 94% 63 94% 64 94% 66 94% 64 MI% 63 44% 62 94% 83 44% 62 94% 70 44% 65 44% 65 44% 60 94% 62 14% 62 94% 66 94% 64 44%
6626% 64 92% 65 59% 5626% 65 26% 64 59% 6426% 64 59% 64 asx 09 26% 65 92% 65 92% 62 92% 63 92% 6426% 56 92% 65 26%
66 67% 65 90% 6624% 66 57% 66 07% 65 74% 65 57% 65 74% as 57% 68 07% 15640% 66 40% 64 90% 6540% 65 57% 66 93% 66 07%
66 68% 66 86% 66 58% 66 68% 66 58% 65 56% 66 88% 66 68% 66 56% 65 68% 66 88% 66 65% 66 68% 06 88% 0666% 66 86% 66 88%
66 88% 66 88% 66 66% 66 68% 66 88% 66 88% 66 88% 66 61% 66 86% 66 88% 56 ea% 66 58% 66 66% 66 681% 66 88% 66 65% 66 88%
66 88% 66 66% 66 66% 66 66% 66 68% 66 58% 66 68% 66 88% 66 ae% 66 88% 66 88% 06 86% 66 88% 66 88% 66 88% 66 86% 66 86%
66 88% 66 88% 66 86% 66 88% 6655% 66 88% 66 646% 6666% 66 58% 66 86% 66 88% ea 6/5% 66 88% 56 88% 56 88% 66 88% 66 66%
66 68% 66 ea% 66 68% 66 88% 56 88% 66 88% 66 86% 06 66% 56 88% 56 86% 66158% 66 66% 66 88% 66 86% 66 65% 66 65% 66 88%
66 65% 66 88% 66 15% 66 68% 66 $8% 66 68% 96 66% 66 88% 06 88% 66 68% 66 88% 06 66% 6685% 6686% 66 85% 66 65% 66 88%
1631
62 Promoted Annual 63 Cash Flows 1471 146 1491 1501 1511 1521 331 341 1551 1561 1571 r 1591 1601 811 1621
64 Conmany Ticker 2016 2017 2018 2019 2020 2021 2022 2023 2024 2025 2026 2027 2028 2029 2030 2031 Terrunal
Value 65 ALLETE, Inc 66 Anent Energy Corporation 67 Ameren Corporation 68 Ayala Corporation 69 CMS Energy Corporabon 70 DTE Energy Conomny 71 El Paso Electric Cornpony 72 IDACORP, Inc 73 NorthiNestem Corporabon 74 OGE Energy Corp 75 Otter Tail Corporation 76 Pinnacle West Caprtal Corporation 77 PNM Resources Inc 76 Portland General Electric Company 79 SCANA Corporation SO Wisconsin Energy Corporatron 81 Xcel Energy Inc
ALE LNT AEE AVA CMS 016 EE IDA
NWE OGE
OTTR PNW PNM POR SCG WEC XEL
62 35 61 12 91 67 91 33 61 30 $2 92 S1 37 62 13 61 95 61 17 61 36
sa 50 91 31 2a 02 34 91 67 $1 37
52 47 91 19 51 75 61 39 51 38 1305 51 44 62 29 62 CO 3127 51 36 92 70 61 01 51 35 52 49 01 79 91 45
52 60 6126 61 13 61 46 51 47 5323 91 52 $2 46 52 14 51 38 61 36 92 82 51 13 61 42 92 65 91 91 91 53
02 73 91 34 91 92 51 52 91 56 63 40 01 60 92 61 9224 91 49 St 35 92 96 91 25 61 50 62 83 62 C3 $1 61
92 87 61 42 62 02 51 59 61 66 33 57 61 65 62 83 52 34 01 61 91 34 93 10 01 39 51 58 $3 01 92 17 61 70
63 01 91 53 92 16 61 B5 51 60 53 56 $1 63 53 00 62 55 51 67 51 43 6326 61 56 91 72 6326 52 31 91 82
6322 31 65 93 31 91 78 61 95 34 15 51 99 53 19 93 76 61 73 61 52 63 44 61 74 51 86 63 52 $2 45 61 94
$3 41 01 78 3216 91 66 52 10 04 47 52 16 53 40 92 99 61 79 91 62 $3 63 SI 92 92 02 63 60 92 60 92 07
33 61 91 91 32 63 61 99 3225 SI 60 S2 33 $3 63 5322 91 66 91 72 63 83 62 12 92 15 34 09 32 75 6221
$3 82 62 05 62 79 52 11 52 40 65 15 62 51 $3 68 33 47 01 91 91 62 6406 92 31 32 35 54 40 92 90 62 36
64 04 52 19 92 97 6223 32 56 56 52 32 70 34 16 $3 72 91 96 91 93 94 30 62 51 92 53 94 72 $3 05 32 51
54 26 02 33 $3 13 52 35 52 70 8S 81 52 64 5435 $3 92 62 Oe 52 04 St 53 62 64 92 66 34 97 63.21 52 64
54 46 52 42
- 63 29 92 47 62 64 56 11 92 99 04 61 14 13 62 19 62 14 54 77 62 78 92 80 6523 63 35 52 78
04 72 52 55 63 47
92 60 $2 99 56 44 93 15 94 85 64 34 92 31 6226 65 02 62 93 62 95 $5 51 93 56 92 93
34 97 52 65 63 65 92 74 63 15 $6 78 $3 32 55 11 04 57 92 43 62 36 6529 03 08 $3 11 55 60 63 75 $3 09
6523 52 83 53 84 92 88 $3 31 57 13 53 49 as aa 34 82 32 56 62 50 $5 57 $324 6327 $6 11 $3 95 6325
9163 94 $68 61
6120 45 590 37
9103 87 5223 63 0109 47 916560 515098 650 24 978 40
6174 50 9101 56 6102 52 6191 47 3123 73 5101 85
81 Protected Annual Data 82 Investor Cash Flows 1641 65) 1661 1671 1661 1891 1701 pli i72] 1731 Pal P5] F61 1771 PI [79] 1801 (81/
83 Conran lnSal
Taker Outflow 10/14/16 12/31/16 630/17 6/30/18 6/30/19 6/30/20 6/3031 6/30/22 6/30/23 6/30/24 6/30/25 6/30/26 6/30/27 6730/28 630/29 6/30/30 6/30/31 64 ALLETE Inc 85 Allant Energy Commotion 86 Ammon Corporation 87 Aosta Corporation 88 CMS Energy Corporation 89 DTE Energy Company 90 El Paso Electric Compony 91 1D6CORP, Inc 92 NorthWestem Corporabon 93 OGE Energy Corp 94 Otter TM Corporabon 95 Pinnacle West Canal Corporation 96 PNM Resources Inc 97 Portion General Elect= Company 96 SCANS, Corporation 99 Wsconso Energy Corporation
100 Xal Energy Inc
ALE (959 60) 50 OD LNT (638 14) 10 00 AEE (049 12) $0 00 AVA (041 20) 50 DO CMS (941 95) 50 00 DTE (993 35) $0 00 EE (945 64) $0 00
IDA (977 00) 50 00 1OWE ($57 27) $0 00 OGE (631 38) SO 00 OTTR (634 67) 5000 PION (975 68) $0 OD PNM ($32 49) 50 00 POR (042 40) $O 00 SCO (971 42) $0 CO WEC ($59 89) 50 CM XEL (641 17) 60 CO
ID 50 50 24 90 36 $028 6028 50 62 0029 60 46 $0 42 6025 60 29 SO 55 10 19 6027 $0 50 SO 36 5029
92 42 01 15 91 72 it 37 61 34 53 01 St 42 92 18 92 01 $120 61 40 $2 63 30 95 51 31 62 41 61 73 51 41
32 50 $1 26 91 63 01 46 S1 17 $323 91 52 32 46 62 14 91 36 01 36 62 82 91 13 91 42 92 65 Sl91 01 53
62 73 01 34 91 92 61 52 61 56 $3 40 61 60 92 64 6224 61 49 61 35 02 96 0125 51 50 62 63 62 03 01 61
92 91 42 32 02 91 59 91 65 $3 67 91 66 $2163 92 34 61 61 61 34 $3 10 01 39 61 58 $3 01 62 17 61 70
53 04 51 53 32 16 S1 68 91 60 63 86 91 63 63 00 52 66 01 67 91 43 $328 61 56 61 72 $326 62 31 91 82
6322 61 65 62 31 51 78 91 95 04 15 51 99 63 19 32 76 51 73 91 52 33 44 91 74 31 56 33 52 62 45 91 94
93 41 61 78 62 46 51 66 92 10 $4 47 32 16 63 40 62 99 St 79 61 62 53 63 51 92 92 02 93 80 62 60 62 07
92 61 91 91 92 63 61 159 92 25 34 60 32 03 63 63 6322 61 55 51 72 33 63 92 12 62 18 64 09 62 75 32 21 -N
63 82 62 05 92 79 92 11 62 40 55 15 92 51 63 66 $3 47 01 91 91 52 94 06 32 31 62 35 54 10 92 93 92 36
94 04 $2 19 62 97 6223 62 56 95 52 32 70 64 16 $3 72 $1 98 61 93 04 30 92 51 62 53 04 72 $3 05 62 51
S426 62 30 $3 13 62 35 92 70 16 81 62 64 64 38 53 92 9206 92 04 94 53 62 64 62 66 04 97 63 21 92 64
94 48 92 42 03 29 92 47 52 64 96 11 52 99 34 61 04 13 92 19 62 14 64 77 92 78 62 80 6523 53 38 62 78
94 72 52 55 53 47 $2 00 32 99 06 44 53 16 54 65 04 34 52 31 62 26 55 02 92 93 92 95 55 51 $3 56 32 93
$4 97 92 68 $3 65 62 74 92 15 06 78 93 32 $5 11 94 57 92 43 32 36 0529 63 08 53 11 65 80 53 75 $3 09
6169 16 991 43 6124 29 69325
6107 18 9230 76 6112 96 6173 98 0155 79 682 79 380 90
0180 07 9104 90 9105 79 9197 57 8127 67 5105 10
Schedule RBH-2
Page 12 of 20 763

PUC Docket No. 46449 EXHIBIT RBH-2
Page 13 of 20
Line 7 ino.t. Multhstege Groat Dacounted Cad, Flow Model
30 Day Average Stock Pnce Low EPS Grow4h Rate Estimate in Feat Stage
111 121 131 141 151 161 171 161 191 ri oi 1111 1121 1131 2 Stock EPS Growth Rate Esbrnates Long-Tenn Payout Rabo tterative Solution Temenal Terinnal
Value Low 3 Company Ticker Pnce Zecks First Cell Line Growth Growth 2016 2020 2026 Proof IR R PIE Rabo PEG Ratio 4 ALLETE Inc ALE 559 60 5 50% 5 00% 4 00% 4 00% 5 27% 66 00% 65 00% 65 88% ($0 00) 10 19% 20 97 3 98 5 Mont Energy Corporation LNT 638 14 6 10% 6 60% 6 CO% 6 CO% 5 27% 62 00% 61 00% 66 88% (50 00) 15 9914 20 97 3 98 6 Armen Corponition AEE 949 12 6 10% 5 20% 6 00% 5 20% 527% 66 00% 63 00% 66 88% (SO 00) 9 40% 20 97 3 98 7 Ayala Corporation AVA $1120 5 30% 5 00% 5 00% 5 CO% 5 27% 67 00% 65 00% 66 88% ($0 00) 8 32% 20 97 3 98 8 CMS Energy Corporation CMS $41 94 6 80% 7 27% 6 00% 6 00% 5 27% 6400% 62 00% 66 88% (50 00) 9 18% 20 97 3 98 9 DTE Energy Company DTE 693 34 5 80% 5 51% 6 00% 5 51% 5 27% 62 00% 80 00% 66 88% (90 00) 9 35% 20 97 3 98 10 El Peso Electric Company EE $45 64 4 40% 7 00% 2 50% 2 50% 5 27% 63 00% 59 00% 68 88% (SO 00) 6 91% 20 97 3 98 11 !MCORP, Inc IDA 977 00 4 00% 4 00% 3 00% 3 00% 5 27% 53 00% 6000% 66 88% (SO 00) 8 23% 20 97 3 98 12 Northwestern corporation NWE 56727 5 00% 5 OD% 6 50% 5 00% 5 27% 63 00% 59 00% 66 88% (60 00) / 9 59% 20 97 3 98 13 OGE Energy Com OGE $61 38 5 20% 4 30% 3 00% 3 00% 5 27% 66 00% 74 00% 66 68% (SO 03) 9 26% 20 97 3 98 14 Otter Tail Corporation OTTR 934 67 NA 6 00% 6 00% 6 00% 5 27% 82 00% 64 00% 66 86% ($0 00) 9 36% 20 97 3 96 15 Portnacle Weet Camtal Con:aeon PNW 975 68 4 30% 3 95% 4 00% 3 95% 5 27% 63 00% 64 00% 66 86% (SO 00) 9 25% 20 97 3 98 16 PNM Resources, Inc PNM 63249 6 70% 5 OD% 9 00% 5 90% 5 27% 51 00% 55 00% 66 86% (60 00) 9 91% 20 97 3 98 17 Portlend General Electnc Company POR $42 40 6 CO% 5 90% 5 50% 5 50% 5 27% 59 00% 58 00% 66 68% (30 00) 9 36% 20 97 3 98 10 SCANA Corporation SCO 071 41 5 50% 6 00% 4 50% 4 50% 5 27% 58 00% 59 00% 66 68% (60 00) 9 72% 20 97 3 98 19 Wisconstn Energy Corporabon WEC 959 89 6 20% 6 72% 6 00% 6 00% 5 27% 67 00% 67 00% 66 88% (SO 00) 7 92% 20 97 3 98 20 Xcel Energy Inc XEL $41 17 5 40% 5 34% 5 50% 5 34% 5 27% 62 00% 62 00% 66 88% ($0 00) 9 91% 20 97 3 96 21 DCF Result 22 Mean 9 14% 20 97 3 98 23 Mao 10 19% 20 97 3 9a 24 Min 6 91% 20 97 3 98 25 Prowded Annual
Earnings per Shere 1111 1151 061 071 [181 [191 [20] ]211 1221 [23] 1241 1251 1261 1271 1281 [29] Pol
26 Coriaany Ticker 2016 2016 2017 2018 2019 2020 2021 2022 2023 2024 2025 2024 2027 2028 2029 2030 2031 27 ALLETE, Inc ALE 93 361 t 63 52 93 66 93 80 $3 95 64 11 64 29 9446 $4 68 04 91 $5 16 $5 43 95 72 56 02 06 34 06 67 07 02 28 Allent Energy Corporation LNT 91 69 i 61 79 91 90 92 01 $2 13 9226 $2 39 $2 53 62 68 92 82 92 98 $3 13 $3 30 03 47 $3 65 $3 85 $4 05 29 Arneren Corporation AEE 9238 g 92 50 92 63 92 77 52 92 93 07 93 23 03 10 93 57 93 76 93 96 $4 17 $4 39 9.4 62 94 86 05 12 95 39 30 Ansta Corporation AVA 31119 6 91 98 92 08 02 19 92 30 92 41 02 53 $2 66 92 80 92 94 93 10 03 26 6343 $3 62 53 81 94 01 5422 31 CMS Energy Corporation CMS St 89 $2 00 52 12 $2 25 92 39 92 53 52 68 $2 83 63 99 33 16 93 33 9350 $3 69 93 68 $4 09 $4 30 $4 53 32 DTE Energy Company DTE $4 45 $1 70 54 95 0523 $5 51 $5 82 $6 14 66 47 $6 82 97 18 57 57 97 97 $8 39 $8 83 $929 $9 78 $10 30 33 El Paso Electra Company EE 02 03 92 06 $2 13 32 19 9224 52 30 $2 36 92 45 $2 54 92 65 $2 78 32 93 93 co 6321 P 11 $3 59 $3 78 34 IDACORP, Inc IDA 93 87 93 99 54 11 34 23 04 36 5449 94 64 04 81 $5 01 9524 55 49 $S 78 06 09 $6 41 66 75 97 10 $7 46 35 Northwestern Corporation NWE 52 90 $3 OS $320 33 36 93 52 03 70 93 89 9409 94 30 34 52 $4 75 $5 01 $527 05 55 95 64 $6 15 $6 47 36 OGE Energy Corp OGE 5169 $1 74 31 79 91 85 91 90 51 96 92 03 52 10 $2 19 32.29 92 40 92 53 $2 86 02 80 $2 95 53 10 $327 37 Otter Tall Contorabon orm 91 56 $1 65 $1 75 91 86 $1 97 92 09 $221 $2 34 92 47 92 61 92 75 $2 89 93 04 $3 20 $3 37 63 55 $3 74 38 Pinnacle West Capital Cornorabon PNW 33.92 $4 07 $424 94 10 94 58 94 76 $4 96 $5 17 95 11 $5 67 $5 96 5628 96 61 96 95 $7 32 97 71 68 11 39 PhIM Re000rces, Inc PNM 51 64 $1 74 91 64 01 95 92 06 62 18 92 31 $2 41 92 58 92 72 92 87 03 02 63 18 6.3 34 53 52 93 71 P 93 40 Portland General Electnc Company POR 52 04 52 15 32 27 52 10 62 53 $2 67 $2 81 92 96 $3 12 5329 $3 47 93 65 93 84 $4 04 $4 26 34 48 34 72 41 SCANA Corporation SCG $3131 93 98 14 16 $4 35 54 54 $4 75 04 97 9520 $5 16 55 73 $6 03 $535 6660 $7 03 97 40 97 79 $a zo 42 Wisconson Energy Corporation WEC 02.34 $2 48 $2 63 52 79 92 95 93 13 03 32 $3 51 63 70 03 91 $4 12 $4 34 6.4 57 $4 81 95 06 $5 33 95 61 43 Xcel Energy Inc XEL 02 10 $2 21 $2 33 $2 45 52 59 $2 72 92 87 $3 02 93 18 $3 35 53 53 93 71 53 97 $4 12 $4 33 34 56 $480
43 Protected Annual 44 Dividend Payout Ratio 1311 1321 1331 [3/] [35] [36] [37] 1381 [391 [401 (41) (42) [131 [44] (45) [461
45 Company Taker 2016 2017 2018 2019 2020 2021 2022 2023 2024 2025 2026 2027 2028 2029 2030 2031 46 ALLETE, Inc ALE 66 00% 65 75% 65 50% 65 25% 65 00% 05 31% 6563% 65 94% 66 26% 66 57% 66 88% 66 88% 66 68% 66 88% 66 86% 66 66% 47 Allant Energy Corporabon LNT 62 00% 61 76% 61 50% 61 25% 61 00% 61 98% 62 96% 63 94% 04 92% 65 90% 66 88% 66 88% 66 68% 66 88% 66 66% 66 88% 48 Ameren Corporation AEE 66 00% 6525% 64 50% 63 75% 63 00% 63 65% 6429% 64 94% 65 59% 6621% 66 88% 66 88% 66 65% 66 88% 66 88% 86 65% 49 Mists Corporation AVA 67 00% 06 50% 66 00% 65 50% 65 00% 65 31% 65 63% 65 M% 6626% 66 57% 66 88% 66 88% 66 88% 66 86% 66 88% 66 88% 50 CMS Energy Corporatan CMS 64 OM 63 50% 63 00% 62 50% 62 00% 62 61% 6363% 64 44% 65 26% 66 07% 66 88% 66 86% 05 88% 66 86% 66 86% 86 88% 51 DTE Energy Company DTE 62 00% 61 50% 61 00% 60 50% 60 00% 61 15% 6229% 63 44% 64 59% 65 74% 66 88% 66138% 66 88% 8565% 66 88% 66 88% 52 El Psso Elecbm Company EE 63 00% 62 OM 61 00% 60 CO% 59 00% 60 31% 61 63% 62 94% 64 20% 65 57% 66 18% 66138% 66 88% 66 88% 46 86% 86 08% 63 1DACORP, Inc IDA 53 00% 54 75% 56 50% 58.25% 60 OD% 61 15% 62 29% 6311% 64 59% 65 74% 66 86% 66 88% 66 88% 66 63% 66 88% 66 86% 54 NorthWestern Corporabon NWE 83 00% 62 00% 61 CO% 60 00% 59 00% OD 31% 61 63% 6294% 6428% 65 sm 66 813% 66 88% 66 66% 66 63% 66 66% 66 66% 55 OGE Energy Corp OGE 86 00% 66 00% 70 00% 72 00% 74 00% 72 81% 71 63% 70 44% 8926% 9807% 66 88% 86115% 66 88% 66 88% 66 88% 66 am 56 Otter Tail Comoreben OTTR 82 00% 77 50% 73 00% 68 50% 61 00% 64 48% 64 96% 65 44% 65 92% 66 10% 66 88% 66 Mt% 66 M% 66 88% 66 88% 68 88% 57 Pinnacle West Cepkal Corporation 63 00% 63 25% 63 50% 63 75% 64 00% 64 48% 64 96% 65 44% 65 92% 66 40% 66 86% 66 85% 66 88% 66 86% 66 88% 86 66% 58 P141/1 Resources, Inc PNM 51 00% S2 00% 53 00% 54 00% 55 00% 56 96% 58 96% 60 94% 62 92% 64 90% 6666% 66 86% 66 88% 66 88% 06 88% 66 88% 59 Portland General El.:Mc Company POR 59 00% 58 75% 58 50% 58 26% SS OM 59 48% 60 96% 62 44% 63 92% 65 40% 66 63% 66 88% 66 88% 66 88% 66 68% 66 643% 60 SCANA Corporatan SCG 58 00% 58 25% 58 50% 58 75% 59 00% 60 31% 61 63% 62 94% 64 26% 65 57% 66 88% 66 88% 66 88% 66 88% 66 86% 66 86% 61 Waconsin Energy Corporation WEC 67 CO% 67 00% 67 00% 67 00% 67 CO% 86 98% 66 96% 66 94% 66 92% 66 90% 06 88% 66 88% 66135% 66 88% 661113% 06 88% 62 Xcel Energy Inc XEL 62 00% 62 00% 62 CO% 62 00% 62 00% 62 81% 63 63% 64 44% 6526% 66 07% 66 86% 66 88% 66 86% 66 66% 66 88% 66 88%
62 Protected Annual 63 Cash Flows 1471 1181 1891 [50] 1511 1521 1531 1541 1551 [561 157/ 1561 1591 P6] 1611 1621 1631
Terminal 64 Company Ticker 2016 2017 2018 2019 2020 2021 2022 2023 2024 2025 2026 2027 2028 2029 2030 2031 Value 65 ALLETE, Inc ALE 92 32 $2 40 63 49 52 58 92 67 92 ao 92 94 93 09 $3 25 53 43 93 63 03 62 04 03 94 21 04 46 $4 70 611725 05 Agent Energy Coepoiktron LNT 91 11 91 17 9124 $1 31 91 38 91 48 91 59 91 71 31 83 51 98 02 09 $221 02 32 92 44 $2 57 92 71 $154 93 67 Arneren Corporatan AEE 51 65 91 72 91 79 91 86 91 93 92 05 52 18 52 32 92 47 92 62 $2 79 52 93 03 09 $325 $3 12 93 60 $112 99 68 Ayala Corporation AVA 91 33 91 39 61 44 91 50 51 57 61 65 $1 75 51 85 $1 95 92 06 92 18 92 30 52 42 92 55 52 66 62 82 966 46 69 CMS Energy Corporation CMS 51 28 91 35 91 42 61 49 51 57 61 88 $1 60 91 93 $2 06 9220 52 34 32 47 92 60 92 73 $2 88 P 03 994 98 70 DTE Energy Comosny DTE $2 91 P 05 93 19 $3 31 03 19 $3 75 $403 04 33 64184 94 97 55 33 $5 61 95 90 9022 66 54 90 89 $215 99 71 El Paso Elecbx Cornpany EE 61 31 91 32 $1 33 61 31 $1 38 61 43 91 51 $1 60 $1 70 51 82 91 96 $2 06 $2 17 9228 $2 10 52 53 $79 33 72 IDACORP. Inc IDA 02 11 52 25 92 39 52 51 53 89 92 84 P 00 93 18 93 38 03 61 53 87 6.4 07 5429 94 51 $4 75 05 00 9156 64 73 NorthWeetern Coiporabon NWE 51 92 $1 98 92 05 92 11 92 18 92 34 92 52 52 70 92 90 93 12 53 35 53 52 $3 71 93 91 64 11 6.4 33 5135 73 74 OGE Energy Corp OGE 31 15 51 22 5129 91 37 91 45 51 47 51 51 51 54 61 58 $1 63 $1 69 61 78 91 87 91 97 $2 08 52 18 668 49 75 Otter Tail Corporebon OTTR 91 36 61 36 51 36 91 35 61 34 91 43 61 52 51 62 61 72 61 82 91 93 $2 01 92 14 92 26 52 38 32 50 978 40 76 Pinnacle West Capital Corporabon 77 PNM Resources, Inc
PNW
PNM 62 57 92 68 92 80 92 92
90 6096 89 91 03 $1 11 $3 05
9120
93 20
$1 32
$3 36
91 41
$3 54
51 57 77 63 96
$1 86
5420
92 02 04 42 62 12
64 65
0224
94 90
92 36
$5 16
92 45 3543
52 61
917016
381 83 78 Portend General Electra Company POR 91 27 61 33 51 10 91 47 $1 55 91 67 91 81 61 95 92 10 6227 92 41 52 57 92 70 02 85 P 00 93 16 998 94 79 SCANA Corporation SCG 62 31 $2 12 92 54 92 67 52 80 63 OD 93 21 53 44 93 68 53 95 94 21 94 17 $4 70 94 95 35 21 55 19 9172 06 80 Wisconsin Energy Corporation WEC $1 66 51 76 51 67 $1 96 02 10 92 22 92 35 $2 46 92 62 $2 76 92 90 63 05 6321 66 38 33 56 03 75 6117 59 SI Xcel Energy Inc XEL $1 37 51 44 91 52 91 60 51 69 91 80 61 92 22 05 92 19 52 33 $2 18 62 61 92 75 92 90 6305 53 21 $100 70
81 Protected Annual Data 82 Investor Cash Flows [641 1651 1661 1671 [681 [69] f70/ 1711 [721 [73] [741 1751 1761 [771 1781 [79] PM P11
Intel 63 Company Trcker Outflow 10/14/16 12131/16 6/30/17 6/30/18 6/30/19 6130/20 6/30/21 6/30/22 6/30/23 6/30/24 6/30/25 6/30/26 630/27 6/30/28 6/30r29 6/30/30 6/3061 64 ALLETE, Inc ALE ($59 61) 60 CO $0O 50 62 37 62 19 $2 58 92 67 52130 $2 94 53 09 6325 53 43 93 63 93 82 94 03 542/ 6446 6151 95 85 Anent Energy Corporation LNT (936 14) 90 DO $O 24 61 14 $124 $1 31 $1 38 91 48 61 59 $1 71 SI 83 61 96 52 09 0221 02 32 52 44 $2 57 667 61 86 Arneren Corporation AEE ($49 12) SO DO SO 35 61 70 $1 79 91 86 91 93 92 05 12 18 52 32 $2 47 52 62 52 79 52 93 $3 03 03 25 93 42 6116 60 87 Aust. Corporation AVA ($11 20) 60 00 90 28 61 36 $1 44 91 50 61 57 61 65 61 75 $1 85 51 95 $2 06 62 18 92 30 $2 42 62 55 52 88 35120 88 CMS Energy Corporation CMS (641 95) 90 00 3027 61 32 61 12 91 49 61 57 SI 68 91 80 61 93 32 06 $2 20 62 34 6247 52 60 $2 73 52 88 $98 01 89 DTE Energy Company DTE (993 35) SO 00 3062 $2 99 63 19 53 34 93 49 63 75 54 03 54 33 64 64 94 97 35 33 95 al 55 90 96 22 36 54 $222 87 OD El Paso Electric Company EE (515 64) 90 00 0028 91 33 $1 33 91 34 $1 36 $1 43 61 51 $1 60 91 70 61 82 51 96 $2 OS 92 17 5228 92 40 951 86 91 IDACORP, Inc IDA (S77 00) 30 00 SO 45 52 14 $2 39 52 54 92 09 $2 84 $3 00 53 18 93 38 63 61 03 87 54 07 54 29 $4 51 94 75 9161 54 92 . Northwestern Corporabon NWE (557 27) SO 00 60 41 51 97 52 05 52 11 52 18 92 34 $2 52 62 70 $2 90 63 12 53 35 63 52 63 71 $3 91 $4 11 5140 06 93 OGE Energy Corp OGE ($31 38) SO 00 SO 25 $1 17 5129 $1 37 91 45 91 47 $1 51 91 54 $1 58 61 63 91 09 $1 78 61 117 $1 97 52 06 570 67 94 Otter Tail Corporation OTTR (634 67) SO CO 60 29 91 40 91 36 $1 35 31 34 91 43 91 52 91 62 $1 72 $1 82 $1 93 52 04 62 14 6226 52 38 980 90 95 Pinnacle West Capital Corporation PNW (S75 68) 00 00 SO 55 52 62 52 80 92 92 93 05 9320 53 36 53 51 03 74 93 96 5420 04 42 04 65 64 90 95 16 9175 59 96 PNM Resources, Inc PNM (932 49) 60 CC SO 19 SO 91 61 03 91 11 6120 51 32 61 44 $1 57 91 71 61 86 92 02 52 12 02 24 52 36 32 48 $61 44 97 Portland General Electra Company POR (542 40/ 00 00 0027 51 30 91 40 61 47 61 55 61 67 61 81 91 95 92 10 52 27 62 11 92 57 62 70 92 85 $3 00 5102 10 98 SCANA Corporatan SCG (571 42) W 00 60 49 62 36 92 54 62 67 12 80 03 00 9321 $3 44 53 68 63 95 $424 5447 54 70 64 95 9521 5177 54 99 Wisconsin Energy Corporation WEC (359 89) SD 00 00 36 51 71 61 87 51 98 62 10 52 22 92 35 52 48 62 62 92 76 $2 90 63 05 93 21 93 38 63 56 9121 34
100 Xcel Energy Inc XEL (941 17) SO DO $0629 $1 41 31 52 $1 60 51 69 91 60 61 92 32 05 52 19 92 33 92 46 $2 61 $2 75 32 90 93 OS 0103 91
Schedule RBH-2
Page 13 of 20 764

PUC Docket No. 46449 EXHIBIT RBH-2
Page 14 of 20
111 121 131 141
Mulb-Stage Gr050151 Discounted Cash Row Model 90 Day Average Stock Pace
Average EPS Gm." Rate Esarrale In Fret Stage
151 181 171 151 191 1101 1111 1121 1131 Stock EPS Growth Rate Estmertes Long-Tenn Payout Raho Oman. Solution Ternsnal Terminal
Value Ticker Price Las First Call Line Average Growth 2010 2020 2026 Proof IRR P/E Rato PEG Ratio ALE 66127 5 50% 510% 4 00% 4 83% 5 27% 66 00% 65 00% 66 55% (50 00) 10 45% 20 97 3 98 LNT $38 96 6 10% 6 60% 6 00% 6 23% 5 27% 62 00% 61 00% 66 NB% (SO 00) 8 93% 20 97 3 98 AEE 550 76 8 10% 5 20% 6 00% 5 77% 5 27% 66 00% 63 00% 66 88% (SO 00) 9 44% 20 97 3 98 AVA $4224 5 30% 5 00% 5 00% 5 10% 5 27% 67 OD% 6503% 66 50% ($0 00) 8 65% 20 97 3 98 CMS 643 35 6 60% 7 27% 6 00% 6 62% 5 27% 64 00% 62 00% 66 88% (90 00) 9 24% 20 97 3 95 DTE $9520 5 50% 5 51% 6 00% 5 77% 5 27% 62 DO% 60 00% 6665% (30 00) 9 32% 20 97 3 98 EE 546 22 4 40% 7 00% 2 50% 4 63% 5 27% 63 00% 59 00% 66 Se% 130 00) 5 06% 20 97 3 95 IDA $77 91 4 00% 4 00% 3 00% 3 67% 5 27% 53 00% 60 00% 66 Se% (5060) 8 53% 20 97 3 98 NWE $59 41 5 00% 5 00% 6 50% 5 50% 5 27% 63 00% 59 00% 66 515% (90 00) 9 55% 20 97 3 98 OGE $31 43 5 20% 4 30% 3 00% 4 17% 5 27% 06 00% 74 00% 66 65% 150 00) 9 97% 20 97 3 96 OTTR $34 02 NA 6 00% 6 00% 6 00% 5 27% 52 00% 64 00% 66 SS% (50 00) 9 53% 20 97 3 98 PNW $77 37 4 30% 3 55% 4 00% 4 05% 5 27% 63 CO% 64 00% 05 88% (50 00) 9 13% 20 97 3 96 PNM $33 36 6 70% 5 90% 9 00% 7 20% 5 27% 51 00% 55 00% 66 56% (SO 00) 10 45% 20 97 3 98 POR $42 94 6 00% 5 90% 5 50% 5 80% 5 27% 59 00% 58 00% 66 68% (SO 00) 9 43% 20 97 3 95 SCG 572 51 5 50% 6 00% 4 50% 5 33% 5 27% 58 00% 59 OD% 86 88% (30 OD) 10 09% 20 97 3 98 WEC $62 04 6 20% 6 72% 6 00% 6 31% 5 27% 67 OD% 67 DO% 66 88% (90 00) 7 55% 20 97 3 96 XEL $42 49 5 40% 5 34% 5 50% 5 41% 5 27% 62 00% 62 00% 66 135% (SO 001 9 66% 20 97 3 95
DCF Result Mean 9 31% 20 97 3 98
Max 10 45% 20 97 3 95 Min 7 05% 20 97 3 95
41 [15] 1161 117] 11151 5191 120) 121) 1221 [231 124/ [251 1261 1271 1281 1291 1301
Ticker 2015 2016 2017 20113 2019 2020 2021 2022 2023 2024 2025 2026 2027 2025 2029 2030 2031 ALE 5356 t $3 54 $3 71 $3 89 54 05 54 213 5449 54 71 54 95 5521 $5 45 16 77 56 07 96 39 $6 73 $7 015 $7 45 LNT 51 69 [ $1 80 $1 91 52 03 52 15 5229 52 43 $2 57 $2 72 52 87 53 02 $3 15 $3 35 53 53 53 72 $3 91 94 12 AEE 9238 , $2 52 62 86 52 82 92 98 $3 15 53 33 53 52 33 71 53 91 54 12 94 34 54 57 94131 15 06 $5 33 55 61 AVA 51 09 $1 99 32 OP 02 19 92 31 $2 42 52 55 92 68 92 82 $2 97 33 12 $3 29 53 46 53 64 53 63 54 04 9425 CMS 51 59 52 02 52 15 $229 52 44 $2 60 92 77 $2 94 $3 12 33 30 $3 48 $3 06 53 85 64 06 5427 64 50 54 73 DETE 64 45 54 71 54 95 6527 $5 57 15 89 3623 $6 57 56 94 97 32 $7 71 55 11 $6 54 $8 99 59 47 $9 97 510 49
$2 03 $2 12 52 22 52 33 52 43 52 55 52 67 52 80 52 93 53 08 5324 33 41 53 59 $3 75 $3 96 54 19 94 41 IDA $3 67 $4 01 54 16 94 31 $4 47 $4 63 5482 65 02 15 24 $5 49 $5 77 56 07 $6 39 96 73 $7 08 $7 46 $7 85 NWE 92 90 $3 06 3323 53 41 93 59 33 79 54 00 5421 94 44 $4 68 $4 93 $5 19 $5 46 $5 75 56 05 56 37 56 71 OGE $1.69 51 76 51 53 51 91 91 99 52 07 92 16 5226 52 37 52 45 52 61 $2 rs 52 59 $3 05 $3 21 $3 38 $3 55 OTTR VI 56 51 65 51 75 51 86 51 97 $2 09 3321 52 34 52 47 $2 61 $2 75 52 59 50 04 5320 53 37 33 55 53 74 PNW 3392 54 05 $4 25 54 42 54 60 54 79 64 99 $522 35 46 15 73 $6 02 $6 34 56 67 97 02 37 39 $7 78 58 19 PNM 91 64 51 76 51 65 52 02 52 17 52 32 52 45 52 64 52 SI 92 98 53 14 93 31 63 48 53 67 33 06 $4 06 5426 POR 82,04 92 16 62 28 $2 42 $2 56 $2 70 52156 5302 33 19 13 36 33 54 53 73 33 92 54 13 64 35 54 58 94 52 SCG 33 54 01 94 23 94 45 94 69 $4 94 $5,20 65 45 $5 77 $6 08 $6 40 $6 73 97 09 97 46 57 86 90 27 SS 71 WEC 9234 52 49 32 64 52 81 52 99 53 18 33 37 33 57 53 75 $3 S9 54 21 54 43 54 67 54 91 55 17 55 44 55 73 XEL 92 10 62 21 62 33 $2 46 92 59 $2 73 52 53 $3 04 33 20 53 37 33 55 53 73 53 93 94 14 94 36 64 59 64 83
Line No 1 Inputs 2
3 Company 4 ALLETE, Inc 5 Allant Energy Corporation 6 Arneren Corporation 7 Avis. Corporaton 8 CMS Energy Corporation 9 DTE Energy Conoeny 10 El Paso Elect. Company 11 1DACORP, Inc 12 Northwestern Corporation 13 OGE Energy Corp 14 Otter Tall Corporation 15 Pinnacle West Capita Corporaton 16 PNM Resources Inc 17 Portland General Denim Company 18 SCANA Corporation 19 Wisconsin Ene197 Cciptealmn 20 Xcel Energy Inc 21 22 23 24 25 Propected Annual
Eernings per Share
26 CornIsanv 27 ALLETE, Inc 28 Alhant Energy Corporation 29 Armen Corporation 30 AVMs Corporation 31 CMS Energy Corporetron 32 DTE Energy Conoany 33 El Paso Electric Company
E
34 IDACORP, Inc 35 NorthWestern Comorabon 36 OGE Energy Corp 37 Otter Tail Corporston 36 Prnnacle West Caplet Corporation 39 PNM Resources, Inc 40 Portland General Menton Company 41 SCANA Corporation 42 Wisoonsin Ellett!), Corporation 43 Xcel Energy Inc
43 Prqeded Annus! 44 Dindend Payout Ratio
45 Company Ticker 46 ALLETE, Inc ALE 47 Mart Energy Corporation LNT 48 Amer. Corporation AEE 49 AvIsta Corporaton AVA 50 CMS Energy Corporation CMS 51 DTE Energy Conan), DTE 52 El Paso Electro Company EE 53 IDACORP, Inc IDA 54 Northwestem Corporation NWE 55 OGE Energy Corp OGE 56 Otter Teul Corporabon OTTR 57 Pinnacle West Capital Corporaton PNW 50 PNM Resources, Inc PNM 59 Portland General Electnc Company POR 60 SCANA Corporation SCG 61 Weconsin Energy Corporation
WXEELC 82 Xcel Energy Inc
P11 1521 [331 [54] 1351 1561 [371 1361 1391 1401 l411 [42] [43] [441 [451 (461
2016 2617 2018 2019 2020 2021 2022 2023 2024 2025 2026 2027 2026 2029 2030 2031
1 1i
66 66% 65 75% 65 50% 6525% 65 00% 65 31% 65 63% 65 94% 66 26% 66 57% 88 85% 66 85% 66 85% 66 88% 6668% 66 88% 62 00% 61 75% 61 50% 61 25% 61 CO% 61 95% 62 96% 63 94% 64 92% 65 90% 66 85% 66 85% 68135% 66 85% 66 68% OS 85%
6525% 64 50% 63 75% 63 OD% 63 05% 64 29% 64 94% 65 59% 6624% 66 88% 86 85% 66 88% 66 at% 60 55% 66 55%
67 88 MOO: 66 50% 6600% e5 50% 65 00% 65 31% 6563% 65 94% 6626% 66 57% 66 85% 66 88% 66 88% 66 68% 66 65% 66 88% 64 00% 63 50% 63 CO% 62 50% 62 00% 62 81% 63 63% 64 44% 65 26% 66 07% 6665% 66 SS% 66 86% 6655% 66135% 66 88% 62 00% 61 50% 61 CO% 60 50% 60 00% 61 15% 6229% 63 44% 6459% 65 74% 66 88% 66 88% 66 88% 66 65% 66 86% 66 85% 63 00% 82 00% 61 OM 60 00% 59 CIO% OD 31% 61 63% 62 94% 6426% 65 57% 6688% 66 68% 66 65% 86 85% 66 85% 66 55% 53 00% 54 75% 56 50% 5625% 60 CO% 61 15% 6229% 63 44% 64 59% 65 74% 66 5115% 06 55% 00 88% 66 86% 66 88% 66 88% 63 00% 62 00% 61 00% 60 OD% 99 00% 60 31% 61 63% 62 94% 6426% 65 57% 66 55% 06 55% 66 55% 05 85% 66 65% 66 85% 66 00% 65 CO% 70 DO% 72 00% 74 00% 72 81% 71 63% 70 44% 6926% 60 07% 66 56% 66 80% 86 65% 66 68% 66 88% 66 58% 52 00% 77 50% 73 00% 68 50% 64 00% 64 48% 64 96% 65 44% 65 92% 66 40% 66 86% 66 55% 66 58% 66 65% 66 88% 86 85%
1 63 00% 63 25% 63 50% 63 75% 64 CIO% 64 45% 64 96% 65 44% 65 92% 66 40% 66 85% 66 65% 66 68% 06 55% 66 88% 66 88% 51 00% 52 00% 53 00% 54 CO% 55 DO% 56 95% 56 96% 60 94% 62 92% 64 9:)% 66 88% 66 85% 66 58% 06 65% 66 55% 66 86%
l 59 00% 58 75% 56 50% 58 25% 58 00% 59 48% 60 96% 62 44% 63 92% 65 40% 06 55% 66 88% 66 NM 66 813% 66 88% 66 68%
I
58 00% 5825% 58 50% se 75% 59 00% 60 31% 61 63% 62 94% 6426% 65 57% 66 613% e6 SS% 56 88% 66 58% 66 ea% 05 88% 67 00% 67 00% 67 00% 67 00% 67 00% 66 95% 66 96% 66 94% 6692% 66 90% 66 85% 66 65% 66 88% 66 88% 66 88% 66 66% 62 DO% 62 CO% 62 DO% 62 DO% 62 00% 62 01% 63 63% 64 44% 65 26% 66 07% 66 65% 66 85% 66 66% 66 65% 66 56% 66155%
62 Projected Annual 63 Cash Flows
64 Company Ticker 65 ALLETE Inc ALE 66 Albert Energy Corporator LNT 67 Ameren Corporation "AEE 85 Avis. Corporaton AVA 69 CMS Energy Corporation CMS 70 DTE Energy Company DIE 71 El Paso Electric Company EE 72 1DACORP, Inc IDA 73 NorthWestern CorponMon NWE 74 OGE Energy Corp OGE 75 Otter Tail Corporabon OTTR 76 Pinnacle West Capital Corporation PNW 77 PNM Resources, Inc PNM 78 Portland General Electnc Company POR 79 SCANA Corporation SCG 50 Wisconsin Energy Corporation WEC 51 Xcel Energy Inc XEL
[471 1461 1491 1501 [511 1521 1531 (541 1551 1561 1S71 1561 1591 1601 [611 [62] 1631 Terminal
2016 2017 2018 2019 2020 2021 2022 2023 2024 2025 2026 2027 2028 2029 2030 2031 Value 62 34 $2 44 52 55 92 e6 52 78 52 93 $3 09 53 27 $3 45 53 65 $3 56 $4 06 9427 S4 50 54 74 $4 99 $156 32 $1 11 51 18 61.25 S1 32 51 39 61 50 51 62 51 74 $1 86 51 99 $2 13 52 24 $2 36 33 46 92 62 92 75 156 34 61 66 91 74 91 62 $1 90 51 98 92 12 3326 92 41 S2 57 02 73 52 90 33 05 53 22 $3 39 $3 56 $3 75 $117 64 51 33 $1 39 61 45 51 51 $1 58 61 66 51 76 51 86 91 96 $2 66 5220 62 31 S244 $2 06 62 70 62 84 $59 09 6129 $1 36 91 44 S1 53 $1 61 $1 74 $1 87 $2 01 33 15 33 30 62 45 62 56 $2 71 92 136 33 01 63 17 599 25 52 92 3305 5321 53 37 63 53 33 81 94 10 94 40 54 72 $5 07 55 43 95 71 66 01 $6 33 56 67 $7 02 $220 01 51 34 61 38 31 42 $1 46 $1 50 $1 61 01 72 61 85 51 98 92 13 9228 $2 40 52 53 52 66 $2 SO $2 95 $92 65 52 13 $225 $2 44 33 60 52 78 62 94 33 13 53 33 53 55 53 79 64 06 5427 $4 50 54 74 54 99 $5.25 6164 59
S oe 92 18 $224 62 41 52 60 $2 80 53 01 $3 23 63 47 53 65 53 85 54 05 64,26 34 49 $14065
S11 93 52OD
16 9125 91 34 $1 43 61 53 91 57 $1 62 $1 67 $1 72 21 75 51 U 61 93 52 64 62 14 $226 92 38 974 51 91 36 $1 38 51 36 $1 35 51 34 $1 43 31 52 51 62 $1 72 $1 62 S1 93 62 04 62 14 92 26 52 38 52 56 978 40 92 57 52 89 52 81 $2 93 $3 06 53 22 $3 39 33 57 53 78 $4 00 94.24 54 46 54 70 54 94 55.21 5.5 48 $171 80 $O 90 50 96 $1 07 91 17 51 28 51 41 $1 56 51 71 $1 57 52 04 $221 52 33 $2 45 $2 55 $2 72 S2 56 909 69 5127 31 34 91 41 91 49 $1 57 $1 70 $1 54 91 99 $2 15 92 32 52 49 $2 62 52 75 52 91 53 06 $3 22 9101 07 52 33 52 46 52 66 92 76 33 91 53 14 $3 36 53 63 $3 90 54 19 $4 50 $4 74 54 99 5526 55 53 55 62 9182 81 51 67 51 77 S1 68 $2 00 92 13 92 26 52 39 62 53 $2 67 52 82 62 96 33 12 $3 29 53 46 33 84 33 513 5120 17 51 37 SI 45 $1 53 $1 61 SI 69 91 81 61 93 62 06 $2 20 62 34 52 50 52 63 $2 77 92 91 33 07 $3 23 $101 23
81 PR:scored Annuel Data 82 Investor Cash Eby. 1641 1651 1661 1671 1551 1891 1701 1711 1721 1731 1741 [76] 1761 (771 178) [79] [501 [1511
Intel 83 Company Ticker Outflow 10/14/16 1201/16 6/30/17 6/30/18 6/30/19 6(30/20 6/30/21 6/30/22 6/30/23 6/30/24 6/30/25 6/30/26 6/30/27 6/30/28 6/3029 6/30/30 6/30/31 154 ALLETE, Inc ALE (561 27) SO 00 90 50 92 40 52 55 92 66 52 75 62 93 53 09 5327 33 45 33 65 63 86 54 06 3427 64 50 54 74 $161 31 05 Allant Energy Corporation LNT (538 97) 50 00 5024 51 15 $125 51 32 91 39 $1 50 $1 62 $1 74 $1 56 $1 99 52 13 5224 52 36 92 45 $2 62 669 10 56 Arneren Corporaton AEE 1$50 76) 50 CO SO 36 51 71 $1 82 S1 90 S1 95 52 12 62 26 $2 41 $2 57 $2 73 32 90 $3 05 53 22 $3 39 $3 56 5121 39 87 Arista Corp:nation AVA 1$42 24) 56 CO 3028 S1 36 51 45 51 51 $1 56 51 66 $1 76 51 56 61 96 62 06 52 20 52 31 92 44 92 56 52 70 191 93 55 CMS Energy Corporation CMS ($43 35) SO 00 $026 91 33 $1 44 61 53 SI 61 $1 74 51 37 $2 01 $2 15 52 30 62 45 52 55 62 71 52 86 53 01 5102 42 89 DTE Energry Cono•ny DTE (595 20) $0 00 SO 62 $3 00 6321 $3 37 $3 53 $3 81 $4 10 $4 40 94 72 $5 07 $5 43 $5 71 3601 56 33 56 67 $227 03 90 El Paso ElecInc Company EE (546 22) SO 00 $00 29 $1 37 51 42 $1 46 51 53 51 61 51 72 51 55 51 98 52 13 9228 52 40 52 53 52 66 92 50 $95 50 91 IDACORP, Inc IDA (677 91) $0 00 S015 52 17 $2 44 92 60 52 75 $2 94 63 13 53 33 33 55 33 79 54 08 6427 64 50 94 74 54 99 5169 64 92 NorthWe.ern Corporabon NWE (659 41) SO CO $0 41 $1 98 $2 65 52 16 $224 $2 41 $2 60 52 50 $3 01 6323 53 47 53 65 63 65 64 DS $426 5145 14 93 OGE Energy Corp OGE (531 43) 60 00 $0 25 $1 19 61 34 61 43 61 53 91 57 51 62 51 67 51 72 S1 78 51154 61 93 $2 04 92 14 $2 26 $76 69 94 Otter Tail Corporation OTTR ($34 02) SO CO 6029 $1 40 $1 36 $1 35 61 34 $1 43 51 52 51 82 S1 72 51 82 51 93 92 04 52 14 S2 26 $2 30 550 90 95 Prnnacle West Capkal Corporation PNW (577 37) SO 00 SO 55 $2 62 62 81 62 93 53 06 $3.22 S3 39 $3 57 $3 78 64 00 6424 54 46 $4 70 $4 94 $521 5177 28 96 PNM Resource. Inc PNM ($33 36) SO DO $0 19 SO 93 51 07 51 17 5128 $1 41 $1 56 SI 71 51 87 52 64 5221 62 23 $2 45 52 55 $2 72 $92 55 97 Portlend General Elect= Company POR 1$42 94) $0O 00 90.27 51 31 51 41 51 49 51 57 51 70 61 54 $1 99 52 15 62 32 52 49 12 62 52 76 92 91 53 06 6104 30 98 SCANA Corporatron SCG ($72 52) 50 00 63 50 62 39 52 66 92 76 52 91 53 14 33 35 $3 63 63 90 $4 19 54 50 54 74 54 99 5526 15 53 $165 44 99 W000nsin Energy Corporation WEC ($62 04) $0 00 SO 38 91 72 $1 88 52 00 52 13 52,26 92 39 52 53 $2 67 $2 52 52 96 $3 12 $329 53 48 $3 64 $124 OD
100 Xcel Energy Inc • XEL (942 50) 50 00 5029 $1 41 $1 53 51 61 $1 69 $1 81 91 93 52 06 6220 62 34 92 50 52 63 $2 77 52 91 33 07 $104 46
Schedule RBH-2
Page 14 of 20 765

PUC Docket No. 46449 EXHIBIT RBH-2
Page 15 of 20
Line No 1 2
3 4 5 6 7 8 9
10 11 12 13 14 15 16 17 18 19 20 21 22 23 24
Input. 111 Pi 131 141
Mulb-Stage Growth Dacounted Cash Flow Model 90 Day Average Stock Price
High EPS Ging Rate Estrin* in Ent Stag.
151 161 171 181 191 1101 1111 1121 1131 Stock EPS Groat) Rate Estintes Long-Term Payout Rabo Iterative Solution Terrranal Terri-anal
Value High Company Tickw Price 2acks First Call Line Groeth Growth 2016 2020 2026 Proof IRR P/E Ran PEG Rem ALLETE, Inc ALE 561 27 5 50% 5 00% 4 00% 5 50% 5 27% 66 00% 65 00% 66166% (90 00) 10 87% 20 97 3 98 Allant Energy Conoraton LNT 932 96 6 10% 6 60% 6 00% 6 60% 5 27% 62 CO% 61 60% 66 58% (90 00) 9 15% 20 97 3 98 Arneren Corporation AEE 950 76 6 10% 5 20% 6 CO% 6 10% 5 27% 66 00% 63 CO% 66 aax 150 00) 9 64% 20 97 3 96 Avista Corporahon AVA $42 24 5 30% 5 00% 5 00% 5 30% 5 27% 67 00% 65 00% 66 88% ($000) 77% 20 97 3 98 CMS Emrgy Corporation CMS $43 38 6 60% 7 27% 6 00% 7 27% 5 27% 64 00% 62 00% 6665% (50 00) 9 63% 20 97 3 90 DTE Energy Conony DTE $9520 5 80% 5 51% 6 00% 6 00% 5 27% 62 00% 60 00% 66 60% (90 06 9 46% 20 97 3 98 El Paso Electric Company EE $46 22 4 40% 7 00% 2 SO% 7 00% 5 27% 63 00% 59 00% 6686% 1$0 OP) 9 47% 20 97 3 98 IDACORP, NorthWestern Corporation
IDA NWE
977 91 959 41
4 00% 5 00%
4 00% 5 00%
3 00% 6 50%
4 00% 6 50%
5 27% 5 27%
53 00% 63 00%
80 00% 59 00%
66 65% 66 88%
($0 00) (90 00)
8 73% 10 16%
20 97 20 97
3 98 3 90
OGE Energy Corp OGE $31 43 5 20% 4 30% 3 00% 5 20% 5 27% 66 00% 74 00% 86 88% (90 00) 10 62% 20 97 3 90 Otter Tail Corning) OYÎR $34 02 NA 6 00% 6 00% 6 00% 5 27% 82 00% 64 00% 66 86% (SO 00) 9 53% 20 97 3 95 Ponade West Canal Corporator PNW 977 37 4 30% 3 95% 4 00% 4 30% 5 27% 63 00% 64 00% 66 56% ($0 00) 9 26% 20 97 3 96 PNM Resources, Inc POM $33 36 v 6 70% 5 90% 9 00% 9 00% 5 27% SI 00% 55 00% 66 65% (90 00) 11 54% 20 97 3 90 Portant General E(2ctrc Company POR 542 94 6 00% S90% 5 50% 6 00% 27% 59 00% 56 00% 66 88% (10 00) 9 55% 20 97 3 98 SCANA Corporation SCG 972 51 5 50% 6 00% 4 50% 6 00% 5 27% 56 00% 59 00% 66 86% (SO 00) 10 50% 20 97 3 98 Winanen Energy Corporaton WEC $62 04 6 20% 6 72% 6 00% 6 72% 5 27% 67 00% 67 00% 65 88% ($0 00) 09% 20 97 3 96 Xcel Enemy Inc XEL 542 49 5 40% 5 34% 5 50% 5 50% 5 27% 62 00% 62 00% 66 55% (60 63) 9 71% 20 97 3 9a
DCF Result k Meer 9 69% 20 97 3 98
Mao 11 54% 20 97 3 98 Min 8 09% 20 97 3 915
25 Proacted Annual uninga per Share
26 Canary 27 ALLETE, Inc 28 Anent Energy Corporator 29 Amer. Corporator 60 Amt. Corporabon 31 CMS Enargy Corporation 32 DTE Energy Conwny 33 El Paso Electrx Company 34 IDACORP, Inc 35 Northwestern Coc.oddeocc 36 OGE Enorgy Coop 37 Otter Tatl Corporabon 38 Pinnacle West Capital Corporatbn 39 PNM Resourcn, Inc 40 Portland General Elect= Company 41 SCANA Corporation 42 Wisconsin Energy Corporation 43 Xcel Energy Inc
1141 1151 1161 1171 081 1191 1201 1211 1221 1231 1241 1251 Pal 1271 1261 1291 1301
Ticker 2015 2016 2017 2018 2019 2020 2021 2022 2023 2024 2025 2025 2027 2028 2029 2030 2031 ALE $3.38 93 57 53 76 $3 97 $4 19 54 42 64 86 54 91 $S 18 55 45 15 74 $6 05 16 36 $6 70 57 05 $7 43 97 82 LNT 91 so 91 so 91 92 9206 52 18 52 33 92 47 92 63 $2 78 92 94 53 10 53 27 63 44 $3 62 53 81 54 01 94.23 AEE 92 30 92 53 $2 68 92 84 53 02 93 20 93 39 13 59 33 79 6461 64 22 54 44 94 68 94 92 $5 18 15 46 $5 74 AVA $169 91 99 92 10 $221 62 32 92 45 92 56 92 71 62 88 93 01 56 17 63 33 63 SI 93 69 $3 89 64 09 54 31 CMS $I 18 92 03 92 17 52 33 92 50 $2 65 92 87 $3 06 6325 $345 63 64 63 83 94 03 $4.25 54 47 94 71 54 95 DTE 9445 9472 95 CO 55 30 55 62 $5 96 $6 31 96 67 $7 04 $7 43 57 83 5825 $8 85 99 14 99 62 $10 13 91066 EE 5203 $2 32 92 49 $2 66 92 85 53 04 63,23 63 43 $3 63 $3 83 54 04 9425 5447 14 71 64 96 $522 IDA 63 87 64 02 54 19 84 35 54 53 84 71 84 91 95 12 05 36 $5 62 55 91 9622 96 55 $6 89 $725 97 64 66 04
NWE 92 90 63 09 5329 53 50 $3 73 $3 97 $4 22 $4 48 94 74 55 01 85 29 65 57 $5 /16 $6 17 56 50 56 64 97 20 OGE 9169 $1 78 91 87 $1 97 $2 07 $2 18 92 29 $2 41 52 54 52 67 $2111 52 96 53 12 53 26 $3 45 $3 63 63 613 OTTR 91 56 $1 65 91 75 91 66 - $1 97 92 09 $2 21 92 34 92 47 92 61 $2 75 92 89 53 04 93 20 93 37 63 55 63 74 PNW 63.92 54 CO 8426 9445 94 64 94 84 63 05 5529 15 54 95162 96 11 66 44 96 77 $7 13 $7 51 $7 90 90 32 PNM $1 64 1 51 79 91 95 $2 12 92 31 52 52 92 73 $2 95 $3 16 92 36 53 56 $33 TS 13 95 64 16 84 37 $4 61 04 85 POR 9204 $2 16 9229 $2 43 $2 58 $2 73 92 89 13 06 63 23 $3 41 $3 59 93 78 93 90 94 19 84 41 34 64 6489 SCG 93191 94 04 54 25 94 54 64 81 55 10 95 40 15 71 96 03 $6 36 66 71 97 06 97 43' 97 63 86 24 98 67 19 13 WEC 62.34 92 50 62 67 92 84 5304 53 24 63 45 63 66 $3 at 94 11 84 33 84 56 94 150 $S 06 55 32 15 60 55 90 XEL 92 10 8222 92 34 52 47 $2 60 $2 74 $2 89 $3 05 63 22 53 39 93 57 63 76 63 95 64 16 $4 38 54 61 54 86
43 Projected Annual 44 DA/6am' Payout Ratio
1311 132) 1331 1341 135/ 1361 r371 1381 1391 1401
1411 [42) 1431 144) H5] 1461
29 1
222
$1
22
22
`,"g
t&
tt&
Company Ticker ALLETE, Inc ALE Mont Energy Corporator LNT Annan Corporator AEE Avista Corporator) AVA CMS Energy Corporation CMS DTE Energy Company 075 El Paso Electric Company EE IDACORP, Inc IDA NorthWestern Corpornon NWE OGE Energy Corp OGE Otter Tail C.W.O. OTIR Pinncle West Capital Corporation PNW PNM Resouses, Inc PNM Portland General Electnc Cottony POR SCANA Corporator SCG Wisconsin Energy Cd681616. WEC Xcel Energy Inc XEL
2016 2017 2018 2019 2020 2021 2022 2023 2024 2025 2026 2027 2028 2029 2030 2031 ) 66 00% 66 75% 65 50% 6525% 65 00% 85 31% 65 63% 65 94% 66 26% 66 57% 66 68% 66 NI% 66 65% 66 $3% 66 55% 6686%
1
' 62 00% 61 75% 61 50% 8125% 61 00% 61 98% 62 96% 63 94% 64 92% 65 90% 66 58% 66 88% 66 88% 66 63% 66 88% 66 66% 66 00% 6525% 64 50% 63 75% 63 CO% 63 85% 6429% 64 94% 65 59% 66 24% 66 88% 66 88% 66 55% 66 88% 66 86% 6686% 67 00% 66 50% 66 00% 65 50% 65 00% 65 31% 65 63% 65 94% 66 26% 68 57% 66 88% 66 88% 66 66% 66 18% 66 58% 66 65% 6400% 63 50% 63 00% 62 50% 62 00% 82 81% 63 63% 64 44% • 6526% 66 07% 66 M% 66 aa% 66 65% 66 88% 66 88% 66 88% 62 CO% 61 50% 61 00% 60 50% 60 00% 61 15% 6229% 63 44% 64 59% 65 74% 66 015% 196 Ba% 66 88% 66 86% 66 88% 66 88% 63 00% 62 00% 61 00% 60 00% 59 00% 60 31% 61 63% 62 94% 6426% 85 57% 66 88% 65 88% 66 65% 66 85% 66 88% 66 6.8% 53 00% 54 75% 56 SO% 5825% 80 00% 61 15% 6229% 63 44% 6459% 05 74% MS 86% 66 88% 66 88% 6686% 66158% 66 88% 63 03% 62 00% 61 00% 60 00% 59 00% 60 31% 61 63% 62 94% 6426% 65 57% 66 88% 66 68% 66 88% 66 99% 66 66% 66 815% 66 OD% 68 00% 70 00% 72 00% 74 00% 72 81% 71 63% 70 44% 6926% 68 07% 86 85% 66 88% 66 88% 66 68% 66 66% 66 65% 82 00% 77 50% 73 00% 66 50% 64 00% 84 48% 64 96% 65 44% 65 92% 66 40% 66 85% 66 88% 68 88% 66 88% 66 88% 66 aa% 63 00% 6325% 63 50% 63 75% 64 00% 64 48% 64 96% 65 44% 65 92% 66 40% 66 6.8% 66 05% 66 05% 66 85% 86 88% 66 88% 51 00% 52 00% 53 00% 54 00% 55 00% 56 90% 56 96% 00 94% 02 92% 64 90% 86 85% 66 815% 66 88% 66 66% 56165% 05 58% 59 00% 58 75% 58 50% 5525% 515 CO% SG 48% 60 96% 62 44% 83 92% 65 40% 66160% 66 615% 66 86% 66 86% 66 88% 66 88% 56 00% M 25% 56 50% 55 75% 59 CO% 60 31% 61 63% 62 94% 6426% 65 57% 66 KM 86 815% 06 66% 66 58% 66 88% 66 65% 67 00% 67 OM 67 03% 67 CO% 67 00% 66 96% 66 96% 66 94% 88 92% 65 90% 66 615% 66 45% 6688% 86 ea% 66 88% 66 88% 62 00% 62 00% 62 00% 62 00% 62 DO% 62 81% 63 63% 64 44% 66 26% 66 07% 60118% 66 88% 66 88% 66 88% 66 $86% 66 58%
62 Pronged Annual 63 Cash Flows
[471 1481 [49] 1501 1511 1521 1561 1541 1551 1561 1571 1581 [59] 1631 1613 1621 1031 Terminal
64 Company Ticker 2016 2017 2018 2019 2020 2021 2022 2023 2024 2025 2026 2027 2028 2029 2030 2031 VOA 65 6LLETE, Inc ALE , 92 35 92 47 $2 60 32 73 52 87 63 04 53 22 93 41 63 61 23 82 5404 8426 6446 94 72 94 97 55 23 916394 06 Alban Energy Corporator LNT , l 91 12 91 19 $126 $1 34 $1 42 51 53 51 65 $1 78 91 91 9206 92 19 92 30 $2 42 $2 55 $2 66i $283 988 61 67 Arneren Capon= AEE '', 91 67 $1 75 91 63 91 92 92 02 92 16 52 31 9246 9263 32 79 52 97 53 13 9329 $3 47 63 65 $33154 $120 45 68 Avesta Corporation AVA 1 91 33 91 39 91 46 91 52 $1 59 $1 65 91 78 $1 88 $1 99 92 11 9223 52 35 92 47 32 60 62 74 92 66 990 37 69 CMS Energy Corporator CMS $1 30 91 35 51 47 $1 56 91 66 $1 80 $1 95 92 10 32 25 52 40 62 56 $270 $2 84 $32 99 $31S $331 $10387 70 DTE Energy Company DTE 1 62 92 6305 13.23 63 40 63 57 53 56 5415 9447 94 80 $5 15 65 52 55 81 $6 11 66 44 $6 75 $7 13 9223 63 71 El Paso Electric Company EE ' 91 37 91 MI 91 52 $1 60 91 68 $1 83 51 99 92 16 92 33 32 51 62 70 $2 84 $2 99 $3 15 $3 32 $3 49 WV 47 72 IDACORP, Inc IDA 73 NorthWestern Corporahon NWE
i 62 13 $229 92 46 52 64 52 53 $3 00 $3 19 93 40 $33 63 53 86 $4 16 $435 64 61 64 85 $5 11 95 38 51611 60
91 95 32 04 $2 14 52 $2 24 34 92 55 $2 76 92 99 5322 $3 47 $3 72 $3 92 54 13 94 64 54 54 57 82 9150 98 74 OGE Energy Corp OGE c $1 17 91.27 91 38 91 49 $1 61 91 67 91 73 91 79 91 85 $1 91 91 96 52 08 32 19 32 31 • 52 43 92 56 650 24 75 Otter Tail Corporator OTTR 91 36 $1 36 $1 36 51 65 91 34 91 43 91 52 91 62 91 72 91 82 $1 93 62 04 52 14 92 26 32 35 $2 50 978 40 76 Pinnole West Capital Corporation PNW 52 58 $2 70 $2 82 $2 96 $33 10 $3326 $3 44 $3 63 $33 83 3406 54 30 64 53 $4 77 $5 02 9529 $5 57 $174 50 77 PNM ReSOurces, Inc PNM $O 91 91 01 91 13 $1 25 91 39 91 56 91 74 $1 92 92 12 32 31 $2 51 62 64 52 78 62 93 $3 Ca $324 9101 66 78 Portland Gekeral Elerinc Company POR 9126 91 35 51 42 $1 50 $1 58 $1 72 91 56 52 02 52 18 $2 35 92 53 $2 66 52 80 52 95 $3 11 $3.27 9102 52 79 SCANA Corporator SCG $2 34 $2 49 32 66 62 13 - 53 01 $3.26 63 52 53 80 54 09 64 40 54 72 54 97 55 23 $5 51 95 80 $6 11 $191 47 BO Wisconsin Energy Corponion WEC 91 67 $1 79 91 91 $2 03 52 17 $2 31 92 45 $2 60 $2 75 52 90 92 05 $3 21 $3 38 $3 56 $36 75 63 95 9123 73 81 Xcel Energy Inc XEL ' $1 37 91 45 $1 53 $1 61 91 70 $1 82 $1 94 $2 07 $2 21 $2 36 $2 51 $2 64 $2 78 $2 93 $33 09 $33 25 9101 85
51 Pronged Annual Data 82 investor Cash Finis
1641 1651 1661 1671 1681 1691 1701 1711 1721 1731 1741 1751 1761 f771 1761 1791 1651 161( lnihal
83 Company Ticker Chinn 10/14/16 1231/16 6/30/17 6/30/18 6/30/19 6/30/20 6/30/21 6/6022 6/30/23 6/30(24 6/30125 6/30/26 6/30/27 6/30/28 6/30/29 6/30/30 6/30/31 84 ALLETE, Inc ALE (561 27) 50 00 SO 50 62 42 $2 60 92 73 52 87 63 04 63.22 63 41 53 61 $33 82 54 04 5426 14 48 84 72 94 97 9189 16 55 Allard Energy Corporabon LNT (138 97) 90 00 90 24 $1 15 91.26 $1 34 91 42 $1 53 $1 65 $1 78 $1 91 92 05 92 19 $2 30 92 42 92 55 52 66 $91 43 86 Ameren Corporator) AEE 1550 76) SO 00 SO 36 51 72 $1 83 $1 92 92 02 32 16 $2 31 $2 46 $2 63 32 79 $2 97 63 13 5329 13 47 13 65 9124 29 57 Avesta Corporator ASA (642 24) SO 00 $0 28 91 37 $1 46 51 52 $1 59 51 66 91 78 $1 65 $1 99 92 11 9223 92 35 62 47 92 80 $2 74 69325 68 CMS Energy Corporation CMS (843 38) SO 00 50 28 $1 34 $1 47 91 56 51 66 $1 80 91 95 $2 10 92.25 $2 40 52 56 52 70 52 14 52 99 $33 15 $107 13 89 DTE Energy Company DTE (595 20) $003 SO 62 $3 01 9323 $3 40 63 57 53 86 54 15 94 47 94 80 13 IS $5 52 65 81 $6 11 $6 141 06 78 $230 76 90 El Paso Electric Company EE (946 22) 90 00 60.21 51 42 51 52 91 50 91 68 91 33 91 913 92 16 $2 33 $2 51 12 70 $2 54 52 99 13 15 63 32 5112 96 91 IDACORP, Inc IDA (977 91) $O OD 10 46 92 18 52 46 92 64 92 83 $3 DO 63 19 53 40 13 63 $3 68 64 16 84 31B 54 61 54 85 55 11 9173 98 92 Northwestern Corporation NWE (959 41) 90 CO 90 42 92 01 32 14 9224 92 34 $2 55 52 76 12 99 6322 63 47 93 72 $3 92 54 13 54 34 54 57 9155 79 93 OGE Energy Cap OGE ($31 43) 90 00 1025 $1.20 51 38 $1 49 51 61 $1 67 $ I 73 $1 79 $1 85 $1 91 91 98 $2 06 32 19 $2 31 52 43 5152 79 94 Otter Tail Coq:orator OTTR (634 02) 50 00 $029 91 40 91 36 51 35 91 34 91 43 91 52 91 62 51 72 61 82 $1 93 12 04 92 14 92 26 92 32 580 90 95 PInrucle West Capital Corporation PNW (977 37) 90 00 50 55 62 63 92 82 92 96 $33 10 6326 63 44 $3 63 93 83 94 06 84 30 64 53 5477 15 02 6529 9150 07 96 PNM RnoUrCeS, Inc PNM 1533 36) SO 00 SO 19 SO 95 $1 13 $125 $1 39 $1 56 $1 74 $1 92 92 12 32 31 52 51 $2 64 92 78 52 93 $3 08 5104 90 97 Portland General Electnc Company POR (842 94) SO 00 $0 27 $1 31 91 42 91 50 $1 56 $1 72 $1 86 92 02 $2 18 $2 35 92 53 $2 66 62 80 12 95 53 11 $105 79 96 SCANA Corporation SCG 1972 52) 50 00 50 50 $2 41 62 65 32 83 53 01 9326 $3 52 93 ao 54 09 54 40 84 72 94 97 1523 15 51 15 80 5197 57 99 Wrsconen Energy Corporator) WEC ($62 04) $0 OD 50 36 91 73 $1 91 52 03 $32 17 92 31 32 45 52 60 92 75 52 90 63 05 9321 93 31 63 56 $33 75 5127 67
100 Xcel Energy Inc XEL ($42 50) $0 00 SO 29 91 41 91 53 91 61 $1 70 $1 82 91 94 32 07 9221 92 36 62 51 $2 64 $2 78 $2 93 53 00 9105 10
Schedule RBH-2
Page 15 of 20 766

PUC Docket No. 46449 EXHIBIT RBH-2
Page 16 of 20
Late No 1 2
3 4 5 6 7 8 9 10 11 12 13 14 15 16 17 18 19 20 21 22 23 24
Inputs 111 121 131 141
Muth-Stage Growth Discounted Cash Flow Model 90 Day Average Stock Pnce
Low EPS Growth Rate Estimate in First Stage
151 F61 171 181 191 [101 [111 F12] 1131 Stock EPS Growth Rate Estimates Long-Term Payout Ratio Herons Soluton Terminal Tolman!
Value Low Company Ticker Price Zacka First Cal Line Growth GrovAh 2016 2020 2026 Proof IRR P/E Rath PEG Rabo ALLETE, Inc ALE 56127 5 50% 5 00% 4 00% 4 OD% 5 27% 66 00% 65 00% 66 88% 190 00) 9 93% 20 97 3 98 Alban Energy Comoraton LNT 638 96 6 10% 6 60% 6 00% 6 CO% 5 27% 62 00% 61 00% 66 &I% (SO 00) 8 79% 20 97 3 96 Ameren Corporabon AEE 950 76 6 10% 5 20% 6 00% 5 20% 5 27% 66 00% 63 00% 65 56% (SO 00) 9 10% 20 97 3 96 Aosta Corporabon AVA 542 24 5 30% 5 00% 5 00% 5 00% 5 27% 67 00% 65 00% 66 88% ($0 00) 8 59% 20 97 3 96 CMS Energy Corporshon CMS 943 3a 6 60% 7 27% 6 00% 6 OD% 5 27% 64 00% 62 00% 66 88% (50 00) 8 87% 20 97 3 98 DTE Energy Consany DTE $95.20 5 80% 5 51% 6 00% 5 51% 5 27% 62 00% 60 00% 66 48% 190 00) 9 17% 20 97 3 96 El Paso Electric Cornpany EE 94622 4 40% 7 00% 2 50% 2 50% 5 27% 63 00% 59 00% 66 88% (90 00) — 6 79% 20 97 3 96 !MCORP, Inc IDA 977 91 4 00% 4 00% 3 00% 3 CO% 5 27% 53 00% 60 00% 66 88% (90 00) 8 13% 20 97 3 916 Northwestern Comoralion NWE 959 41 5 00% 5 00% 6 50% 5 00% 5 27% E3 00% 59 00% 66 88% (SO 00) 9 25% 20 97 3 98 OGE Energy Corp OGE 931 43 5 20% 4 30% 3 00% 3 00% 5 27% 66 OD% 74 00% 66 88% (90 00) 9 24% 20 97 3 98 Otter Tarl Corporabon OTTR 934 02 NA 6 00% 6 00% 6 00% 5 27% 82 CO% 6400% 66 88% (90 00) 9 53% 20 97 3 98 Pinnacle Weal Cants! Corporation PNW 977 37 4 30% 3 95% 4 00% 3 95% 5 27% 63 00% 64 DO% 66 88% (90 00) 9 05% 20 97 3 98 PNM Resources Inc PNM $33 36 6 70% 5 90% 9 00% 5 90% 5 27% 51 00% 55 00% 66 66% (POO) 9 67% 20 97 3 98 Portland G4neral Elects Company POR 542 94 6 00% 5 90% 5 50% 5 50% 5 27% 59 00% 58 00% 66 65% (50 00) 9 25% 20 97 3 98 SCANA Corporation SCG 572 51 5 50% 6 00% 4 50% 4 50% 5 27% 58 00% 59 00% 66 86% (00 00) 9 56% 20 97 3 D8 Weconsin Energy Corparabon WEC 562 D4 6 20% 6 72% 6 OD% 6 CO% 5 27% 67 00% 67 00% 66 86% (SO 00) 7 67% 20 97 3 98 Xcel Enemy Inc XEL 942 49 5 40% 5 34% 5 50% 5 34% 5 27% 62 00% 62 00% 66 88% (SO 05 9 62% 20 97 3 98
DCF Result Mean 8 95% 20 97 3 DB
Max 9 93% 20 97 3 98 Min 6 79% 20 97 3 98
25 Protected Annual Earnings per Shan
26 Company 27 ALLETE, Inc 28 Mont Energy Corporation 29 Anwen Corporation 30 Aosta Corporaton 31 CMS Energy Corporatton 32 DTE Energy Company 33 El Paso Electric Company 34 IDACORP, Inc 35 NorthWestern Corporabon 36 OGE Energy Corp 37 Otter Tall Comorabon 38 Pinnacle Wnt Capital Corporation 39 PNM Resources, Inc 40 Portland General Electro Company 41 SCANA Corporation 42 Wsconstn Energy Corporatron 43 Xcel Energy Inc
43 Protected Annual 44 Dividend Payout Ratio
£122
84
4444T
4'-'2
8A
StA
A
Company ALLETE, Inc Whant Energy Corporabon Arnow Corporation Aosta Corporaton CMS Energy Corporation DTE Energy Company El Paso Electric Conseny IDACORP, Inc Northwestern Corporabon OGE Energy Corp Otter Tall Corporabon Pinnacle West Capital Corporation PNM Raspiness, Inc Portland General Elednc Company SCANA Corporation Wsconsin Energy Corporaton /Libel Enemy Inc
P
62 Protected Annual 63 Cash Eby.
64 Company 65 ALLETE, Inc 86 Allan Energy Corporeton 67 Arneren Corporabon 68 Aviata Corporation 09 CMS Energy Corporabon 70 DTE Enetgy Company 71 El Paso ElecInc Company 72 IDACORP,Inc 73 Northwestern Corporabco 74 OGE Energy Corp 75 Otter Tall Comorabon 76 Ptnnacle W4st Capital Corporal,. 77 PNM Resources Inc 78 Portland General Electnc Company 79 SCANA Corporator, 80 Wisconsin Energy Corporation 81 Xcel Energy Inc
81 Prorroed Annual Data 62 Inventor Cash Fbvis
83 Company 84 ALLETE, Inc 85 Alban Energy Corporation 156 Arneren Corporation
87 Aosta CorPorWon 30 CMS Energy Corporation 0.9 DTE EnerP ComP4nY 90 El Paso Electric Compsny 91 IDACORP, Inc 92 Nod-Western Corporation 93 OGE Energy Corp 94 Otter Tall Corporabon 95 Pinnacle West Capt.! Corporaton 96 PNM Resources, Inc 97 Pottlend General Elednc Ccopany 96 SCANA Corporation 99 Wsconsin Enemy Corporaton 100 Xcel Enehly Inc
[14] 1151 1161 1171 1181 119] PO] 1211 1221 1231 [24] [25] [26] 127] 1281 [29] 130]
Ticker 2015 2016 2017 2018 2019 2020 2021 2022 2023 2024 2025 0021 2027 2028 2023 2030 2031 ALE 93.38'30 93 66 93 150 93 95 SA 11 94 212 94 48 74 ea 94 91 55 16 95 43 55 72 56 02 56 34 56 67 97 02 LNT 91 Og 1 51 792 51 90 52 01 92 13 92 26 92 39 92 53 52 68 62 82 92 98 93 13 93 30 53 47 83 65 93 85 94 05 AEE $2.38 92 50 92 63 92 77 92 92 93 07 33 23 53 40 93 57 93 76 53 96 34 17 54 39 54 62 54 86 55 12 55 39 AVA 91 89 a 51 95 5208 92 19 92 30 6241 92 53 52 66 92 80 02 94 63 10 33.26 93 43 93 62 93 81 94 01 9422 CMS 51 89 I 92 00 52 12 92 25 92 39 52 53 32 CP 92 83 92 99 93 16 93 33 93 50 93 69 P 68 54 09 94 30 94 53 DTE 94 45 ] 54 70 94 95 9523 95 51 95 82 96 14 96 47 56 82 $7 11 97 57 57 97 98 39 58133 99 29 99 78 910 30 EE 92 03 1 92 08 52 13 92 19 92.24 92 30 92 36 92 45 52 54 - 52 65 52 74 52 93 93 06 63 24 53 41 93 59 93 78 IDA 53 87 53 99 $4 11 94 23 94 36 1449 94 64 94151 55 01 55 24 95 49 55 78 96 09 56 41 96 75 97 10 37 48
NWE 52 90 I 33 05 9320 93 36 93 52 93 70 93 619 94 CO 54 30 94 52 94 75 $5 01 S5 27 55 55 55 64 96 15 96 47 OGE 51 69 i 91 74 91 79 91 85 91 93 81 96 92 03 52 10 52 19 6229 92 40 92 53 92 66 92 40 92 95 93 10 9327 07-15 51 56 91 65 51 75 91 86 91 97 92 09 52.21 92 34 92 47 92 61 52 75 92 89 93 04 3320 53 37 53 55 53 74 PNW 63 92 1 34 07 54 24 94 40 94 58 94 76 54 96 15 17 95 41 95 67 95 96 5628 96 61 96 95 97 32 97 71 SS 11 PNM 51 64 91 74 51 64 91 95 52 06 92 18 32 31 92 44 92 58 92 72 62117 53 02 53 18 53 34 93 52 93 71 63 90 POR 92.04 52 15 9227 92 40 92 53 92 67 92 61 92 96 93 12 5329 S3 47 93 65 93 84 54 04 54 26 94 48 94 72 SCO 53 61 93 93 94 16 94 35 94 54 54 75 54 97 9520 95 46 S5 73 96 03 96 35 96 615 97 03 97 40 $7 79 515 20 WEC 52.34 52 45 92 63 52 79 92 95 P 13 53 32 P 51 93 70 63 91 34 12 54 34 94 57 9481 95 06 95 33 95 61 %EL 42 10 9221 62 33 62 45 92 59 92 72 92 87 93 02 63 18 33 35 53 53 93 71 93 91 94 12 9433 94 56 54 80
[311 321 [33] 341 3S] 136] 137/ [381 39] 1401 1411 1421 1431 1441 1451 1481
Ticker 2016 2017 2018 2019 2020 2021 2022 2023 2024 2025 2026 2027 2026 2029 2030 2031 ALE ' 66 00% 65 75% 65 50% 65 25% 65 OD% 65 31% 65 63% 65 94% 6626% 66 57% 66 86% 66 88% 66 86% 66 IP% 66 88% 66 WM LNT 62 DO% 61 75% 61 50% 61.25% 61 IP% 61 98% 68 96% 63 94% 64 92% 65 90% 66 86% 86 86% 66 88% 66 68% 66 58% 66 88% AEE 66 00% 6525% 64 50% 63 75% 63 00% 63 65% 6429% 64 94% 65 59% 6624% 6666% 66 66% 66 88% 66 BB% 66 88% 66 15% AVA 67 00% 66 50% 66 00% 65 50% 65 00% 65 31% 65 53% 65 94% 6628% 66 57% 66 58% 86 68% 66 86% 66 68% 66 815% 08 66% CMS 64 00% 63 50% 63 00% 62 50% 62 00% 62 81% 63 63% 64 44% 6526% 66 07% 6666% 66 88% 66 88% 66 88% 66 816% 66 66% DTE 62 00% 61 50% 61 00% 60 50% 60 00% 61 15% 62.29% 63 44% 64 5.9% 65 74% 86 86% 66 88% 68 53% 66 86% 66 58% 66 68% EE 6351% 62 00% 61 00% 53 00% 59 00% 60 31% 61 63% 62 94% 64 26% 65 57% 0668% 66 66% 66 68% 66 88% 66 66% 66 86% IDA 53 00% 54 75% 56 50% 58 25% 60 00% 61 15% 6229% 63 44% 64 59% 65 74% 66 45% 66 55% 65 68% 66 68% 66 88% 86 86% NWE 63 00% 62 OM 61 00% 60 00% 59 00% 60 31% 61 63% 62 94% 64 26% 65 57% 66 88% 66 86% 66 SS% 66 66% 66135% 66 88% OGE 66 00% 68 00% 70 00% 72 00% 74 00% 72 81% 71 63% 70 44% 6926% 68 07% 66 88% 66 56% 66 66% 66 66% 86 66% 86 88% OTTR 62 51% 77 50% 73 00% 68 50% 94 00% 6445% 64 96% 65 44% 65 92% 86 40% 68156% 66 55% 66 85% 66 15% 66 66% 66 86% P= 63 00% 63 25% IP 50% 63 76% 64 OD% 64 48% 64 96% 6544% 65 92% 66 40% 85 88% 616 86% 66 88% 66 88% 66 88% 66 65%
POR 51 00% 50 00%
52 00% 58 75%
53 00% 56 50%
54 00% 5925%
55 00% 56 00%
56 98% 59 46%
56 96% 60 96%
60 94% 62 44%
62 92% 63 92%
64 90% 65 40%
66 06% 66 66%
66 88% 66 68%
66 86% 66 BS%
6655% 66 88%
66 65% 66 86%
66 86% 66 86%
SCG 58 00% 56 25% 58 50% 56 76% 50 CO% 60 31% 61 63% 62 D4% 64 26% 65 57% 66 88% 66 86% 66 88% 66 86% 66 88% 66 88% WEC 67 CO% 67 CO% 67 00% 67 00% 67 00% 66 96% 66 96% 66 94% 66 92% 66 90% 66 1521% 66 66% 66 88% 66 88% 66 88% 66 BD% XEL 62 00% 62 00% 62 00% 62 00% 62 00% 62 81% 83 63% 6444% 6526% 66 07% 66 66% 86 86% 66 88% 66 68% 66 66% 66 88%
1471 1481 1491 501 1511 P21 1531 54] 1551 1561 1571 1581 1591 POI 1611 62] 1831 Terminal
Tidier 2016 2017 2018 2019 2020 2021 2022 2023 2024 2025 2026 2027 2026 2029 2030 2031 Value ALE r 92 32 92 40 52 49 92 58 92 67 92 80 92 94 93 09 93.29 53 43 53 63 93 82 94 03 9424 54 46 54 70 9147 25 LNT I 91 11 $1 17 5124 91 31 91 38 91 4I6 51 59 $1 71 91 83 9196 92 00 5221 92 32 92 44 92 57 32 71 564 93 AEE 1 91 85 $1 72 91 79 91 66 51 93 52 05 92 18 92 32 92 47 32 62 62 79 92 93 53 09 93 25 93 42 63 60 5112 SO AVA 91 33 91 39 91 44 SI 50 51 57 91 65 91 75 91 85 91 95 62 06 92 18 32 30 93 42 93 55 93 88 92 82 SP 46 CMS 91 25 91 35 $1 42 $1 49 SI 57 51 68 $1 80 91 93 32 06 92.20 92 34 52 47 52 60 92 73 92 66 93 03 994 98 DTE I 62 91 $3 05 63 19 93 34 63 49 53 75 54 03 54 33 5464 54 97 55 33 95 61 95 90 9612 96 54 56 89 9215 99 EE l 51 31 91 32 91 33 91 34 91 36 91 43 51 51 91 60 91 70 91 82 91 96 5206 52 17 9228 92 40 62 53 679 33 IDA i $2 11 92 25 62 39 32 54 92 60 62 64 53 00 93 16 93 35 93 61 53 87 94 07 5429 54 51 94 75 55 00 5156 04 NWE 1 $1 92 51 96 92 05 92 11 32 18 92 34 93 52 92 70 92 90 23 12 63 35 S3 52 53 71 63 91 54 11 94 33 9135 73 OGE 91 15 9122 91 29 91 37 91 45 61 47 $1 51 91 54 51 58 91E3 91 69 91 78 91 87 51 97 92 06 92 18 968 49 OTI-R 51 36 91 36 91 36 51 35 51 34 91 43 91 52 91 62 51 72 51 82 61 93 92 04 92 14 5226 92 38 92 50 PS 40 PNW 62 57
1
93 68 92 80 62 92 93 05 9320 93 36 93 54 93 74 53 96 94 20 54 42 54 85 i4 90 95 16 95 43 9170 16 PNM SO 89 90 96 91 03 91 11 61 20 91 32 $1 44 51 57 $1 71 61 66 32 02 62 12 9224 92 36 92 48 82 61 551 63 POR 9127 61 33 51 40 91 47 51 55 91 67 51 61 91 95 112 10 5227 92 44 93 57 92 70 92 15 53 00 53 16 PS 94 SCG t 92 31 32 42 92 54 92 67 92 60 93 LEI 9321 93 44 53 68 5395 94 24 54 47 94 70 94 95 9521 55 49 $172 D6 WEC 1 $166 9176 6187 9196 3210 9322 3235 9248 6262 5276 9290 5305 5321 9336 9356 9375 611750 XEL i St 37 $1 44 91 52 $1 60 SI 69 91 80 61 92 92 05 32 19 S2 33 52 48 $2 61 92 75 S2 90 53 05 93 21 9100 70
1641 1651 1661 671 185 lee1 1701 171] 1721 1731 1741 1751 176] 1771 1781 1791 80] 1811
Ticker Outflow 10/14/16 1251/16 6/30/17 6/30/18 6/30/19 6/30/20 6/30/21 6/30/22 6/30/23 6/30/24 6/30/25 6/30/26 6/30/27 6/30/26 6/30/29 6/30/30 6/3531 ALE (961 27) 50 CO SO 50 92 37 62 49 92 58 92 67 3253 92 94 93 09 93 25 93 43 53 63 93 54 03 3424 6446 9151 95 LNT (936 97) SO 00 9024 91 14 6124 $1 31 $1 36 51 46 91 59 91 71 51 83 61 96 92 09 6221 82 32 52 44 52 57 687 64 AEE 1950 76) SO 00 SO 35 91 70 51 79 51 86 $1 93 62 05 52 18 92 32 52 47 92 62 93 79 92 93 93 09 5325 5342 9116 60 AVA 1642 24) $0 CO $028 91 36 $1 44 61 50 91 57 61 65 61 75 51 85 91 95 92 06 32 18 93 30 62 42 842 55 52 68 99128 CMS (543 35) SO 00 50.27 61 32 51 42 91 49 91 57 $1 65 91 80 $1 93 $2 06 9220 93 34 5247 52 60 92 73 92 65 698 01 DTE 1696 20) 90 00 SO 62 62 99 93 19 53 34 93 49 P 75 54 03 34 33 $4 64 94 97 65 33 6.5 61 55 90 5622 96 54 6222 87 EE (546 22) 60 00 9025 61 33 91 33 51 34 91 36 51 43 51 51 91 60 61 70 91 82 91 96 92 06 52 17 9228 32 40 8R1 86 IDA (977 91 ) SO 00 50 45 92 14 32 39 92 54 93 69 52 64 93 51 93 18 03 36 53 61 93 87 94 07 94 29 94 51 54 75 $161 84
NWE (559 41) 90 00 SO 41 91 97 93 05 32 11 52 16 52 34 62 52 92 70 32 90 93 12 53 35 93 52 93 71 33 91 $44 11 9140 05 OGE (931 43) SO OD 9025 91 17 6129 91 37 91 45 51 47 91 51 91 54 91 56 Sl 63 91 69 91 78 $1 87 $1 97 32 06 970 67
OTTR (134 02) SO CO 50 29 91 40 91 36 $ I 35 91 34 91 43 51 52 91 62 61 72 91 82 91 93 $2 04 62 14 9226 52 38 980 90 ' PNW (977 37) 60 CO 00 55 92 62 92 60 52 92 93 06 63 20 93 36 53 54 93 74 93 96 5420 94 42 9465 94 90 $5 16 9175 5.9 PNM (933 36) 50 CO SO 19 50 91 61 03 $1 11 9120 91 32 61 44 91 57 61 71 91 86 52 02 52 12 9224 92 36 62 e 184 44 POR (542 94) SO 00 90 27 $1 30 91 40 91 47 91 55 91 67 $1 81 91 95 92 10 6227 32 44 92 57 92 70 12 65 93 00 $102 10 SCG 1972 52) 50 00 SO 49 92 36 62 54 92 67 93 80 53 00 2321 93 44 93 68 93 95 9424 54 47 54 70 9495 95 21 9177 54 WEC (562 04) $0 00 90 36 51 71 91 87 51 90 92 10 3222 62 35 S248 62 62 93 76 92 90 53 05 93 21 53 38 53 56 5121 34 XEL (542 50) SO 00 5029 91 41 $1 52 91 03 $1 69 91 80 51 92 52 05 52 19 92 33 92 48 93 61 62 75 52 90 93 05 9103 91
Schedule RBH-2
Page 16 of 20 767

PUC Docket No. 46449 EXHIBIT RBH-2
Page 17 of 20
Ure No 1 Inputs 111 121 131 141
Mub-Stage Growth Decountml Cae.h Flow Model 180 Day Average Stock Price
Average EPS Gr09001 Rate Esbmate Fest Stage
151 161 171 181 191 1101 1111 1121 1131 2 Stock EPS GroMh Rate Estunetes Long-Term Payout Rah° Merano. Soluton Termonal Terminal
Value 3 Company Toker Pnce 2acks First Call Line Average Growth 2016 2020 2026 Proof (R R PIE Rabo PEG Rano 4 ALLEM, Inc ALE $58 42 5 50% 5 00% 4 00% 4 83% 27% 66 00% 66 00% 66 68% (SO DO) 10 91% 20 97 3 98 5 Allent Energy Caporaton LNT $37 32 6 10% 6 60% 6 00% 6 23% 5 27% 62 00% 61 00% 66 88% (50 00) 9 33% 20 97 3 98 6 Armen Corporation AEE $49 34 6 10% 5 20% 6 CO% 5 77% 5 27% 66 00% 63 CO% 66 88% ($0 00) 9 71% 20 97 3 916 7 Aosta Corporabon AVA $4091 5 30% 5 00% 5 00% 5 10% 5 27% 67 00% 65 00% 66 88% (90 00) 8 95% 20 97 3 98
CMS Energy Corporbion CMS $42 13 6 60% 7 27% 6 00% 6 62% 5 27% 64 00% 62 CO% 66 88% ($0 00) 9 51% 20 97 3 98 9 DTE Energy Conlon)/ DTE 691 72 5 80% 5 51% 6 00% 5 77% 5 27% 62 00% 60 00% 66 86% ($0 00) 9 67% 20 97 3 98
10 El Paso Electo Cotrosny EE 044 96 4 40% 7 00% 2 50% 4 63% 5 27% 63 00% 59 00% 66 66% (W 00) 8 31% 20 97 3 96 11 IDACORP, Inc IDA 97524 4 00% 4 00% 3 00% 3 67% 5 27% 53 00% 60 00% 66 86% (60 00) 8 85% 20 97 3 98 12 NorthWestern Corporabon NWE 959 18 5 00% 5 00% 6 50% 5 50% 27% 62 00% 59 00% 66 86% ($0 00) 9 59% 20 97 3 98 13 OGE Energy Corp OGE $29 86 5 20% 4 30% 3 OM 4 17% 5 27% 66 CO% 74 00% es 88% (SO 00) 10 47% 20 97 3 98 14 Otter Tail Corporation OTTR $31 33 NA 6 00% 6 00% 6 00% 5 27% 82 DO% 64 00% 66 68% (SO 00) 10 32% 20 97 3 96 15 named. West Centel Corporaton PNW 574 66 4 30% 3 96% 4 00% 4 OS% 6 27% 63 00% 64 00% 66 86% (SO DO) 9 46% 20 97 3 98 16 PNM Resources, Inc PNM $32 96 6 70% 5 90% 9 00% 7 20% 5 27% 51 00% 55 00% 66 88% (50 00) 10 56% 20 97 3 98 17 Portland General Elect= Company POR 64127 6 OM 5 90% 5 SO% 5 80% 5 27% 59 00% 56 00% 66 66% ($0 00) 9 79% 20 97 3 96 18 SCANA Corporston SCG 070 23 5 50% 6 00% 4 50% 5 33% 5 27% 58 00% 59 00% 66 68% ($0 00) 10 3.9x 20 97 3 98 19 Weccoon Energy Corporation WEC $60 18 6 20% 6 72% 6 00% 6 31% 5 27% 67 00% 67 00% 06 68% (60 00) 8 12% 20 97 3 98 20 Xoel Enemy Inc XEL 941 48 5 40% 5 34% 5 50% 5 41% 5 27% 62 00% 62 OD% 66 66% 90 oc) 9 89% 20 97 3 96 21 DCF Result 22 Mean 9 64% 20 97 3 96 23 Max 10 91% 20 97 3 98 24 Mtn 8 12% 20 97 3 96 25 Protected Annual
Earnings per Share 1141 1151 1161 1171 1181 119/ 1201 1211 1221 1231 1241 1251 1261 1271 1281 1291 (301
26 Compow Ticker 2015 2016 2017 2018 2019 2020 2021 2022 2023 2024 2025 2026 2027 2028 2029 2030 2031 27 ALLETE,Inc ALE 63 36 r $3 54 03 71 53 89 $4 08 0428 $4 49 04 71 04 95 95 21 ss 48 55 77 $6 07 56 39 56 73 97 06 $7 45 28 Anent Energy Corporation LNT $1 69 I $1 80 51 91 32 03 $2 15 $2.29 62 43 $2 57 $2 72 92 87 $3 02 53 18 03 35 53 53 $3 72 63 91 54 12 29 Ammer Corcoran. AEE 52..36 $2 52 $2 86 62 82 $2 98 $3 15 53 33 53 52 $3 71 53 91 $4 12 54 34 54 57 14 81 $5 06 $5 33 $5 61 30 Aosta Corporation AVA 61 89 61 99 0200 $2 19 62 31 $32 42 52 55 02 68 92 82 02 97 62 12 1329 $3 46 93 64 $3 53 54 04 34 26 31 CMS Energy Corporation CMS 01 89 $2 02 52 15 02 29 52 44 92 60 $32 77 92 94 56 12 $3 30 63 48 $3 66 $33 85 $4 06 $4 27 64 50 $4 73 32 DTE Energy Company DTE 5445 $4 71 94 318 $527 $5 57 $5 89 6623 66 57 56 94 $7 32 $7 71 $8 11 $8 64 $8 99 69 47 $9 97 510 49 33 El Paso Electric Company EE $2 03 32 12 $2.22 $2 33 62 43 $2 55 $2 67 $2 80 02 93 93 Oa 66 24 63 41 93 59 66 713 63 98 54 19 24 41 34 IDACORP, Inc IDA 63 87 54 01 $4 16 $4 31 34 47 0463 $4 82 55 02 $524 56 49 55 77 66 07 $6 39 $6 73 97 06 $7 46 $7 85 35 NorthWestem Corperabon NWE 62 90 03 06 63 23 3341 63 59 $3 79 64 00 5421 04 44 54 66 34 93 $5 19 $5 46 65 75 26 05 36 37 06 71 36 OGE Energy Corp OGE 01 09 $1 76 51 63 61 91 $1 99 $2 07 $2 16 5226 52 37 02 48 $2 61 $2 75 52 89 63 05 $321 03 38 53 55 37 Otter Till Corporabon OTTR 51 56 I 01 65 01 75 $1 66 $1 97 $2 09 6221 62 34 02 47 02 61 82 is 02 89 53 04 53 20 $3 37 13 55 53 74 38 Ponacle West Capital Corporation PNW 83.92 $4 08 04 25 54 42 54 60 54 79 $4 93 $5,22 5546 $5 73 66 02 $6 34 $6 67 $7 02 $7 39 67 78 08 19 39 PIIM Resources, Inc PNM 01154 $1 76 61 88 52 02 32 17 $2 32 $2 4s $2 64 $2 81 52 915 13 14 $3 31 03 4a $3 67 13 86 $4 06 14 28 40 Portend General Eledro Company POR 9204 92 16 $228 $2 42 92 56 52 70 32 86 03 02 03 19 63 36 $33 54 53 73 93 92 54 13 04135 $4 58 s4 82 41 SCANA Corporaton SCG 33 01 04 01 0423 64 45 04 69 04 94 05 20 55 43 1577 $6 05 66 40 $6 73 07 63 $7 46 97 86 6827 58 71 42 Wisconsin Energy Craporabon WEC 52.34 32 49 02 64 32 81 92 99 $3 18 63 37 $3 57 13 78 03 99 54 21 54 43 64 67 64 91 05 17 26 44 05 73 43 Xcer Energy Inc XEL 02 10 62.21 52 33 $2 46 $2 59 $2 73 52 65 53 04 03 20 63 37 53 55 53 73 03 93 54 14 54 36 64 59 $463
43 Protected Annual 44 Droclend Peyote Ratio 1311 1321 1331 (34] 1351 1361 C371 1381 1391 1401 1411 1421 1431 1241 1451 1461
45 Cornlony Ticker 2016 2017 2018 2019 2020 2021 2022 2023 2024 2025 2026 2027 2028 2029 2030 2031 46 ALLETE, Inc ALE 66 00% 65 75% 65 50% 6525% 65 00% 65 31% 66 63% 65 94% 6626% 66 57% 66 811% 66 88% 66 86% 66 am 66 86% 66 86% 47 Allent Energy CorPorMon LNT 62 CO% 61 75% 61 50% 61 25% 61 00% 61 96% 62 96% 63 94% 64 92% E6 90% 66 66% 66 88% 66 65% 66 88% 66 88% 06 66% 46 Ameren Corporation AEE 66 00% 6525% 64 50% 63 75% 63 03% 63 85% 64 29% 64 94% 65 543% 6624% 66 86% 66 88% 86 88% 66 88% 66165% 66 88% 49 Aosta Corporation AVA 67 DO% 66 50% 68 00% 65 50% 65 00% 65 31% 65 63% 65 94% 6626% 66 57% 66 68% 65 86% 66 86% 66 86% 66 66% 66 86% 50 CMS Energy Corporation CMS 64 00% 63 50% 63 00% 62 50% 62 00% 62 81% 63 63% 64 44% 6526% 66 07% 66 88% 66 86% 66 88% 66 88% 66 68% 66 88% 51 DTE Energy Conoany DTE I 62 OD% 61 50% 61 OM 00 50% 60 00% 61 15% 62 29% 63 44% 64 50% 65 74% 66 63% 66 65% 66 66% 66 68% 66 68% 66 65% 52 El Paso Elecbc Company EE 63 00% 62 00% 61 00% 60 00% 59 00% 60 31% 61 63% 62 94% 64 26% 65 57% 156 88% 06 66% 06 88% 66 88% 66 118% 66 88% 53 IDACORP, Inc IDA 53 OD% 54 75% 58 50% 5825% 00 00% 61 15% 62 29% 6344% 64 59% 65 74% 66 88% 66 88% 66 88% 66 88% 66 86% 66138% 54 Northwestern CorPoranon NWE 63 OD% 62 CO% 61 00% 60 00% 59 00% 60 31% 61 63% 62 94% 6426% 65 57% 66 61% 66 88% 66 88% 68 88% 66 88% 66 86% 65 OGE Energy Corp OGE 66 CO% 68 DO% 70 00% 72 00% 74 OD% 72 81% 71 63% 70 44% 6926% 66 07% 86 88% 66 88% 66 88% 66 88% 66 88% 66 68% 56 Otter Tail Corporabon OTTR 86 00% 77 50% 73 00% 66 50% 64 00% 64 48% 64 96% 65 44% 65 92% 66 40% 136 68% 66 88% 06 66% 6688% 66 86% 06 63% 57 Pinned* West Capital Corporaton PNW 63 00% 6325% 63 50% 63 75% 64 00% 64 48% 64 96% 65 44% 65 92% 66 40% 66 63% 66 138% 66 88% 66 88% 66 88% 66 68% 58 PNM Resounoes, Inc PNM 51 00% 52 00% 53 00% 54 00% 55 00% 56 96% 56 96% 60 94% 62 92% 64 90% 66156% 66 06% 66 86% 66 88% 66158% 66 68% 59 Portend &mend Electric Company POR 59 00% 58 75% 65 50% 5525% 55 00% 5946% 60 96% 62 44% 63 92% 65 40% 66 88% 66 66% 66 66% 66 88% 66 65% 66 65% 60 SCANA Corpotabon SCG 58 00% 55 25% 68 50% 58 75% 69 DO% 60 31% 81 63% 62 94% 64 26% 65 57% 66 88% 661313% 66 65% 66 86% 66 66% 66 68% 61 Wsconon Energy Corporaton WEC 67 00% 67 00% 67 00% 67 0011 67 DO% 66 96% 66 96% 66 9411 66 92% 66 90% 66 86% 66 88% 66 88% 66 65% 6668% 66 66% 62 Xcel Energy Inc XEL 62 00% 62 DO% 62 00% 02 00% 62 00% 62 81% 63 63% 64 44% 6526% 66 07% 66 68% 86 88% 66 66% 66 88% 66 88% 66 86%
62 Propoted Annual 63 Cash Flows 1471 1481 (491 1501 1511 1521 1531 1541 1551 1561 1571 1581 1591 1601 1611 1621 183/
Terrninal 64 CorolonY Ticker 2016 2017 2018 2019 2020 2021 2022 2023 2024 2025 2026 2027 2026 2029 2030 2031 Witte 65 ALLETE, Inc ALE 62 34 52 44 62 66 $2 66 52 78 $2 93 53 09 $3,27 62 45 33 65 6386 64 06 94,27 64 50 54 74 64 99 6156 32 66 Mont Energy Corporaton LNT 91 11 01 18 51 25 $1 32 SI 39 $1 50 $1 62 $1 74 01 86 01 99 $2 13 5224 62 36 02 48 62 62 02 75 956 34 67 Armen Corporeton AEE 61 66 61 74 61 82 $1 90 $1 96 $2 12 $2.26 52 41 $2 57 $2 73 92 90 6305 03 22 53 39 53 56 53 75 6117 64 68 Await. Corporation AVA $1 33 $1 39 $1 45 91 51 51 58 01 66 01 76 $1 86 $1 96 $2 OS $220 52 31 02 44 52 56 $2 70 $2 84 689 09 09 CMS Energy Corporabon 70 DTE Energy Corrleny
CMS DTE
$112 2:
2 $1 36
$3 06 $1 44 6321
01 53 $33 37
51 61 03 53
61 74 53 81
61 87 94 10
92 01 $4 40
$2 15 54 72
02 30 55 07
62 45 $5 43
$2 56 $5 71
$2 71 16 01
02 B6 $6 33
13 01 0O 67
63 17 57 02
69925 3220 01
71 El Paso Electric Company EE $1 34 S1 38 $1 42 01 46 $1 50 91 61 01 72 01 85 $1 96 $2 13 52 28 02 40 02 53 92 66 02 80 92 95 692 55 72 IDACORP, Inc IDA 62 13 $2 28 $2 44 $2 60 32 713 02 94 53 13 $3 33 62 55 03 79 54 06 54 27 64 50 94 74 54 99 5525 0164 59 73 NorthWestern Corporabon NWE 01 93 02 00 92 06 52 16 52.24 62 41 6260 $2 60 03 01 03 23 53 47 33 65 63 85 $44 05 54 26 $4 49 6140 65 74 OGE Energy Corp OGE $1 16 91.25 $1 34 $1 43 $1 53 $1 57 $1 62 61 67 51 72 $1 78 $1 84 01 93 $2 04 92 14 S2 26 92 38 074 51 75 Otter Tral Corporabon OTTR $1 36 $1 36 01 36 51 35 91 34 11 43 01 52 $1 62 $1 72 $1 82 51 93 52 04 92 14 52 26 $2 38 $2 50 678 40 76 Pinnacle West Capital Corporaton PNW 02 57 62 69 62 81 02 93 53 06 1322 63 39 93 57 $33 78 54 00 62 24 72 46 04 70 04 94 $521 $5 46 $171 60 77 PNM Resources, Inc 78 Portland General Electnc Company
PNM POR
50 90 1 9127 SO 96 $1 34
51 07 $1 41
$1 17 91 49
91 28 $1 57
$1 41 91 70
S1 56 01 64
01 71 01 99
91 87 52 15
6204 62 32
9221 92 49
92 33 32 62
02 45 02 76
52 68 02 91
92 72 63 06
92 66 $322
$89 69 $101 07
79 SCANA Corporation SCG 62 33 $2 46 $2 62 $2 76 62 91 $3 14 03 36 13 63 $3 90 $4 19 54 50 $44 74 04 99 5526 55 53 $5 82 9162 61 80 Woccosin Energy Corporation WEC 91 67 51 77 01 88 $2 00 92 13 52 26 62 39 $2 63 $2 67 92 82 $2 96 03 12 $3,29 53 46 63 64 62 63 6120 17 81 Xcel Enemy Inc XEL 61 37 51 45 91 53 $1 61 $1 69 51 81 51 93 92 06 92 20 92 34 $2 50 52 63 52 77 $2 91 13 07 93 23 $101 23
81 Protected Annual Data 82 Investor Cash Fbves 1641 1651 1661 1671 165/ 1691 170I 711 1721 1731 1741 ' 1751 1761 1771 (781 1791 [60] 1611
Into! 83 Company TIcker Outfbw 10/14/16 12/31/16 6/30/17 6130/18 6/30/19 6/30/20 6/30/21 6/30/22 6/30/23 6/30/24 6/30/25 6/30/26 6/30/27 6/30/28 6/30/29 6/30/30 6/30/31 84 ALLETE, Inc ALE (158 43) 6010 SO 50 $2 40 32 55 $2 66 52 78 $2 93 53 09 5327 $3 45 53 65 $3 86 62 06 5427 54 50 54 74 $161 31 85 Mont Energy Corporation LNT (037 32) $0 00 $024 $1 15 0125 $1 32 51 39 $1 50 $1 62 $1 74 $1 86 01 99 32 13 $224 62 36 52 415 02 82 669 10 86 Ameren Corporation AEE (049 34) $0 00 SO 36 $1 71 $1 82 $1 90 91 98 92 12 92 26 62 41 52 57 52 73 92 90 03 06 53,22 93 39 53 56 3121 39 87 Aosta Corporation AVA (540 91) 50 DO SO 213 $1 36 $1 46 51 51 $1 58 $1 66 $1 76 $1 66 01 96 $2 06 9220 92 31 $2 44 02 56 62 70 691 93 86 CMS Energy COrporation CMS (942 14) $0 00 0028 91 33 $1 44 $1 53 $1 61 $1 74 01 87 12 01 52 15 52 30 92 45 $2 55 92 71 62 86 93 01 0102 42 89 DTE Energy Company DTE (591 72) SO CO $O 62 $3 00 63 21 93 37 66 63 66 81 54 10 54 40 54 72 55 07 $5 43 95 71 56 01 56 33 $6 67 0227 03 90 El Paso Electro Corrateny EE (344 96) 90 00 90 29 $1 37 $1 42 51 46 51 50 $1 61 $1 72 $1 85 $1 98 32 13 6228 $2 40 $2 53 52 66 92 50 995 50 91 IDACORP Inc IDA ($75 24) 60 CO $0 45 32 17 12 44 $2 63 32 78 $2 94 62 13 23 33 $3 55 63 79 64 06 94 27 54 50 $44 74 6499 9169 84 92 NorthWestem Comorabon NWE (059 18) SO 00 60 41 $1 66 32 06 $2 16 $224 32 41 52 130 02 80 53 01 63 23 63 47 03 65 53 65 5405 $44 26 $145 14 93 OGE Energy Corp OGE (929 66) $0 00 5025 $1 19 $1 34 01 43 $1 53 91 57 51 62 $1 67 $1 72 91 78 $1 84 $1 93 52 04 92 14 3226 576 89 94 Otter Tool Cos:oral= OTTR (531 33) 90 00 90 29 $1 40 91 38 01 35 01 34 61 43 51 52 $1 62 $1 72 $1 86 $1 93 52 04 $2 14 5226 $2 36 $80 90 95 Porn.* West Capital Corporation PNW (974 66) SO CIO 60 55 32 62 $2 81 62 93 63 06 $3322 $33 39 63 57 53 78 64 00 5424 54 46 04 70 34 94 95 21 617728 96 PNM Resources, Inc PNM 1532 97) 60 00 60 19 $0O 93 $1 07 $1 17 $128 $1 41 $1 56 01 71 $1 87 $2 04 5221 $2 33 $2 45 52 58 02 72 092 55 97 Portland General Electric Compeny POR 1541 27) $0O CO 6027 $1 31 $1 41 51 49 $1 57 91 70 91 64 01 99 52 15 52 32 92 49 62 62 62 76 02 91 93 06 9104 30 98 SCANA Corporaton SCG ($70 23) 60 CO 30 50 $2 39 $2 60 12 76 32 91 $3 14 63 38 13 63 03 90 54 19 $44 50 64 74 64 99 1526 65 53 0166 44 99 Woconsin Energy Corporabon WEC (560 18) 90 60 60 36 51 72 51 86 $2 CO $2 13 02 26 $2 39 02 53 62 67 52 82 $2 96 53 12 53 29 $346 03 64 6124 OD
100 Xcel Energy Inc XEL (341 46) 50 00 $0 29 $1 41 $1 53 $1 61 $1 69 $1 81 $1 93 52 06 $2 20 62 34 62 50 52 63 02 77 52 91 $3 07 5104 46
Schedule RBH-2
Page 17 of 20 768

Lire No 1 2
3 4 5 6 7 8 9 10 11 12 13 14 15
26 CompanY Ticker 27 ALLETE, Inc ALE 28 Allent Energy Corporation LNT_ 29 Arneren Corporation AEE 30 Avista Comore= AVA 31 CMS Energy Corporation CMS 32 DTE Energy Company DTE 33 El Paso Elecbc Company EE 34 IDACORP lnO IDA 35 Northwestern Corporator% NWE 36 OGE Energy Corp OGE 37 Otter Tail Corporabon OTTR 38 Pinnacle West Camel Corporation PNW 39 PNM Resources, Inc PNM 40 Portland General Electnc Company POR 41 SCANA Corporation SCG 42 Wisconsin Energy Comorabon WEC 43 )(eel Energy Inc XEL
16 17 18 19 20 21 22 23 24 25 Providad Annual
Earle. per Share , 1141 1181 1161 1171 1181 1101 1201 1211 1221 1231 1241 1251 1261
Ing.its 121 131 141
Mulb-Stage Growth Discounted Cash Flow Model 100 Day Average Stock Proe
Nigh EPS Grooth Rate Eebriete 6 First Stage
151 161 171 61 191 1101 1111 1121 1131 0 ( EPS Growth Rate Estimates Long-Term Payout Rabo Iterative Solution Terminal Tamar*
Value High CornPany Ticker Pnce Zack* First Call Line Growth Growth 2018 2020 2026 Proof IRR P/E Rabo PEG Ratio ALLETE, Inc ALE 958 42 5 50% 5 00% 4 C.0% 5 50% 5 27% 66 00% 65 CO% 66 55% ($0 00) 11 33% 20 97 3 98 Anent Enemy Corporator LNT 937 32 6 10% 6 60% 6 00% 6 80% 5 27% 62 00% 61 005. 66 88% (50 00) 9 55% 20 97 3 98 Ameren Corporation AEE $49 34 6 10% 5 20% 6 00% 6 10% 5 27% 66 WM 63 00% 06 66% (SO 00) 9 91% 20 97 3 98 Meta CorporMor AVA 540 91 5 30% 5 00% 5 00% 5 30% 5 27% 67 00% 65 00% 66 ea% (so 00) 9 07% 20 97 3 98 CMS Energy C.orporation CMS 942 13 6 6016 7 27% 6 00% 7 27% 5 27% 64 00% 62 00% 65 BB% (90 00) 9 90% 20 97 3 98 DTE Enemy Company DTE $91 72 5 aox 5 51% 6 0014 6 00% 5 27% 62 03% 60 00% 66 ea% (so 00) 9 81% 20 97 3 98 El Paso Elecinc Company EE 744 96 4 40% 7 00% 2 50% 7 0016 5 27% 63 00% 59 00% 66 18% ($0 00) 9 73% 20 97 3 98 IDACORP, Inc IDA 57524 4 00% 4 00% 3 00% 4 00% 5 27% 53 00% 60 00% 66 66% ($0 00) 9 05% 20 97 3 98 Northwestern Corporabon NINE 359 18 5 0016 5 00% 6 50% 6 50% 5 27% 63 03% 59 00% 66 86% (SO 00) 10 19% 20 97 3 96 OGE Energy Corp OGE 52956 5 20% 4 30% 3 00% 5 20% 5 27% 66 00% 74 00% 66 88% (SO 00) 11 13% 20 97 3 98 Otter Tad Corporation OTTR 931 33 NA 6 00% 6 00% 6 00% 5 27% 82 00% 54 00% 66 86% (SO 00) 10 32% 20 97 3 96 Pinnacle West Cape! Corporation PNW 974 66 4 3016 3 95% 4 00% 4 30% 5 27% 63 00% 64 00% 66 58% (50 00) 9 60% 20 97 3 98 PNM Resources, Inc PNM 532 96 6 70% 5 90% 9 00% 9 00% 5 27% 51 CO% 55 00% 66 95% (SO CO) 11 65% 20 97 3 96 Portend General EleMno Company POR $4127 6 00% 5 90% 5 50% 6 00% 5 27% 59 00% 58 00% 66 MS% (90 00) 9 91% 20 97 3 98 SCANA Corporation SCG 97023 5 50% 6 00% 4 50% 6 00% 5 27% 58 00% ' 59 00% 66118% (50 00) 10 60% 20 97 3 98 Weconsin Energy Corporation WEC 560 18 6 20% 6 72% 6 CO% 6 72% 5 27% 67 00% 67 00% 66 88% ($0 00) 0 37% 20 97 3 98 Xcel Enemy Inc XEL 541 48 5 40% 5 34% 5 50% 5 50% 5 27% 62 00% 62 00% 6686% (8000) 9 94% 20 97 3 98
DCF Result Mean 10 02% 20 97 3 9B
Max 11 65% 20 97 3 98 Mb 8 37% 20 97 3 96
34 45 54 72 80 00 55 30 95 62 65 96 96 31 80 67 97 04 57 43 07 83 98.25 58 88 59 14 5962 910 13 010 66 5203 i 92 17 92 32 52 49 92 66 52 85 $3 04 53 23 93 43 93 63 93 93 94 04 54.25 34 47 94 71 94 96 3522 93 87 54 02 54 19 54 35 94 53 94 71 94 91 35 12 55 36 55 62 65 91 56 22 $6 55 96 59 9725 97 64 sa 04 52 90 53 09 53.29 53 50 53 73 93 97 34 22 84 48 54 74 95 01 9529 $5 57 55 66 96 17 56 50 56 84 07.20 51 69 51 78 $1 87 , 91 97 52 07 52 18 62.23 52 41 $2 54 92 67 52 81 92 96 93 12 53.28 93 45 53 63 53 53 51 56 , 91 65 51 75 51 86 51 97 32 09 02 21 52 34 92 47 92 61 $2 75 52 89 13 04 9320 53 37 93 55 13 74 13.92 04 09 0426 94 45 54 64 34 1M 55 05 SS 29 55 54 95 82 36 11 96 44 56 77 97 13 57 51 97 90 98 32
I 51 64 $1 79 31 96 52 12 52 31 62 52 52 73 52 95 13 16 53 36 53 56 93 75 93 95 54 16 $4 37 94 61 94 65 62_04 52 16 9229 52 43 92 58 52 73 32 89 33 06 9323 5341 53 59 93 78 63 98 34 19 94 41 94 64 54 IN 33 61 5404 9426 $4 54 64 81 15 10 95 40 80 71 96 03 56 36 $6 71 67 05 57 43 57 63 9824 68 67 59 13 92.34 1 52 50 52 67 92 84 53 04 5324 53 45 93 66 93 65 94 11 54 33 34 56 94 80 55 06 $5 32 95 60 55 90 32 10 1 S222 32 34 52 47 52 60 52 74 62 89 93 05 93 22 93 39 53 57 93 76 53 95 94 16 34 35 34 61 54 86
2015 2016 2017 2018 2019 2020 0621 2022 2623 2024 2025 .5028 2027 93 38 i 93 57 53 76 93 97 $4 19 34 42 54 66 54 91 55 18 55 45 15 74 96 05 80 36 01 09 1 51 80 51 92 52 05 52 la 92 33 92 47 52 63 52 78 92 94 93 10 93.27 93 44 52.38 52 53 $2 66 52 54 93 02 53 20 53 39 53 59 93 79 54 00 54 22 94 44 04 68 9126 , $1 99 92 10 92 21 52 32 92 45 92 58 92 71 52 86 93 01 63 17 93 33 53 51 51 89 5 52 03 92 17 92 33 52 50 52 66 52 87 53 06 53.25 5345 93 64 53113 54 03
1271 1281 1201 1301
2028 2029 2030 2031 56 70 97 05 57 43 57 82 53 62 63 81 54 01 9423 $4 92 35 18 95 46 95 74 93 69 53 69 54 09 54 31 5425 94 47 54 71 54 95
PUC Docket No. 46449 EXHIBIT RBH-2
Page 18 of 20
43 Projected Annual 44 Dividend Payout Ratio 1311 1321 133) 1341 135/ 381 1371 1381 [39] 1401 [41] 1421 1431 441 1451 1461
45 Company Tcker 46 ALLETE, Inc ALE 47 Anent Energy Corporation LNT 48 Arneren Corporation AEE 49 Amara Corporation AVA 50 CMS Energy Corporation CMS 51 DTE Energy Compeny DTE 52 El Paso Electric Company EE 53 IDACORP, Inc IDA 54 NorthWestern Corporal= NWE 55 OGE Energy Corp OGE 56 Otter Tel Comorabon OTTR 57 Pinnacle West Capdal Corporation PNW 58 PNM Resources, Inc PNM 59 Portland General Electnc Conmeny POR 60 SCANA Corporation SCG 61 Weccoarn Energy CoGomtion WEC 62 Xcel Energy Inc XEL
62 PropMed Annie! 63 Cash Flows
64 Comer)" Ticker 65 ALLETE, Inc ALE 66 Anent Energy Corporation LNT 67 Ameren Corporation AEE 68 Aosta Corporation AVA t 68 CMS Energy Corporator CMS 70 DTE Energy Cornpsny DTE 71 El Paso Electric Company EE 72 IDACORP Inc IDA 73 Northwestern Corporabon NWE 74 OGE Energy Corp OGE 75 Otter Tat Corporabon OTTR 76 Pinnade West Capital Corporation PNW 77 PNM Resources, Inc PNM 78 Portland Genere Electric Company POR 79 SCANA Corporation SCG 60 Wisconsin Energy Corporaroon WEC 51 Xcel Enorgy Inc XEL
2016 2017 am 2019 2020 2021 2022 2023 2024 2025 2026 2027 2028 2029 2030 2031 i 66 00% 65 75% 65 50% 65 25% 65 DO% es 31% 65 63% 65 94% 66 26% E6 57% 66 68% 66 88% 66 68% 66168% 66 86% 66 66%
i
62 00% 61 75% 61 50% 6125% 61 00% 61 98% 62 96% 63 94% 64 92% 65 90% 66 M% 66 88% 66 88% 66 6651 66 601% 66 88% 66 00% 65 25% 64 50% 63 75% 63 CO% 63 65% 64 29% 64 94% 65 59% 66 24% 66 88% 06168% 66168% 66 93% 66 88% 66156% 67 00% 66 50% 66 OD% 65 50% 6500% 65 31% 5663% 6594% 5626% 6657% 66 68% 6666% 66 86% 66 58% 0688% 6686%
I 64 00% 63 50% 63 CO% 62 50% 62 00% 62 81% 63 63% 64 44% 6526% 66 07% 66 66% 66 43% 06 88% 66 66% 66 68% 66 55% 1 62 DO% 61 505. 61 00% 013 50% 60 00% 61 15% 6229% 63 44% 64 59% 65 74% 66 88% 66 55% 66 MI6 06 88% 66 88% 6666% 1 63 00% 62 00% 61 DO% 00 00% 59 OD% 60 31% 61 63% 62 94% 6426% 65 57% 66 88% 66 88% 66 93% 66 86% 6691% 66 88% 1 53 00% 54 75% 56 50% 5825% 60 00% 61 15% 6229% 63 44% 64 59% 65 74% 66 86% 66 88% 66 66% 66 86% 66 86% 66 56% 1 63 00% 62 00% 61 00% 60 00% 59 OD% 60 31% 61 63% 62 94% 6426% 65 57% OS 65% 66 88% 66 68% 66 66% 66 68% 66 MI%
66 00% 65 OP% 70 00% 72 00% 74 MX 72 81% 71 63% 70 44% 69 26% 68 07% 66 88% 66 88% 66 66% 66 UM 66 5.5% 66 8616
/
162 CO% 77 50% 73 OD% 66 50% 64 00% 64 46% 64 96% 65 41% 65 92% 06 40% 66 16% 66 88% 05 66% 66 56% 66 88% 66 86% 63 OD% 63 25% 63 50% 63 75% 64 OD% 64 4a x 64965. 65 44% 65 92% 66 40% 66 58% 66 65% 66 68% 66 at% 66 96% 66 MI% 51 00% 52 00% 53 00% 54 00% 55 03% 56 98% 56 96% 60 94% 62 92% 6490% 66 88% 66 68% 66 68% 66 86% 66 88% 6696%
r 59 00% 58 75% 58 50% 5625% 56 00% 59 46% 60 96% 62 44% 63 92% 65 40% 66 56% 66 68% 66 68% 6615% 66 M% 66 MI% 58 CO% 5325% 58 5D% 58 75% 59 951% 60 31% 61 63% 62 94% 6426% 65 57% 66 66% " 66 66% 66 88% 66 86% 66 86% 66 &I%
r 67 00% 67 00% 67 00% 67 00% 67 00% 66 98% 66 95% 66 94% 66 92% 66 90% 66 816% 6666% 65 56% 66 88% 66 68% 66 86% 62 00% 62 00% 62 00% 62 00% 62 00% 62 81% 63 63% 64 44% 65 26% 66 07% 66 68% 66 816% 66 86% 66 68% 66 66% 66 56%
1471 1481 189) 1501 1511 1521 1531 1541 1551 1561 1571 1501 [59] 1501 161/ 1621 1631 Terminal
2016 2017 2018 2019 2020 2021 2022 2023 2024 2025 2026 2027 2025 2029 2030 2031 Value $2 35 92 47 62 60 52 73 92 87 13 04 1322 $3 41 53 61 93 82 54 04 54 26 54 48 94 72 54 97 8023 $163 94 $1 12 91 19 0126 51 34 91 42 SI 53 91 6S 91 78 91 91 92 05 52 19 92 30 62 42 92 55 52 68 92 83 361161 $1 67 91 75 51 83 $1 92 $2 02 32 16 62 31 92 46 92 63 62 79 92 97 93 13 5329 53 47 93 65 $3 84 6120 45 $1 33 SI 39 $1 46 91 52 91 59 31 68 91 79 $1 86 $1 99 $2 11 9223 62 35 92 47 32 60 52 74 32 88 590 37 51 30 51 38 $1 47 91 56 31 66 61 60 61 95 92 10 $2 26 92 46 92 56 52 70 92 84 92 99 $3 15 53 31 9103 87 $2 92 53 00 $3 23 93 40 53 57 93 66 54 15 54 47 54 60 $5 15 95 52 15 611 96 11 6644 $6 78 37 13 5223 63 51 37 $1 44 91 52 61 60 51 68 91 83 51 99 92 16 $2 33 52 51 $2 70 52 84 $2 99 93 15 53 32 93 49 9109 47 92 13 $2.29 52 46 92 64 52 613 53 CO 53 19 53 40 53 63 53 88 $416 54 38 64 61 54 66 56 11 $5 38 5168 60 $1 95 92 04 92 14 92 24 92 34 62 55 92 76 52 99 $322 53 47 $3 72 53 92 SA 13 54 34 54 57 54 82 $150 98 $1 17 51 27 SI 38 91 49 91 61 61 67 51 73 31 79 91 85 61 91 91 98 92 oe 62 19 $2 31 52 43 92 56 68024 51 36 61 36 91 36 91 36 51 34 51 43 $1 52 91 62 61 72 51 82 $1 93 6204 52 14 6226 92 38 32 50 578 40 92 58 62 70 92 82 52 96 93 10 63 26 53 44 63 63 $3 83 54 06 54 30 34 53 94 77 55 02 $529 $5 57 9174 50 SO 91 $1 01 51 13 91 25 51 39 91 56 91 74 91 92 52 12 32 31 92 51 92 64 52 78 92 93 33 011 9324 6101 66 $128 $1 35 91 42 $1 50 51 58 $1 72 61 616 92 02 $2 18 92 35 52 53 32 66 $2 80 92 95 93 11 93.27 9102 52 92 34 92 49 52 65 92 63 63 01 $326 $3 52 93 60 54 09 64 40 94 72 54 97 $5 23 80 51 80110 56 11 5191 47 $1 67 61 79 51 91 52 03 92 17 12 31 12 45 52 60 92 75 52 90 $3 05 5321 53 38 93 56 63 75 53 95 3123 73 91 37 $1 45 91 53 61 61 91 70 $1 82 $1 94 S2 07 92 21 52 36 52 51 52 64 92 78 62 93 63 09 13 25 9101 85
1641 1651 1661 1671 1881 1801 F701 1711 1721 1731 1741 1751 1761 1771 1781 1791 180/ 1811 Intel
Ticker Outflow 10/14/16 12/31/16 6/30/17 6/30/18 6/30/19 6/30/20 6/30/21 8/30/22 6/30/23 6/30/24 6/30/25 6/30/26 6/30/27 6/30/213 6/30/29 6/30/30 6/30/31 ALE (555 43) $0 00 80 50 62 42 62 00 $2 73 s2137 53 04 5322 93 41 53 61 53 82 94 04 5426 54 46 $4 72 94 97 9169 16 LNT 1637 32) 60 00 8024 91 15 5126 91 34 $1 42 91 53 51 65 61 78 91 91 $2 85 $2 19 92 30 52 42 92 55 92 68 991 43 AEE (649 34) 60 00 SO 36 SI 72 $1 83 61 92 92 02 52 16 92 31 52 46 52 63 92 79 $2 97 53 13 5329 63 47 53 65 $124 29 AVA (540 91) 60 00 9025 $1 37 91 46 $1 52 $1 59 $1 68 91 78 91 86 SI 99 62 11 5223 $2 35 92 47 92 60 52 74 593 25 CMS (542 14) 80 00 9025 51 34 SI 47 $1 56 51 66 51 60 91 95 02 10 $2 25 62 40 52 56 52 70 $2154 32 99 53 15 5107 18 DTE (591 72) 50 CO 50 62 93 01 6323 93 40 13 57 53 66 94 15 $4 47 54 60 65 15 95 52 15 01 96 11 96 44 56 78 $230 76 EE (644 96) 30 00 SO 29 51 42 91 52 91 60 S1 66 61 83 $1.99 52 16 52 33 $2 51 92 70 92 64 92 99 53 15 53 32 5112 96 IDA (975 24) 50 00 SO 46 92 18 52 46 $2 64 92 83 $.3 00 93 19 53 40 $3 63 13 815 $4 16 54 38 $4 61 $4165 55 11 9173 96
NWE 1959 18) 50 00 SO 42 $2 01 92 14 5224 $2 34 52 55 62 76 52 99 53 22 53 47 53 72 $3 92 94 13 54 34 54 57 $155 79 OGE (529156) SO 00 9025 6120 61 38 91 49 91 61 91 67 $1 73 51 79 $1 85 $1 91 91 98 92 06 52 19 52 31 52 43 182 79
OTTR (531 33) SO 00 8029 $1 40 91 36 SI 35 61 34 61 43 $1 52 $1 62 $1 72 $1 82 51 93 52 04 $2 14 5226 62 38 980 90 PNW ($74 66) 90 00 00 55 $2 63 52 82 92 96 93 10 $326 $3 44 53 63 93 83 $4 06 94 30 9453 54 77 55 02 $5.29 $i ao PNM 1632 97) SO 00 SO 19 W 95 $1 13 5125 51 39 51 56 91 74 51 92 52 12 52 31 52 51 12 64 52 78 62 93 $33 OS 9104 90 POR (641 27) 50 00 8027 51 31 31 42 61 50 51 58 91 72 $1 156 92 02 52 18 52 35 52 53 92 66 9280 $2 95 93 11 $105 79 SCG (670 23) SO CO W 50 12 41 $2 65 52 83 53 01 5326 63 52 53 SD 64 09 64 40 54 72 54 97 9523 65 51 55 60 $197 57 WEC (350 I 8) SO CO SO 36 $1 73 31 91 92 03 52 17 52 31 52 45 92 60 62 75 52 90 $33 05 5321 53 33 93 56 53 75 5127 67 XEL (941 46) SO 00 80.29 $1 41 $1 53 51 61 $1 70 $1 82 $1 94 62 07 $221 52 36 52 51 52 64 92 78 52 93 53 09 5105 10
Schedule RBH-2
Page 18 of 20 769
81 ProreMed Annual Data 82 Investor Cash Fbws
83 Consery 84 ALLETE. Inc 85 Anent Energy Corporation as Ameren Corporation 87 , Awsta Corporation 88 CMS Energy Corporation 59 DTE Energy Company 90 El Paw Electric Conmany 91 IDACORP Inc 92 NorthWestern Corpombon 93 OGE Energy Corp 94 OflerT.sl Corporator 95 Penade West Capital Corporation 96 PNM Resources, Inc 97 Portland General Electric Company 96 SCANA Corporation 99 Wisconsin Energy Corporation 100 Xcel Energy Inc

Lme 7 in..e 2
3 Compeny 4 ALLETE, Inc 5 Alhant Energy Corporation 6 Artier Corporation 7 Awsta Con:Orem 8 CMS Energy Corporation 9 DTE Energy Company 10 El Paso Electric Company 11 IDACORP, Inc 12 Northwestern Corporabon 13 OGE Energy Corp 14 Otter Tail Corporation 15 Pinnade West Capital Corporation 16 PNM Resources, Inc 17 Portland General Electec Company 18 SCANA Corporation 19 Wisoonsin Energy Corporation 20 Xcel Enemy Inc 21 22 23 24 25 Projected Annual
Earrings per Share
26 company 27 ALLETE. Inc 28 Allan( Energy Corporabon 29 Arneren Coroorabon 30 Avesta Corporation 31 CMS Energy Corporahon 32 DTE Energy Company 33 El Paeo Elednc Conwany 34 IDACORP, Inc 35 NortloWestern Corponibon 36 OGE EnergY Con, 37 Otter Tail Corporation 36 Pinnacle West Capital Corporation 39 PNM Resources, Inc 40 Portland General Eledno Company 41 SCANA Corporation 42 Weconon Energy Corporation 43 %cal Energy Inc
PUC Docket No. 46449 EXHIBIT RBH-2
Page 19 of 20
111 121 131 141
Mut-Stage Growth Discounted Cash Flow Model 180 Dey Average Stock Pnce
Low EPS Growth Rate Echoed. er Fret Stage
151 161 171 181 191 1101 1111 021 1131 Stock EPS Growth Rate Estin*es Long-Tenn Payout Rabo Iterative Solution Terminal Terminal
Value Low Twker Pnce Zacks First Call Line Growth Growth 2016 2020 2026 Proof 112R P/E Raho PEG Raho ALE $58 42 5 50% 5 00% 4 00% 4 00% 5 27% 66 00% 65 DO% 68 88% (50 00) 10 39% 20 97 3 98 LNT $37 32 6 10% 6 60% 6 00% 6 OD% 5 27% 62 00% 61 00% 66 88% (50 CO) 9 19% 20 97 3 98 AEE $49 34 6 10% 5 20% 6 00% 5 20% 5 27% 66 00% 63 00% 65 86% (90 DO) 9 36% 20 97 3 96 AVA 940 91 5 30% 5 00% 5 PO% 5 00% 5 27% 67 00% 65 00% 66 88% (SO 00) 8 atm 20 97 3 90 CMS $42 13 6 60% 7 27% 6 00% 6 DO% 5 27% 64 DD% 62 00% 66 88% (9000) 9 14% 20 97 3 98 DTE 991 72 5 80% 5 51% 8 00% 5 51% 5 27% 62 00% 60 00% 66 65% (SO 00) 9 51% 20 97 3 98 EE 644 96 440% 7 00% 2 50% 2 50% 5 27% 63 00% 59 00% 66 88% (90 00) 7 04% 20 97 3 96 IDA $75 24 4 00% 4 GO% 3 00% 3 00% 5 27% 53 00% 60 00% 66 88% (SO 00) 8 44% 20 97 3 96 NWE 659 18 5 00% 5 00% 6 50% 5 00% 5 27% 63 DO% 59 00% 66 88% (6000) 9 28% 20 97 3 98 OGE $29 86 5 20% 4 30% 3 00% 3 00% 5 27% 66 00% 74 00% 60 88% (50 03) 9 73% 20 97 3 98 orrR 931 33 NA 6 00% 6 00% 6 00% 5 27% 112 00% 64 00% 66 88% (SO 00) 10 32% 20 97 3 98 NON 574 66 4 30% 3 95% 4 00% 3 95% 5 27% 63 00% 64 00% 66 88% (90 00) 9 38% 20 97 3 98 PNM 532 96 6 70% 5 90% 9 DO% 5 93% 5 27% 51 00% 55 00% 66 fit% (50 00) 9 78% 20 97 3 98 POR $4127 6 00% 5 90% 5 50% 5 50% 5 27% 59 00% 58 00% 66 66% (SO 00) 9 61% 20 97 3 98 SCG 970 23 5 50% 6 00% 4 50% 4 50% 5 27% 58 00% 59 00% 66 66% (W 00) 9 88% 20 97 3 98 WEC $80 re 6 20% 6 72% 6 00% 6 00% 5 27% 67 00% 67 00% 66 86% (90 00) 7 94% 20 97 3 96 XEL PO 46 5 40% 5 34% 5 50% 5 34% 5 27% 62 00% 62 00% 66 88% (50 00) 9 64% 20 97 3 96
Lic,F Result Mean 9 28% 20 97 3 96
Max 10 39% 20 97 3 96 Min 7 04% 20 97 3 98
1141 1151 1161 1171 1181 1191 1201 1211 1221 1231 241 1251 1261 1271 1281 1291 1301
Tidier 2015 2016 2017 20115 2019 2020 2021 2022 2023 2024 2025 2021 2027 2028 2029 2030 2031 ALE 5338 • 93 52 $3 66 63 80 53 95 94 11 9429 5446 $4 68 54 91 55 16 55 43 $5 72 96 02 96 34 96 67 97 02 LNT 51 69 51 79 91 90 52 01 92 13 52 26 92 39 92 53 92 66 92 82 52 90 23 13 23 30 53 47 93 65 $3 85 9405 AEE 9238 $2 50 92 63 92 77 92 92 63 07 53 23 $3 40 63 57 $3 76 53 96 $4 17 $4 39 54 62 54 66 55 12 65 39 AVA 91 119 91 96 $2 08 52 19 $2 30 92 41 52 53 52 66 $2 80 92 94 23 10 53 26 53 43 53 62 53 81 $4 01 9422 CMS 31 69 $2 MI 52 12 9225 92 39 92 53 52 65 52 83 92 99 $3 16 63 33 60 50 $3 CO $3 155 54 09 54 30 54 53 DTE 54 45 64 70 54 95 $523 26 51 55 82 96 14 26 47 96 e2 57 18 $7 57 97 97 98 39 95 83 59 29 99 78 910 30 EE 52 03 92 06 92 13 92 19 5224 52 30 52 36 52 45 62 54 $2 65 92 78 92 93 $3 08 23 24 $3 41 53 59 53 78 IDA 23 87 23 99 54 11 9423 54 36 $4 49 54 64 64 81 55 01 55 24 5 49 $5 78 26 09 56 41 26 75 97 10 $7 46
NWE 92 90 23 05 $323 $3 36 63 52 53 70 93 89 54 09 94 30 $4 52 $4 75 95 01 9527 $.5 55 25 64 66 15 9647 OGE 91 89 51 74 61 79 91 85 $1 90 91 06 52 03 52 10 92 19 92.29 22 40 $2 53 52 66 $2 80 92.95 $3 10 5327 OTTR 51 56 ' 51 65 91 75 51 86 21 97 52 09 92 21 52 34 92 47 92 61 52 75 62 89 23 04 2320 53 37 53 55 93 74 PNW 63.92 54 07 54124 54 40 94 58 54 76 94 96 95 17 $5 41 55 67 65 96 9628 56 61 $6 95 57 32 $7 71 58 11 PNM 31 64 $1 74 91 64 91 95 5200 52 18 92 31 62 44 $2 58 $2 72 92 87 93 02 63 18 $3 34 23 52 53 71 93 90 POR 92.04 92 15 $2 27 62 40 92 53 92 67 52 el 92 96 93 12 5329 53 47 63 65 50 64 54 04 9426 54 46 64 72 SCG 53 01 63 98 $4 16 54 35 54 54 54 75 54 97 5520 55 46 55 73 96 03 66 35 56 68 57 03 97 40 57 79 $620 WEC 92.34 $2 45 92 63 92 79 92 95 63 13 93 32 $3 51 93 70 63 91 54 12 94 34 54 57 94 81 55 06 25 33 $5 61 XEL 32 10 52 21 92 33 $2 45 92 59 52 72 92 87 $3 02 53 18 $3 35 23 53 60 71 53 91 94 12 54 33 94 56 94 80
43 Projected Annwl 44 Modem] Payout Re,
45 Company Ticker 46 ALLETE. Inc ALE 47 Alhant Energy Corporation LNT 48 Arneren CorPorohnn AEE 49 Awsta Corporebon AVA 50 CMS Energy Corporatron CMS 51 DTE Energy COMPsny DIE 52 El Paso Elecbro Company EE 53 IDACORP, Inc IDA 54 NorthWeetern Corporation XIWE 55 OGE Energy Corp OGE 56 Other Tad Corporabon OTTR 57 Pinnacle West Capital Corporation PNW 58 PNM Resources, Inc PNM 50 Portland General Electric Cornpany POR 60 SCANA Corporation SCG 61 Wisoonsin Energy Corporatron WEC 62 Xcel Energy Inc XEL
311 321 1331 1341 1351 361 1371 381 1391 1401 1411 1421 143/ 1441 1451 1461
2016 2017 2018 2019 2020 2021 2022 2023 2024 2025 2026 2027 2028 2029 2030 2031 1 55 00% 65 75% 65 50% 65 25% 65 00% 65 31% 65 C21% 65 94% 8026% 66 57% 66 86% 66 88% 66 66% 66 88% 66 88% 66 68%
I
62 00% 61 75% 61 50% 6125% 61 00% 61 98% 62 96% 6394% 64 92% 65 90% 66 DO% 66 66% 66 66% 80 86% 66 88% 66 88% 05 00% 65 25% 64 50% 63 75% 63 00% 63 65% 6429% 6494% 65 59% 6624% 66 88% 66 86% 66 66% 66 88% 68 88% 66 88% 67 00% 66 50% 66 00% 85 50% 65 00% 65 31% 85 63% 65 94% 6e20ii 6657% 66 815% 6666% 86 88% 86 06% 66 88% 66 88%
, 64 00% 63 50% 63 00% 62 50% 62 00% 62 81% 63 63% 64 44% 6526% 66 07% 66 66% 66 88% 66 68% 66 88% 66 86% 66118% I 62 00% 61 50% 61 00% 110 50% 00 00% 61 15% 6229% 63 44% 64 59% 65 74% 6610% 66 68% 66 88% 66 88% 66 88% 66 88% ! 63 00% 62 00% 61 00% 60 00% 56 00% 60 31% 61 63% 62 94% 6426% 65 57% 86 88% 66 88% 66 88% 66 68% 66 88% 116 66% t 53 00% 54 75% 5650% 5825% 60 00% 61 15% 62 29% 63 44% 64 59% 65 74% 66 86% 66 88% 66 88% 66 NM 66 SS% 66 646% , 63 CO% 62 00% 61 00% 60 00% 512 00% 60 31% 61 63% 62 94% 64 26% 65 57% 66 88% 66 821% 86 88% 66 65% 66 88% 86 66% 1 66 00% 68 OD% 70 00% 72 00% 74 00% 72 81% 71 63% 70 44% 69 26% 68 07% 06 66% 66 88% 66 88% 66 65% 86 86% 66 88% r 82 00% 77 50% 73 00% 66 50% 64 00% 64 48% 64 96% 65 44% 65 92% 66 40% 86 86% 66 08% 66 88% 66 88% 66 88% 66 the% 1 63 00% 6325% 63 50% 63 75% 64 CP% 64 46% 64 96% 65 44% 65 92% 06 40% 66 88% 66 88% 66 615% 66 68% 66 88% 66 88%
1
51 00% 52 00% 53 00% 54 00% 55 00% 56 98% 58 96% 60 94% 62 92% 64 90% 66 68% 66 88% 66 88% 66 88% 66 06% 86 88% 59 00% 58 75% 56 50% 55 25% 56 00% 59 48% 80 96% 62 44% 63 92% 65 40% 66 88% 66 88% 66 86% 66 66% 66 66% 66 66%
i 58 00% 58.25% 58 50% 58 75% 59 00% 60 31% 61 63% 62 94% 64 26% 65 57% 86 66% 66 BM 56 88% 66 88% 66 68% 66 66%
I 67 00% 67 00% 67 00% 67 CO% 67 00% 66 98% 66 96% 06 94% 86 92% 66 90% 66 66% 86 66% 66 88% 66 88% 66 66% 86 88% 62 GO% 62 00% 62 00% 62 00% 62 00% 62 81% 63 63% 64 44% 65 26% 86 07% 66 86% 66 66% 66 CS% 05 88% 66 88% 156 88%
62 Protected Annual 63 Cash Flows
64 Comp.:1y Ticker 85 ALLETE, Inc ALE 66 Allient Ener9y CoMdblen LNT 67 Amman Corn...bon AEE 615 Aosta Comoration AVA 69 CMS Energy Corporation CMS 70 DTE Energy Combiny DTE 71 El Paso Electric Company EE 72 IDACORP, Inc IDA 73 NorthWestern Corporabon NWE 74 OGE Energy Cap OGE 75 Otter Tall Corporabon OTTR 76 Pinner,* West Capital Corporation PNW 77 PNM Reoource9, lrc PNM 78 Portland General Electnc Comlow15 POR 79 SCANA Corpombon SCG ao Wisconsin Energy Corporalwn WEC 81 Xcel Entire,/ In. XEL
[47] 1481 1491 150/ 1511 1521 1531 1541 [551 1561 1571 1561 (59] 1601 1611 1021 1631 Terminer
2016 2017 2018 2019 2020 2021 2022 2023 2024 2025 zon 2027 2028 2029 2030 2031 Value
$2 32 $2 40 52 49 92 58 92 67 $2 03 92 54 53 09 63 25 60 43 63 CS 63 82 94 03 5424 54 46 54 70 9147 25
$1 11 $1 17 5124 91 31 $1 38 $1 48 91 59 91 71 $1 83 91 96 62 09 9221 92 32 22 44 52 57 52 71 964 93 / 51 65 91 72 91 79 91 86 $1 93 92 05 $2 18 52 32 92 47 52 62 22 79 92 93 63 09 2325 63 42 53 60 9112 99 / 21 33 51 36 91 44 61 50 51 57 91 65 91 75 VI 85 51 95 52 06 $2 18 92 30 52 42 $2 55 92 68 92 02 966 46 t 91.28 91 35 91 42 51 49 $1 57 51 68 91 60 91 93 52 06 5220 $2 34 52 47 52 60 92 73 $2 05 93 03 594 911 t 92 91 93 05 63 19 53 34 53 49 $3 75 94 03 $4 33 54 64 54 97 25 33 55 61 $5 90 9622 96 54 96 69 5215 99
i
91 31 $1 32 51 33 51 34 51 36 61 43 $1 51 51 80 51 70 91 82 $1 96 92 06 92 17 5226 $2 40 $2 53 979 33
92 11 62.25 62 39 52 54 52 89 92 84 53 00 63 18 53 38 53 61 93 87 64 07 54 29 54 51 $4 75 65 (X) 5156 64 I 21 92 $1 98 52 05 92 11 52 18 52 34 92 52 52 70 52 90 93 12 53 35 53 52 53 71 63 91 54 II 54 33 5135 73
91 15 $1 22 9129 51 37 $1 45 $1 47 51 51 $1 54 $1 58 $1 63 $1 60 $1 78 91157 $1 97 62 06 $2 18 960 49
51 36 91 36 51 36 51 35 51 34 91 43 $1 52 51 82 91 72 91 82 91 93 52 04 62 14 9226 $2 36 $2 50 578 40
92 57 $2 68 52 80 92 92 53 05 6320 93 36 23 54 53 74 63 95 5420 54 42 $4 65 94 90 55 16 55 43 9170 16
2069 50 96 91 03 $1 11 9120 $1 32 $1 44 91 57 91 71 SI 66 52 02 52 12 5224 92 36 $2 45 $2 61 661 83 i 51 27 51 33 91 40 01 47 $1 55 91 67 91 81 91 95 92 10 92 27 92 44 92 57 92 70 $2 85 53 00 53 16 998 94
1
S2 31 52 42 92 54 62 67 $2 80 53 GO $3 21 63 44 $3 66 63 95 64 24 54 47 64 70 94 95 95 21 55 49 9172 06
91 66 91 76 91 87 91 98 92 10 5222 52 35 62 48 52 62 52 76 22 90 93 05 $321 63 38 63 56 60 75 5117 59
51 37 51 44 $1 52 51 60 91 69 91 00 91 92 62 05 52 19 92 33 52 40 52 61 52 75 52 90 93 05 2321 5100 70
81 Prowled Annual Dee 82 Investor Cash Flows
1641 1651 1661 1671 I881 1691 170/ 1711 172] 1731 f741 1751 1761 1771 Fel 1791 [80] [ell Intel
83 Company Ticker Outflow 10/14/16 12/31/16 6/30/17 6/30/18 6/30/19 6/30/20 6/30/21 6/30/22 6/30/23 6/30/24 6/30/25 6/30/28 6/30/27 6/30/28 6/30/29 mono 6/30/31 84 ALLETE, Inc ALE (956 43) SO 00 W 50 52 37 32 49 52 58 52 67 52 80 52 94 23 09 6025 53 43 53 63 $3 02 94 03 5424 54 46 2151 95 115 Affront Energy Corporation LNT (937 32) W DO 9024 61 14 $1 24 51 31 $1 35 91 46 $1 59 $1 71 $1 83 $1 96 52 09 9221 92 32 92 44 92 57 9157 64 86 Anwen Corporation AEE (949 34) W 00 SO 35 91 70 91 79 51 66 61 93 92 05 52 18 92 32 92 47 62 62 52 79 92 93 63 CG 93 25 93 42 5116 60 87 Amt. Corporation AVA (940 91) W 00 SO 28 51 36 51 44 51 50 $1 57 91 65 91 75 51 85 91 95 $2126 92 18 52 30 32 42 52 55 52 68 591.28 88 CMS Energy Corporation CMS (942 14) W 00 90.27 91 32 $1 42 $1 49 91 57 $1 66 $1 80 $1 93 $2 06 5220 52 34 62 47 92 60 92 73 52 88 596 01 e9 DTE Energy Company DTE (991 72) 10 00 60 62 62 99 $3 19 93 34 93 49 93 75 6403 54 33 54 64 54 97 95 33 65 61 65 90 5622 96 54 5222 87 90 El Paso Elect. Compeny EE (544 96) 50 00 5028 91 33 $1 33 $1 34 91 36 $1 43 $1 51 91 60 $1 70 $1 82 21 96 92 06 92 17 52 28 $2 40 $81 86 91 IDACORP Inc IDA (575 24) SO IP 90 45 92 14 $2 39 92 54 92 69 $2 84 53 CO 53 18 93 38 93 61 93 87 54 07 54 29 $4 51 $4 75 9161 84 92 Northwestern Corporation NWE (559 18) SO 00 SO 41 91 97 92 05 52 11 $2 18 52 34 62 52 92 70 92 90 93 12 53 35 63 52 93 71 $3 91 54 11 9140 02 93 OGE Energy Corp OGE (529 66) W OD 50.25 91 17 5129 $1 37 $1 45 $1 47 $1 51 $1 54 $1 58 91 63 51 69 $1 78 61 87 $1 97 52 06 570 67 94 Otter Tail Corporabon OTTR (631 33) 2000 W 29 $1 40 $1 36 51 35 51 34 $1 43 91 52 51 62 $1 72 $1 62 91 93 52 04 92 14 6226 92 30 280 90 95 Pinnacle West Capes! Corporation PNW ($74 66) $0 00 SO 55 52 62 92 10 52 92 $3 05 5320 53 36 93 54 53 74 53 95 9420 94 42 $4 65 54 90 65 16 5175 59 96 PNM Resources, Inc PNM (532 97) 60 CO 60 19 50 91 91 03 $1 11 91 20 51 32 51 44 91 57 91 71 61 06 52 02 92 12 5224 92 36 52 48 964 44 97 Portland General Electric Cornpany POR (941 27) 90 00 5027 91 30 51 40 51 47 $1 55 51 67 51 81 51 95 52 10 52 27 52 44 52 57 $2 70 52 85 53 00 5102 10 90 SCANA Corporation SCG (570 23) W 03 60 49 92 36 92 54 02 67 32 ao 53 DO 9321 63 44 63 68 93 95 6424 $4 47 54 70 54 95 95 21 9177 54 99 Waconson Energy Corporatron WEC (560 18) SO 00 50 36 91 71 61 07 61 98 52 10 9222 92 35 52 52 62 62 76 $2 90 23 05 63 21 53 38 53 56 9121 34
100 Xcel Energy Inc XEL (541 48) 50 GO 0029 $1 41 $1 52 $1 60 51 69 $1 MO 61 92 52 05 $2 19 92 33 52 48 92 61 52 75 92 90 63 05 $103 01
Schedule RBH-2
Page 19 of 20 770

PUC Docket No. 46449 EXHIBIT RBH-2
Page 20 of 20
Mufti-Stage DCF Notes [1] Source Bloomberg based on 30-, 90-, and 180-day historical average as of October 14, 2016 [2] Source Zacks [3] Source Yahoo, Finance [4] Source Value Line [5] Equals indicated value (average, minimum, maximum) of Columns pi, [3], [4] [6] Source Federal Reserve, Bureau of Econom. Analysis, Blue Chip Financial Forecast [7] Source Value Line [8] Source Value Line [9] Source Bloomberg Professional
[10] Equals Column [1] + Column [64] [11] Equals result of Excel Solver function, goal Column [10] equals 00 00 [12] Equals Proxy Group 30-day average PE ratio Source SNL Financial 113] Equals Column [12] / (Column [6] x 100) [14] Source Value Line [15) Equals Column [14] x (1 + Column [5]) [16] Equals Column [15] x (1 + Column [5]) [17] Equals Column [16] x (1 + Column [5]) [18) Equals Column [17] x (1 • Column [5]) [19] Equals Column [18] x (1 + Column [5)) [20] Equals (1 + (Column [5] + ((lColumn [6] — Column [5]) / (2026 — 2021 + 1)l x (2021 — 2020))))x Column [19) [21] Equals (1 + (Column [5] + (((Column [6] — Column [511 / (2026 — 2021 + 1)) x (2022 — 2020)))) x Column [20] [22] Equals (1 + (Column [5]* (((Column [6] — Column [5]) / (2026 — 2021 + 1)) x (2023 — 2020)))) x Column [21] [23] Equals (1 + (Column [5] + t((Column [6] — Column [5]) / (2026 — 2021 + 1)) c (2024 — 2020)))) x Column [22) [24] Equals (1 + (Column [5] + (((Column [6] — Column [5]) ) (2026 — 2021 + 1))x (2025 — 2020)))) x Column [23] [25] Equals Column [24] x (1 + Column [6]) [26] Equals Column [25] x (1 + Column [6]) [27] Equals Column [26] x (1 + Column [6]) [28] Equals Column [27] x (1 + Column [6]) [29] Equals Column [28] x (1 + Column [6]) [30] Equals Column [29] x (1 + Column [6]) [31] Equals Column [7] [32] Equals Column [31]+ ((Column [35]— Column [31]) / 4) [33] Equals Co)umn [32] + ((Column [35]— Co)umn )31]) 4) [34] Equals Column [33] + ((Column [35] — Column [31)) / 4) [35] Equals Column [8) [36] Equals Column [35] + ((Column [41)— Column [35]) / 6) [37] Equals Column [36] + ((Column [41] — Column [35)) / 6) [38] Equals Column [37] + ((Column [41] — Column [35]) / 6) [39] Equals Column [38] + ((Column [411— Column [35]) / 6) [40] Equals Column [39] + ((Column [41] — Column [35)) / 6) [41) Equals Column [9) [42] Equals Column [9] (43] Equals Column [9] [44] Equals Column [9] [45] Equals Column [9] [46] Equals Column [9] [47] Equals Column [15] x Column [31] [48] Equals Column [1E] x Column [32] [49] Equals Column [17] x Column [33] [50] Equals Column [18)x Column [34] [51) Equals Column [19] x Column [35] [52] Equals Column [20] x Column [36] [53] Equals Column [21] x Column [37] [54] Equals Column [22] x Column [38] [55] Equals Column [23] x Column [39] [56] Equals Column [24)x Column [40] [57] Equals Column [25] x Column [41] [58] Equals Column [26] x Column [42] [59] Equals Column [27] x Column [43] [60] Equals Column [28) x Column [44] [61] Equals Column [29] x Column [45] [62] Equals Column [30)x Column [46] [63] Equals Column [12] x Column [30] [64] Equals negative net present value, discount rate equals Column [11), cash flows equal Column [65] through Column [81) [65] Equals $0 00 [66] Equals Column [47)x (12/31/2016 - 10/14/2016) / 365 [67] Equals Column [47] + (0 5 x Column [51) [68] Equals Column [49] " [69] Equals Column [50] [70] Equals Column [51] [71] Equals Column [52] [72] Equals Column [53] [73] Equals Column [54] [74] Equals Column [55] [75] Equals Column [56] [76] Equals Column [57] [77] Equals Column [58] [78] Equals Column [59] [79] Equals Column [60] [80] Equals Column [61] [81] Equals Column [62] + [63)
Schedule RBH-2
Page 20 of20 771

PUC Docket No. 46449 EXHIBIT RBH-3
Page 1 of 14
Ex-Ante Market Risk Premium Market DCF Method Based - Bloomberg
Line No [1] [2] 131
S&P 500 Current 30-Year Est Required Treasury (30- Implied Market Market Retum day average) Risk Premium
1 13 13% 2 38% 10 75%
[4] [5] [6] [7] 181 [9] Market Estimated Long-Term Weighted
2 Company Ticker Capitahzation Weight rn Index Dividend Yield Growth Est DCF Result DCF Result 3 4 AGILENT TECHNOLOGIES INC A 14,623 26 0 07% 0 99% 10 43% 11 48% b 0086% 5 ALCOA INC AA 11,592 88 0 06% 0 96% 5 00% 5 98% 0 0035% 6 AMERICAN AIRLINES GROUP IN C AAL 20,481 15 0 10% 1 07% -19 12% -18 16% -0 0190% 7 ADVANCE AUTO PARTS INC AAP 10,798 59 0 06% 0 17% 10 67% 10 85% 0 0060% 8 APPLE INC AAPL 633,842 55 3 24% 1 84% 9 63% 11 56% 0 3748% 9 ABBVIE INC ABBV 97,989 39 0 50% 3 78% 11 10% '15 09% 0 0756% 10 AMERISOURCEBERGEN CORP ABC 18,981 36 0 10% 1 68% 11 18% 12 95% 0 0126% 11 ABBOTT LABORATORIES ABT 59,961 11 0 31% 2 55% 11 15% 13 84% 0 0424% 12 ACCENTURE PLC-CL A ACN 76,822 10 0 39% 2 05% 8 25% 10 38% 0 0408% 13 ADOBE SYSTEMS INC ADBE 53,620 96 0 27% 0 00% 17 32% 17 32% 0 0475% 14 ANALOG DEVICES INC ADI 19,081 85 0 10% 2 61% 10 48% 13 22% 0 0129% 15 ARCHER-DANIELS-MIDLAND CO ADM 24,509 68 0 13% 2 86% 3 67% 6 57% 0 0082% 16 AUTOMATIC DATA PROCESSING ADP 39,785 09 0 20% 2 52% 10 42% 13 07% 0 0266% 17 ALLIANCE DATA SYSTEMS CORP ADS 12,277 65 0 06% 0 00% 14 60% 14 60% 0 0092% 18 AUTODESK INC ADSK 15,412 69 0 08% 0 00% 9 82% 9 82% 0 0077% 19 AMEREN CORPORATION AEE 11,653 75 0 06% 3 63% 6 30% 10 04% 0 0060% 20 AMERICAN ELECTRIC POWER AEP 30,633 50 0 16% 3 64% 4 26% 7 98% 0 0125% 21 AES CORP AES 7,625 67 0 04% 3 81% 6 66% 10 60% 0 0041% 22 AETNA INC AET 38,461 71 0 20% 0 91% 10 54% 11 50% 0 0226% 23 AFLAC INC AFL 29,063 46 0 15% 2 35% 5 00% 7 41% 0 0110% 24 ALLERGAN PLC AGN 90,098 92 0 46% 0 00% 12 37% 12 37% 0 0570% 25 AMERICAN INTERNATIONAL GROUP AIG 64,089 70 0 33% 2 14% 18 48% 20 82% 0 0682% 26 APARTMENT INVT & MGMT CO -A AIV 6,701 49 0 03% 3 08% 7 14% 10 33% 0 0035% 27 ASSURANT INC AIZ 5,477 40 0 03% 2 25% 11 91% 14.29% 0 0040% 28 ARTHUR J GALLAGHER & CO AJG 8,894 04 0 05% 3 03% 9 16% 12 33% 0 0056% 29 AKAMAI TECHNOLOGIES INC AKAM 9,550 44 0 05% 0 00% 15 00% 15 00% 0 0073% 30 ALBEMARLE CORP ALB 9,088 92 0 05% 1 47% 9 05% 10.59% 0 0049% 31 ALASKA AIR GROUP INC ALK 8,900 85 0 05% 1 52% 2 05% 3 59% 0 0016% 32 ALLSTATE CORP ALL 25,753 39 0 13% 1 89% 8.25% 10 22% 0 0135% 33 ALLEGION PLC ALLE 6,491 33 0 03% 0 72% 13 05% 13 81% 0 0046% 34 ALEXION PHARMACEUTICALS INC ALXN 26,537 51 0 14% 0 00% 28 06% 28 06% 0 0381% 35 APPLIED MATERIALS INC AMAT 30,340 69 0 16% 1 44% 14 80% 16 34% 0 0254% 36 AMETEK INC AME 10,654 09 0 05% 0 82% 9 59% 10 44% 0 0057% 37 AFFILIATED MANAGERS GROUP AMG 7,668 15 0 04% 0 00% 13 35% 13 35% 0 0052% 38 AMGEN INC AMGN 121,159 63 0 62% ' 2 46% 7 87% 10 43% 0 0646% 39 AMERIPRISE FINANCIAL INC AMP 15,670 74 N/A 2 99% N/A N/A N/A 40 AMERICAN TOWER CORP AMT 48,229 20 0 25% 1 91% 15 79% 17 86% 0 0440% 41 AMAZON COM INC AMZN 390,143 56 1 99% 0 00% 49 14% 49 14% 0 9802% 42 AUTONATION INC AN 4,932 95 0 03% 0 00% 7 71% 7 71% 0 0019% 43 ANTHEM INC ANTM 31,867 38 0 16% 2 15% 8 66% 10 90% 0 0178% 44 AON PLC AON 29,399 26 0 15% 1 16% 11 31% 12 54% 0 0188% 45 APACHE CORP APA 23,436 96 0 12% 1 62% 6 71% 8 39% 0 0100% 46 ANADARKO PETROLEUM CORP APC 35,082 74 0 18% 0 32% 1 48% 1 80% 0 0032% 47 AIR PRODUCTS & CHEMICALS INC APD 28,725 32 0 15% 2 56% 7 08% 9 73% 0 0143% 48 AMPHENOL CORP-CL A APH 19,622 53 0 10% 0 88% 9 66% 10 59% 0 0106% 49 ACTIVISION BLIZZARD INC ATM 32,394 70 0 17% 0 60% 14 73% 15 37% 0 0255% 50 AVALONBAY COMMUNMES INC AVB 23,196 38 0 12% 3 19% 7 48% 10 79% 0 0128% 51 BROADCOM LTD AVGO 67,581 78 0 35% 1 12% 14 58% 15 78% 0 0545% 52 AVERY DENNISON CORP AVY 6,793 12 0 03% 2 11% 6 75% 8 93% 0 0031% 53 AMERICAN WATER WORKS CO INC AWK 12,760 94 0 07% 2 02% 7 64% 9 74% 0 0064% 54 AMERICAN EXPRESS CO AXP 55,565 42 0 28% 2 02% 8 00% 10 10% 0 0287% 55 ACUITY BRANDS INC AYI 10,884 87 0 06% 0 21% 19 60% 19 83% 0 0110% 56 AUTOZONE INC AZO 22,318 95 0 11% 0 00% 13 09% 13 09% 0 0149% 57 BOEING CO/THE BA 83,280 76 0 43% 3 27% 12 98% 16 45% 0 0701% 58 BANK OF AMERICA CORP BAC 163,276 78 0 83% 1 56% 9 00% 10 63% 0 0888% 59 BAXTER INTERNATIONAL INC BAX 25,807 47 0 13% 1 05% 12 21% 13 33% 0 0176% 60 BED BATH & BEYOND INC BBBY 6,264 34 0 03% 1 05% 6 67% 7 76% 0 0025% 61 BB&T CORP BBT 30,861 41 0 16% 3 04% 5 31% 8 42% 0 0133% 62 BEST BUY CO INC BBY 12,472 06 0 06% 3 41% 11 18% 14 78% 0 0094% 63 CR BARD INC BCR 16,145 32 0 08% 0 44% 10 75% 11 22% 0 0093% 64 BECTON DICKINSON AND CO BDX 36,608 34 0 19% 1 54% 11 45% 13 07% 0 0245% 65 FRANKLIN RESOURCES INC BEN 19,639 98 0 10% 2 11% 1 44% 3 57% 0 0036% 66 BROWN-FORMAN CORP-CLASS B BF/B 18,266 71 0 09% 1 57% 9 22% 10 85% 0 0101% 67 BAKER HUGHES INC BHI 22,143 90 0 11% 1 32% 32 00% 33 53% 0 0380% 68 BIOGEN INC BUB 63,654 58 0 33% 0 00% 8 88% 8 88% 0 0289% 69 BANK OF NEW YORK MELLON CORP BK 42,141 11 0 22% 1 82% 16 11% 18 08% 0 0390%
772

141 [51 [61 [71 [81
PUC Docket No. 46449 EXHIBIT RBH-3
Page 2 of 14
1[81 Market Estimated Long-Term • Weighted
2 Company Ticker Capitalization Weight in Index Dividend Yield Growth Est DCF Result DCF Result 3 4 AGILENT TECHNOLOGIES INC A 14,623 26 0 07% 0 99% 10 43% 11 48% 0 0086% 70 BLACKROCK INC BLK 58,265 83 0 30% 2 58% 11 85% 14 59% 0 0435% 71 BALL CORP BLL 13,809 41 0 07% 0 65% 4 80% 5 47% 0 0039% 72 BRISTOL-MYERS SQUIBB CO . BMY 83,158 63 0 43% 3 07% 19 99% 23 36% 0 0993% 73 BERKSHIRE HATHAWAY INC-CL B BRK/B 355,595 56 1 82% 0 00% 2 00% 2 00% 0 0364% 74 BOSTON SCIENTIFIC CORP BSX 31,229 06 0 16% 0 00% 12 71% 12 71% 0 0203% 75 BORGWARNER INC BWA 7,428 59 0 04% 1 51% 11 59% 13 18% 0 0050% 76 BOSTON PROPERTIES INC BXP 19,503 70 0 10% 2 34% 6 62% 9 03% 0 0090% 1 CMGROUP INC C 141,230 23 0 72% 0 81% 6 42% • 7 25% 0 0524% 2 CA INC CA 13,439 87 0 07% 3 20% 7 60% 10 92% 0 0075% 3 CONAGRA FOODS INC CAG 20,815 95 0 11% 2 19% 7 70% 9 98% 0 0106% 4 CARDINAL HEALTH INC CAH 24,082 83 0 12% 2 25% 11 30% 13 68% 0 0168% 5 CATERPILLAR INC CAT 51,219 55 0 26% 3 51% 7 08% 10 71% 0 0281% 6 CHUBB LTD CB 58,530 25 0 30% 2 17% 9 50% 11 78% 0 0352% 7 CBRE GROUP INC - A CBG 8,900 60 0 05% 0 00% 10 03% 10 03% 0 0046% 8 CBS CORP-CLASS B NON VOTING CBS 24,538 03 0 13% 1 18% 15 77% 17 04% 0 0214% 9 CROWN CASTLE INTL CORP CCI 31,065 97 0 16% 3 89% 9 95% 14 04% 0 0223%
10 CARNIVAL CORP CCL 34,117 14 0 17% 2 89% 15 06% 18 17% 0 0317% 11 CELGENE CORP CELG 76,348 80 "0 39% 0 00% 21 20% 21 20% 0 0827% 12 CERNER CORP CERN 20,583 38 0 11% 0 00% 14 81% 14 81% 0 0156% 13 CF INDUSTRIES HOLDINGS INC CF 5,194 13 0 03% 5 40% 1 20% 6 63% 0 0018% 14 CITIZENS FINANCIAL GROUP CFG 12,877 68 0 07% 1 87% 18 02% 20 06% 0 0132% 15 CHURCH & DWIGHT CO INC CHD 12,344 06 0 06% 1 67% 9 26% 11 01% 0 0069% 16 CHESAPEAKE ENERGY CORP CHK 5,820 40 0 03% 0 00% 1 12% 1 12% 0 0003% 17 C H ROBINSON WORLDWIDE INC CHRW 10,026 63 0 05% 2 48% 10 30% 12 91% 0 0066% 18 CHARTER COMMUNICATIONS INC-A CHTR 80,174 54 0 41% 0 00% 31 05% 31 05% 0 1273% 19 CIGNA CORP CI 31,019 33 0 16% 0 03% 10 99% 11 02% 0 0175% 20 CINCINNATI FINANCIAL CORP C INF 12,499 54 N/A 0 00% N/A N/A N/A 21 COLGATE-PALMOLIVE CO CL 64,463 87 0 33% 2 16% 8 03% 10 27% 0 0339% 22 CLOROX COMPANY CLX 15,778 44 0 08% 2 66% 7 48% 10 23% 0 0083% 23 COMERICA INC CMA 8,416 88 0 04% 1 84% -1 63% 0 19% 0 0001% 24 COMCAST CORP-CLASS A CMCSA 157,251 04 0 80% 1 70% 11 59% 13 38% 0 1076% 25 CME GROUP INC CME 35,728 88 0 18% 4 92% 10 30% 15 47% 0 0283% 26 CHIPOTLE MEXICAN GRILL INC CMG 11,766 85 0 06% 0 00% 13 63% 13 63% 0 0082% 27 CUMMINS INC CMI 21,208 32 0 11% 3 16% 5 19% 8 44% 0 0091% 28 CMS ENERGY CORP CMS 11,389 04 0 06% 3 05% 6 03% 9 16% 0 0053% 29 CENTENE CORP i CNC 10,254 46 0 05% 0 00% 16 05% 16 05% 0 0084% 30 CENTERPOINT ENERGY INC CNP 9,634 35 0 05% 4 61% 5 10% 9 83% 0 0048% 31 CAPITAL ONE FINANCIAL CORP COF 36,630 47 0 19% 2 24% 6 54% 8 85% 0 0166% 32 CABOT OIL & GAS CORP COG 10,489 09 0 05% 0 36% 37 16% 37 58% 0 0202% 33 COACH INC COH 10,052 00 0 05% 3 80% 12 72% 16 76% 0 0086% 34 ROCKWELL COLLINS INC COL 10,845 36 0 06% 1 61% 8 24% 9 91% 0 0055% 35 COOPER COS INUTHE COO 8,656 12 0 04% 0 03% 11 57% 11 60% 0 0051% 36 CONOCOPHILLIPS COP 51,608 51 0 26% 2 40% 6 67% 9 15% 0 0241% 37 COSTCO WHOLESALE CORP COST 65,634 55 ; 0 34% 1 19% 10 59% 11 84% 0 0397% 38 COTY INC-CL A COTY 17,416 31 0 09% 1 32% 2 38% 3 71% 0 0033% 39 CAMPBELL SOUP CO CPB 16,726 85 0 09% 2 56% 4 80% 7 43% 0 0064% 40 SALESFORCE COM INC CRM 50,874 95 0 26% 0 00% 27 81% 27 81% 0 0723% 41 CISCO SYSTEMS INC CSCO 151,333 20 0 77% 3 57% 8 19% 11 90% 0 0921% 42 CSRA INC CSRA 4,285 42 0 02% 0 00% 10 00% 10 00% 0 0022% 43 CSX CORP CSX 29,059 91 0 15% 2 32% 7 80% 10 21% 0 0152% 44 CINTAS CORP CTAS 11,464 22 0 06% 1 04% 11 00% 12 10% 0 0071% 45 CENTURYLINK INC CTL 14,926 81 0 08% 7 90% -2 02% 5 80% 0 0044% 46 COGNIZANT TECH SOLUTIONS-A CTSH 30,553 50 0 16% 0 00% 13 48% 13 48% 0 0211% 47 CITRIX SYSTEMS INC CTXS 13,025 00 0 07% 0 00% 16 95% 16 95% 0 0113%' 48 CVS HEALTH CORP CVS 94,679 89 0 48% 1 85% 13 53% 15 50% 0 0751% 49 CHEVRON CORP CVX 190,689 49 0 98% 4 25% 1 65% 5 93% 0 0578% 50 CONCHO RESOURCES INC CXO 19,245 76 0 10% 0 00% 25 00% 25 00% 0 0246% 51 DOMINION RESOURCES INCNA D 45,543 03 0 23% 3 85% 6 34% 10 31% 0 0240% 52 DELTA AIR LINES INC DAL 29,986 26 0 15% 1 62% 15 39% 17 13% 0 0263% 53 DU PONT (E I ) DE NEMOURS DD 60,354 65 0 31% 2 20% 7 88% 10 17% 0 0314% 54 DEERE & CO DE 27,166 14 0 14% 2 79% 7 74% 10 64% 0 0148% 55 DISCOVER FINANCIAL SERVICES DFS 22,126 84 0 11% 2 12% 8 07% 10 27% 0 0116% 56 DOLLAR GENERAL CORP DG 19,434 72 0 10% 1 45% 13 16% 14 70% 0 0146% 57 QUEST DIAGNOSTICS INC DGX 11,562 04 0 06% 1 92% 7 28% 9 27% 0 0055% 58 DR HORTON INC , DHI 10,751 61 0 05% 1 12% 13 30% 14 49% 0 0080% 59 DANAHER CORP DHR 52,591 41 0 27% 0 81% 10 90% 11 76% 0 0316% 60 WALT DISNEY COTTHE DIS 146,728 34 0 75% 1 55% 9 57% 11 20% 0 0840% 61 DISCOVERY COMMUNICATIONS-A DISCA 15,344 35 0 08% 0 00% 17 65% 17 65% 0 0138% 62 DELPHI AUTOMOTIVE PLC DLPH 17,999 74 0 09% 1 75% 9 67% 11 50% 0 0106% 63 DIGITAL REALTY TRUST INC DLR 14,149 60 0 07% 3 72% 5 45% 9 27% 0 0067% 64 DOLLAR TREE INC DLTR 18,175 93 0 09% 0 00% 17 50% 17 50% 0 0163% 65 DUN & BRADSTREET CORP DNB 4,583 75 0 02% 1 52% 9 83% 11 43% 0 0027% 66 DOVER CORP DOV 10,520 53 0 05% 2 53% 10 58% 13 24% 0 0071% 67 DOW CHEMICAL CO/THE DOW 60,150 20 0 31% 3 45% 3 53% 7 03% 0 0216% 68 DR PEPPER SNAPPLE GROUP INC DPS 16,152 45 0 08% 2 40% 8 42% 10 93% 0 0090% 69 DARDEN RESTAURANTS INC DRI 7,659 32 0 04% 3 61% 10 95% 14 76% 0 0058% 70 DTE ENERGY COMPANY DTE 16,508 06 0 08% 3 29% 5 30% 8 68% 0 0073%
773

[4] 151 [6] 171 181
PUC Docket No. 46449 EXHIBIT RBH-3
Page 3 of 14 [91
Market Estimated Long-Term Weighted 2 Company Ticker Capitalization Weight in Index Dividend Yield Growth Est DCF Result DCF Result 3 4 AGILENT TECHNOLOGIES INC A 14,623 26 0 07% 0 99% 10 43% 11 48% 0 0086% 71 DUKE ENERGY CORP DUK 53,192 56 0 27% 4 38% 4 56% 9 04% 0 0246% 72 DAVITA INC DVA 13,003 67 007% 0 00% 10 49% 10 49% 0 0070% 73 DEVON ENERGY CORP DVN 22,556 69 0 12% 0 97% 9 49% 10 51% 0 0121% 74 ELECTRONIC ARTS INC EA 24,840 17 0 13% 0 00% 15 00% 15 00% 0 0191% 75 EBAY INC EBAY 36,004 41 0 18% 0 00% 9 71% 9 71% 0 0179% 76 ECOLAB INC ECL 34,046 66 0 17% 1 22% 12 87% . 14 17% 0 0247% 77 CONSOLIDATED EDISON INC ED 22,067 04 0 11% 3 70% 3 54% • 7 30% 0 0082% 78 EQUIFAX INC EFX 15,555 36 0 08% 1 01% 12 20% 13 27% 0 0106% 79 EDISON INTERNATIONAL EIX 23,083 72 0 12% 2 74% 5 72% 8 53% 0 0101% 80 ESTEE LAUDER COMPANIES-CL A EL 31,987 05 0 16% 1 49% 10 22% 11 78% 0 0193% 81 EASTMAN CHEMICAL CO EMN 9,413 68 0 05% 2 90% 5 43% 8 41% 0 0041% 82 EMERSON ELECTRIC CO EMR 32,099 65 0 16% 3 81% 5 31% 9 23% 0 0151% 83 ENDO INTERNATIONAL PLC ENDP 4,424 15 0 02% 0 00% 2 57% 2 57% 0 0006% 84 EOG RESOURCES INC EOG 52,024 80 0 27% 0 71% -4 74% -4 05% -0 0108% 85 EQUINIX INC EQIX 25,709 09 0 13% 1 93% 22 86% 25 02% 0 0329% 1 EQUITY RESIDENTIAL EQR 22,445 14 0 11% 21 21% 6 11% 27 96% 0 0321% 2 EQT CORP EQT 11,653 51 0 06% 0 18% 17 50% 17 70% 0 0105% 3 EVERSOURCE ENERGY ES 16,869 07 0 09% 3 36% 6 70% 10 17% 0 0088% 4 EXPRESS SCRIPTS HOLDING CO ESRX 43,964 08 0 22% 0 00% 13 87% 13 87% 0 0312% 5 ESSEX PROPERTY TRUST INC ESS 13,670 08 0 07% 3 06% 6 50% 9 67% 0 0068% 6 E'TRADE FINANCIAL CORP ETFC 7,802 77 0 04% 0 02% 18 89% 18 91% 0 0075% 7 EATON CORP PLC ETN 28,782 51 0 15% 3 59% 8 50% 12 25% 0 0180% 8 ENTERGY CORP ETR 13,273 31 0 07% 4 64% -0 24% 4 39% 0 0030% 9 EDWARDS LIFESCIENCES CORP EW 24,693 94 0 13% 0 00% 17 73% 17 73% 0 0224% 10 DELON CORP EXC 30,139 42 0 15% 3 87% 5 25% 9 22% 0 0142% 11 EXPEDITORS INTL WASH INC EXPD 9,233 65 0 05% 1 53% 9 13% 10 72% 0 0051% 12 EXPEDIA INC EXPE 18,106 12 0 09% 0 74% 20 75% 21 56% 0 0200% 13 EXTRA SPACE STORAGE INC EXR 9,551 18 0 05% " 3 89% 8 98% 13 05% 0 0064% 14 FORD MOTOR CO F 47,321 30 0 24% 5 04% 0 16% 5 20% 0 0126% 15 FASTENAL CO FAST 11,081 49 0 06% 3 13% 15 50% 18 87% 0 0107% 16 FACEBOOK INC-A FB 367,185 46 1 88% 0 00% 33 02% 33 02% 0 6200% 17 FORTUNE BRANDS HOME & SECURI FBHS 8,470 77 0 04% 1 15% 17 49% 18 73% 0 0081% 18 FREEPORT-MCMORAN INC FCX 12,830 97 0 07% 0 00% 14 24% 14 24% 0 0093% 19 FEDEX CORP FDX 45,439 54 0 23% 0 94% 12 72% 13 72% 0 0319% 20 FIRSTENERGY CORP FE 13,398 00 0 07% 4 57% 0 53% 5 11% 0 0035% 21 F5 NETWORKS INC FFIV 7,728 73 0 04% 0 00% 12 91% 12 91% 0 0051% 22 FIDELITY NATIONAL INFO SERV FIS 25,078 65 0 13% 1 37% 12 00% 13 45% 0 0172% 23 FISERV INC FISV 21,994 70 0 11% 0 DO% 12 18% 12 18% 0 0137% 24 FIFTH THIRD BANCORP FITB 15,174 21 0 08% 2 68% 1 87% 4 57% 0 0035% 25 FOOT LOCKER INC FL 9,139 58 0 05% 1 60% 10 01% 11 69% 0 0055% 26 FLIR SYSTEMS INC FLIR 4,019 59 0 02% 1 64% 15 00% 16 76% 0 0034% 27 FLUOR CORP FLR 6,878 87 0 04% 1 69% 8 25% 10 01% 0 0035% 28 FLOWSERVE CORP FLS 5,657 19 0 03% 1 75% 8 56% 10 38% 0 0030% 29 FMC CORP FMC 6,230 16 0 03% 1 42% 9 57% 11 05% 0 0035% 30 TWENTY-FIRST CENTURY FOX-A FOXA 46,083 93 0 24% 1 54% 11 96% 13 59% 0 0320% 31 FEDERAL REALTY INVS TRUST FRT 10,517 52 0 05% 2 62% 5 90% 8 59% 0 0046% 32 FIRST SOLAR INC FSLR 4,040 13 0 02% 0 00% -17 70% -17 70% -0 0037% 33 FMC TECHNOLOGIES INC FTI 7,159 13 0 04% 0 00% -1045% -10 45% -0 0038% 34 FRONTIER COMMUNICATIONS CORP FTR 4,621 90 0 02% 10 66% 3 00% 13 82% 0 0033% 35 FORTIVE CORP FTV 17,092 24 0 09% 0 17% 7 44% 7 62% 0 0067% 36 GENERAL DYNAMICS CORP GD 46,200 90 0 24% 1 98% 7 64% 9 69% 0 0229% 37 GENERAL ELECTRIC CO GE 258,890 02 1 32% 3 21% 10 00% 13 37% 0 1770% 38 GENERAL GROWTH PROPERTIES GGP 23,153 58 0 12% 3 47% 6 66% 10 25% 0 0121% 39 GILEAD SCIENCES INC GILD 96,005 16 0 49% 2 55% 1 58% 4 15% 0 0204% 40 GENERAL MILLS INC GIS 36,535 66 0 19% 3 07% 8 34% 11 54% 0 0215% 41 CORNING INC GLW 24,252 56 0 12% 2 32% 12 65% 15 11% 0 0187% 42 GENERAL MOTORS CO GM 49,778 45 0 25% 4 78% 9 41% 14 41% 0 0367% 43 ALPHABET INC-CL A GOOGL 543,386 30 2 78% 0 00% 17 18% 17 18% 0 4772% 44 GENUINE PARTS CO GPC 14,595 05 0 07% 2 69% 6 78% 9 56% 0 0071% 45 GLOBAL PAYMENTS INC GPN 11,226 06 0 06% 0 06% 14 68% 14 74% 0 0085% 46 GAP INCTTHE GPS 10,539 72 0 05% 3 50% 5 98% ] 9 58% 0 0052% 47 GARMIN LTD GRMN 9,128 43 0 05% 4 24% -0 15% 4 09% 0 0019% 48 GOLDMAN SACHS GROUP INC GS 72,517 04 0 37% 1 58% 6 94% 8 57% 0 0318% 49 GOODYEAR TIRE & RUBBER CO GT 8,201 50 0 04% 0 95% 7 00% 7 98% 0 0033% 50 WW GRAINGER INC GWW 12,943 12 0 07% 2 27% 12 13% 14 53% 0 0096% 51 HALLIBURTON CO HAL 40,445 98 0 21% 1 53% 12 36% 13 99% 0 0289% 52 HARMAN INTERNATIONAL HAR 5,611 41 0 03% 1 84% 16 00% 17 98% 0 0052% 53 HASBRO INC HAS 9,551 07 0 05% 2 68% 10 30% 13 12% 0 0064% 54 HUNTINGTON BANCSHARES INC HBAN 10,654 34 0 05% 2 92% 5 45% 8 45% 0 0046% 55 HANESBRANDS INC HBI 9,210 72 0 05% 1 80% 16 48% 18 42% 0 0087% 56 HCA HOLDINGS INC HCA 30,412 86 0 16% 0 00% 11 58% 11 58% 0 0180% 57 WELLTOWER INC HCN 24,850 05 0 13% 4 96% 5 44% 10 53% 0 0134% 58 HCP INC HCP 16,945 22 0 09% 6 26% 2 01% 8 33% 0 0072% 59 HOME DEPOT INC HD 156,201 23 , z 0 80% 2 19% 13 55% 15 88% 0 1269% 60 HESS CORP HES 16,372 06 0 08% 1 95% -11 07% -9 22% -0 0077% 61 HARTFORD FINANCIAL SVCS GRP H IG 16,716 25 0 09% 2 03% 9 67% 11 80% 0 0101% 62 HARLEY-DAVIDSON INC HOG 8,909 47 0 05% 2 80% 10 33% 13 27% 0 0060%
774

[4] [5] [6] [7] 181
PUC Docket No. 46449 EXHIBIT RBH-3
Page 4 of 14
191 Market Estimated Long-Term Weighted
2 Company Ticker Capitalization Weight in Index Dividend Yield Growth Est DCF Result DCF Result 3 4 AGILENT TECHNOLOGIES INC A 14,623 26 0 07% 0 99% 10 43% 11 48% 0 0086% 63 HOLOGIC INC HOLX 10,666 91 0 05% 0 00% 11 61% 11 61% 0 0063% 64 HONEYWELL INTERNATIONAL INC HON 82,935 34 0 42% 2 22% 9 20% 11 52% 0 0489% 65 HELMERICH & PAYNE HP 7,420 90 0 04% 4 05% 6 73% 10 92% 0 0041% 66 HEWLETT PACKARD ENTERPRIS HPE 35,859 02 0 18% 1 05% 3 09% 4 15% 0 0076% 67 HP INC HPQ 24,773 48 0 13% 3 54% 1 26% 4 82% 0 0061% 68 H&R BLOCK INC HRB 5,054 49 0 03% 3 76% 11 00% 14 97% 0 0039% 69 HORMEL FOODS CORP HRL 20,067 30 0 10% 1 69% 5 17% 6 90% 0 0071% 70 HARRIS CORP HRS 11,081 05 N/A 2 34% N/A N/A N/A 71 HENRY SCHEIN INC HSIC 12,544 27 0 06% 0 00% 11 04% 11 04% 0 0071% 72 HOST HOTELS & RESORTS INC HST 11,463 92 0 06% 5 19% 6 00% 11 35% 0 0067% 73 HERSHEY COfTHE HSY 20,557 86 0 11% 2 46% 8 74% 11 31% 0 0119% 74 HUMANA INC HUM 25,463 68 0 13% 0 68% 13 15% 13 88% 0 0181% 75 INTL BUSINESS MACHINES CORP IBM 147,630 14 0 75% 3 50% 3 69% 7 26% 0 0548% 76 INTERCONTINENTAL EXCHANGE IN ICE 32,325 32 0 17% 1 25% 15 78% 17 13% 0 0283% 77 INTL FLAVORS & FRAGRANCES IFF 10,292 02 0 05% 1 81% 9 30% 11 19% 0 0059% 78 ILLUMINA INC ILMN 20,230 80 0 10% 0 00% 12 79% 12 79% 0 0132% 79 INTEL CORP INTC 177,175 95 0 91% 2 61% 8 70% 11 43% 0 1035% 80 INTUIT INC INTU 27,596 79 0 14% 1 24% 16 51% 17 86% 0 0252% 81 INTERNATIONAL PAPER 'CO IP 19,215 47 0 10% 3 82% 6 38% 10 32% 0 0101% 82 INTERPUBLIC GROUP OF COS INC IPG 9,080 04 0 05% 2 61% 7 25% 9 95% 0 0046% 83 INGERSOLL-RAND PLC IR 16,973 72 0 09% 1 96% 10 77% 12 83% 0 0111% 84 IRON MOUNTAIN INC IRM . 9,053 12 0 05% 5 45% 10 70% 16 44% 0 0076% 85 INTUITIVE SURGICAL INC ISRG 27,519 29 0 14% 0 00% 13 98% 13 98% 0 0197% 1 ILLINOIS TOOL WORKS ITW 41,136 35 0 21% 1 96% 7 37% 9 40% 0 0198% 2 INVESCO LTD IVZ 12,260 59 0 06% 3 74% 10 85% 14 79% 0 0093% 3 HUNT (JB) TRANSPRT SVCS INC JBHT 9,016 67 0 05% 1 10% 14 01% 15 19% 0 0070% 4 JOHNSON CONTROLS INTERNATION JCI 41,062 92 .0 21% 2 60% 12 00% 14 75% 0 0310% 5 JACOBS ENGINEERING GROUP INC JEC 6,077 48 0 03% 0 00% 7 98% 7 98% 0 0025% 6 JOHNSON & JOHNSON JNJ 321,629 68 1 64% 2 67% 6 34% 9 10% 0 1496% 7 JUNIPER NETWORKS INC JNPR 8,712 40 0 04% 1 82% 9 13% 11 03% 0 0049% 8 JPMORGAN CHASE & CO JPM 243,881 05 1 25% 2 78% 4 64% 7 49% 0 0934% 9 NORDSTROM INC JWN 9,301 59 0 05% 2 85% 8 12% 11 08% 0 0053%
10 KELLOGG CO K 26,441 05 0 14% 2 72% 6 83% 9 64% 0 0130% 11 KEYCORP KEY 13,548 91 b 07% 2 64% 5 15% 7 86% 0 0054% 12 KRAFT HEINZ CO/THE KHC 107,798 63 0 55% 2 66% 21 39% 24 34% 0 1341% 13 KIMCO REALTY CORP KIM 11,799 25 0 06% 3 67% 5 45% 9 23% 0 0056% 14 KLA-TENCOR CORP KLAC 11,250 26 0 06% 2 93% 3 60% 6 58% 0 0038% 15 KIMBERLY-CLARK CORP KMB 43,336 15 0 22% 3 05% 7 07% 10 22% 0 0227% 16 KINDER MORGAN INC KMI 45,450 10 0 23% 2 46% 10 60% 13 19% 0 0307% 17 CARMAX INC KMX 9,754 38 0 05% 0 00% '12 89% 12 89% 0 0064% 18 COCA-COLA CO/THE KO 179,848 95 0 92% 3 36% 4 98% 8 43% 0 0775% 19 MICHAEL KORS HOLDINGS LTD KORS 7,884 37 0 04% 0 00% 7 32% 7 32% 0 0030% 20 KROGER CO KR 29,524 30 0 15% 1.48% 8 38% 9 92% 0 0150% 21 KOHLS CORP KSS 7,844 62 0 04% 4 64% 2 63% 7 33% 0 0029% 22 KANSAS CITY SOUTHERN KSU 10,209 84 0 05% 1 41% 11 42% 12 91% 0 0067% 23 LOEWS CORP L 13,868 57 N/A 0 61% N/A N/A N/A 24 L BRANDS INC LB 20,941 71 0 11% 5 61% 9 48% 15 35% 0 0164% 25 LEGGETT & PLATI INC LEG 6,112 80 0 03% 2 86% 10 00% 13 00% 0 0041% 26 LENNAR CORP-A LEN 9,180 29 0 05% 0 39% 11 52% 11 92% 0 0056% 27 LABORATORY CRP OF AMER HLDGS LH 13,891 32 0 07% 0 OD% 11 77% 11 77% 0 0084% 28 LKQ CORP LK0 10,085 41 0 05% 0 00% 15 93% 15 93% 0 0082% 29 L-3 COMMUNICATIONS HOLDINGS LLL 11,473 20 0 06% 1 87% 17 59% 19 62% 0 0115% 30 LINEAR TECHNOLOGY CORP LLTC 14,515 48 0 07% 2.21% 7 39% 9 68% 0 0072% 31 ELI LILLY & CO LLY 87,501 67 0 45% 2 60% 12 93% 15 69% 0 0702% 32 LEGG MASON INC LM 3,310 90 0 02% 2 75% 10 65% 13 55% 0 0023% 33 LOCKHEED MARTIN CORP LMT 70,446 80 0 36% 2 88% 7 11% 10 10% 0 0364% 34 LINCOLN NATIONAL CORP LNC 11,385 31 0 06% 2 10% 8 00% 10 18% 0 0059% 35 ALLIANT ENERGY CORP LNT 8,404 53 0 04% 3 82% 6 77% 10 72% 0 0046% 36 LOWES COS INC LOW 62,406 95 0 32% 1 79% 15 69% 17 61% 0 0562% 37 LAM RESEARCH CORP LRCX 15,839 39 0 08% 1 17% 7 55% 8 77% 0 0071% 38 LEUCADIA NATIONAL CORP LUK 6,836 64 0 03% 1 32% 18 00% 19 44% 0 0068% 39 SOUTHWEST AIRLINES CO LUV 25,628 01 0 13% 0 92% 9 37% 10 33% 0 0135% 40 LEVEL 3 COMMUNICATIONS INC LVLT - 16,592 08 0 08% 0 00% -12 88% -12 88% -0 0109% 41 LYONDELLBASELL INDU-CL A LYB 33,070 68 0 17% 4 21% 4 13% 8 42% 0 0142% 42 MACYS INC M 10,972 20 0 06% 4 26% 6 93% 11 33% 0 0064% 43 MASTERCARD INC - A MA 110,740 37 0 57% 0 75% 16 20% 17 01% 0 0963% 44 MACERICH CO/THE MAC 10,977 30 0 06% 5 65% 6 93% 12 77% 0 0072% 45 MARRIOTT INTERNATIONAL -CL A MAR 26,308 22 0 13% 1 67% 10 82% 12 58% 0 0169% 46 MASCO CORP MAS 11,068 79 0 06% 1 16% 17 81% 19 07% 0 0108% 47 MATTEL INC MAT 10,252 63 0 05% 5 05% 10 40% 15 71% 0 0082% 48 MCDONALD'S CORP MCD 97,360 07 0 50% 3 19% 10 27% 13 62% 0 0678% 49 MICROCHIP TECHNOLOGY INC MCHP 12,702 02 0 06% 2 37% 12 73% 15 25% 0 0099% 50 MCKESSON CORP MCK 36,338 01 0 19% 0 71% 11 22% 11 97% 0 0222% 51 MOODY'S CORP MCO 20,591 48 0 11% 1 34% 11 00% 12 42% 0 0131% 52 MONDELEZ INTERNATIONAL INC-A MDLZ 65,410 25 0 33% 1 62% 11 90% 13 62% 0 0456% 53 MEDTRONIC PLC MDT 114,299 89 0 58% 1 91% 7 76% 9 75% 0 0570% 54 METLIFE INC MET 51,526 13 0 26% 3 37% 8 00% 11 50% 0 0303%
775

141 151 16] [7] [8]
PUC Docket No. 46449 EXHIBIT RBH-3
Page 5 of 14
[91 Market Estimated Long-Term Weighted
2 Company Ticker Capitalization Weight in Index Dividend Yield Growth Est DCF Result DCF Result 3 4 AGILENT TECHNOLOGIES INC A 14,623 26 0 07% 0 99% 10 43% 11 48% 0 0086% 55 MOHAWK INDUSTRIES INC MHK 14,568 18 0 07% 0 00% 9 39% 9 39% 0 0070% 56 MEAD JOHNSON NUTRITION CO MJN 14,949 98 0 08% 2 12% 7 98% 10 18% 0 0078% 57 MCCORMICK & CO-NON VTG SHRS MKC 11,904 10 0 06% 1 83% 8 40% 10 31% 0 0063% 58 MARTIN MARIETTA MATERIALS MLM 10,998 80 0 06% 0 93% 22 45% 23 49% 0 0132% 59 MARSH & MCLENNAN COS MMC 34,198 49 0 17% 2 00% 11 43% 13 55% 0 0237% 60 3M CO MMM 102,947 50 0 53% 2 61% 8 88% 11 60% 0 0611% 61 MALLINCKRODT PLC MNK 7,089 69 0 04% 0 00% 9 00% 9 00% 0 0033% 62 MONSTER BEVERAGE CORP MNST 27,620 55 0 14% 0 00% 20 12% 20 12% 0 0284% 63 ALTRIA GROUP INC MO 121,998 68 0 62% 3 81% 7 83% 11 78% 0 0735% 64 MONSANTO CO MON 44,704 59 0 23% 2 09% 10 78% 12 98% 0 0297% 65 MOSAIC COTTHE MOS 8,107 01 0 04% 4 76% 0 05% 4 81% 0 0020% 66 MARATHON PETROLEUM CORP MPC 22,022 85 0 11% 3 30% 4 22% 7 59% 0.0085% 67 MERCK & CO INC MRK 171,830 04 0 88% 2 97% 7 06% 10 13% 0 0890% 68 MARATHON OIL CORP MR0 12,353 03 0 06% 1 37% 8 00% 9 43% 0 0060% 69 MORGAN STANLEY MS 61,311 71 0 31% 2 18% 7 69% 9 96% 0 0312% 70 MICROSOFT CORP MSFT 446,960 74 2 29% 2 68% 7 50% 10 27% 0 2348% 71 MOTOROLA SOLUTIONS INC MSI 12,267 67 0 06% 2 25% 5 83% 8 15% 0 0051% 72 M & T BANK CORP MTB 17,851 30 0 09% 2 48% 1 40% 3 90% 0 0036% 73 METTLER-TOLEDO INTERNATIONAL MTD 10,770 94 0 06% 0 00% 11 79% 11 79% 0 0065% 74 MICRON TECHNOLOGY INC MU 17,787 63 0 09% 0 00% 9 50% 9 50% 0 0086% 75 MURPHY OIL CORP MUR 4,990 33 N/A 4 52% N/A N/A N/A 76 MYLAN NV MYL 19,518 92 0 10% 0 00% 9 89% 9 89% 0 0099% 77 NAVIENT CORP NAV1 4,409 93 N/A 4 60% N/A N/A N/A 78 NOBLE ENERGY INC NBL 15,115 85 0 08% 1 14% 3 06% 4 22% 0 0033% 79 NASDAQ INC NDAQ 11,125 11 0 06% 1 82% 12 80% 14 73% 0 0084% 80 NEXTERA ENERGY INC NEE 57,298 50 0 29% 2 81% 6 44% 9 34% 0 0274% 81 NEWMONT MINING CORP NEM 18,162 25 0 09% 0 39% 4 65% 5 04% 0 0047% 82 NETFLIX1NC NFLX 43,502 77 0 22% 0 00% 33 74% 33 74% 0 0750% 83 NEWFIELD EXPLORATION CO NFX 8,454 58 0 04% 0 00% 20 48% 20 48% 0 0089% 84 N1SOURCE INC NI 7,307 16 0 04% 2 84% 5 70% 8 62% 0 0032% 85 NIKE INC -CL B NKE 85,969 71 0 44% 1 34% 12 55% 13 97% 0 0614% 1 NIELSEN HOLDINGS PLC NLSN 19,128 72 0 10% 2 26% 12 33% 14 73% 0 0144% 2 NORTHROP GRUMMAN CORP NOC 39,093 57 0 20% 1 58% 7 08% 8 71% 0 0174% 3 NATIONAL OILWELL VARCO INC NOV 13,647 60 0 07% 1 69% -11 29% -9 70% -0 0068% 4 NRG ENERGY INC NRG 3,502 76 0 02% 2 01% 0 90% 2 92% 0 0005% 5 NORFOLK SOUTHERN CORP NSC 27,869 61 0 14% 2 50% 12 35% 15 00% 0 0214% 6 NETAPP INC NTAP 9,343 73 0 05% 2 28% 9 58% 11 97% 0 0057% 7 NORTHERN TRUST CORP NTRS 15,995 05 0 08% 2 10% 12 10% 14 32% 0 0117% 8 NUCOR CORP NUE 14,918 15 0 08% 3 20% 8 33% 11 67% 0 0089% 9 NVIDIA CORP NVDA 35,304 65 0 18% 0 71% 10 87% 11 61% 0 0210% 10 NEWELL BRANDS INC NWL 25,194 95 0 13% 1 45% 13 20% 14 74% 0 0190% 11 NEWS CORP - CLASS A NWSA 7,848 14 0 04% 1 48% 12 15% 13 72% 0 0055% 12 REALTY INCOME CORP 0 16,041 64 0 08% 3 85% 5 14% 9 08% 0 0075% 13 OWENS-ILLINOIS INC 01 2,757 02 0 01% 0 00% 7 37% 7 37% 0 0010% 14 ONEOK INC OKE 10,548 70 0 05% 4 91% 9 83% 14 98% 0 0081% 15 OMNICOM GROUP OMC 19,601 93 0 10% 2 59% 5 68% 8 34% 0 0084% 16 ORACLE CORP ORCL 157,697 81 0 81% 1 55% 8 25% 9 87% 0 0795% 17 O'REILLY AUTOMOTIVE INC ORLY 26,515 21 0 14% 0 00% 15 44% 15 44% 0 0209% 18 OCCIDENTAL PETROLEUM CORP OXY 55,934 68 0 29% 4 13% 8 00% 12 29% 0 0352% 19 PAYCHEX INC PAYX 20,324 81 0 10% 3 27% 9 31% 12 73% 0 0132% 20 PEOPLES UNITED FINANCIAL PBCT 4,826 97 N/A 4 38% N/A N/A N/A 21 PITNEY BOWES INC PB1 3,149 46 0 02% 4 42% 14 00% 18 73% 0 0030% 22 PACCAR INC PCAR 19,917 02 0 10% 2 87% 4 88% 7 81% 0 0080% 23 P G & E CORP PCG 30,139 96 0 15% 3 25% 4 83% 8 16% t 0 0126% 24 PRICELINE GROUP INC/THE PCLN 71,153 56 0 36% 0 00% 17 52% 17 52% 0 0637% 25 PATTERSON COS INC PDCO 4,399 83 0 02% 2 26% 7 69% 10 04% 0 0023% 26 PUBLIC SERVICE ENTERPRISE GP PEG 20,691 99 0 11% 4 01% 2 58% 6 64% 0 0070% 27 PEPSICO INC PEP 153,213 78 0 78% 2 77% 6 69% 9 54% 0 0748% 28 PFIZER INC PFE 198,104 21 1 01% 3 67% 5 53% 9 30% 0 0942% 29 PRINCIPAL FINANCIAL GROUP i PFG 15,049 77 0 08% 3 04% 8 27% 11 43% 0 0088% 30 PROCTER & GAMBLE CO/THE PG 236,053 80 1 21% 3 09% 7 45% 10 66% 0 1286% 31 PROGRESSIVE CORP PGR 19,046 10 0 10% 1 91% 8 36% 10 35% 0 0101% 32 PARKER HANNIFIN CORP PH 16,659 97 0 09% 2 10% 8 57% 10 76% 0 0092% 33 PULTEGROUP INC PHM 6,676 54 0 03% 1 85% 25 01% 27 09% 0 0092% 34 PERKINELMER INC PK1 , 5,700 94 0 03% 0 54% 19 82% 20 41% 0 0059% 35 PROLOGIS INC PLD 26,710 86 0 14% 3 30% 4 89% 8 27% 0 0113% 36 PHILIP MORRIS INTERNATIONAL PM 148,663 67 0 76% 4 32% 8 37% 12 86% 0 0978% 37 PNC FINANCIAL SERVICES GROUP PNC 43,258 75 0 22% 2 41% 4 34% 6 80% 0 0150% 38 PENTAIR PLC PNR 10,637 42 0 05% 2 27% 6 55% 8 90% 0 0048% 39 PINNACLE WEST CAPITAL PNW 8,189 13 0 04% 3 43% 4 93% 8 44% 0 0035% 40 PPG INDUSTRIES INC PPG 24,657 74 0 13% 1 68% 8 77% 10 53% 0 0133% 41 PPL CORP PPL ' 22,322 86 0 11% 4 62% 5 12% 9 86% 0 0113% 42 PERRIGO CO PLC PRGO 12,378 03 0 06% 0 67% 7 57% 8 26% 0 0052% 43 PRUDENTIAL FINANCIAL INC PRU 36,895 91 0 19% 3 37% 8 33% 11 84% 0 0223% 44 PUBLIC STORAGE PSA 37,142 58 0 19% 3 32% 4 95% 8 35% 0 0159% 45 PHILLIPS 66 PSX 41,467 18 0 21% 3 07% 6 22% 9 38% 0 0199% 46 PVH CORP PVH 8,852 47 0 05% 0 14% 7 08% 7 23% 0 0033%
776

[41 [51 f6] 171 f8]
PUC Docket No. 46449 EXHIBIT RBI-I-3
Page 6 of 14 [9]
Market Estimated Long-Terrn Weighted 2 Company Ticker Capitalization Weight in Index Dividend Yield Growth Est DCF Result DCF Result 3 4 AGILENT TECHNOLOGIES INC A 14,623 26 0 07% 0 99% 10 43% 11 48% 0 0086%
47 QUANTA SERVICES INC PWR 4,220 88 0 02% 0 00% 8 00% 8 00% 0 0017% 48 PRAXAIR INC - PX 33,423 44 0 17% 2 56% 9 07% 11 74% 0 0201% 49 PIONEER NATURAL RESOURCES CO PXD 31,540 28 0 16% 0 04% 20 00% 20 04% 0 0323% 50 PAYPAL HOLDINGS INC PYPL 47,359 46 0 24% 0 00% 15 10% 15 10% 0 0366% 51 QUALCOMM INC QCOM 96,818 70 0 50% 3 06% 8 29% 11 47% 0 0568% 52 QORVO INC QRVO 6,778 51 0 03% 0 00% 15 83% 15 83% 0 0055% 53 RYDER SYSTEM INC R 3,358 98 0 02% 1 89% 15 50% 17 54% 0 0030% 54 REYNOLDS AMERICAN INC RAI 67,470 42 0 34% 3 73% 9 19% 13 08% 0 0451% 55 ROYAL CARIBBEAN CRUISES LTD RCL 15,064 24 0 08% 2 23% 18 58% 21 01% 0 0162% 56 REGENERON PHARMACEUTICALS REGN 39,135 86 0 20% 0 00% 24 34% 24 34% 0 0487% 57 REGIONS FINANCIAL CORP RF 12,614 74 0 06% 2 59% 6 04% 8 70% 0 0056% 58 ROBERT HALF INTL INC RHI 4,976 56 0 03% 2 31% 9 44% 11 86% 0 0030% 59 RED HAT INC RHT 13,864 82 0 07% 0 00% 18 73% 18 73% 0 0133% 60 TRANSOCEAN LTD RIG 3,544 30 N/A 0 34% N/A N/A N/A 61 RALPH LAUREN CORP RL 8,021 85 0 04% 2 11% 9 14% 11 35% 0 0047% 62 ROCKWELL AUTOMATION INC ROK 15,113 93 0 08% 2 49% 5 86% 8 42% 0 0065% 63 ROPER TECHNOLOGIES INC ROP 17,525 81 0 09% 0 67% 11 37% 12 07% 0 0108% 64 ROSS STORES INC ROST 25,642 85 0 13% 0 84% 12 50% 13 39% 0 0176% 65 RANGE RESOURCES CORP RRC 9,386 34 0 05% 0 21% -16 25% -16 05% -0 0077% 66 REPUBLIC SERVICES INC RSG 17,080 55 0 09% 2 49% 8 22% 10 81% 0 0094% 67 RAYTHEON COMPANY RTN 40,528 35 0 21% 2 10% 7 54% 9 72% 0 0201% 68 STARBUCKS CORP SBUX 77,847 13 0 40% 1 54% 19 00% 20 68% 0 0823% 69 SCANA CORP SCG 9,927 01 0 05% 3 31% 6 07% 9 48% 0 0048% 70 SCHWAB (CHARLES) CORP SCHW 42,296 44 0 22% 0 84% 17 76% 18 68% 0 0404% 71 SPECTRA ENERGY CORP SE 29,831 83 0 15% 3 82% 10 47% 14 48% 0 0221% 72 SEALED AIR CORP SEE 8,776 89 0 04% 1 37% 4 31% 5 71% 0 0026% 73 SHERWIN-WILLIAMS CO/THE SHW 24,752 31 0 13% 1 25% 15 43% 16 78% 0 0212% 74 SIGNET JEWELERS LTD SIG 6,127 01 0 03% 1 31% 11 20% 12 58% 0 0039% 75 JM SMUCKER CO/THE SJM 15,544 13 0 08% 2 19% 8 10% 10 37% 0 0082% 76 SCHLUMBERGER LTD SLB 113,091 20 0 58% 2 46% 7 32% 9 87% 0 0571% 77 SL GREEN REALTY CORP SLG 10,960 95 0 06% 2 82% 5 09% 7 98% 0 0045% 78 SNAP-ON INC SNA 8,557 89 0 04% 1 74% 4 90% 6 68% 0 0029% 79 SCRIPPS NE1WORKS INTER-CL A SNI 7,908 02 0 04% 1 64% 8 65% 10 35% 0 0042% 80 SOUTHERN CO/THE SO 49,483 37 0 25% 4 39% 3 92% 8 40% 0 0213% 81 SIMON PROPERTY GROUP INC SPG 61,900 49 0 32% 3 32% 8 53% 12 00% 0 0380% 82 S&P GLOBAL INC SPGI 32,511 60 0 17% 1 17% 10 00% 11 23% 0 0187% 83 STAPLES INC SPLS 4,917 20 0 03% 6 35% 0 00% 6 35% 0 0016% 84 STERICYCLE INC SRCL 6,418 12 0 03% 0 00% 11 15% 11 15% 0 0037% 85 SEMPRA ENERGY SRE 25,981 85 0 13% 2 90% 7 38%' 10 39% 0 0138% 1 SUNTRUST BANKS INC STI 22,323 12 0 11% 2 22% 5 00% 7 28% 0 0083% 2 ST JUDE MEDICAL INC STJ 22,270 12 0 11% 1 59% 10 57% 12 25% 0 0139% 3 STATE STREET CORP STT 26,914 95 0 14% 2 07% 13 00% 15 21% 0 0209% 4 SEAGATE TECHNOLOGY STX 10,546 77 0 05% 7 08% 7 59% 14 94% 0 0081% 5 CONSTELLATION BRANDS INC-A STZ 34,083 84 0 17% 0 93% 15 18% 16 18% 0 0282% 6 STANLEY BLACK & DECKER INC SWK 18,236 14 0 09% 1 86% 11 00% 12 96% 0 0121% 7 SKYWORKS SOLUTIONS INC SWKS 14,555 32 0 07% 1 31% 17 54% 18 96% 0 0141% 8 SOUTHWESTERN ENERGY CO SWN 6,365 58 N/A 0 00% N/A N/A N/A 9 SYNCHRONY FINANCIAL SYF 22,265 81 0 11% 0 97% 8 12% 914% 0 0104%
10 STRYKER CORP SYK 42,539 43 0 22% 1 35% 9 29% 10 70% 0 0233% 11 SYMANTEC CORP SYMC 14,994 04 0 08% 1 29% 7 98% 9 32% 0 0071% 12 SYSCO CORP SYY 26,634 83 0 14% 2 62% 10 01% 12 76% 0 0174% 13 AT&T INC T 241,281 44 1 23% 4 91% 5 00% 10 03% 0 1238% 14 MOLSON COORS BREWING CO -B TAP 23,879 05 0 12% 1 51% 16 70% 18 33% 0 0224% 15 TERADATA CORP TDC 3,849 41 0 02% 0 00% 9 71% 9 71% 0 0019% 16 TRANSDIGM GROUP INC TDG 14,782 22 0 08% 0 00% 14 35% 14 35% 0 0108% 17 TE CONNECTIVITY LTD TEL 21,727 66 0 11% 2 23% 11 85% 14 21% 0 0158% 18 TEGNA INC TGNA 4,273 61 0 02% 2 81% 4 67% 7 54% 0 0016% 19 TARGET CORP TGT 39,154 04 0 20% 3 40% 8 28% 11 82% 0 0237% 20 TIFFANY & CO TIF 9,073 38 0 05% 2 33% 9 34% 11 78% 0 0055% . 21 TJX COMPANIES INC TJX 48,742 75 0 25% 1 39% 11 74% 13 21% 0 0329% 22 TORCHMARK CORP TMK 7,634 04 0 04% 0 89% 7 82% 8 74% 0 0034% 23 THERMO FISHER SCIENTIFIC INC TMO 59,813 62 0 31% 0 40% 12 13% 12 55% 0 0384% 24 TRIPADVISOR INC TRIP 8,930 27 0 05% 0 00% 11 37% 11 37% 0 0052% 25 .T ROWE PRICE GROUP INC TROW 16,379 59 0 08% 3 29% 9 60% 13 04% 0 0109% 26 TRAVELERS COS INC/THE TRV 33,175 41 0 17% 2 29% 8 33% 10 72% 0 0182% 27 TRACTOR SUPPLY COMPANY TSCO 8,990 29 0 05% 1 32% 14 91% 16 33% 0 0075% 28 TYSON FOODS INC-CL A TSN 28,585 97 0 15% 0 86% 12 43% 13 34% 0 0195% 29 TESORO CORP TSO 9,700 33 0 05% 2 57% 3 28% 5 89% 0 0029% 30 TOTAL SYSTEM SERVICES INC TSS 8,677 06 0 04% 0 80% 11 00% 11 84% 0 0053% 31 TIME WARNER INC 1WX 61,877 35 0 32% 2 02% 12 47% 14 61% 0 0462% 32 TEXAS INSTRUMENTS INC TXN 68,709 84 0 35% 2 25% • 10 00% 12 36% 0 0434% 33 TEXTRON INC TXT 10,177 64 0 05% 0 21% 7 31% 7 53% 0 0039% 34 UNDER ARMOUR INC-CLASS A UA 15,678 78 0 08% 0 00% 24 48% 24 48% 0 0196% 35 UNITED CONTINENTAL HOLDINGS UAL 17,152 12 0 09% 0 00% -11 85% -11 85% -0 0104% 36 UDR INC UDR 9,021 21 0 05% 3 49% 6 62% 10 23% 0 0047% 37 UNIVERSAL HEALTH SERVICES-B UHS 12,012 62 0 06% 0 32% 9 24% 9 58% 0 0059% 38 ULTA SALON COSMETICS & FRAGR ULTA 16,387 65 0 08% 0 00% 22 00% 22 00% 0 0184%
777

[4] f51 [6] [71 181
PUC Docket No. 46449 EXH[BIT RBH-3
Page 7 of 14
[91 Market Estimated Long-Tenn Weighted
2 Company Ticker Capitalization Weight in Index Dividend Yield Growth Est DCF Result DCF Result 3 4 AGILENT TECHNOLOGIES INC A 14,623 26 0 07% 0 99% 10 43% 11 48% 0 0086% 39 UNITEDHEALTH GROUP INC UNH 127,544 26 0 65% 1 78% 13 18% 15 07% 0 0983% 40 UNUM GROUP UNM 8,533 96 0 04% 2 13% 7 00% 9 21% 0 0040% 41 UNION PACIFIC CORP UNP 80,659 37 0 41% 2 32% 9 31% 11 73% 0 0484% 42 UNITED PARCEL SERVICE-CL B UPS 95,199 88 0 49% 2 88% 11 40% 14 45% 0 0703% 43 URBAN OUTFITTERS INC URBN 4,166 23 0 02% 0 00% 12 83% 12 83% 0 0027% 44 UNITED RENTALS INC URI 6,485 34 0 03% 0 00% 12 31% 12 31% 0 0041% 45 US BANCORP USB 73,339 22 0 37% 2 48% 5 45% 8 00% 0 0300% 46 UNITED TECHNOLOGIES CORP UTX 83,826 60 0 43% 2 58% 9 50% 12 20% 0 0523% 47 VISA INC-CLASS A SHARES V 194,648 79 1 00% 0 69% 16 30% 17 04% 0 1696% 48 VARIAN MEDICAL SYSTEMS INC VAR 8,942 13 0 05% 0 00% 11 37% 11 37% 0 0052% 49 VF CORP VFC 22,644 68 0 12% 2 74% 9 93% 12 81% 0 0148% 50 V[ACOM INC-CLASS B V[AB 14,494 15 0 07% 4 18% 4 15% 8 42% 0 0062% 51 VALERO ENERGY CORP VLO 24,815 53 0 13% 4 49% 4 12% 8 70% 0 0110% 52 VULCAN MATERIALS CO VMC 14,607 27 0 07% 0 70% 25 16% 25 95% 0 0194% 53 VORNADO REALTY TRUST VNO 17,985 63 0 09% 2 66% 5 00% 7 72% 0 0071% 54 VERISK ANALYTICS INC VRSK 13,411 17 0 07% 0 00% 12 33% 12 33% 0 0085% 55 VERISIGN INC VRSN 8,083 29 0 04% 0 00% 10 20% 10 20% 0 0042% 56 VERTEX PHARMACEUTICALS INC VRTX 19,631 51 0 10% 0 00% 69 07% 69 07% 0 0693% 57 VENTAS INC VTR 23,438 56 0 12% 4 41% 5 93% 10 46% 0 0125% 58 VERIZON COMMUNICATIONS INC VZ 204,956 46 1 05% 4 53% 4 63% 9 27% 0 0971% 59 WATERS CORP WAT 12,480 91 0 06% 0 00% , 9 26% 9 26% 0 0059% 60 WALGREENS BOOTS ALLIANCE INC WBA 84,756 28 0 43% 1 83% 11 72% 13 66% 0 0592% 61 WESTERN DIGITAL CORP WDC 15,589 07 0 08% 3 68% 4 14% 7 90% 0 0063% 62 WEC ENERGY GROUP INC WEC 18,223 90 0 09% 3 43% 5 47% 8 99% 0 0084% 63 WELLS FARGO & CO WFC 225,586 41 1 15% 3 40% 9 45% 13 01% 0 1501% 64 WHOLE FOODS MARKET INC WFM 9,156 06 0 05% 1 88% 7 38% 9 33% 0 0044% 65 WHIRLPOOL CORP WHR 12,127 67 0 06% 2 43% 16 45% 19 08% 0 0118% 66 WILLIS TOWERS WATSON PLC WLTW 17,721 57 0 09% 1 50% 15 47% 17 08% 0 0155% 67 WASTE MANAGEMENT INC WM 27,368 84 0 14% 2 65% 8 24% 10 99% 0 0154% 68 WILLIAMS COS INC WMB 21,866 66 0 11% 5 77% 10 00% 16 06% 0 0180% 69 WAL-MART STORES INC WMT 211,733 48 1 08% 2 92% 2 91% 5 87% 0 0636% 70 WESTROCK CO WRK 11,747 32 0 06% 3 16% -0 18% 2 98% 0 0018% 71 WESTERN UNION CO WU 9,813 20 0 05% 3 18% 6 53% 9 81% 0 0049% 72 WEYERHAEUSER CO WY 23,495 20 0 12% 3 98% 12 93% 17 17% 0 0206% 73 WYNDHAM WORLDWIDE CORP WYN 7,446 23 0 04% 2 96% 7 60% 10 67% 0 0041% 74 WYNN RESORTS LTD WYNN 9,504 22 0 05% 2 42% 23 03% 25 73% 0 0125% 75 CIMAREX ENERGY CO XEC 13,068.29 0 07% 0 32% 55 91% 56 32% 0 0376% 76 XCEL ENERGY INC XEL 20,343 51 0 10% 3 40% 495% 8 43% 0 0088% 77 XL GROUP LTD XL 9,461 80 0 05% 2 08% 12 50% 14 71% 0 0071% 78 XILINX INC XLNX 12,671 57 0 06% 2 81% 7 98% 10 90% 0 0071% 79 EXXON MOBIL CORP XOM 358,851 10 1 83% 3 45% 11 63% 15 28% 0 2804% 80 DENTSPLY SIRONA INC XRAY 13,677 82 0 07% 0 50% 9 76% 10 29% 0 0072% 81 XEROX CORP XRX 9,778 38 0 05% 3 19% 11 60% 14 98% 0 0075% 82 XYLEM INC XYL 8,864 11 0 05% 1 25% 11 10% 12 42% 0 0056% 83 YAHOO! INC YHOO 39,441 87 0 20% 0 00% 4 39% 4 39% 0 0089% 84 YUMI BRANDS INC YUM 32,729 55 0 17% 2 13% 11 87% 14 13% 0 0236% 85 ZIMMER BIOMET HOLDINGS INC ZBH 25,431 59 0 13% 0 73% 11 06% 11 83% 0 0154% 1 ZIONS BANCORPORATION ZION 6,329 72 0 03% 0 91% 12 67% 13 64% 0 0044% 2 ZOETIS INC ZTS 24,841 29 0 13% 0 76% 14 73% 15 54% 0 0197% 3 Total Market Capitalization 19,557,848 15 13 13% 4 Notes 5 [1] Equals sum of Col [9] 6 [2] Source Bloomberg Professional 7 [3] Equals [1] - [2] 8 [4] Source Bloomberg Professional 9 [5] Equals weigtit in S&P 500 based on market capitalization 10 [6] Source Bloomberg Professional 11 [7] Source Bloomberg Professional 12 [8] Equals ([6] x (1 + (0 5 x [7]))) + [7] 13 [9] Equals Col [5] x Col [8]
778

PUC Docket No. 46449 EXHIBIT RBH-3
Page 8 of 14
Ex-Ante Market Risk Premium Market DCF Method Based - Value Line
Line No [1] [2] 13]
S&P 500
Current 30-Year Est Required
Treasury (30- Implied Market Market Retum
day average)
Risk Premium 14 14% 2 38% 11 76%
17) [8] [9) [4] L51 [6] Market Estimated Long-Terrn Weighted
2 Company Ticker Capitalization Weight in Index Dividend Yield Growth Est DCF Result DCF Result 3 4 AGILENT TECHNOLOGIES INC A 14,631 84 0 08% 1 02% 4 50% 5 54% 0 0046% 5 ALCOA INC AA 11,727 58 0 07% 1 35% 10 50% 11 92% 0 0079% 6 AMERICAN AIRLINES GROUP INC AAL 21,077 41 N/A 1 02% N/A N/A N/A 7 ADVANCE AUTO PARTS INC AAP 10,804 92 0 06% 0 16% 11 50% 11 67% 0 0071% 8 APPLE INC AAPL 630,892 40 3 58% 2 04% 11 50% 13 66% 0 4883% 9 ABBVIE INC ABBV 99,585 34 0 56% 3 73% 13 00% 16 97% 0 0958%
10 AMERISOURCEBERGEN CORP ABC 17253 33 0 10% 1 69% 11 00% 12 78% 0 0125% 11 ABBOTT LABORATORIES ABT 60,240 40 0 34% 2 54% 7 50% 10 14% 0 0346% 12 ACCENTURE PLC-CL A ACN 76,149 30 0 43% 2 05% 6 50% 8 62% 0 0372% 13 ADOBE SYSTEMS INC ADBE 53,683 67 0 30% 0 00% 35 50% 35 50% 0 1080% 14 ANALOG DEVICES INC ADI 18,666 75 0 11% 2 77% 11 00% 13 92% 0 0147% 15 ARCHER-DANIELS-MIDLAND CO ADM 24,631 75 0 14% 2 84% 5 00% 7 91% 0 0110% 16 AUTOMATIC DATA PROCESSING ADP 39,630 53 0 22% 2 61% 9 50% 12 23% 0 0275% 17 ALLIANCE DATA SYSTEMS CORP ADS 12,120 82 0 07% 0 00% 10 50% 10 50% 0 0072% 18 AUTODESK INC ADSK 15,374 96 N/A 0 00% N/A N/A N/A 19 AMEREN CORPORATION AEE 11,654 50 0 07% 3 66% 6 00% 9 77% 0 0065% 20 AMERICAN ELECTRIC POWER AEP 30,743 69 0 17% 3 77% 4 00% 7 85% 0 0137% 21 AES CORP AES 7,730 08 0 04% 3 75% 8 50% 12 41% 0 0054% 22 AETNA INC AET 38,510 82 0 22% 0 91% 9 50% 10 45% 0 0228% 23 AFLAC INC AFL 28,958 22 0 16% 2 44% 4 50% 6 99% 0 0115% 24 ALLERGAN PLC AGN 91,968 08 0 52% 0 00% 13 50% 13 50% 0 0704% 25 AMERICAN INTERNATIONAL GROUP AIG 64,517 43 0 37% 2 15% 10 00% 12 26% 0 0448% 26 APARTMENT INVT & MGMT CO -A AIV - N/A 3 06% N/A N/A N/A 27 ASSURANT INC AIZ 5,460 54 0 03% 2 22% 7 00% 9 30% 0 0029% 28 ARTHUR J GALLAGHER & CO AJG 8,862 39 0 05% 3 04% 13 50% 16 75% 0 0084% 29 AKAMAI TECHNOLOGIES INC AKAM 9,534 74 0 05% 0 00% 13 00% 13 00% 0 0070% 30 ALBEMARLE CORP ALB 9,040 73 0 05% 1 52% 9 50% 11 09% 0 0057% 31 ALASKA AIR GROUP INC ALK 8,979 92 0 05% 1 51% 10 50% 12 09% 0 0062% 32 ALLSTATE CORP ALL 25,632 39 0 15% 1 91% 6 50% 8 47% 0 0123% 33 ALLEGION PLC ALLE 6,381 05 0 04% 0 72% 10 50% 11 26% 0 0041% 34 ALEXION PHARMACEUTICALS INC ALXN 26,819 43 0 15% 0 00% 27 50% 27 50% 0 0418% 35 APPLIED MATERIALS INC AMAT 30,116 66 0 17% 1 44% 18 00% 19 57% 0 0334% 36 AMETEK INC AME 10,621 55 0 06% 0 79% 6 00% 6 81% 0 0041% 37 AFFILIATED MANAGERS GROUP AMG 7,958 75 0 05% 0 00% 8 50% 8 50% 0 0038% 38 AMGEN INC AMGN 123,036 80 0 70% 2 62% 9 00% 11 74% 0 0818% 39 AMERIPRISE FINANCIAL INC AMP 16,013 29 0 09% 3 04% 10 50% 13 70% 0 0124% 40 AMERICAN TOWER CORP AMT 47,926 91 0 27% 2 13% 15 50% 17 80% 0 0483% 41 AMAZON COM INC AMZN 393,078 70 2 23% 0 00% 91 00% 91 00% 2 0272% 42 AUTONATION INC AN 4,916 53 0 03% 0 00% 9 00% 9 00% 0 0025% 43 ANTHEM INC ANTM 31,841 63 0 18% 2 15% 7 50% ' 9 73% 0 0176% 44 AON PLC AON 29,288 50 0 17% 1 20% 12 00% 13 27% 0 0220% 45 APACHE CORP APA 23,546 75 0 13% 1 61% 5 00% 6 65% 0 0089% 46 ANADARKO PETROLEUM CORP APC 32,707 74 N/A 0 31% N/A N/A N/A 47 AIR PRODUCTS & CHEMICALS INC APD 28,640 90 0 16% 2 66% 11 00% 13 81% 0 0224% 48 AMPHENOL CORP-CL A APH 19,542 29 0 11% 0 89% 8 00% 8 93% 0 0099% 49 ACTWISION BLIZZARD INC ATVI 31$93 35 0 18% 0 65% 8 00% 8 68% 0 0157% 50 AVALONBAY COMMUNMES INC AVB N/A 3 41% N/A N/A N/A 51 BROADCOM LTD AVGO 66,974 74 0 38% 1 21% 23 00% 24 35% 0 0924% 52 AVERY DENNISON CORP AVY 6,733 55 0 04% 2 25% 8 50% 10 85% 0 0041% 53 AMERICAN WATER WORKS CO INC AWK 12,766 03 0 07% 2 19% 8 00% 10 28% 0 0074% 54 AMERICAN EXPRESS CO AXP 55,879 25 0 32% 2 12% 3 00% 5 15% 0 0163% 55 ACUITY BRANDS INC AYI 10,739 59 0 06% 0 21% 19 50% 19 73% 0 0120% 56 AUTOZONE INC AZO 22,652 64 0 13% 0 00% 11 50% 11 50% 0 0148% 57 BOEING COTTHE BA 83,476 95 0 47% 3 52% 10 50% 14 20% 0 0672% 58 BANK OF AMERICA CORP BAC 161,731 60 0 92% 1 96% 15 50% 17 61% 0 1614% 59 BAXTER INTERNATIONAL INC BAX 25,881 52 0 15% 1 09% -4 50% -3 43% -0 0050% 60 BED BATH & BEYOND INC BBBY 6,434 89 0 04% 1 20% 3 00% 4 22% . 0 0015% 61 BB&T CORP BBT 30,845 12 0 17% 3 17% 7 50% 10 79% 0 0189% 62 BEST BUY CO INC BBY 12,626 11 0 07% 2 81% 8 00% 10 92% 0 0078% 63 CR BARD INC BCR 16,061 67 0 09% 0 48% 9 50% 10 00% 0 0091% 64 BECTON DICKINSON AND CO BDX 36,806 39 0 21% 1 68% 9 50% 11 26% 0 0235% 65 FRANKLIN RESOURCES INC BEN 19,841 23 0 11% 2 36% 4 50% 6 91% 0 0078% 66 BROWN-FORMAN CORP-CLASS B BF/B 17,966 48 0 10% 1 53% 9 00% 10 60% 0 0108% 67 BAKER HUGHES INC BHI 22,464 80 0 13% 1 30% 29 00% 30 49% 0 0388% 68 BIOGEN INC BUB 64,511 41 0 37% 0 00% 11 50% 11 50% 0 0420% 69 BANK OF NEW YORK MELLON CORP BK 41,735 37 0 24% 1 94% 10 50% 12 54% 0 0297% 70 BLACKROCK INC BLK 56,899 11 0 32% 2 62% 8 00% 10 72% 0 0346% 71 BALL CORP BLL 11,061 06 0 06% 0 66% 11 00% 11 70% 0 0073% 72 BRISTOL-MYERS SQUIBB CO BMY 83,549 12 0 47% 3 03% 19 50% 22 83% 0 1081%
779

[4] [5] [6] [7] [8]
PUC Docket No. 46449 EXHIBIT RBH-3
Page 9 of 14
I91 Market Estimated Long-Term Weighted
2 Company Ticker Capitaltzation Weight in Index Dividend Yield Growth Est DCF Result DCF Result 3
73 BERKSHIRE HATHAWAY INC-CL B BRK/B N/A 0 00% N/A N/A N/A 74 BOSTON SCIENTIFIC CORP BSX 31,453 88 0 18% 0 00% 19 50% 19 50% 0 0348% 75 BORGWARNER INC BWA 7,400 75 0 04% 1 51% 8 50% 10 07% 0 0042% 76 BOSTON PROPERTIES INC BXP N/A 2 14% N/A N/A N/A 1 CITIGROUP INC C 140,823 50 0 80% 1 32% 11 50% 12 90% 0 1029% 2 CA INC CA 13,301 73 0 08% 3 18% 6 50% 9 78% 0 0074% 3 CONAGRA FOODS INC CAG 20,540 17 0 12% 2 13% 6 00% 8 19% 0 0095% 4 CARDINAL HEALTH INC CAH 24,560 84 0 14% 2 47% 14 00% 16 64% 0 0232% 5 CATERPILLAR INC CAT 50,810 57 0 29% 3 54% 4 00% 7 61% 0 0219% 6 CHUBB LTD CB 58,228 80 0 33% 2 20% 8 00% 10 29% 0 0339% 7 CBRE GROUP INC - A CBG 8,926 29 0 05% 0 00% 10 00% 10 00% 0 0051% 8 CBS CORP-CLASS B NON VOTING CBS 24,637 04 0 14% 1 30% 13 00% 14 38% 0 0201% 9 CROWN CASTLE INTL CORP CCI 30,994 95 0 18% 4 12% 18 00% 22 49% 0 0395% 10 CARNIVAL CORP CCL 34,156 70 0 19% 2 99% 15 50% 18 72% 0 0362% 11 CELGENE CORP CELG 77,988 26 0 44% 0 00% 27 50% 27 50% 0 1215% 12 CERNER CORP , CERN 20,676 72 0 12% 0 00% 13 50% 13 50% 0 0158% 13 CF INDUSTRIES HOLDINGS INC CF 5,371 39 0 03% 5 86% -1 50% 4 32% 0 0013% 14 CMZENS FINANCIAL GROUP CFG 12,973 41 N/A 2 04% N/A N/A N/A 15 CHURCH & DWIGHT CO INC CHD 12,294 08 0 07% 1 49% 7 00% 8 54% 0 0060% 16 CHESAPEAKE ENERGY CORP CHK 4,985 79 N/A 0 00% N/A N/A N/A 17 C H ROBINSON WORLDWIDE INC , CHRW 10,042 59 0 06% 2 45% 7 50% 10 04% 0 0057% 18 CHARTER COMMUNICATIONS INC-A CHTR 69,465 95 N/A 0 00% N/A N/A N/A 19 CIGNA CORP CI 31,086 02 0 18% 0 03% 12 50% 12 53% 0 0221% 20 CINCINNATI FINANCIAL CORP CINF 12,400 01 0 07% 2 55% 6 50% 9 13% 0 0064% 21 COLGATE-PALMOLIVE CO CL 64,330 14 0 36% 2 25% 14 00% 16 41% 0 0598% 22 CLOROX COMPANY CLX 15,848 58 0 09% 2 64% 9 50% 12 27% 0 0110% 23 COMERICA INC CMA 8,332 36 0 05% 1 92% 6 50% 8 48% 0 0040% 24 COMCAST CORP-CLASS A CMCSA 157,058 10 0 89% 1 69% 10 00% 11 77% 0 1048% 25 CME GROUP INC CME 39,224 71 0 22% 2 31% 9 50% 11 92% 0 0265% 26 CHIPOTLE MEXICAN GRILL INC CMG 11,945 96 0 07% 0 00% 12 50% 12 50% 0 0085% 27 CUMMINS INC CMI 21,278 13 0 12% 3 25% 5 00% 8 33% 0 0100% 28 CMS ENERGY CORP CMS 11,409 41 0 06% 3 18% 6 00% 9 28% 0 0060% 29 CENTENE CORP CNC 10,276 72 0 06% 0 00% 24 50% 24 50% 0 0143% 30 CENTERPOINT ENERGY INC CNP 9,621 41 0 05% 4 75% 2 00% 6 80% 0 0037% 31 CAPITAL ONE FINANCIAL CORP COF 35,956 09 0 20% 2 25% 2 50% 4 78% 0 0097% 32 CABOT OIL & GAS CORP COG 10,582 12 0 06% 0 35% 39 00% 39 42% 0 0236% 33 COACH INC COH 10,084 99 0 06% 3 72% 4 00% 7 79% 0 0045% 34 ROCKWELL COLLINS INC COL 10,754 42 0 06% 1 59% 8 00% ' 9 65% 0 0059% 35 COOPER COS INC/THE COO 8,704 83 0 05% 0 03% 14 50% 14 53% 0 0072% 36 CONOCOPHILLIPS COP 52,202 99 0 30% 2 37% 6 00% 8 44% 0 0250% 37 COSTCO WHOLESALE CORP COST 65,851 64 0 37% 1 20% 9 00% 10 25% 0 0383% 38 COTY INC-CL A COTY 7,955 02 0 05% 1 19% 14 50% 15 78% 0 0071% 39 CAMPBELL SOUP CO CPB 16,896 88 0 10% 2 55% 5.50% 8 12% 0 0078% 40 SALESFORCE COM INC CRM 48,381 55 N/A 0 00% N/A N/A N/A 41 CISCO SYSTEMS INC CSCO 151,875 80 0 86% 3 71% 6 00% 9 82% 0 0845% 42 CSRA INC CSRA 4,239 27 N/A 1 54% N/A N/A N/A 43 CSX CORP CSX 29,176 99 0 17% 2 31% 6 50% 8 89% 0 0147% 44 CINTAS CORP CTAS 11,393 61 0 06% 0 96% 10 00% 11 01% 0 0071% 45 CENTURYLINK INC CTL 14,952 86 0 08% 7 89% 14 00% 22 44% 0 0190% 46 COGNIZANT TECH SOLUTIONS-A CTSH 31,124 13 0 18% 0 00% 12 50% 12 50% 0 0220% 47 CfTRIX SYSTEMS INC CD(S 12,931 37 0 07% 0 00% 11 00% 11 00% 0 0081% 48 CVS HEALTH CORP CVS 93,720 00 0 53% 1 93% 11 50% 13 54% 0 0719% 49 CHEVRON CORP CVX 190,142 30 1 08% 4 25% 3 50% 7 82% 0 0843% 50 CONCHO RESOURCES INC CXO 18,228 28 0 10% 0 00% 16 50% 16 50% 0 0170% 51 DOMINION RESOURCES INCNA D 43,692 76 0 25% 4 05% 9 00% 13 23% 0 0328% 52 DELTA AIR LINES INC DAL 29,462 77 0 17% 2 02% 12 00% 14 14% 0 0236% 53 DU PONT (E I ) DE NEMOURS DD 59,569 14 0 34% 2 38% 6 50% 8 96% 0 0302% 54 DEERE & CO DE 27,147 28 0 15% 2 78% -2 00% 0 75% 0 0012% 55 DISCOVER FINANCIAL SERVICES DFS 22,160 06 0 13% 2 20% 5 00% 7 26% 0 0091% 56 DOLLAR GENERAL CORP DG 19,538 95 0 11% 1 51% 13 50% 15 11% 0 0167% 57 QUEST DIAGNOSTICS INC DGX 11,581 48 0 07% 1 92% 10 00% 12 02% 0 0079% 58 DR HORTON INC DHI 10,748 33 0 06% 1 11% 13 00% 14 18% 0 0086% 59 DANAHER CORP DHR 52,623 01 0 30% 0 66% 8 00% 8 69% 0 0259% 60 WALT DISNEY CO/THE DIS 154,904 00 0 88% 1 56% 10 00% 11 64% 0 1022% 61 DISCOVERY COMMUNICATIONS-A DISCA 10,167 79 0 06% 0 00% 15 50% , 15 50% 0 0089% 62 DELPHI AUTOMOTIVE PLC DLPH 17,977 94 0 10% 1 88% 14 50% 16 52% 0 0168% 63 DIGITAL REALTY TRUST INC DLR N/A 4 03% N/A N/A N/A 64 DOLLAR TREE INC DLTR 18,438 81 0 10% 0 00% 21 00% 21 00% 0 0219% 65 DUN & BRADSTREET CORP DNB 4,582 51 0 03% 1 53% 4 50% 6 06% 0 0016% 66 DOVER CORP DOV 10,343 59 0 06% 2 64% 3 50% 6 19% 0 0036% 67 DOW CHEMICAL CO/THE DOW 59,620 58 0 34% 3 70% 10 00% 13 89% 0 0469% 68 DR PEPPER SNAPPLE GROUP INC DPS 16,196 81 0 09% 2 50% 9 00% 11 61% 0 0107% 69 DARDEN RESTAURANTS INC DRI 7,653 18 0 04% 3 60% 15 00% 18 87% 0 0082% 70 DTE ENERGY COMPANY DTE 16,639 01 0 09% 3 37% 6 00% 9 47% 0 0089% 71 DUKE ENERGY CORP DUK 53,700 66 0 30% 4 43% 4 50% 9 03% 0 0275% 72 DAVITA INC DVA 13,032 88 0 07% 0 00% 11 00% 11 00% 0 0081% 73 DEVON ENERGY CORP DVN 23,003 60 0 13% 0 55% 1 00% 1 55% 0 0020% 74 ELECTRONIC ARTS INC EA 24,609 76 0 14% 0 00% 14 00% 14 00% 0 0195% 75 EBAY INC EBAY 35,669 32 0 20% 0 00% 3 50% 3 50% 0 0071% 76 ECOLAB INC ECL 34,120 11 0 19% 1 20% 8 50% 9 75% 0 0189% 77 CONSOLIDATED EDISON INC ED 20,496 14 0 12% 3 76% 2 50% 6 31% 0 0073% 78 EQUIFAX INC EFX 15,388 51 0 09% 1 02% 11 00% 12 08% 0 0105%
780

[4] [5] [6] [7] [8]
PUC Docket No. 46449 EXHIBIT RBH-3
Page 10 of 14
[9]
2 Company Ticker Market
Capitalization Weight in Index Estimated
Dividend Yield Long-Term Growth Est DCF Result
Weighted DCF Result
3 79 EDISON INTERNATIONAL EIX 23,135 84 0 13% 2 86% 3 50% 6 41% 0 0084% 80 ESTEE LAUDER COMPANIES-CL A EL • 32542 51 0 18% 1 36% 8 00% 9 41% 0 0174% 81 EASTMAN CHEMICAL CO .
EMN 9,327 75 0 05% 2 91% 9 50% 12 55% 0 0066% 82 EMERSON ELECTRIC CO EMR 32,298 83 0 18% 3 79% 2 00% 5 83% 0 0107% 83 ENDO INTERNATIONAL PLC ENDP 4,412 98 0 03% 0 00% 32 00% 32 00% 0 0080% 84 EOG RESOURCES INC EOG 52,585 07 0 30% 0 74% 4 00% 4 75% 0 0142% 85 EQUINIX INC EQIX 25,722 04 0 15% 1 93% 19 50% 21 62% 0 0315% 1 EQUITY RESIDENTIAL EQR - N/A 3 47% N/A N/A N/A 2 EQT CORP EQT 12,156 21 0 07% 0 17% 12 00% 12 18% 0 0084% 3 EVERSOURCE ENERGY ES 16,907 13 0 10% 3 51% 6 00% 9 62% 0 0092% 4 EXPRESS SCRIPTS HOLDING CO ESRX 43,509 00 0 25% 0 00% 15 50% 15 50% 0 0382% 5 ESSEX PROPERTY TRUST INC ESS - N/A 3 26% N/A N/A N/A 6 E'TRADE FINANCIAL CORP ETFC 7,695 80 0 04% 0 00% 17 50% 17 50% 0 0076% 7 EATON CORP PLC ETN 28,714 31 0 16% 3 61% 5 00% 8 70% 0 0142% 8 ENTERGY CORP ETR 13,395 73 0 08% 4 65% 2 00% 6 70% 0 0051% 9 EDWARDS LIFESCIENCES CORP EW 25,238 98 0 14% 0 00% 18 00% 18 00% 0 0257%
10 EXELON CORP EXC 29,170 80 0 17% 3 90% 7 00% 11 04% 0 0182% 11 EXPEDITORS INTL WASH INC EXPD 9,219 28 0 05% 1 57% 10 00% 11 65% 0 0061% 12 EXPEDIA INC EXPE 17,755 19 0 10% 0 88% 22 00% 22 98% 0 0231% 13 EXTRA SPACE STORAGE INC EXR N/A 4 18% N/A N/A N/A 14 FORD MOTOR CO F 46,477 45 0.26% 5 04% 5 50% 10 68% 0 0281% 15 FASTENAL CO FAST 11,078 19 0 06% 3 13% 7 00% 10 24% 0 0064% 16 FACEBOOK INC-A FB 366,843 40 2 08% 0 00% 36 50% 36 50% 0 7588% 17 FORTUNE BRANDS HOME & SECURI FBHS 8,484 62 0 05% 1 16% 15 50% 16 75% 0 0081% 18 FREEPORT-MCMORAN INC FCX 12,705 52 0 07% 0 00% 36 50% 36 50% 0 0263% 19 FEDEX CORP FDX 45,431 50 0 26% 0 94% 13 50% 14 50% 0 0373% 20 FIRSTENERGY CORP FE 13,419 25 0 08% 4 56% 7 50% 12 23% 0 0093% 21 F5 NETWORKS INC FFIV 7,688 27 0 04% 0 00% 9 00% 9 00% 0 0039% 22 FIDELITY NATIONAL INFO SERV FIS 24,959 91 0 14% 1 36% 15 50% 16 97% 0 0240% 23 FISERV INC FISV 22,000 44 0 12% 0 00% 9 50% 9 50% 0 0118% 24 FIFTH THIRD BANCORP FITB 15,127 67 0 09% 2 84% 3 00% 5 88% 0 0050% 25 FOOT LOCKER INC FL 9,114 38 0 05% 1 61% 8 50% 10 18% 0 0053% 26 FLIR SYSTEMS INC FLIR 4,013 63 0 02% 1 74% 8 00% 9 81% 0 0022% 27 FLUOR CORP FLR 7,006 76 0 04% 1 67% 1 50% 3 18% 0 0013% 28 FLOWSERVE CORP FLS 5,667 82 0 03% 1 74% 2 50% 4 26% 0 0014% 29 FMC CORP , FMC 6,203 39 0 04% 1 49% 4 00% 5 52% 0 0019% 30 TWENTY-FIRST CENTURY FOX-A FOXA 45,922 86 0 26% 1 47% 10 50% 12 05% 0 0314% 31 FEDERAL REALTY INVS TRUST FRT - N/A 2 66% N/A N/A N/A 32 FIRST SOLAR INC FSLR 3,958 90 0 02% 0 00% 8 50% 8 50% 0 0019% 33 FMC TECHNOLOGIES INC FTI 7,185 36 0 04% 0 00% -1 00% -1 00% -0 0004% 34 FRONTIER COMMUNICATIONS CORP FTR 4,672 80 0 03% 10 50% 13 50% 24 71% 0 0065% 35 FORTIVE CORP FTV - N/A 0 57% N/A N/A N/A 36 GENERAL DYNAMICS CORP GD 46,100 18 0 26% 2 01% 7 00% 9 08% 0 0237% 37 GENERAL ELECTRIC CO GE 269,842 10 1 53% 3 20% 12 00% 15 39% 0 2354% 38 GENERAL GROWTH PROPERTIES GGP - N/A 3 12% N/A N/A N/A 39 GILEAD SCIENCES INC GILD 97,242 86 0 55% 2 57% 10 00% 12 70% 0 0700% 40 GENERAL MILLS INC GIS 36,996 01 0 21% 3 12% 7 00% 10 23% 0 0214% 41 CORNING INC GLW 24,058 40 0 14% 2 33% 6 50% 8 91% 0 0121% 42 GENERAL MOTORS CO GM 49,216 16 0 28% 4 82% 9 00% 14 04% 0 0392% 43 ALPHABET INC-CL A GOOGL N/A N/A 0 00% N/A N/A N/A 44 GENUINE PARTS CO GPC 14,548 90 0 08% 2 69% 7 00% 9 78% 0 0081% 45 GLOBAL PAYMENTS INC GPN 11,272 72 0 06% 0 06% 14 50% 14 56% 0 0093% 46 GAP INC/THE GPS 10,562 92 0.06% 3 50% -2 00% 1 47% 0 0009% 47 GARMIN LTD GRMN 9,062 32 0 05% 4 31% 1 50% 5 84% 0 0030% 48 GOLDMAN SACHS GROUP INC GS 68,071 47 0 39% 1 55% 7 00% 8 60% 0 0332% 49 GOODYEAR TIRE & RUBBER CO GT 8,294 92 0 05% 1 26% 8 50% 9 81% 0 0046%
, 50 WW GRAINGER INC GWW 12,913 60 0 07% 2 28% 6 00% 8 35% 0 0061% 51 HALLIBURTON CO HAL 40,437 20 0 23% 1 53% 8 00% 9 59% 0 0220% 52 HARMAN INTERNATIONAL HAR 5,599 95 0 03% 1 76% 17 00% 18 91% 0 0060% 53 HASBRO INC HAS 9,612 29 0 05% 2 66% 11 50% 14 31% 0 0078% 54 HUNTINGTON BANCSHARES INC HBAN 7,767 78 0 04% 3 29% 9 00% 12 44% 0 0055% 55 HANESBRANDS INC HBI 9,331 41 0 05% 1 78% 13 50% 15 40% 0 0081% 56 HCA HOLDINGS INC HCA 30,515 18 0 17% 0 00% 11 50% 11 50% 0 0199% 57 WELLTOWER INC HCN _ N/A 5 14% N/A N/A N/A 58 HCP INC HCP - N/A 6 39% N/A N/A N/A 59 HOME DEPOT INC HD 156,040 50 0 88% 2 42% 12 50% 15 07% 0 1333% 60 HESS CORP HES 16,315 04 0 09% 1 94% -1 00% 0 93% 0 0009% 61 HARTFORD FINANCIAL SVCS GRP HIG 16,626 04 0 09% 1 96% 11 50% 13 57% 0 0128% 62 HARLEY-DAVIDSON INC HOG 9,014 94 0 05% 2 78% 9 00% 11 91% 0 0061% 63 HOLOGIC INC HOLX 10,617 40 0 06% 0 00% 21 00% 21 00% 0 0126% 64 HONEYWELL INTERNATIONAL INC HON 82,372 32 0 47% 2 20% 9 00% 11 30% 0 0527% 65 HELMERICH & PAYNE HP 7,505 04 0 04% 4 03% -6 00% -2 09% -0 0009% 66 HEWLETT PACKARD ENTERPRIS HPE 36,208 64 N/A 1 01% N/A N/A N/A 67 HP INC HPQ 25,919 77 N/A 3 30% N/A N/A N/A 68 H&R BLOCK INC HRB 5,028 19 0 03% 3 83% 10 00% 14 021/4 % 0 0040% 69 - HORMEL FOODS CORP HRL 20,133 51 0 11% 1 68% 14 00% 15 80% 0 0180% 70 HARRIS CORP HRS 11,190 45 0 06% 2 38% 7 50% 9 97% 0 0063% 71 HENRY SCHEIN INC HSIC 12,767 39 0 07% 0 00% 9 00% 9 00% 0 0065% 72 HOST HOTELS & RESORTS INC HST N/A 5 29% N/A N/A N/A 73 HERSHEY CO/THE HSY 20,354 03 0 12% 2 58% 5 50% 8 15% 0 0094% 74 HUMANA INC HUM 25,263 88 0 14% 0 68% 9 50% 10 21% 0 0146% 75 INTL BUSINESS MACHINES CORP IBM 146,932 30 0 83% 3 71% 0 50% 4 22% 0 0351%
781

PUC Docket No. 46449 EXHIBIT RBH-3
Page 11 of 14 [4) [5] [6] in [8] [9]
2 Company Ticker Market
Capitalization Weight in Index Estimated
Dividend Yield Long-Term Growth Est DCF Result
Weighted DCF Result
3 76 INTERCONTINENTAL EXCHANGE IN ICE 31,720 64 0 18% 1 28% 14 00% 15 37% 0 0276% 77 INTL FLAVORS & FRAGRANCES IFF 10,370 05 0 06% 1 97% 7 00% 9 04% 0 0053% 78 ILLUMINA INC ILMN 20,109 12 0 11% 0 00% 21 50% 21 50% 0 0245% 79 INTEL CORP INTC 174,794 20 0 99% 2 81% 9 50% 12 44% 0 1233% 80 INTUIT INC INTU 27,538 70 0 16% 1 12% 13 00% 14 19% 0 0222% 81 INTERNATIONAL PAPER CO IP 18,840 63 0 11% 4 04% 15 00% 19 34% 0 0207% 82 INTERPUBLIC GROUP OF COS INC IPG 9,223 15 0 05% 2 94% 13 00% 16 13% 0 0084% 83 INGERSOLL-RAND PLC IR 16,870 49 0 10% 2 45% 10 00% 12 57% 0 0120% 84 IRON MOUNTAIN INC IRM 9,263 67 0 05% 5 51% 11 50% 17 33% 0 0091% 85 INTUITIVE SURGICAL INC ISRG 27,467 44 0 16% 0 00% 11 50% 11 50% 0 0179% 1 ILLINOIS TOOL WORKS MN 41,118 57 0 23% 2 24% 10 50% 12 86% 0 0300% 2 INVESCO LTD IVZ 12,424 55 0 07% 3 70% 7 00% 10 83% 0 0076% 3 HUNT (JB) TRANSPRT SVCS INC JBHT 9,006 51 0 05% 1 10% 10 50% 11 66% 0 0060% 4 JOHNSON CONTROLS INTERNATION JCI 27,735 57 0 16% 2 67% 9 50% 12 30% 0 0193% 5 JACOBS ENGINEERING GROUP INC JEC 6,108 32 0 03% 0 00% 4 00% 4 00% 0 0014% 6 JOHNSON & JOHNSON JNJ 323,754 90 1 83% 2 79% 8 50% 11 41% 0 2093% 7 JUNIPER NETWORKS INC JNPR 8,884 79 0 05% 1 81% 10 00% 11 90% 0 0060% 8 JPMORGAN CHASE & CO JPM 244,675 70 1 39% 2 86% 6 00% 8 95% 0 1240% 9 NORDSTROM INC JWN 9,302 74 N/A 3 17% N/A N/A N/A
10 KELLOGG CO K 26,447 22 0 15% 2 76% 6 00% 8 84% 0 0133% 11 KEYCORP KEY 10,373 67 0 06% 2 84% 7 50% 10 45% 0 0061% 12 KRAFT HEINZ CO/THE KHC 105,970 70 N/A 2 79% N/A N/A N/A 13 KIMCO REALTY CORP KIM N/A 3 81% N/A N/A N/A 14 KLA-TENCOR CORP MAC 11,108 21 0 06% 3 03% 12 50% 15 72% 0 0099% 15 KIMBERLY-CLARK CORP KMB 43,742 53 0 25% 3 03% 10 00% 13 18% 0 0327% 16 KINDER MORGAN INC KMI 45,812 73 0 26% 2 43% 13 00% 15 59% 0 0405% 17 CARMAX INC KMX 9,842 48 0 06% 0 00% 10 50% 10 50% 0 0059% 18 COCA-COLA CO/THE KO 180,194 40 1 02% 3 50% 4 00% 7 57% 0 0773% 19 MICHAEL KORS HOLDINGS LTD KORS 7,880 33 0 04% 0 00% 6 00% 6 00% 0 0027% 20 KROGER CO KR 29,386 72 0 17% 1 64% 10 00% 11 72% 0 0195% 21 KOHLS CORP KSS 8,103 24 0 05% 4 61% 8 00% 12 79% 0 0059% 22 KANSAS CITY SOUTHERN KSU 10,063 87 0 06% 1 42% 9 00% 10 48% 0 0060% 23 LOEWS CORP L 13,794 38 0 08% 0 61% 12 50% 13 15% 0 0103% 24 L BRANDS INC LB 20,792 20 0 12% 3 30% 6 00% 9 40% 0 0111% 25 LEGGETT & PLATT INC LEG 6,111 48 0 03% 2 98% 11 00% 14 14% 0 0049% 26 LENNAR CORP-A LEN 9,330 81 0 05% 0 39% 12 50% 12 91% 0 0068% 27 LABORATORY CRP OF AMER HLDGS LH 13,937 01 0 08% 0 00% 10 00% 10 00% 0 0079% 28 LKQ CORP LKQ 10,111 67 0 06% 0 00% 15 00% 15 00% 0 0086% 29 L-3 COMMUNICATIONS HOLDINGS LLL 11,505 02 0 07% 1 88% 6 50% 8 44% 0 0055% 30 LINEAR TECHNOLOGY CORP LLTC 14,052 41 0 08% 2 18% 5 50% 7 74% 0 0062% 31 ELI LILLY & CO LLY 88,307 44 0 50% 2 55% 9 50% 12 17% 0 0609% 32 LEGG MASON INC LM 3,317 11 0 02% 2 75% 21 50% 24 55% 0 0046% 33 LOCKHEED MARTIN CORP LMT 70,574 06 4 0 40% 3 13% 8 00% 11 26% 0 0450% 34 LINCOLN NATIONAL CORP LNC 11,229 55 0 06% 2 32% 7 00% 9 40% 0 0060% 35 ALLIANT ENERGY CORP LNT 8,463 65 0 05% 3 17% 6 50% 9 77% 0 0047% 36 LOWE'S COS INC LOW 62,639 11 0 35% 1 97% 15 00% 17 12% 0 0608% 37 LAM RESEARCH CORP LRCX 15,570 25 0 09% 1 23% 16 00% 17 33% 0 0153% 38 LEUCADIA NATIONAL CORP LUK 6,811 66 0 04% 1 32% 16 50% 17 93% 0 0069% 39 SOUTHWEST AIRLINES CO LUV 25,665 24 0 15% 0 97% 16 50% 17 55% 0 0255% 40 LEVEL 3 COMMUNICATIONS INC LVLT 16,143 98 0 09% 0 00% 37 00% 37 00% 0 0339% 41 LYONDELLBASELL INDU-CL A LYB 33,508 62 0 19% 4 26% 6 50% 10 90% 0 0207% 42 MACYS INC M 11,351 62 N/A 4 13% N/A N/A N/A 43 MASTERCARD INC - A MA 110,413 00 0 63% 0 76% 11 00% 11 80% 0 0738% 44 MACERICH COTTHE MAC N/A 3 69% N/A N/A N/A 45 MARRIOTT INTERNATIONAL -CL A MAR 17,113 49 0 10% 1 78% 12 50% 14 39% 0 0140% 46 MASCO CORP MAS 10,882 03 0 06% 1 20% 15 00% 16 29% 0 0100% 47 MATTEL INC MAT 10,211 19 0 06% 5 07% 6 50% 11 73% 0 0068% 48 MCDONALD'S CORP MCD 98,479 36 0 56% 3 26% 6 00% 9 36% 0 0522% 49 MICROCHIP TECHNOLOGY INC MCHP 12,559 96 0 07% 2 47% 8 00% 10 57% 0 0075% 50 MCKESSON CORP MCK 36,627 82 0 21% 0 69% 12 00% 12 73% 0 0264% 51 MOODY'S CORP MCO 20,496 31 0 12% 1 39% 6 50% 7 94% 0 0092% 52 MONDELEZ INTERNATIONAL INC-A MDLZ 65,110 24 0 37% 1 86% 11 50% 13 47% 0 0497% 53 MEDTRONIC PLC MDT 115,129 10 0 65% 2 07% 6 50% 8 64% 0 0564% 54 METLIFE INC MET 51,291 70 0 29% 3 58% 6 50% 10 20% 0 0296% 55 MOHAWK INDUSTRIES INC MHK 14,452 22 0 08% 0 00% 10 50% 10 50% 0 0086% 56 MEAD JOHNSON NUTRITION CO MJN 14,892 75 0 08% 2 05% 6 00% 8 11% 0 0068% 57 MCCORMICK & CO-NON VTG SHRS MKC 11,927 77 0 07% 1 82% 7 50% 9 39% 0 0063% 58 ; MARTIN MARIETTA MATERIALS MLM 10,908 40 0 06% 0 98% 24 50% 25 60% 0 0158% 59 MARSH & MCLENNAN COS MMC 34,091 07 0 19% 2 07% 9 00% 11 16% 0 0216% 60 3M CO MMM 102,760 10 0 58% 2 61% 8 50% 11 22% 0 0653% 61 MALLINCKRODT PLC MNK 7,203 73 N/A 0 00% N/A N/A N/A 62 MONSTER BEVERAGE CORP MNST 27,785 98 0 16% 0 00% 14 50% 14 50% 0 0228% 63 ALTRIA GROUP INC MO 122,496 60 0 69% 3 89% 9 50% 13 57% 0 0942% 64 MONSANTO CO MON 44,863 91 0 25% 2 34% 6 00% 8 41% 0 0214% 65 MOSAIC CO/THE MOS 8,132 28 0 05% 5 29% 0 50% 5 80% 0 0027% 66 MARATHON PETROLEUM CORP MPC 21,943 68 0 12% 3 56% 5 50% 9 16% 0 0114% 67 MERCK & CO INC MRK 172,879 30 0 98% 2 94% 6 00% 9 03% 0 0885% 68 MARATHON OIL CORP MRO 12,533 44 0 07% 1 35% 13 00% 14 44% 0 0103% 69 MORGAN STANLEY MS 60,661 67 0 34% 2 52% 14 50% 17 20% 0 0591% 70 MICROSOFT CORP MSFT 447,960 40 2 54% 2 74% 7 00% 9 84% 0 2497% 71 MOTOROLA SOLUTIONS INC MSI 12,179 10 0 07% 2 46% 9 00% 11 57% 0 0080% 72 M & T BANK CORP MTB 17,871 47 0 10% 2 47% 5 00% 7 53% 0 0076%
782

[4] [5] [6] [8]
PUC Docket No. 46449 EXHIBIT RBH-3
Page 12 of 14
[9]
2 Company Ticker Market
Capitalization Weight in Index Estimated
Dividend Yield Long-Term Growth Est DCF Result
Weighted DCF Result
3 73 METTLER-TOLEDO INTERNATIONAL MTD 10,746 46 0 06% 0 00% 10 00% 10 00% 0 0061% 74 MICRON TECHNOLOGY INC MU 17,524 00 0 10% 0 00% -3 50% -3 50% -0 0035% 75 MURPHY OIL CORP MUR 4,935 22 N/A 3 49% N/A N/A N/A 76 MYLAN NV MYL 19,258 99 0 11% 0 00% 20 50% 20 50% 0 0224% 77 NAVIENT CORP NAV1 4,406 76 N/A 4 60% N/A N/A N/A 78 NOBLE ENERGY INC NBL 15,349 85 N/A 1 13% N/A N/A N/A " 79 NASDAQ INC NDAQ 11,064 83 0 06% 1 92% 10 00% 12 02% 0 0075% 80 NEXTERA ENERGY INC NEE 57,579 06 0 33% 2 97% 6 00% 9 06% 0 0296% 81 NEWMONT MINING CORP NEM 18,470 01 0 10% 0 58% 9 00% 9 61% 0 0101% 82 NETFLIX INC NFLX 42,971 11 0 24% 0 00% 35 00% 35 00% 0 0852% 83 NEWFIELD EXPLORATION CO NFX 8,567 30 0 05% 0 00% 11 50% 11 50% 0 0056% 84 NISOURCE INC NI 7,373 89 .0 04% 2 88% 1 50% 4 40% 0 0018% 85 NIKE INC -CL B, NKE 86,786 04 0 49% 1 23% 15 00% 16 32% 0 0803% 1 NIELSEN HOLDINGS PLC NLSN 18,778 53 0 11% 2 36% 9 00% 11 47% 0 0122% 2 NORTHROP GRUMMAN CORP NOC 39,078 84 0 22% 1 65% 7 50% 9 21% 0 0204% 3 NATIONAL OILWELL VARGO INC NOV 13,704 23 0 08% 0 55% -9 00% -8 47% -0 0066% 4 NRG ENERGY INC NRG 3,549 44 N/A 1 07% N/A N/A N/A 5 NORFOLK SOUTHERN CORP NSC 27,834 41 0 16% 2 49% 6 50% 9 07% 0 0143% 6 NETAPP INC NTAP 9,415 86 0 05% 2 24% 3 50% 5 78% 0 0031% 7 NORTHERN TRUST CORP NTRS 15,818 32 0 09% 2 18% 7 50% 9 76% 0 0088% 8 NUCOR CORP - NUE 14,816 29 0 08% 3 22% 24 50% 28 11% 0 0236% 9 NVIDIA CORP NVDA 34,962 25 0 20% 0 70% 15 50% 16 25% 0 0322%
10 NEWELL BRANDS INC NWL 25,132 27 0 14% 1 46% 14 00% 15 56% 0 0222% 11 NEWS CORP - CLASS A NWSA 7,854 84 0 04% 1 48% 27 50% 29 18% 0 0130% 12 REALTY INCOME CORP 0 - N/A 3 86% N/A N/A N/A 13 OWENS-ILLINOIS INC 01 2,760 26 0 02% 0 00% 6 00% 6 00% 0 0009% 14 ONEOK INC OKE 10,478 87 0 06% 5 10% 12 50% 17 92% 0 0106% 15 OMNICOM GROUP OMC 19,412 68 0 11% 2 80% 9 00% 11 93% 0 0131% 16 ORACLE CORP ORCL 156,151 20 0 88% 1 68% 6 00% 7 73% 0 0684% 17 O'REILLY AUTOMOTIVE INC ORLY 26,461 64 0 15% 0 00% 13 00% 13 00% 0 0195% 18 OCCIDENTAL PETROLEUM CORP OXY 56,454 13 0 32% 4 11% 4 00% 8 19% 0 0262% 19 PAYCHEX INC PAYX 20,342 01 0 12% 3 33% 9 00% 12 48% 0 0144% 20 PEOPLES UNITED FINANCIAL PBCT 4,787 89 0 03% 4 41% 10 50% 15 14% 0 0041% 21 PITNEY BOWES INC PB1 3,141 79 0 02% 4 43% 4 50% 9 03% 0 0016% 22 PACCAR INC PCAR 19,869 85 0 11% 4 41% 5 50% 10 03% 0 0113% 23 P G & E CORP PCG 30,072 89 0 17% 3 31% 12 00% 15 51% 0 0264% 24 PRICELINE GROUP INC/THE PCLN 71,373 01 0 40% 0 00% 15 50% 15 50% 0 0627% 25 PATTERSON COS INC PDCO 4,488 01 0 03% 2 21% 11 50% 13 84% 0 0035% 26 PUBLIC SERVICE ENTERPRISE GP PEG 20,689 85 0 12% 4 10% .3 00% 7 16% 0 0084% 27 PEPSICO INC PEP 152,101 10 0 86% 2 87% 7 00% 9 97% 0 0859% 28 PFIZER INC PFE 198,710 80 1 13% 3 66% 12 00% 15 88% 0 1788% 29 PRINCIPAL FINANCIAL GROUP PFG 14,978 88 0 08% 3 15% 5 00% 8 23% 0 0070% 30 PROCTER & GAMBLE COTTHE PG 235,430 80 1 33% 3 04% 9 00% 12 18% 0 1625% 31 PROGRESSIVE CORP PGR 18,900 11 0 11% 2 74% 8 50% 11 36% 0 0122% 32 PARKER HANNIFIN CORP PH 16,539 76 0 09% 2 04% 6 50% 8 61% 0 0081% 33 PULTEGROUP INC PHM 6,666 23 0 04% 2 01% 13 00% 15 14% 0 0057% 34 PERKINELMER INC PK1 5,695 05 0 03% 0 54% 8 50% 9 06% 0 0029% 35 PROLOGIS INC PLD - N/A 3 28% N/A N/A N/A 36 PHILIP MORRIS INTERNATIONAL PM 149,237 50 0 85% 4 32% 5 00% 9 43% 0 0797% 37 PNC FINANCIAL SERVICES GROUP PNC 43,354 42 0 25% 2 50% 4 00% 6 55% 0 0161% 38 PENTAIR PLC PNR 10,650 08 0 06% 2 31% 10 00% 12 43% 0 0075% 39 PINNACLE WEST CAPITAL PNW 8,261 34 0 05% 3 49% 4 00% 7 56% 0 0035% 40 PPG INDUSTRIES INC PPG 24,529 90 0 14% 1 74% 9 50% 11 32% 0 0157% 41 PPL CORP PPL 22,359 12 0 13% 4 76% 1 00% 5 78% 0 0073% 42 PERRIGO CO PLC PRGO 12,587 28 0 07% 0 69% 8 50% 9 22% 0 0066% 43 PRUDENTIAL FINANCIAL INC PRU 36,713 68 0 21% 3 35% 1 50% 4 88% 0 0101% 44 PUBLIC STORAGE PSA - N/A 3 50% N/A N/A N/A 45 PHILLIPS 66 PSX 41,383 50 0 23% 3 31% 2 50% 5 85% 0 0137% 46 PVH CORP PVH 8,941 64 0 05% 0 14% 5 50% 5 64% 0 0029% 47 QUANTA SERVICES INC PWR 4,020 13 0 02% 0 00% 8 50% 8 50% 0 0019% 48 PRAXAIR INC PX 33,400 67 0 19% 2 69% 6 50% 9 28% 0 0176% 49 PIONEER NATURAL RESOURCES CO PXD 31,912 31 0 18% 0 04% 19 50% 19 54% 0 0353% 50 PAYPAL HOLDINGS INC PYPL 47,314 39 N/A 0 00% N/A N/A N/A 51 QUALCOMM INC QCOM 96,776 09 0 55% 3 38% 4 50% 7 96% 0 0436% 52 QORVO INC ORVO 6,762 80 N/A 0 00% N/A N/A N/A 53 RYDER SYSTEM INC R 3,397 99 0 02% 2 77% 9 00% 11 89% 0 0023% 54 REYNOLDS AMERICAN INC RAI 67,713 06 0 38% 3 88% 14 00% 18 15% 0 0697% 55 ROYAL CARIBBEAN CRUISES LTD RCL 15,513 36 0 09% 2 66% 16 50% 19 38% 0 0170% 56 REGENERON PHARMACEUTICALS REGN 38,845 79 0 22% 0 00% 23 50% 23 50% 0 0517% 57 REGIONS FINANCIAL CORP RF 12,527 20 0 07% 2 71% 7 00% 9 80% 0 0070% 58 ROBERT HALF INTL INC RH1 4,908 81 0 03% 2 41% 9 00% 11 52% 0 0032% 59 RED HAT INC RHT 13,796 59 0 08% 0 00% 16 50% 16 50% 0 0129% 60 TRANSOCEAN LTD RIG 3,621 02 0 02% 0 00% -19 00% -19 00% -0 0039% 61 RALPH LAUREN CORP RL 8,204 49 0 05% 2 06% 3 50% 5 60% 0 0026% 62 ROCKWELL AUTOMATION INC ROK 15,049 22 0 09% 2 74% 3 00% 5 78% 0 0049% 63 ROPER TECHNOLOGIES INC ROP 17,621 00 0 10% 0 69% 7 00% 7 71% 0 0077% 64 ROSS STORES INC ROST 25,702 35 0 15% 0 90% 8 50% 9.44% 0 0137% 65 RANGE RESOURCES CORP RRC 6,701 12 0 04% 0 20% 12 00% 12 21% 0 0046% 66 REPUBLIC SERVICES INC RSG 17,008 20 0 10% 2 58% 8 50% 11 19% 0 0108% 67 RAYTHEON COMPANY RTN 40,739 50 0 23% 2 12% 9 00% 11 22% 0 0259% 68 STARBUCKS CORP SBUX 77,645 88 0 44% 1 81% 16 50% 18 46% 0 0812% 69 SCANA CORP SCG 9,981 32 0 06% 3 42% 4 50% 8 00% 0 0045%
783

[4] [5] [6] [71 [8]
PUC Docket No. 46449 EXHIBIT RBH-3
Page 13 of 14
[9] Market Estimated Long-Term Weighted
2 Company Ticker Capitalization Weight in Index Dividend Yield Growth Est DCF Result DCF Result 3
70 SCHWAB (CHARLES) CORP SCHW 41,577 90 0 24% 0 89% 12 00% 12 94% 0 0305% 71 SPECTRA ENERGY CORP SE 29,901 96 0 17% 3 80% 11 50% 15 52% 0 0263% 72 SEALED AIR CORP SEE 8,716 66 0 05% 1 44% 16 00% 17 56% 0 0087% 73 SHERWIN-WILLIAMS COTTHE SHW 24,850 14 0 14% 1 34% 11 00% 12 41% 0 0175% 74 SIGNET JEWELERS LTD SIG 6,127 38 0 03% 1 33% 14 50% 15 93% 0 0055% 75 JM SMUCKER CO/THE SJM 15,591 10 0 09% 2 24% 7 50% 9 82% 0 0087% 76 SCHLUMBERGER LTD SLB 113,383 30 0 64% 2 45% 10 00% 12 57% 0 0808% 77 SL GREEN REALTY CORP SLG - N/A 2 83% N/A N/A N/A 78 SNAP-ON INC SNA 8,478 08 0 05% 1 67% 10 00% 11 75% 0 0056% 79 SCRIPPS NETWORKS INTER-CL A SNI 7,969 63 0 05% 1 62% 9 00% 10 69% 0 0048% 80 SOUTHERN CO/THE SO 47,775 31 0 27% 4 49% 4 00% 8 58% 0 0232% 81 SIMON PROPERTY GROUP INC SPG - N/A 3 44% N/A N/A N/A 82 S&P GLOBAL INC SPGI 32,384 88 0 18% 1 22% 11 50% 12 79% 0 0235% 83 STAPLES INC SPLS 4,975 69 N/A 6 28% N/A N/A N/A 84 STERICYCLE INC SRCL 6,319 70 0 04% 0 00% 6 50% 6 50% 0 0023% 85 SEMPRA ENERGY SRE 26,150 00 0 15% 3 01% 8 00% 11 13% 0 0165% 1 SUNTRUST BANKS INC STI 22,443 20 0 13% 2 37% 7 00% 9 45% 0 0120% 2 ST JUDE MEDICAL INC STJ 22,244 10 0 13% 1 64% 5 50% 7 19% 0 0091% 3 STATE STREET CORP STI" 26,792 33 0 15% 2 27% 5 50% 7 83% 0 0119% 4 SEAGATE TECHNOLOGY SD( 10,503 76 0 06% 7 16% -0 50% 6 64% 0 0040% 5 CONSTELLATION BRANDS INC-A STZ 35,675 57 0 20% 0 97% 15 50% 16 55% 0 0335% 6 STANLEY BLACK & DECKER INC SWK 18,175 85 0 10% 1 92% 9 00% 11 01% 0 0113% 7 SKYWORKS SOLUTIONS INC SWKS 14,514 38 0 08% 1 45% , 16 50% 18 07% 0 0149% 8 SOUTHWESTERN ENERGY CO SWN 5,353 24 0 03% 0 00% -3 00% -3 00% -0 0009%
• 9 SYNCHRONY FINANCIAL SYF 21,990 50 N/A 1 97% N/A N/A' N/A 10 STRYKER CORP SYK 42,478 92 0 24% 1 34% 18 50% 19 96% 0 0481% 11 SYMANTEC CORP SYMC 14,946 48 0 08% 1 24% 5 00% 6 27% 0 0053% 12 SYSCO CORP SYY 27,341 91 0 15% 2 60% 11 50% 14 25% 0 0221% 13 AT&T INC T 242,197 70 1 37% 4 95% 6 50% 11 61% 0 1594% 14 MOLSON COORS BREWING CO -B TAP 23,767 62 0 13% 1 48% 17 00% 18 61% 0 0251% 15 TERADATA CORP TDC 3,795 65 0 02% 0 00% 3 50% 3 50% 0 0008% 16 TRANSDIGM GROUP INC TDG 14,843 36 0 08% 0 00% 20 50% 20 50% 0 0172% 17 TE CONNECTIVITY LTD TEL 21,865 32 0 12% 2 41% 9 00% 11 52% 0 0143% 18 TEGNA INC TGNA 4,273 60 0 02% 2 81% 1 00% 3 82% 0 0009% 19 TARGET CORP TGT 39,023 24 0 22% 3 54% 10 00% 13 72% 0 0303% 20 TIFFANY & CO TIF 9,095 22 0 05% 2 50% 7 50% 10 09% 0 0052% 21 TJX COMPANIES INC TJX 48,900 36 0 28% 1 40% 10 50% 11 97% 0 0332% 22 TORCHMARK CORP TMK 7,625 05 0 04% 0 88% 7 50% 8 41% 0 0036% 23 THERMO FISHER SCIENTIFIC INC TMO 59,939 80 0 34% 0 40% 10 50% 10 92% 0 0371% 24 TRIPADVISOR INC TRIP 9,063 95 0 05% 0 00% 16 50% 16 50% 0 0085% 25 T ROWE PRICE GROUP INC TROW 16,319 13 0 09% 3 38% 7 50% 11 01% 0 0102% 26 TRAVELERS COS INC/THE TRV 33,171 80 0 19% 2 33% 1 50% 3 85% 0 0072% 27 TRACTOR SUPPLY COMPANY TSCO 9,008 91 0 05% 1 43% 12 00% 13 52% 0 0069% 28 TYSON FOODS INC-CL A TSN 26,467 93 0 15% 0 94% 12 50% 13 50% 0 0202% 29 TESORO CORP TSO '9,712 19 0 06% 2 69% 8 50% 11 30% 0 0062% 30 TOTAL SYSTEM SERVICES INC TSS 8,597 54 0 05% 0 86% 12 00% 12 91% 0.0063% 31 TIME WARNER INC TWX 61,932 00 0 35% 2 03% 11 50% 13 65% 0 0479% 32 TEXAS INSTRUMENTS INC TXN 67,996 90 0 39% 2 24% 8 00% 10 33% 0 0398% 33 TEXTRON INC T)(T 10,221 60 0 06% 0 21% 15 50% 15 73% 0 0091% 34 UNDER ARMOUR INC-CLASS A UA 16,695 85 0 09% 0 00% 24 50% 24 50% 0 0232% 35 UNITED CONTINENTAL HOLDINGS UAL 17,338 22 0 10% 0 00% 5 50% 5 50% 0 0054% 36 UDR INC UDR N/A 3 89% N/A N/A N/A 37 UNIVERSAL HEALTH SERVICES-B UHS 12,140 24 0 07% 0 32% 11 50% 11 84% 0 0081% 38 ULTA SALON COSMETICS & FRAGR ULTA 16,607 67 0 09% 0 00% 19 00% 19 00% 0 0179% 39 UNITEDHEALTH GROUP INC UNH 127,614 70 0 72% 1 86% 14 00% 15 99% 0 1156% 40 UNUM GROUP UNM 8,472 15 0 05% 2 22% 10 50% 12 84% 0 0062% 41 UNION PACIFIC CORP UNP 80,687 94 0 46% 2 27% 7 00% 9 35% 0 0428% 42 UNITED PARCEL SERVICE-CL B UPS 95,195 70 0 54% 3 02% 9 50% 12 66% 0 0683% 43 URBAN OUTFITTERS INC URBN 4,117 37 0 02% 0 00% 13 50% 13 50% 0 0032% 44 UNITED RENTALS INC URI 6,782 76 0 04% 0 00% 12 50% 12 50% 0 0048% 45 US BANCORP USB 73,699 99 0 42% 2 61% 4 50% 7 17% 0 0299% 46 UNITED TECHNOLOGIES CORP UTX 83,567 16 0 47% 2 64% 7 00% 9 73% 0 0461% 47 VISA INC-CLASS A SHARES V 176,266 10 1 00% 0 76% 11 00% 11 80% 0 1179% 48 VARIAN MEDICAL SYSTEMS INC VAR 9,079 78 0 05% 0 00% 7 50% 7 50% 0 0039% 49 VF CORP VFC 22,699 04 0 13% 2 71% 10 00% 12 85% 0 0165% 50 VIACOM INC-CLASS B VIAB 14,213 38 0 08% 2 23% '5 00% 7 29% 0 0059% 51 VALERO ENERGY CORP VLO 24,895 18 0 14% 4 46% 5 50% 10 08% 0 0142% 52 VULCAN MATERIALS CO VMC 14,469 35 0 08% 0 74% 33 50% 34 36% 0 0282% 53 VORNADO REALTY TRUST VNO 18,061 21 0 10% 2 75% 22 50% 25 56% 0 0262% 54 VERISK ANALYTICS INC VRSK 13,389 54 0 08% 0 00% 11 00% 11 00% 0 0083% 55 VERISIGN INC VRSN 8,061 01 0 05% 0 00% 12 00% 12 00% 0 0055% 56 VERTEX PHARMACEUTICALS INC VRTX 19,955 03 N/A 0 00% N/A N/A N/A 57 VENTAS INC VTR N/A 4 47% N/A N/A N/A 58 VERIZON COMMUNICATIONS INC VZ 204,997 20 1 16% 4 59% 3 00% 7 66% 0 0890% 59 WATERS CORP WAT 12,468 74 0 07% 0 00% 7 00% 7 00% 0 0049% 60 WALGREENS BOOTS ALLIANCE INC WBA 84,596 91 0 48% 1 92% 13 00% 15 04% 0 0721% 61 WESTERN DIGITAL CORP WDC . 15,699 52 0 09% 3 62% 1 50% 5 15% 0 0046% 62 WEC ENERGY GROUP INC WEC 18,362 77 0 10% 3 54% 6 00% 9 65% 0 0100% 63 WELLS FARGO & CO WFC 225,920 10 1 28% 3 44% 5 00% 8 53% 0 1092% 64 WHOLE FOODS MARKET INC WFM 9,133 62 0 05% 2 02% 6 50% 8 59% 0 0044% 65 WHIRLPOOL CORP WHR 12,058 50 0 07% 2 49% 10 50% 13 12% 0 0090% 66 WILLIS TOWERS WATSON PLC WLTW N/A N/A 0 00% N/A N/A N/A
784

[4] [5] [6] [7] [8]
PUC Docket No. 46449 EXHIBIT RBH-3
Page 14 of 14
191 Market Estimated Long-Term Weighted
2 Company Ticker Capitaleabon Weight in Index Dryidend Yield Growth Est DCF Result DCF Result 3
67 WASTE MANAGEMENT INC WM 27,255 48 0 15% 2 72% 8 50% 11 34% 0 0175% 68 WILLIAMS COS INC WMB 21,900 00 0 12% 2 74% 16 50% 19 47% 0 0242% 69 WAL-MART STORES INC WMT 211,308 30 1 20% 2 93% 2 00% 4 96% 0 0594% 70 WESTROCK CO WRK 11,330 08 N/A 3 33% N/A N/A N/A 71 WESTERN UNION CO WU 9,720 96 0 06% 3 21% 8 00% 11 34% 0 0062% 72 WEYERHAEUSER CO WY 22,869 91 0 13% 3 97% 8 50% 12 64% 0 0164% 73 WYNDHAM WORLDWIDE CORP WYN 7,378 56 0 04% 2 98% 5 50% 8 56% 0 0036% 74 WYNN RESORTS LTD WYNN 9,665 06 0 05% 2 11% 6 50% 8 68% 0 0048% 75 CIMAREX ENERGY CO XEC 13,207 94 0 07% 0 23% 16 50% 16 75% 0 0125% 76 XCEL ENERGY INC XEL 20,490 82 0 12% 3 47% 5 50% 9 07% 0 0105% 77 XL GROUP LTD XL 10,071 44 0 06% 2 34% 9 00% 11 45% 0 0065% 78 XILINX INC XLNX 12,648 75 0 07% 2 65% 6 00% 8 73% 0 0063% 79 EXXON MOBIL CORP XOM 358,964 30 2 03% 3 49% 5 00% 8 58% 0 1745% 80 DENTSPLY SIRONA INC XRAY 13,472 06 0 08% 0 54% 8 00% 8 56% 0 0065% 81 XEROX CORP XRX 9,677 05 0 05% 3 25% 4 50% 7 82% 0 0043% 82 XYLEM INC XYL 8,899 07 0 05% 1 25% 9 50% 10 81% 0 0055% 83 YAHOO! INC YHOO 39,570 26 N/A 0 00% N/A N/A N/A 84 YUMI BRANDS INC YUM 33,603 12 0 19% 2.28% 10 00% 12 39% 0 0236% 85 ZIMMER BIOMET HOLDINGS INC ZBH 25,343 93 0 14% 0 79% 15 00% 15 85% 0 0228% 1 ZIONS BANCORPORATION ZION 6,226 96 0 04% 1 09% 11 00% 12 15% 0 0043% 2 ZOETIS INC ZTS 25,274 80 0 14% 0 75% 11 00% 11 79% 0 0169% 3 17,645,470 11 14 14% 4 Notes 5 [1] Equals sum of Col [9] 6 [2] Source Bloomberg Professional 7 [3] Equals [1] - [2] 8 [4] Source Value Line 9 [5] Equals weight in S&P 500 based on market capitalization
10 [6] Source Value Line 11 [7] Source Value Line 12 [8] Equals ([6] x (1 + (0 5 x [7]))) + [7] 13 [9] Equals Col [5] x Col [8]
785

1
2 3
Bloomberg and Value Line Beta Coefficients
[1]
PUC Docket No. 46449 EXHIBIT RBH-4
[2] Company Ticker Bloomberg Value Line
4 ALLETE, Inc. ALE 0.667 0.750
5 Alliant Energy Corporation LNT 0.625 0 750
6 Ameren Corporation AEE 0 639 0.700
7 Avista Corporation AVA 0 636 0 750
8 CMS Energy Corporation CMS 0 555 0.650
9 DTE Energy Company DTE 0.622 0.700
10 IDACORP, Inc. IDA 0 732 0 750
11 NorthWestem Corporation NWE 0.622 0.700
12 OGE Energy Corp OGE 0.693 0 900
13 Otter Tail Corporation OTTR 0.747 0.850
14 Pinnacle West Capital Corporation PNW 0 626 0 700
15 PNM Resources, Inc PNM 0.648 0.800
16 Portland General Electric Company POR 0 632 0 750
17 SCANA Corporation SCG 0.620 0.700
18 Wisconsin Energy Corporation WEC 0 552 0.650
19 Xcel Energy Inc XEL 0.507 0.650
20 Mean 0.633 0 734
21 Notes 22 [1] Source. Bloomberg Professional 23 [2] Source Value Line
786

U-r-- 0
oE
co 2
a) a) a) co a). caw ') < 0
(v) CT)
C* CO (0 I's I's
i() • c- c) 6
(v) (v) V) CO CO 6 6
ca CV • CO
2 To
,?)c) CO 0) CV CC) 6 6 N—
c• i‘•3 CO (0 N- • N—N•
• tr ) 10 10
ci V"' N—
co
o
o o C;
To
CO
LO
co
•••••••
v-
o o = o o .2 x x .6;
C \ 1g
175. 0 0 CO
a) + + E •-• o o o o
0 C.) (/) To To 2 o- o
So
urc
e: E
xhib
it R
BH
- 3
Sour
ce: E
xh
ibit
RB
H-3
PUC Docket No. 46449 EXHIBIT RBH-5
CV co cr in CO CO •-• (N (v)
0) 1-0 C.1) CO CO CD C \I C \ C \ I CV
787
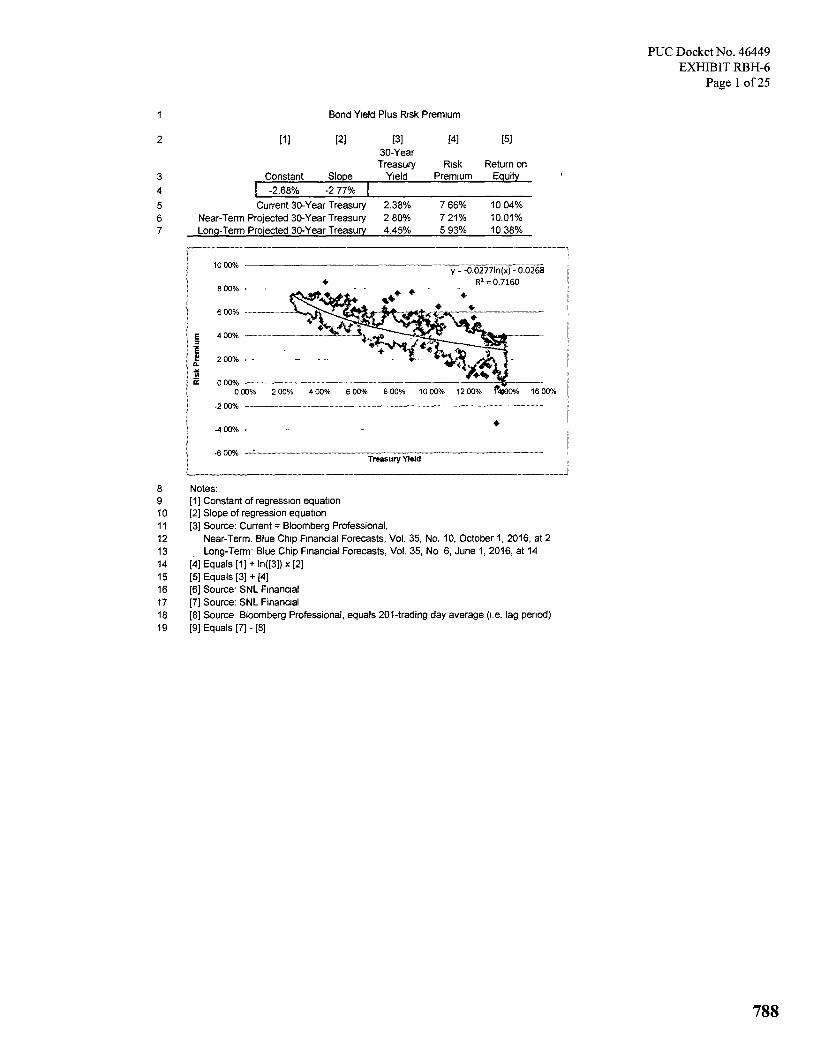
y = -0.0277In(x) - 0.0268 82 = 0.7160
0 00% 0 CO% 2 00% 4 00% 6 00% 8 00% 10 00% 12 00% WO% 16 00%
Ris
k P
rem
ium
10 00%
8 00%
6 00%
4 00%
2 00% -
Treasury Yield
PUC Docket No. 46449 EXHIBIT RBH-6
Page 1 of 25
Bond Yield Plus Risk Premium
2 [1] [2] [3] [4] [5] 30-Year Treasury Risk Return on
3 Constant Slope Yield Premium Equity 4 -2.68% -2 77%
5 Current 30-Year Treasury 2.38% 7 66% 10 04% 6 Near-Term Projected 30-Year Treasury 2 80% 7 21% 10.01% 7 Long-Term Projected 30-Year Treasury 4.45% 5 93% 10.38%
8 Notes: 9 [1] Constant of regression equation 10 [2] Slope of regression equation 11 [3] Source: Current = Bloomberg Professional, 12 Near-Term. Blue Chip Financial Forecasts, Vol. 35, No. 10, October 1, 2016, at 2 13 Long-Term' Blue Chip Financial Forecasts, Vol. 35, No 6, June 1, 2016, at 14 14 [4] Equals [1] + ln([3]) x [2] 15 [5] Equals [3] + [4] 16 [6] Source. SNL Financial 17 [7] Source: SNL Financial 18 [8] Source Bloomberg Professional, equals 201-trading day average (i.e. lag period) 19 [9] Equals [7] - [8]
788

PUC Docket No. 46449 EXHIBIT RBH-6
Page 2 of 25
1 2
3
Bond Yield Plus Risk Premium [6] [8] [9]
Date of 30-Year Electric Retum on Treasury Risk
Rate Case Equity Yield Premium 4 1/1/1980 14.50% 9 36% 5 14% 5 1/7/1980 14 39% 9.38% 5 01% 6 1/9/1980 15.00% 9 40% 5 60% 7 1/14/1980 15 17% 9 42% 5.75% 8 1/17/1980 13 93% 9 44% 4.49% 9 1/23/1980 15 50% 9.47% 6.03% 10 1/30/1980 13 86% 9.52% 4 34% 11 1/31/1980 12 61% 9 53% 3.08% 12 2/6/1980 13 71% 9.58% 4 13% 13 2/13/1980 12 80% 9 63% 3 17% 14 2/14/1980 13 00% 9.65% 3 35% 15 2/19/1980 13.50% 9 68% 3.82% 16 2/27/1980 13 75% 9.78% 3.97% 17 2/29/1980 13 75% 9 81% 3 94% 18 2/29/1980 14 00% 9 81% 4 19% 19 2/29/1980 14.77% 9.81% 4 96% 20 3/7/1980 12 70% 9.89% 2 81% 21 3/14/1980 13 50% 9 97% 3.53% 22 3/26/1980 14 16% 10 10% 4.06% 23 3/27/1980 14.24% 10 12% 4 12% 24 3/28/1980 14 50% 10. 13% 4.37% 25 4/11/1980 12 75% 10.27% 2 48% 26 4/14/1980 13 85% 10.29% 3.56% 27 4/16/1980 15 50% 10 31% 5.19% 28 4/22/1980 13.25% 10.35% 2 90% 29 4/22/1980 13 90% 10 35% 3 55% 30 4/24/1980 16.80% 10.38% 6.43% 31 4/29/1980 15 50% 10.41% 5 09% 32 5/6/1980 13.70% 10.45% 3 25% 33 5/7/1980 15 00% 10 45% 4 55% 34 5/8/1980 13.75% 10.46% 3.29% 35 5/9/1980 14.35% 10 47% 3.88% 36 5/13/1980 13 60% 10 48% 3 12% t. 37 5/15/1980 13.25% 10 49% 2.76% 38 5/19/1980 13 75% 10 51% 3.24% 39 5/27/1980 13.62% 10.54% 3.08% 40 5/27/1980 14 60% 10 54% 4.06% 41 5/29/1980 16.00% 10.56% 5.44% 42 5/30/1980 13.80% 10 56% 3 24% 43 6/2/1980 15.63% 10 57% 5 06% 44 6/9/1980 15 90% 10 60% 5 30% 45 6/10/1980 13 78% 10.60% 3 18% 46 6/12/1980 14 25% 10 61% 3.64% 47 6/19/1980 13.40% 10 62% 2 78% 48 6/30/1980 13.00% 10 65% 2.35% 49 6/30/1980 13.40% 10 65% 2 75% 50 7/9/1980 14 75% 10.67% 4.08% 51 7/10/1980 15 00% 1 0 68% 4.32% 52 7/15/1980 15.80% 10.70% 5.10% 53 7/18/1980 13 80% 10 71% 3 09% 54 7/22/1980 14 10% 10.72% 3 38% 55 7/24/1980 15 00% 10 73% 4.27% 56 7/25/1980 13 48% 10 73% 2 75% 57 7/31/1980 14 58% 10 75% 3.83% 58 8/8/1980 13 50% 10.78% 2 72% 59 8/8/1980 14.00% 10.78% 3.22% 60 8/8/1980 15.45% 10 78% 4 67% 61 8/11/1980 14.85% 10.78% 4 07% 62 8/14/1980 14 00% 10 79% 3.21% 63 8/14/1980 16 25% 10.79% 5 46% 64 8/25/1980 13 75% 10 82% 2.93% 65 8/27/1980 13 80% 10.83% 2 97% 66 8/29/1980 12 50% 10 84% 1.66%
789

PUC Docket No. 46449 EXHIBIT RBH-6
Page 3 of 25 1 2
3
Bond Yield Plus Risk Premium [6] [7] [8] [9]
Date of 30-Year Electric Return on Treasury Risk
Rate Case Equity Yield Premium 67 9/15/1980 13.50% 10.88% 2 62% 68 9/15/1980 13.93% 10 88% 3 05% 69 9/15/1980 15.80% 10.88% 4.92% 70 9/24/1980 12.50% 10 93% 1 57% 71 9/24/1980 15 00% 10.93% 4 07% 72 9/26/1980 13.75% 10 94% 2 81% 73 9/30/1980 14 10% 10 96% 3 14% 74 9/30/1980 14.20% 10 96% 3.24% 75 10/1/1980 13 90% 10 97% 2 93% 76 10/3/1980 15 50% 10 98% 4.52% 77 10/7/1980 12 50% 10 99% 1 51% 78 10/9/1980 13.25% 11 00% 2.25% 79 10/9/1980 14 50% 11.00% 3 50% 80 10/9/1980 14 50% 11 00% 3 50% 81 10/16/1980 16 10% 11.02% 5 08% 82 10/17/1980 14 50% 11 03% 3.47% 83 10/31/1980 13 75% 11.11% 2.64% 84 10/31/1980 14.25% 11 11% 3 14% 85 11/4/1980 15 00% 11.12% 3.88% 86 11/5/1980 13 75% 11 12% 2 63% 87 11/5/1980 14 00% 11 12% 2.88% 88 11/8/1980 13 75% 11.14% 2 61% 89 11/10/1980 14 85% 11 15% 3 70% 90 11/17/1980 14 00% 11 18% 2.82% 91 11/18/1980 14.00% 11.19% 2 81% 92 11/19/1980 13.00% 11 19% 1.81% 93 11/24/1980 14.00% 11.21% 2.79% 94 11/26/1980 14 00% 11.21% 2.79% 95 12/8/1980 14.15% 11 22% 2 93% 96 12/8/1980 15. 10% 11.22% 3.88% 97 12/9/1980 15 35% 11.22% 4 13% 98 12/12/1980 15 45% 11.23% 4.22% 99 12/17/1980 13.25% 11.23% 2.02% 100 12/18/1980 15.80% 11 23% 4.57% 101 12/19/1980 14.50% 11.23% 3.27% 102 12/19/1980 14 64% 11 23% 3 41% 103 12/22/1980 13 45% 11.23% 2.22% 104 12/22/1980 15 00% 11:23% 3 77% 105 12/30/1980 14 50% 11 22% 3 28% 106 12/30/1980 14 95% 11 22% 3 73% 107 12/31/1980 13.39% 11.22% 2 17% 108 1/2/1981 15 25% 11 22% 4 03% 109 1/7/1981 14.30% 11.21% 3 09% 110 1/19/1981 15 25% 11 20% 4.05% 111 1/23/1981 13.10% 11.20% 1.90% 112 1/23/1981 14 40% 11 20% 3.20% 113 1/26/1981 15 25% 11 20% 4.05% 114 1/27/1981 15.00% . 11 21% 3.79% 115 1/31/1981 13.47% 11.22% 2 25% 116 2/3/1981 15.25% 11.23% 4 02% 117 2/5/1981 15 75% 11 25% 4 50% 118 2/11/1981 15.60% 11.28% 4 32% 119 : 2/20/1981 15 25% 11 33% 3.92% 120 3/11/1981 15 40% 11 49% 3 91% 121 3/12/1981 14 51% 11 50% 3.01% 122 3/12/1981 16 00% 11 50% 4 50% 123 3/13/1981 13 02% 11 52% 1 50% 124 3/18/1981 16 19% 11.55% 4 64% 125 3/19/1981 13.75% 11.56% 2 19% 126 3/23/1981 14 30% 11 58% 2 72% 127 3/25/1981 15 30% 11 60% 3.70% 128 4/1/1981 14.53% 11.68% 2 85% 129 4/3/1981 19 10% 11 71% 7 39%
790

PUC Docket No. 46449 EXHIBIT RBH-6
Page 4 of 25 1 2
3
Bond Yield Plus Risk Premium [6] [7] [8] [9]
Date of 30-Year Electric Return on Treasury Risk
Rate Case Equity Yield Prem i um 130 4/9/1981 15.00% 11 78% 3.22% 131 4/9/1981 15.30% 11 78% 3.52% 132 4/9/1981 16.50% 11 78% 4 72% 133 4/9/1981 17.00% 11.78% 5 22% 134 4/10/1981 13.75% 11 80% 1.95% 135 4/13/1981 13.57% 11 82% 1.75% 136 4/15/1981 15.30% 11.85% 3 45% 137 4/16/1981 13.50% 11.87% 1 63% 138 4/17/1981 14.10% 11 87% 2.23% 139 4/21/1981 14 00% 11 90% 2.10% 140 4/21/1981 16 80% 11.90% 4 90% 141 4/24/1981 16 00% 11.95% 4 05% 142 4/27/1981 12.50% 11 97% 0.53% 143 4/27/1981 13 61% 11 97% 1 64% 144 4/29/1981 13 65% 12.00% 1 65% 145 4/30/1981 13.50% 12 02% 1.48% 146 5/4/1981 16.22% 12 05% 4 17% 147 5/5/1981 14 40% 12.07% 2 33% 148 5/7/1981 16 25% 12.11% 4 14% 149 5/7/1981 16.27% 12 11% 4 16% 150 5/8/1981 13 00% 12 13% 0 87% 151 5/8/1981 16.00% 12.13% 3 87% 152 5/12/1981 13 50% 12.16% 1.34% 153 5/15/1981 15.75% 12.22% 3.53% 154 5/18/1981 14.88% 12 23% 2.65% 155 5/20/1981 16 00% 12 26% 3.74% 156 5/21/1981 14.00% 12.27% 1 73% 157 5/26/1981 14.90% 12 30% 2.60% 158 5/27/1981 15 00% 12 31% 2.69% 159 5/29/1981 15 50% 12.34% 3 16% 160 6/1/1981 16 50% 12.35% 4 15% 161 6/3/1981 14.67% 12 37% 2.30% 162 6/5/1981 13.00% 12 39% 0 61% 163 6/10/1981 16.75% 12.42% 4 33% 164 6/17/1981 14.40% 12.46% 1 94% 165 6/18/1981 16.33% 12 47% 3.86% 166 6/25/1981 14 75% 12 51% 2.24% 167 6/26/1981 16 00% 12.52% 3 48% 168 6/30/1981 15 25% 12.54% 2 71% 169 7/1/1981 15.50% 12 56% 2.94% 170 7/1/1981 17 50% 12 56% 4 94% 171 7/10/1981 16 00% 12 62% 3.38% 172 7/14/1981 16 90% 12.64% 4.26% 173 7/15/1981 16.00% 12 65% 3.35% 174 7/17/1981 15 00% 12.67% 2 33% 175 7/20/1981 15 00% 12.68% 2 32% 176 7/21/1981 14.00% 12 69% 1 31% 177 7/28/1981 13 48% 12 74% 0.74% 178 7/31/1981 13 50% 12 78% 0.72% 179 7/31/1981 15 00% 12.78% 2 22% 180 7/31/1981 16.00% 12.78% 3 22% 181 8/5/1981 15.71% 12.83% 2.88% 182 8/10/1981 14 50% 12 87% 1.63% 183 8/11/1981 15 00% 12 88% 2.12% 184 8/20/1981 13 50% 12.95% 0 55% 185 8/20/1981 16.50% 12 95% 3 55% 186 8/24/1981 15.00% 12 97% 2.03% 187 8/28/1981 15 00% 13 01% 1 99% 188 9/3/1981 14 50% 13 05% 1 45% 189 9/10/1981 14.50% 13. 11% 1 39% 190 9/11/1981 16.00% 13 12% 2.88% 191 9/16/1981 16 00% 13 15% 2 85% 192 9/17/1981 16.50% 13 16% 3 34%
791

PUC Docket No. 46449 EXHIBIT RBH-6
Page 5 of 25 1 2
3
Bond Yield Plus Risk Premium [6] [7] [8] [9]
Date of 30-Year Electric Return on Treasury Risk
Rate Case Equity Yield Prem i um 193 9/23/1981 15 85% 13.20% 2 65% 194 9/28/1981 15.50% 13 23% 2 27% 195 10/9/1981 15 75% 13 33% 2 42% 196 10/15/1981 16.25% 13 37% 2 88% 197 10/16/1981 15.50% 13.38% 2.12% 198 10/16/1981 16 50% 13 38% 3 12% 199 10/19/1981 14.25% 13 39% 0 86% 200 10/20/1981 15.25% 13 41% 1.84% 201 10/20/1981 17 00% 13 41% 3.59% 202 10/23/1981 16.00% 13.45% 2.55% 203 10/27/1981 10 00% 13 48% -3 48% 204 10/29/1981 14 75% 13.51% 1.24% 205 10/29/1981 16 50% 13 51% 2 99% 206 11/3/1981 15.17% 13 53% 1 64% 207 11/5/1981 16 60% 13 55% 3 05% 208 11/6/1981 15.17% 13.56% 1.61% 209 11/24/1981 15 50% 13 61% 1 89% 210 11/25/1981 15.25% 13 61% 1.64% 211 11/25/1981 15 35% 13.61% 1.74% 212 11/25/1981 16.10% 13 61% 2 49% 213 11/25/1981 16 10% 13 61% 2 49% 214 12/1/1981 15.70% 13.61% 2.09% 215 12/1/1981 16 00% 13.61% 2 39% 216 12/1/1981 16 49% 13 61% 2.88% 217 12/1/1981 16 50% 13.61% 2 89% 218 12/4/1981 16 00% 13 61% 2.39% 219 12/11/1981 16.25% 13.63% 2.62% 220 12/14/1981 14.00% 13 63% 0 37% 221 12/15/1981 15 81% 13.63% 2.18% 222 12/15/1981 16 00% 13.63% 2 37% 223 12/16/1981 15.25% 13 63% 1 62% 224 12/17/1981 16 50% 13 63% 2 87% 225 12/18/1981 15.45% 13.63% 1 82% 226 12/30/1981 14 25% 13.67% 0.58% 227 12/30/1981 16 00% 13 67% 2 33% 228 12/30/1981 16.25% 13.67% 2.58% 229 12/31/1981 16.15% 13.67% 2.48% 230 1/4/1982 15.50% 13 67% 1.83% 231 1/11/1982 14 50% 13 72% 0 78% 232 1/11/1982 17.00% 13.72% 3 28% 233 1/13/1982 14 75% 13 74% 1 01% 234 1/14/1982 15.75% 13 75% 2 00% 235 1/15/1982 15 00% 13 76% 1 24% 236 1/15/1982 16 50% 13 76% 2 74% 237 1/22/1982 16 25% 13 79% 2.46% 238 1/27/1982 16 84% 13 81% 3 03% 239 1/28/1982 1;1.00% 13.81% -0.81% 240 1/29/1982 15 50% 13 82% 1 68% 241 2/1/1982 15 85% 13 82% 2.03% 242 2/3/1982 16 44% 13 84% 2 60% 243 2/8/1982 15.50% 13.86% 1.64% 244 2/11/1982 16 00% 13 88% 2 12% 245 2/11/1982 16.20% 13.88% 2.32% 246 2/17/1982 15 00% 13 89% 1 11% 247 2/19/1982 15.17% 13 89% 1 28% 248 2/26/1982 15.25% 13 89% 1.36% 249 3/1/1982 15.03% 13.89% 1 14% 250 3/1/1982 16.00% 13 89% 2 11% 251 3/3/1982 15 00% 13 88% 1 12% 252 3/8/1982 17 10% 13 88% 3.22% 253 3/12/1982 16.25% 13.88% 2 37% 254 3/17/1982 17 30% 13.88% 3.42% 255 3/22/1982 15 10% 13 89% 1 21%
792

PUC Docket No. 46449 EXHIBIT RBH-6
Page 6 of 25 1 2
3
Bond Yield Plus Risk Premium [6] [7] [9] [9]
Date of 30-Year Electric Retum on Treasury Risk
Rate Case Equity Yield Premium 256 3/27/1982 15.40% 13 89% 1 51% 257 3/30/1982 15.50% 13.90% 1.60% 258 3/31/1982 17.00% 13 91% 3 09% 259 4/1/1982 14 70% 13.91% 0 79% 260 4/1/1982 16.50% 13 91% 2.59% 261 4/2/1982 15 50% 13.91% 1 59% 262 4/5/1982 15.50% 13 92% 1.58% 263 '4/8/1982 16 40% 13.93% 2 47% 264 4/13/1982 14.50% 13 94% 0.56% 265 4/23/1982 15.75% 13.94% 1 81% 266 4/27/1982 15.00% 13 94% 1.06% 267 4/28/1982 15 75% 13.94% 1 81% 268 4/30/1982 14 70% 13 94% 0.76% 269 4/30/1982 15 50% 13 94% 1 56% 270 5/3/1982 16 60% 13 94% 2.66% 271 5/4/1982 16 00% 13.94% 2.06% 272 5/14/1982 15.50% 13 92% 1.58% 273 5/18/1982 15 42% 13.92% 1.50% 274 5/19/1982 14 69% 13 92% 0 77% 275 5/20/1982 15 00% 13.91% 1 09% 276 5/20/1982 15 10% 13 91% 1.19% 277 5/20/1982 15 50% 13 91% 1 59% 278 5/20/1982 16 30% 13:91% 2 39% 279 5/21/1982 17.75% 13 91% 3 84% 280 5/27/1982 15 00% 13.89% 1.11% 281 5/28/1982 15.50% 13 89% 1 61% 282 5/28/1982 17 00% 13.89% 3 11% 283 6/1/1982 13.75% 13 89% -0.14% 284 6/1/1982 16 60% 13.89% 2.71% 285 6/9/1982 17.86% 13 88% 3.98% 286 6/14/1982 15 75% 13.88% 1 87% 287 6/15/1982 14.85% 13 88% 0.97% 288 6/18/1982 15.50% 13.87% 1 63% 289 6/21/1982 14 90% 13 87% 1.03% 290 6/23/1982 16 00% 13.86% 2.14% 291 6/23/1982 16 17% 13 86% 2131% 292 6/24/1982 14 85% 13 86% 0 99% 293 6/25/1982 14 70% 13.86% 0.84% 294 7/1/1982 16.00% 13 84% 2 16% 295 7/2/1982 15 62% 13.84% 1.78% 296 7/2/1982 17.00% 13 84% 3 16% 297 7/13/1982 14.00% 13.82% 0.18% 298 7/13/1982 16.80% 13 82% 2 98% 299 7/14/1982 15 76% 13.82% 1.94% 300 7/14/1982 16.02% 13 82% 2.20% 301 7/19/1982 16 50% 13.80% 2 70% 302 7/22/1982 14.50% 13 77% 0 73% 303 7/22/1982 17 00% 13.77% 3 23% 304 7/27/1982 16.75% 13.75% 3.00% 305 7/29/1982 16 50% 13.74% 2.76% 306 8/11/1982 17 50% 13 68% 3.82% 307 8/18/1982 17 07% 13 63% 3 44% 308 8/20/1982 15 73% 13 60% 2 13% 309 8/25/1982 16.00% 13 57% 2.43% 310 8/26/1982 15 50% 13.56% 1 94% 311 8/30/1982 15.00% 13 55% 1 45% 312 9/3/1982 16 20% 13.53% 2 67% 313 9/8/1982 15.00% 13 52% 1.48% 314 9/15/1982 13 08% 13.50% -0 42% 315 9/15/1982 16 25% 13 50% 2 75% 316 9/16/1982 16 00% 13.50% 2 50% 317 9/17/1982 15 25% 13 50% 1.75% 318 9/23/1982 17.17% 13.47% 3 70%
793

PUC Dock.et No. 46449 EXHIBIT RBH-6
Page 7 of 25 1 2
3
Bond Yield Plus Risk Premium [6] - [7] [8] [9]
Date of 30-Year Electric Return on Treasury Risk
Rate Case Equity Yield Premium 319 9/24/1982 14 50% 13 46% 1.04% 320 9/27/1982 15 25% 13.46% 1 79% 321 10/1/1982 15 50% 13.42% 2.08% 322 10/15/1982 15.90% - 13.32% 2 58% 323 10/22/1982 15.75% 13 24% 2.51% 324 10/22/1982 17 15% 13.24% 3.91% 325 10/29/1982 15.54% 13 16% 2 38% 326 11/1/1982 15 50% 13.15% 2 35% 327 11/3/1982 17.20% 13 13% 4 07% 328 11/4/1982 16.25% 13.11% 3.14% 329 11/5/1982 16.20% 13 09% 3 11% 330 1/9/1982 16 00% 13 05% 2 95% 331 11/23/1982 15.50% 12 89% 2 61% 332 11/23/1982 15 85% 12 89% 2.96% 333 11/30/1982 16.50% 12 81% 3 69% 334 12/1/1982 17 04%' 12 79% 4 25% 335 12/6/1982 15.00% 12.73% 2. 27%_ 336 12/6/1982 - 16 35% 12 73% 3 62% 337 12/10/1982 15.50% 12 66% 2 84% 338 12/13/1982 16 00% 12 65% 3 35% 339 12/14/1982 15 30% 12.63% 2 67% 340 12/14/1982 16 40% 12 63% 3 77% 341 12/20/1982 16 00% 12 57% 3 43% 342 12/21/1982 14 75% 12 56% 2 19% 343 12/21/1982 15 85% 12.56% 3.29% 344 12/22/1982 16 25% 12 54% 3.71% 345 12/22/1982 16.58% 12.54% 4 04% 346 12/22/1982 16.75% 12 54% 4.21% 347 12/29/1982 14 90% 12 48% 2.42% 348 12/29/1982 16.25% 12 48% 3 77% 349 12/30/1982 16 00% 12 47% 3 53% 350 12/30/1982 16.35% 12 47% 3.88% 351 12/30/1982 16 77% 12 47% 4 30% 352 1/5/1983 17.33% 12 40% 4.93% 353 1/11/1983 15 90% 12.34% 3 56% 354 1/12/1983 14.63% 12 33% 2.30% 355 1/12/1983 15.50% 12.33% 3.17% 356 1/20/1983 17.75% 12 24% 5.51% 357 1/21/1983 15 00% 12.22% 2 78% 358 1/24/1983 14.50% 12 21% 2.29% 359 1/24/1983 15.50% 12.21% 3 29% 360 1/25/1983 15.85% 12 19% 3.66% 361 1/27/1983 16 14% 12.17% 3.97% 362 2/1/1983 18.50% 12. 13% 6.37% 363 2/4/1983 14 00% 12 10% 1 90% 364 2/10/1983 15.00% 12 06% 2.94% 365 2/21/1983 15 50% 11 98% 3 52% 366 2/22/1983 15.50% 11.97% 3.53% 367 2/23/1983 15 10% 11.96% 3 14% 368 2/23/1983 16.00% 11.96% 4.04% 369 3/2/1983 15.25% 11 89% 3 36% 370 3/9/1983 15.20% 11 82% 3.38% 371 3/15/1983 13.00% 11.77% 1 23% 372 3/18/1983 15.25% 11 73% 3.52% 373 3/23/1983 15 40% 11 69% 3 71% 374 3/24/1983 15 00% 11.67% 3.33% 375 3/29/1983 15.50% 11.63% 3 87% 376 3/30/1983 16 71% 11 61% 5 10% 377 3/31/1983 15.00% 11.59% 3 41% 378 4/4/1983 15 20% 11 58% 3 62% 379 4/8/1983 15 50% 11.51% 3 99% 380 4/11/1983 14.81% 11.49% 3.32% 381 4/19/1983 14.50% 11.38% 3 12%
794

PUC Docket No. 46449 EXHIBIT RBH-6
Page 8 of 25 1 2
3
Bond Yield Plus Risk Premium [6] E71 [8] [9]
Date of 30-Year Electric Return on Treasury Risk
Rate Case Equity Yield Premium 382 4/20/1983 16.00% 11.36% 4 64% 383 4/29/1983 16.00% 11.24% 4 76% 384 5/1/1983 14.50% 11 24% 3 26% 385 5/9/1983 15 50% 11.15% 4.35% 386 5/11/1983 16.46% 11. 12% 5.34% 387 5/12/1983 14 14% 11 11% 3.03% 388 5/18/1983 15 00% 11.05% 3 95% 389 5/23/1983 14 90% 11 01% 3.89% 390 5/23/1983 15 50% 11 01% 4.49% 391 5/25/1983 15. 50% 10 98% 4.52% 392 5/27/1983 15 00% 10.96% 4 04% 393 5/31/1983 14.00% 10.95% 3.05% 394 5/31/1983 15 50% 10.95% 4 55% 395 6/2/1983 14.50% 10 93% 3.57% 396 6/17/1983 15 03% 10.84% 4.19% 397 7/1/1983 14 80% 10.78% 4.02% 398 7/1/1983 14 90% 10.78% 4 12% 399 7/8/1983 16 25% 10.76% 5 49% 400 7/13/1983 13.20% 10 75% 2 45% 401 7/19/1983 15 00% 10 74% 4 26% 402 7/19/1983 15.10% 10.74% 4.36% 403 7/25/1983 16.25% 10.73% 5 52% 404 7/28/1983 15.90% 10 74% 5.16% 405 8/3/1983 416 34% 10.75% 5 59% 406 8/3/1983 16.50% 10.75% 5 75% 407 8/19/1983 15 00% 10.80% 4.20% 408 8/22/1983 15 50% 10 80% 4.70% 409 8/22/1983 16.40% 10.80% 5 60% 410 8/31/1983 14 75% 10 84% 3 91% 411 9/7/1983 15 00% 10.86% 4 14% 412 9/14/1983 15.78% 10.89% 4 89% 413 9/16/1983 15.00% 10.90% 4.10% 414 9/19/1983 14 50% 10.91% 3.59% 415 9/20/1983 16.50% 10 91% 5.59% 416 9/28/1983 14 50% 10.94% 3 56% 417 9/29/1983 15.50% 10.95% 4.55% 418 9/30/1983 15 25% 10.95% 4 30% 419 9/30/1983 16 15% 10 95% 5 20% 420 10/4/1983 14.80% 10 96% 3 84% 421 10/7/1983 16 00% 10.97% 5 03% 422 10/13/1983 15.52% 10 99% 4.53% 423 10/17/1983 15.50% 11 00% 4.50% 424 10/18/1983 14 50% 11 00% 3.50% 425 10/19/1983 16.25% 11.01% 5 24% 426 10/19/1983 16 50% 11.01% 5.49% 427 10/26/1983 15 00% 11.04% 3 96% 428 10/27/1983 15.20% 11.04% 4.16% 429 11/1/1983 16.00% 11 06% 4 94% 430 11/9/1983 14.90% 11 09% 3.81% 431 11/10/1983 14 35% 11.10% 3.25% 432 11/23/1983 16 00% 11. 13% 4 87% 433 11/23/1983 16 15% 11.13% 5.02% 434 11/30/1983 15.00% 11 14% 3 86% 435 12/5/1983 15 25% 11.15% 4 10% 436 12/6/1983 15 07% 11.15% 3.92% 437 12/8/1983 15 90% 11.16% 4 74% 438 12/9/1983 14.75% 11.17% 3.58% 439 12/12/1983 14 50% 11 17% 3 33% 440 12/15/1983 15 56% 11 19% 4.37% 441 12/19/1983 14.80% 11.21% 3 59% 442 12/20/1983 14.69% 11 22% 3 47% 443 12/20/1983 16.00% 11.22% 4 78% 444 12/20/1983 16.25% 11.22% 5 03%
795

PIJC Docket No. 46449 EXHIBIT RBH-6
Page 9 of 25 1 2
3
Bond Yield Plus Risk Premium [6] [7] [8] [9]
Date of 30-Year Electric Return on Treasury Risk
Rate Case Equity Yield Premium 445 12/22/1983 14 75% 11 23% 3.52% 446 12/22/1983 15 75% 11.23% 4.52% 447 1/3/1984 14 75% 11 27% 3.48% 448 1/10/1984 15 90% 11.30% 4.60% 449 1/12/1984 15 60% 11 31% 4.29% 450 1/18/1984 13 75% 11.33% 2 42% 451 1/19/1984 15 90% 11.33% 4 57% 452 1/30/1984 16 10% 11 37% 4 73% 453 1/31/1984 15.25% 11.37% 3.88% 454 2/1/1984 14.80% 11.38% 3.42% 455 2/6/1984 13.75% 11.40% 2 35% 456 2/6/1984 14 75% 11 40% 3 35% 457 2/9/1984 15 25% 11.42% 3 83% 458 2/15/1984 15.70% 11.44% 4 26% 459 2/20/1984 15.00% 11.46% 3.54% 460 2/20/1984 15 00% 11 46% 3.54% 461 2/22/1984 14.75% 11.47% 3.28% 462 2/28/1984 14.50% 11.51% 2 99% 463 3/2/1984 14 25% 11.54% 2 71% 464 3/20/1984 16 00% 11 64% 4 36% 465 3/23/1984 15 50% 11 67% 3 83% 466 3/26/1984 14 71% 11 68% 3 03% 467 4/2/1984 15 50% 11 71% 3 79% 468 4/6/1984 14.74% 11.75% 2 99% 469 4/11/1984 15.72% 11.78% 3 94% 470 4/17/1984 15.00% 11.81% 3 19% 471 4/18/1984 16 20% 11 82% 4 38% 472 4/25/1984 14.64% 11.85% 2.79% 473 4/30/1984 14 40% 11.87% 2 53% 474 5/16/1984 14 69% 11.98% 2.71% 475 5/16/1984 15.00% 11.98% 3 02% 476 5/22/1984 14.40% 12.02% 2.38% 477 5/29/1984 15.10% 12.06% 3 04% 478 6/13/1984 15 25% 12 15% 3 10% 479 6/15/1984 15.60% 12.17% 3 43% 480 6/22/1984 16 25% 12.21% 4 04% 481 6/29/1984 15.25% 12.26% 2 99% 482 7/2/1984 13.35% 12 27% 1 08%, 483 7/10/1984 16.00% 12.31% 3.69% 484 7/12/1984 16.50% 12 32% 4 18% 485 7/13/1984 16.25% 12.33% 3.92% 486 7/17/1984 14.14% 12.35% 1 79% 487 7/18/1984 15.30% 12 36% 2.94% 488 7/18/1984 15.50% 12.36% 3 14% 489 7/19/1984 14 30% 12.37% 1 93% 490 7/24/1984 16.79% 12.39% 4 40% 491 7/31/1984 16.00% 12.43% 3 57% 492 8/3/1984 14.25% 12.44% 1.81% 493 8/17/1984 14 30% 12 49% 1 81% 494 8/20/1984 15 00% 12 49% 2.51% 495 8/27/1984 16.30% 12.51% 3 79% 496 8/31/1984 15.55% 12 52% 3 03% 497 9/6/1984 16.00% 12.53% 3 47% 498 9/10/1984 14 75% 12 54% 2.21% 499 9/13/1984 15.00% 12.55% 2 45% 500 9/17/1984 17 38% 12.56% 4 82% 501 9/26/1984 14 50% 12 57% 1.93% 502 9/28/1984 15 00% 12 57% 2.43% 503 9/28/1984 16 25% 12.57% 3.68% 504 10/9/1984 14.75% 12 58% 2 17% 505 10/12/1984 15 60% 12 59% 3 01% 506 10/22/1984 15 00% 12.59% 2 41% 507 10/26/1984 16.40% 12 58% 3 82%
796

PUC Docket No. 46449 EXHEBIT RBH-6
Page 10 of 25 1 2
3
Bond Yield Plus Risk Premium [6] [7] [8]' [91
Date of 30-Year Electric Retum on Treasury Risk
Rate Case Equity Yield Premium 508 10/31/1984 16 25% 12.58% 3.67% 509 11/7/1984 15.60% 12.58% 3 02% 510 11/9/1984 16.00% 12.58% 3 42% 511 11/14/1984 15.75% 12.58% 3 17% 512 11/20/1984 15.25% 12.58% 2.67% 513 11/20/1984 15.92% 12 58% 3 34% 514 11/23/1984 15 00% 12.58% 2.42% 515 11/28/1984 16.15% 12 57% 3 58% 516 12/3/1984 15 80% 12 56% 3.24% 517 12/4/1984 16.50% 12 56% 3.94% 518 12/18/1984 16 40% 12.53% 3.87% 519 12/19/1984 14 75% 12 53% 2.22% 520 12/19/1984 15 00% 12 53% 2 47% 521 12/20/1984 16 00% 12 53% 3.47% 522 12/28/1984 16 00% 12 50% 3.50% 523 1/3/1985 14.75% 12.49% 2 26% 524 1/10/1985 15 75% 12.47% 3 28% 525 1/11/1985 16.30% 12 46% 3.84% 526 1/23/1985 15 80% 12 43% 3.37% 527 1/24/1985 15.82% 12 43% 3 39% 528 1/25/1985 16 75% 12 42% 4 33% 529 1/30/1985 14.90% 12 40% 2 50% 530 1/31/1985 14 75% 12 39% 2 36% 531 2/8/1985 14.47% 12.35% 2 12% 532 3/1/1985 13 84% 12 31% 1 53% 533 3/8/1985 16.85% 12.28% 4 57% 534 3/14/1985 15 50% 12 25% 3 25% 535 3/15/1985 15 62% 12.25% 3.37% 536 3/29/1985 15.62% 12 17% 3.45% 537 4/3/1985 14 60% 12.14% 2 46% 538 4/9/1985 15.50% 12. 11% 3 39% 539 4/16/1985 15.70% 12 06% 3 64% 540 4/22/1985 14.00% 12 02% 1.98% 541 4/26/1985 15 50% 11 98% 3.52% 542 4/29/1985 15.00% 11.97% 3 03% 543 5/2/1985 14 68% 11.94% 2.74% 544 5/8/1985 15.62% 11 89% 3.73% 545 5/10/1985 16 50% 11 87% 4 .63% 546 5/29/1985 14.61% 11.73% 2 88% 547 5/31/1985 16.00% 11 71% 4.29% 548 6/14/1985 15.50% 11.61% 3 89% 549 7/9/1985 15.00% 11 45% 3 55% 550 7/16/1985 14.50% 11.39% 3 11% 551 7/26/1985 14 50% 11.33% 3 17% 552 8/2/1985 14.80% 11.29% 3.51% 553 8/7/1985 15 00% 11 27% 3.73% 554 8/28/1985 14.25% 11 15% 3.10% 555 8/28/1985 15 50% 11 15% 4 35% 556 8/29/1985 14.50% 11.15% 3 35% 557 9/9/1985 14 60% 11 11% 3 49% 558 9/9/1985 14.90% 11.11% 3 79% 559 9/17/1985 14 90% 11.08% 3 82% 560 9/23/1985 15.00% 11.06% 3.94% 561 9/27/1985 15 50% 11 05% 4.45% 562 9/27/1985 15.80% 11 05% 4 75% 563 10/2/1985 14 00% 11 03% 2 97% 564 10/2/1985 14.75% 11.03% 3.72% 565 10/3/1985 15 25% 11.03% 4 .22% 566 10/24/1985 15.40% 10.96% 4.44% 567 10/24/1985 15.82% 10 96% 4.86% 568 10/24/1985 15 85% 10.96% 4.89% 569 10/28/1985 16.00% 10 95% 5 05% 570 10/29/1985 16.65% 10.94% 5.71%
797

PUC Docket No. 46449 EXHIBIT RBH-6
Page 11 of 25 1 2
3
Bond Yield Plus Risk Premium [6] [7] [8] [91
Date of 30-Year Electric Retum on Treasury Risk
Rate Case Equity Yield Premium 571 10/31/1985 15.06% 10.93% 4.13% 572 11/4/1985 14 50% 10 92% 3 58% 573 11/7/1985 15.50% 10.90% 4.60% 574 11/8/1985 14 30% 10 89% 3 41% 575 12/12/1985 14 75% 10 73% 4 02% 576 12/18/1985 15 00% 10 69% 4.31% 577 • 12/20/1985 14.50% 10 67% 3.83% 578 12/20/1985 14.50% 10.67% 3 83% 579 12/20/1985 15 00% 10.67% 4.33% 580 1/24/1986 15.40% 10.41% 4 99% 581 1/31/1986 15 00% 10 35% 4 65% 582 2/5/1986 15 00% 10.32% 4.68% 583 2/5/1986 15 75% 10 32% 5 43% 584 2/10/1986 13 30% 10 29% 3 01% 585 2/11/1986 12.50% 10 28% 2 22% 586 2/14/1986 14 40% 10 24% 4 16% 587 2/18/1986 16.00% 10 23% 5 77% 588 2/24/1986 14 50% 10.18% 4.32% 589 2/26/1986 14.00% 10 15% 3 85% 590 3/5/1986 14 90% 10 08% 4.82% 591 3/11/1986 14.50% 10 02% 4 48% 592 3/12/1986 13 50% 10 00% 3.50% 593 3/27/1986 14.10% 9.86% 4 24% 594 3/31/1986 13 50% 9 84% 3.66% 595 4/1/1986 14 00% 9.83% 4 17% 596 4/2/1986 15.50% 9 81% 5 69% 597 4/4/1986 15.00% 9.78% 5.22% 598 4/14/1986 13.40% 9 69% 3 71% 599 4/23/1986 15 00% 9 57% 5.43% 600 5/16/1986 14.50% 9.32% 5 18% 601 5/16/1986 14.50% 9.32% 5.18% 602 5/29/1986 13 90% 9.19% 4 71% 603 5/30/1986 15.10% 9.18% 5.92% 604 6/2/1986 12 81% 9 17% 3.64% 605 6/11/1986 14.00% 9.07% 4.93% 606 6/24/1986 16 63% 8 94% 7.69% 607 6/26/1986 12.00% 8.91% 3.09% 608 6/26/1986 14 75% 8 91% 5 84% 609 6/30/1986 13.00% 8.87% 4 .13% 610 7/10/1986 14 34% 8.75% 5.59% 611 7/11/1986 12.75% 8.73% 4 02% 612 7/14/1986 12.60% 8.71% 3.89% 613 7/17/1986 12.40% 8 66% 3 74% 614 7/25/1986 14.25% 8.57% 5.68% 615 8/6/1986 13 50% 8 44% 5 06% 616 8/14/1986 13.50% 8.35% 5.15% 617 9/16/1986 12.75% 8 06% 4 69% 618 9/19/1986 13.25% 8.03% 5 22% 619 10/1/1986 14.00% 7 95% 6 05% 620 10/3/1986 13.40% 7.93% 5 47% 621 10/31/1986 13.50% 7 77% 5.73% 622 11/5/1986 13.00% 7.75% 5 25% 623 12/3/1986 12 90% 7 58% 5.32% 624 12/4/1986 14 44% 7.58% 6 86% 625 12/16/1986 13 60% 7.52% 6.08% 626 12/22/1986 13 80% 7.51% 6.29% 627 12/30/1986 13.00% 7.49% 5 51% 628 1/2/1987 13 00% 7.49% 5 51% 629 1/12/1987 12 40% 7 47% 4 93% 630 1/27/1987 12.71% 7 46% 5.25% 631 3/2/1987 12.47% 7 47% 5 00% 632 3/3/1987 13 60% 7 47% 6.13% 633 3/4/1987 12 38% 7 47% 4.91%
798

PUC Docket No. 46449 EXHIBIT RBH-6
Page 12 of 25 1 2
3
Bond Yield Plus Risk Premium [6] [7] [8] [9]
Date of 30-Year Electric Return on Treasury Risk
Rate Case Equity Yield Prem i um 634 3/10/1987 13 50% 7 47% 6.03% 635 ' 3/13/1987 13.00% 7 47% 5 53% 636 3/31/1987 13.00% 7.46% 5.54% 637 4/6/1987 13.00% 7 47% 5 53% 638 4/14/1987 12.50% 7.49% 5.01% 639 4/16/1987 14.50% 7 50% 7 00% 640 • 4/27/1987 12 00% 7.54% 4 46% 641 5/5/1987 12.85% 7 58% 5 27% 642 5/12/1987 12 65% 7.62% 5 03% 643 5/28/1987 13.50% 7.70% 5 80% 644 6/15/1987 13 20% 7 78% 5 42% 645 6/29/1987 15. 00% 7.83% 7 17% 646 6/30/1987 12 50% 7 84% 4 66% 647 7/8/1987 12.00% 7 86% 4 14% 648 7/10/1987 12 90% 7 86% 5 04% 649 7/15/1987 13.50% 7.88% 5 62% 650 7/16/1987 13 50% 7.88% 5 62% 651 7/16/1987 15.00% 7.88% .7.12% 652 7/27/1987 13 00% 7 92% 5.08% 653 7/27/1987 13 40% 7 92% 5 48% 654 7/27/1987 13 50% 7 92% 5 58% 655 7/31/1987 12.98% 7 95% 5 03% 656 8/26/1987 12.63% 8.06% 4 57% 657 8/26/1987 12.75% 8.06% 4 69% 658 8/27/1987 13 25% 8.06% 5 19% 659 9/9/1987 13.00% 8.14% 4.86% 660 9/30/1987 12 75% 8 31% 4 44% 661 9/30/1987 13.00% 8 31% 4.69% 662 10/2/1987 11 50% 8 33% 3.17% 663 10/15/1987 13. 00% 8.43% 4 57% 664 11/2/1987 13.00% 8.55% 4.45% 665 11/19/1987 13 00% 8 64% 4.36% 666 11/30/1987 12.00% 8.68% 3 32% 667 12/3/1987 14 20% 8 70% 5.50% 668 12/15/1987 13.25% 8.77% 4 48% 669 12/16/1987 13 50% 8 78% 4.72% 670 12/16/1987 13.72% 8.78% 4 94% 671 12/17/1987 11.75% 8.79% 2.96% 672 12/18/1987 13 50% 8.80% 4 70% 673 12/21/1987 12 01% 8 81% 3.20% 674 12/22/1987 12 00% 8.81% 3 19% 675 12/22/1987 12.00% 8 81% 3 19% 676 12/22/1987 12 75% 8.81% 3.94% 677 12/22/1987 13 00% 8 81% 4.19% 678 1/20/1988 13 80% 8.94% 4.86% 679 1/26/1988 13.90% 8.95% 4 95% 680 1/29/1988 13.20% 8.96% 4.24% 681 2/4/1988 12.60% 8 96% 3 64% 682 3/1/1988 11.56% 8:94% 2 62% 683 3/23/1988 12 87% 8 92% 3.95% 684 3/24/1988 11.24% 8.92% 2.32% 685 3/30/1988 12 72% 8.92% 3 80% 686 4/1/1988 12 50% 8.92% 3.58% 687 4/7/1988 13 25% 8.93% 4 32% 688 4/25/1988 10 96% 8 96% 2 00% 689 5/3/1988 12 91% 8.97% 3.94% 690 5/11/1988 13.50% 8 99% 4 51% 691 5/16/1988 13 00% 8.99% - 4 01% 692 6/30/1988 12.75% 9 00% 3 75% 693 7/1/1988 12.75% 8 99% 3 76% 694 7/20/1988 13 40% 8 96% 4 44% 695 8/5/1988 12.75% 8 92% 3 83% 696 8/23/1988 11 70% 8 93% 2 77%
799