1. question & team - imaginenation...
TRANSCRIPT
Infoway Challenge | Dynacare Submission | CONFIDENTIAL Page 1 / 13
1. Question & Team
In response to Question 1 of the Canada Health Infoway Data Challenge, Dynacare is
pleased to participate and has prepared a response centered on three use-cases which
have been chosen due to their high ordering volumes and potential clinical relevance:
I. Hemoglobin A1c
II. Thyroid Stimulating Hormone, TSH
III. Potassium
Although this particular submission focuses specifically on the tests listed above, the
associated data models can be easily extended to analyze all tests provided by
Dynacare, and on a multitude of dimensions.
A cross-functional team was created to handle this task, composed of:
Marc Chabot, Manager, Commercial Strategy and Customer Insight
Dr. Joel Goodman, VP, Strategies and Innovation
Dana Bailey, Clinical Chemist
Daniela Crivianu-Gaita, Chief Information Officer
Dorota Liszewski, Director, Informatics Solutions and Services
Goran Matic, Enterprise Architect and Data Governance Lead
2. Data Description
One dataset was used for this analysis and sourced from Dynacare’s internal Laboratory
Information System (LIS) data with the following query filters applied:
I. Patients with validated Ontario Health Card Number
II. Champlain LHIN Specimen Collection Centers (SCCS) and Client Addresses
III. Tests Entered from July 1st 2013 to June 30th, 2015 (2 years data)
IV. Test Description = A1c, Potassium, TSH
The grain of the dataset is an ‘ordered test’ with sample sizes for each test being:
Hemoglobin A1c, n=480,728
TSH, n=640,676
Potassium, n= 627,639
Infoway Challenge | Dynacare Submission | CONFIDENTIAL Page 2 / 13
In addition, validated Ontario Health Card numbers are required to have a unique and
reliable patient identifier, and allow provision of any future expansion of the model.
The Champlain LHIN was chosen as the sampling area primarily due to Dynacare’s
strong market position in the region. Dynacare operates approximately two thirds of the
licensed collection centers in the LHIN, and provides community laboratory services through a number of additional collection methods. The area is also geographically
isolated from other major Ontario population centers.
This dataset excludes inpatient and non-Dynacare outpatient testing data. This does
reduce the accuracy of the analysis presented; however, in our view it does not
invalidate the conclusions or insights developed from this submission. Due to the
incomplete nature of this dataset, the repeat test-rates calculated in this study are
naturally conservative.
In addition, tests which had analytical errors were excluded from the analysis. These
errors are often due to pre-analytical process non-conformances which yields the
specimen unusable. The numbers of tests excluded from the analysis are:
I. Hemoglobin A1c, n=3,163
II. TSH, n=2,698
III. Potassium, n= 2,860
3. Analysis Method
Data was downloaded via SQL from Dynacare’s central data repository into a secure
server-based instance of Microsoft Excel 2013 with PowerPivot. All analysis was
performed within PowerPivot – utilizing the Data Analysis Expressions (DAX) language
for analysis.
The analysis method and tool does allow for integration of data from additional sources
such as OLIS (Ontario Laboratories Information Systems), or in-patient testing data
sourced from hospital networks. Unfortunately – and due to the respective time
constraints as well as privacy restriction – Dynacare was unable to obtain this additional
data.
The number of repeated tests within a forward-looking time period was calculated
utilizing a combination of DAX’s FILTER, COUNTROWS and EARLIER functions.
The formulas count the number of rows in a table filtered on the following criteria:
Valid Test Result = TRUE ()
Patient Health Card = earlier (Patient Health Card)
Ordered Test = earlier (Ordered Test)
EntryDate < earlier (EntryDate) + Y, (Y=30, 90, 120, 180)
EntryDate > earlier (EntryDate)
Infoway Challenge | Dynacare Submission | CONFIDENTIAL Page 3 / 13
Each test in the dataset is considered independently.
For each test (row) the DAX expressions use a 30, 90, 120 or 180-day forward-looking
window and calculate how many times the test was repeated. Thereafter additional
metrics are written to sum the number of tests which have / have not been repeated.
The number of times a test is repeated within a time window has been considered out-
of-scope for this submission.
Test results for each row are interpreted and determined to be either ‘Normal’ or
‘Abnormal’. Abnormal results can include tests which are Low, High, or Low Critical, or
High Critical. The dimension of Normal / Abnormal presented in each use-case is based
upon the result of the current test (row), and disregards the results of previous or
repeated tests.
Only tests ordered in the first ~560 days are analyzed to see if they are repeated. Tests
in the last 180 days can only be counted as a repeated tests for those within the first
~560. This is to ensure all tests determined to have a repeat / non-repeat receive the
full 180-day window. This time window can be adjusted for 30, 90 and 120 day time
periods.
The standard deviation of repeat rates is calculated as:
√( )
√
,
…where P is the proportion, n is the sample size, and N is the population size.
Assuming that N >> n, the second term is approximately 1. Calculations shows that the
vast majority of standard deviations are < 2.5% of the repeat rate (SD / P < 2.5%).
This is further demonstrated by the smooth data trends observed in the use cases.
After observing the trends and magnitude of the standard errors, an in-depth error
analysis was considered out-of-scope for this submission.
Infoway Challenge | Dynacare Submission | CONFIDENTIAL Page 4 / 13
4. Use Cases
For each use-case three standard charts (figure A, B, C) have been produced that
succinctly summarize the re-ordering patterns.
Each use-case and the associated figures are followed by the Discussion and Findings
sections – which summarize our attempts to interpret the observed ordering trends from
a clinical perspective.
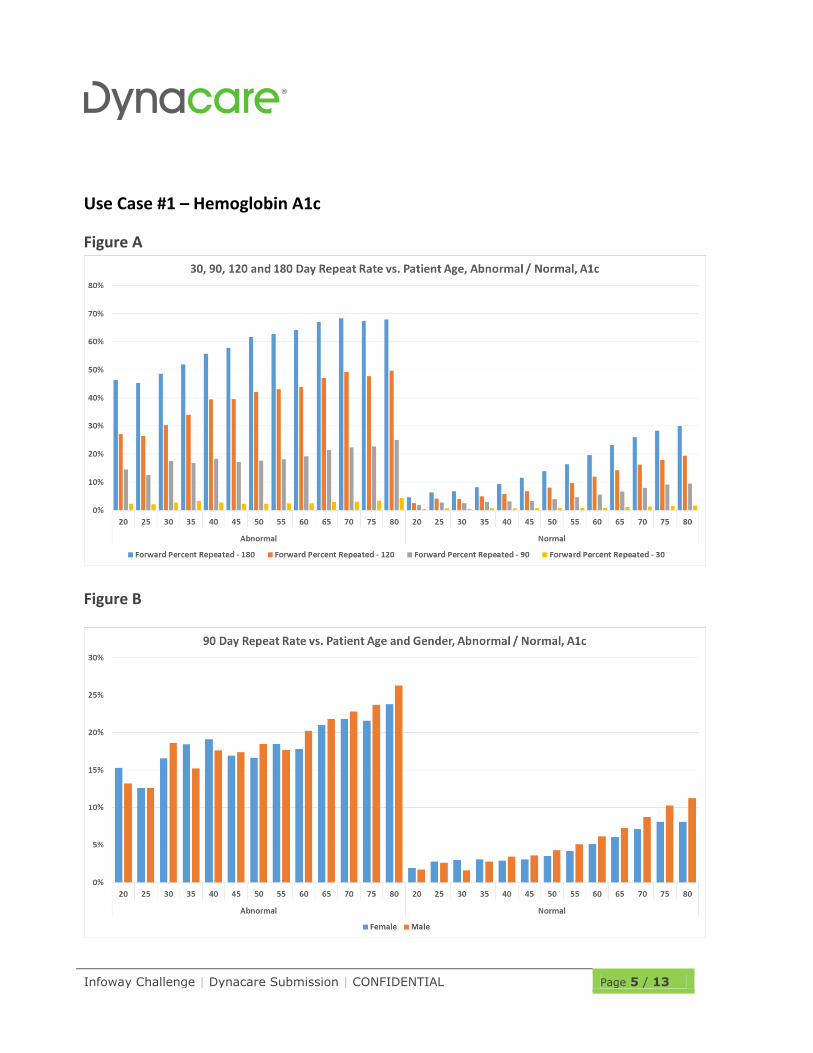
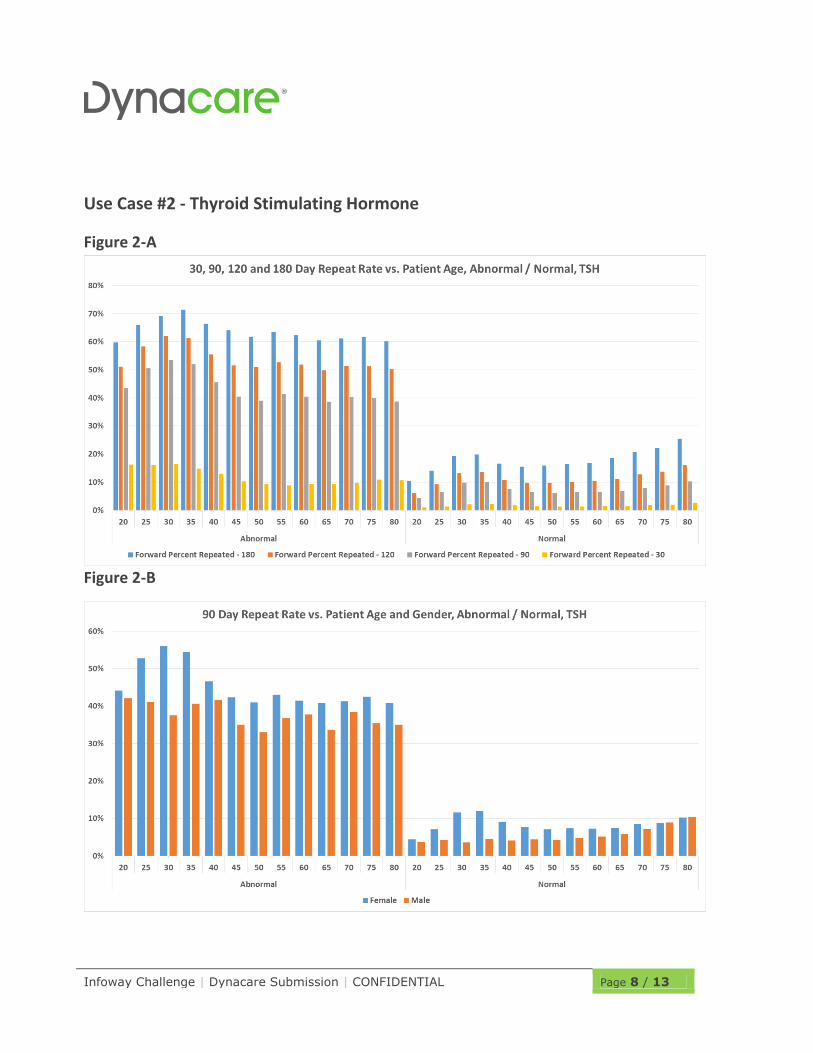
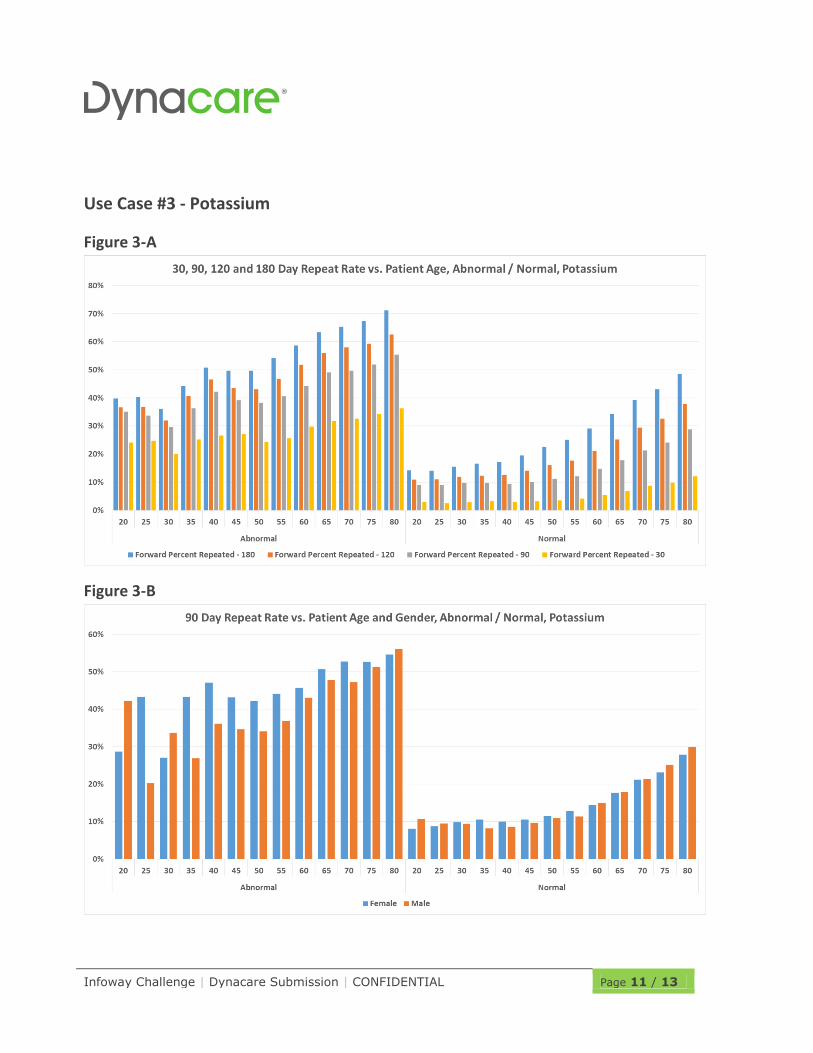
Figure A: 30, 90, 120 and 180 Day Repeat Rates vs. Patient Age, Abnormal /
Normal
Summarizes the % rate of repeat in 30, 90, 120, and 180 day forward-looking windows.
Although the question states a 90-day period, Dynacare found interesting trends at
different time-window lengths.
The repeat rate is plotted against patient age, rounding to the nearest five, and if the
current test result was ‘Normal’ or ‘Abnormal’.
Figure B: 90 Day Repeat Rate vs. Patient Age and Gender, Abnormal / Normal
This chart summarizes the rate of repeat for the 90 day window.
The rates are plotted against patient age, patient gender, and if the current test result
was ‘Normal’ or ‘Abnormal’.
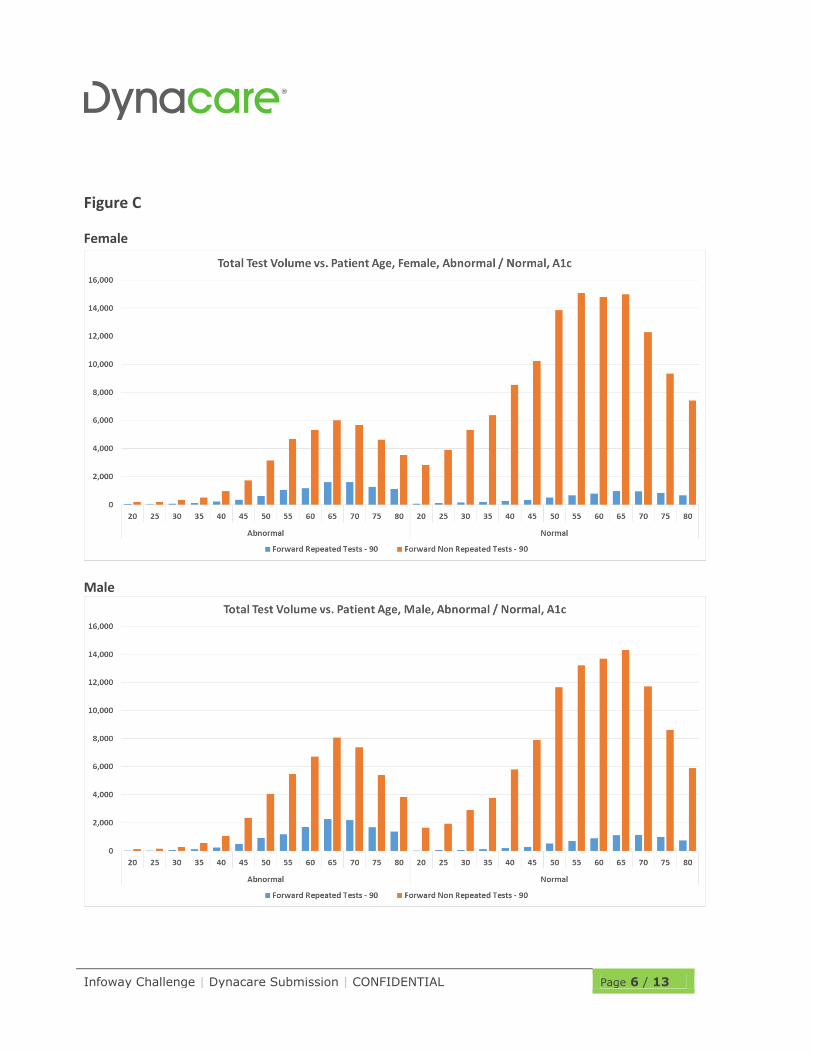
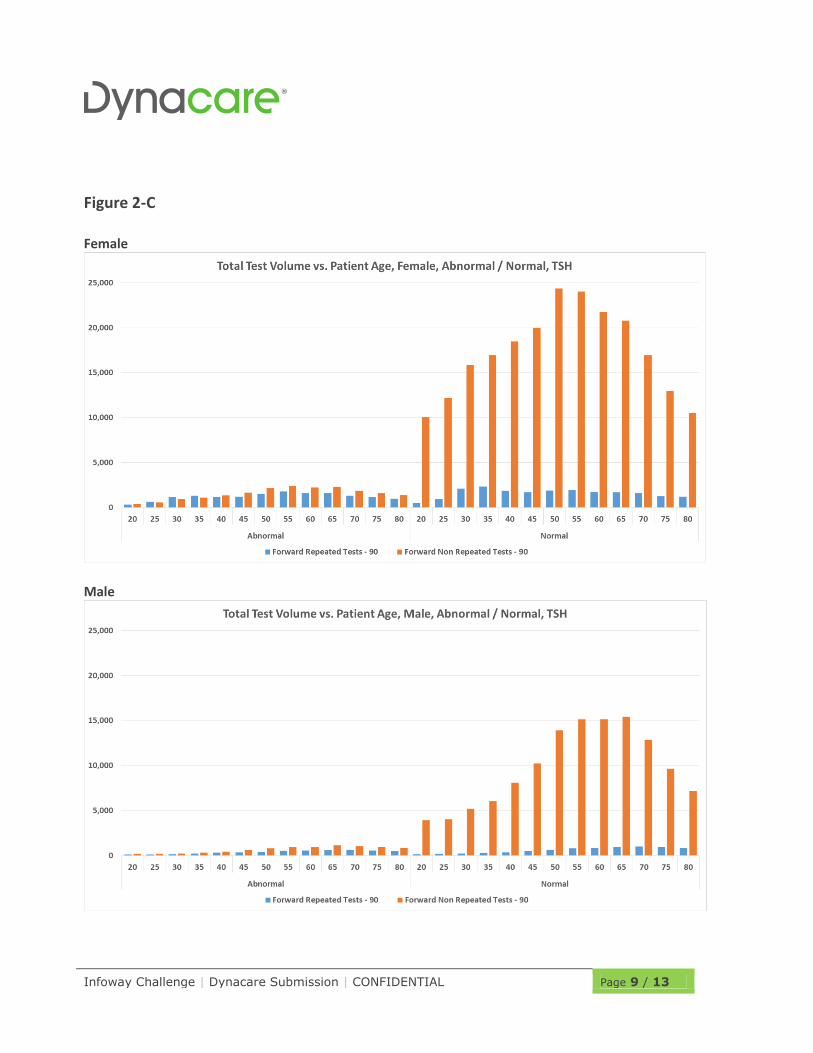
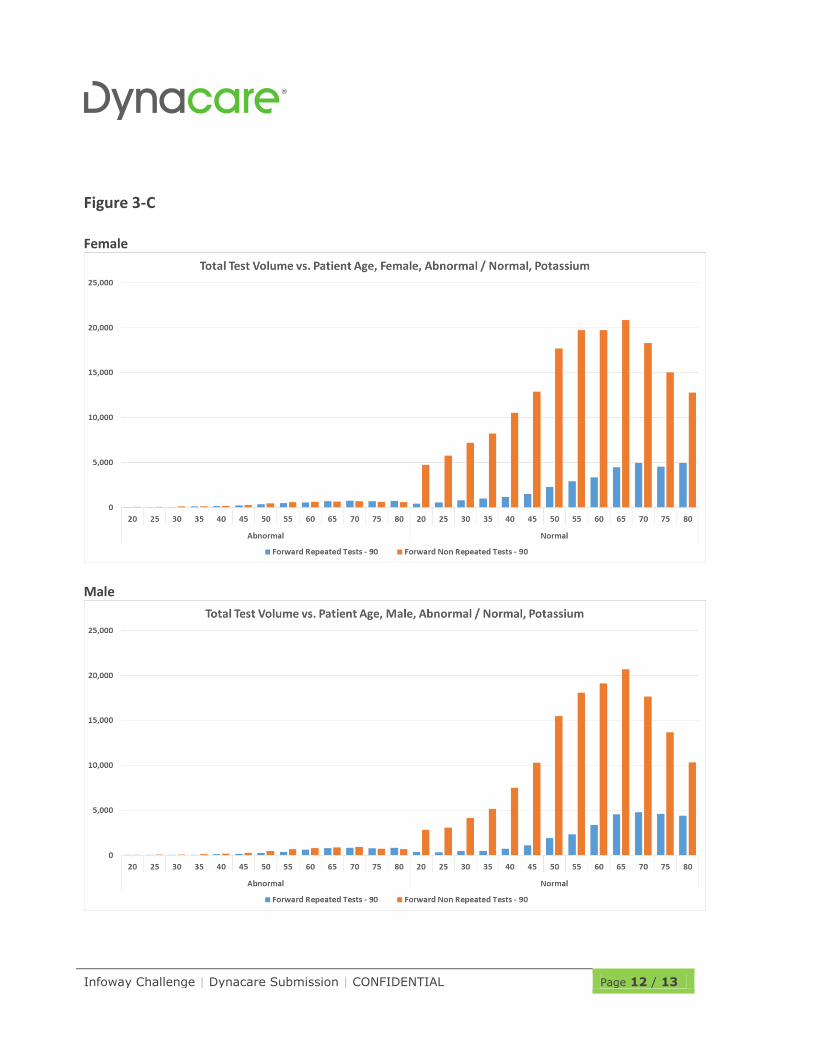
Figure C: Repeated and Non-Repeated Test Volume vs. Patient Age, Abnormal
/ Normal
Summarizes the total volume of tests which have been repeated – or not repeated – in a
90 day forward looking window.
The count is not of how many repeats, but how many tests have a repeat within the 90
day window. The total test volume is plotted against patient age and if the current test
result was ‘Normal’ or ‘Abnormal’.
Two charts are provided, one for male and one for female.
Infoway Challenge | Dynacare Submission | CONFIDENTIAL Page 5 / 13
Use Case #1 – Hemoglobin A1c
Figure A
Figure B
Infoway Challenge | Dynacare Submission | CONFIDENTIAL Page 6 / 13
Figure C
Female
Male
Infoway Challenge | Dynacare Submission | CONFIDENTIAL Page 7 / 13
Discussion Hemoglobin A1c (HbA1c) serves as a time-weighted marker of average glycemic control
over the preceding two to three months, or the average lifespan of red blood cells.
Clinically, HbA1c is used both to diagnose type 2 diabetes and to monitor treatment
effectiveness. For the former, the Canadian Diabetes Association (CDA) recommends
measuring HbA1c every three years in individuals ≥40 years of age or in those at high
risk.
In the absence of overt symptoms of diabetes, repeat measurement of HbA1c or an
alternate screening test is required for the diagnosis of diabetes. For the latter, HbA1c
measurements should be performed every three months when glycemic targets are not
being met and/or when diabetes therapy is being adjusted or every six months (~180
days) when glycemic targets have been consistently achieved. Therefore, the
expectations for repeat results are as follows:
1) Abnormal HbA1c values may be repeated within a short time frame (<30 days) if
used for diagnostic purposes. Normal HbA1c values should not be repeated within a
short time frame (<30 days) unless results are inconsistent with the clinical picture.
2) In diabetic patients, HbA1c testing should be repeated every 90 if clinical targets are
not being met (i.e. the HbA1c is abnormal) and every 180 days if clinical targets are
being met (i.e. the HbA1c is normal).
Findings
Analysis of HbA1c testing patterns indicate that both the absolute number of HbA1c
tests requested as well as the percentage of repeats per age partition increased with age
with no differentiation between gender.
This is consistent with the age of onset of type 2 diabetes and CDA screening
recommendations.
Encouragingly, although the majority of test results were normal, the majority of
repeats were performed on initially abnormal results. Consistent with the expectations
described above, within 180, 90, and 30 days , 45-65%, 20%, and <5% of abnormal
HbA1c results were repeated, respectively; conversely, only 5-25%, <10%, and ~1% of
normal HbA1c results were repeated within the same timeframe.
In general, these findings support adherence of physicians to the CDA guidelines for the
diagnosis and monitoring of type 2 diabetes.
Infoway Challenge | Dynacare Submission | CONFIDENTIAL Page 8 / 13
Use Case #2 - Thyroid Stimulating Hormone
Figure 2-A
Figure 2-B
Infoway Challenge | Dynacare Submission | CONFIDENTIAL Page 9 / 13
Figure 2-C
Female
Male
Infoway Challenge | Dynacare Submission | CONFIDENTIAL Page 10 / 13
Discussion
Thyroid disorders, including hypothyroidism and hyperthyroidism, are mostly commonly
found in women with an age of onset between 30 and 50 years of age.
Measurement of thyroid stimulating hormone (TSH) is currently the recommended initial
screening test when thyroid disease is suspected and follow-up test for monitoring of
thyroid treatment. Since TSH values change slowly, frequent repeat testing of TSH is
considered unnecessary. When monitoring hypothyroidism, TSH should be tested after
45-90 days following a change in replacement hormone or clinical status.
Similarly, when monitoring hyperthyroidism, TSH should be tested after at least 90 days
post-treatment initiation.
Findings
Examination of the TSH ordering patterns indicate an increase in the absolute number of
tests ordered according to age but a relatively constant percentage of repeat tests.
Abnormal test results were repeated at a rate of 60-70% within 180 days, 40-50%
within 90 days, and ~10% within 30 days; normal test results were repeated at a rate
of 20%, 5%, and ~1% within the same timeframe. In accordance with the increased
prevalence of thyroid disease in females, a higher percentage of repeat testing was
observed in females versus males.
In total, this suggests that in the majority of patients for which TSH is monitored,
repeats are performed within the recommended 90 day window.
Infoway Challenge | Dynacare Submission | CONFIDENTIAL Page 11 / 13
Use Case #3 - Potassium
Figure 3-A
Figure 3-B
Infoway Challenge | Dynacare Submission | CONFIDENTIAL Page 12 / 13
Figure 3-C
Female
Male
Infoway Challenge | Dynacare Submission | CONFIDENTIAL Page 13 / 13
Discussion
In a general outpatient setting, potassium is monitored in individuals receiving various
pharmacotherapies such as blood pressure medications (e.g. ACE inhibitors) and
diuretics (potassium-sparing or potassium-wasting).
In more specialized instances, potassium may be monitored as an adjunct test when
assessing kidney function, chronic heart failure, and other conditions causing electrolyte
abnormalities.
To our knowledge, for potassium, there are no specific guidelines provided to general
practitioners regarding the appropriate frequency of ordering.
However, clinicians are advised to measure potassium when initiating or modifying an
ACE inhibitor or diuretic drug regimen, or every 90-180 days when treatment is
stabilized.
Findings
The data from Dynacare indicates that the majority of potassium test results are normal,
that the number of test requests increases with age group, and that the majority of
repeat tests are requested on previously normal values.
As a relative percentage, 40-60% of abnormal potassium results are repeated within
180 days, 30-50% within 90 days, and 20-30% within 30 days; conversely, 10-40%,
10-20%, and 5-10% of normal potassium results are repeated within the same
timeframe.
Due to the lack of guidelines for potassium ordering, we cannot conclude on the
appropriateness of the repeat ordering behavior observed.