1 realworld evaluation designing evaluations under budget, time, data and political constraints...
TRANSCRIPT

1
RealWorld EvaluationDesigning Evaluations under Budget, Time, Data and Political Constraints
International Perspectives on Impact EvaluationProfessional pre-session workshop #5
Cairo29 March 2009
Facilitated byJim Rugh
Note: This PowerPoint presentation and the summary chapter of the book are available at:
www.RealWorldEvaluation.org

Workshop Objectives
1. The seven steps of the RealWorld Evaluation approach for addressing common issues and constraints faced by evaluators such as: when the evaluator is not called in until the project is nearly completed and there was no baseline nor comparison group; or where the evaluation must be conducted with inadequate budget and insufficient time; and where there are political pressures and expectations for how the evaluation should be conducted and what the conclusions should say
2
Workshop Objectives
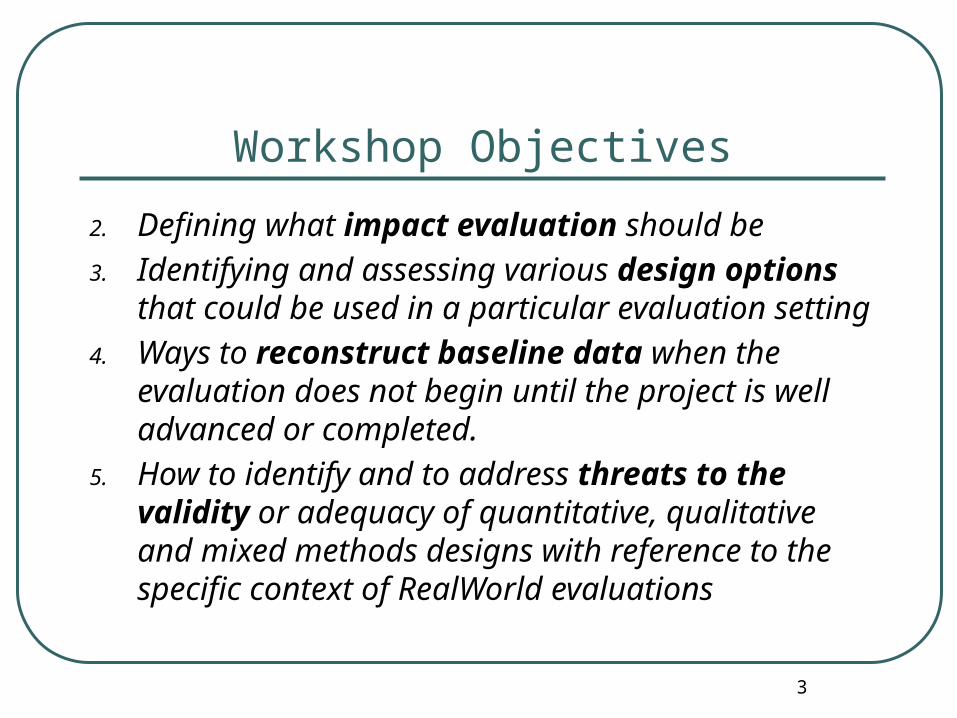
2. Defining what impact evaluation should be
3. Identifying and assessing various design options that could be used in a particular evaluation setting
4. Ways to reconstruct baseline data when the evaluation does not begin until the project is well advanced or completed.
5. How to identify and to address threats to the validity or adequacy of quantitative, qualitative and mixed methods designs with reference to the specific context of RealWorld evaluations
3

Workshop Objectives
Note: This workshop will focus on project-level impact evaluations. There are, of course, many other purposes, scopes, evaluands and types of evaluations. Some of these methods may apply to them, but our examples will be based on project impact evaluations, most of them in the context of developing countries.
4

Workshop agenda1. Introduction [15 minutes] 2. Quick summary of the RealWorld Evaluation (RWE) approach [30 minutes] 3. Small group self-introductions and sharing of RWE issues you have faced in your own practice. [45 minutes] 4. Scoping the evaluation and identifying budget and time constraints, also logic models, evaluation designs [60 minutes]
--- short break ---
5. Addressing data constraints [30 minutes]6. Mixed methods [30 minutes]
7.a. Group exercise: preparing an evaluation design when working under budget, time, data or political constraints. The cases will also illustrate the different evaluation agendas and perspectives of evaluation consultants, project implementers and funding agencies. [30 minutes]
--- lunch [60 minutes] ---
7.b. Small group work continues [60 minutes]
8. Plenary: Identifying threats to validity [30 minutes]
9. Paired groups negotiate their ToRs [45 minutes] 10-11-12: Feedback, wrap-up discussion, evaluation of the workshop

6
OVERVIEW OF THE
RWE APPROACH
RealWorld Evaluation
Designing Evaluations under Budget, Time,
Data and Political Constraints

7
RealWorld Evaluation Scenarios
Scenario 1: Evaluator(s) not brought in until near end of project
For political, technical or budget reasons:• There was no baseline survey• Project implementers did not collect
adequate data on project participants at the beginning or during the life of the project
• It is difficult to collect data on comparable control groups

8
Scenario 2: The evaluation team is called in early in the life of the project
But for budget, political or methodological reasons:
The ‘baseline’ was a needs assessment, not comparable to eventual evaluation
It was not possible to collect baseline data on a comparison group
RealWorld Evaluation Scenarios

9
Reality Check – Real-World Challenges to Evaluation
• All too often, project designers do not think evaluatively – evaluation not designed until the end
• There was no baseline – at least not one with data comparable to evaluation
• There was/can be no control/comparison group.• Limited time and resources for evaluation• Clients have prior expectations for what the
evaluation findings will say• Many stakeholders do not understand evaluation;
distrust the process; or even see it as a threat (dislike of being judged)

10
RealWorld Evaluation Quality Control Goals
Achieve maximum possible evaluation rigor within the limitations of a given context
Identify and control for methodological weaknesses in the evaluation design
Negotiate with clients trade-offs between desired rigor and available resources
Presentation of findings must recognize methodological weaknesses and how they affect generalization to broader populations

11
The Need for the RealWorld Evaluation Approach
As a result of these kinds of constraints, many of the basic principles of rigorous impact evaluation design (comparable pre-test-post test design, control group, adequate instrument development and testing, random sample selection, control for researcher bias, thorough documentation of the evaluation methodology etc.) are often sacrificed.

12
The RealWorld Evaluation Approach
An integrated approach to ensure acceptable standards of methodological rigor while operating under realworld budget, time, data and political constraints.
See handout summary chapter extracted from RealWorld Evaluation book for more details

13
The RealWorld Evaluation approach
Developed to help evaluation practitioners and clients• managers, funding agencies and external
consultants Still a work in progress (more to be learned) Originally designed for developing countries,
but equally applicable in industrialized nations

14
Special Evaluation Challenges in Developing Countries
Unavailability of needed secondary data Scarce local evaluation resources Limited budgets for evaluations Institutional and political constraints Lack of an evaluation culture (though
evaluation associations are addressing this) Many evaluations are designed by and for
external funding agencies and seldom reflect local and national stakeholder priorities

15
Despite these challenges, there is a growing demand for methodologically sound evaluations which assess the impacts, sustainability and replicability of development projects and programs …………………….
Special Evaluation Challenges in Developing Countries

16
Most RealWorld Tools are not New— Only the Integrated Approach is New
Most of the RealWorld Evaluation data collection and analysis tools will be familiar to most evaluators
What is new is the integrated approach which combines a wide range of tools to produce the best quality evaluation under realworld constraints

18
Who Uses RealWorld Evaluation and When?
Two main users:• evaluation practitioners• managers, funding agencies and external
consultants The evaluation may start at:
• the beginning of the project• after the project is fully operational• during or near the end of project
implementation• after the project is finished

19
What is Special About the RealWorld Evaluation Approach?
There is a series of steps, each with checklists for identifying constraints and determining how to address them
These steps are summarized on the following slide and then the more detailed flow-chart …
(See page 6 of handout)

20
The Steps of the RealWorld Evaluation Approach
Step 1: Planning and scoping the evaluation Step 2: Addressing budget constraintsStep 3: Addressing time constraintsStep 4: Addressing data constraintsStep 5: Addressing political constraintsStep 6: Assessing and Addressing the strengths
and weaknesses of the evaluation designStep 7: Helping clients use the evaluation

The Real-World Evaluation Approach
Step 1: Planning and scoping the evaluationA . Defining client information needs and understanding the political contextB . Defining the program theory modelC . Identifying time, budget, data and political constraints to be addressed by the RWE D . Selecting the design that best addresses client needs within the RWE constraints
Step 2Addressing budget
constraintsA. Modify evaluation designB. Rationalize data needs C. Look for reliable secondary data D. Revise sample designE. Economical data collection methods
Step 3Addressing time constraints
All Step 2 tools plus:F. Commissioning preparatory studiesG. Hire more resource personsH. Revising format of project records to include critical data for impact analysis.I. Modern data collection and analysis technology
Step 4Addressing data constraints
A . Reconstructing baseline data
B . Recreating comparison groups
C . Working with non-equivalent comparison groups
D . Collecting data on sensitive topics or from difficult to reach groups
E . Multiple methods
Step 6Assessing and addressing the strengths and weaknesses of the
evaluation designAn integrated checklist for multi-method designsA. Objectivity/confirmabilityB. Replicability/dependabilityC. Internal validity/credibility/authenticityD. External validity/transferability/fittingness
Step 7
Helping clients use the evaluationA. UtilizationB. ApplicationC. OrientationD. Action
Step 5Addressing political
influences A. Accommodating pressures from funding agencies or clients on evaluation design.B. Addressing stakeholder methodological preferences.C. Recognizing influence of professional research paradigms.
21

TIME FOR DISCUSSION 22

23
1. Self-introductions
2. What constraints of these types have you
faced in your evaluation practice?
3. How did you cope with them?

RealWorld Evaluation
Designing Evaluations under Budget, Time,
Data and Political Constraints
The challenge of the counterfactual

25
Attribution and counterfactuals
How do we know if the observed changes in the project participants or communities • income, health, attitudes, school attendance
etc
are due to the implementation of the project • credit, water supply, transport vouchers, school
construction etc
or to other unrelated factors?• changes in the economy, demographic
movements, other development programs etc

26
The Counterfactual
What would have been the condition of the project population at the time of the evaluation if the project had not taken place?

27
Where is the counterfactual?
After families had been living in a new housing project for 3 years, a study found average household income had increased by an 50%
Does this show that housing is an effective way to raise income?

Comparing the project with two possible comparison groups
2000 2002
250
500
750
Income
Project group. 50% increase
Scenario 2. 50% increase in comparison group income. No evidence of project impact
Scenario 1. No increase in comparison group income.
Potential evidence of project impact

29
5 main evaluation strategiesfor addressing the counterfactual
Randomized designsI. True experimental designsII. Randomized selection of participants &
control Quasi-experimental designs III. Strong quasi-experimental designsIV. Weaker quasi-experimental designsNon-experimental designs.V. No logically defensible counterfactual

The most rigorous statistical designs: Randomized experimental or at least strong quasi-experimental evaluation designs
T1
Pre-testT2
Treatment [project]
T3
Post-test
Project group P1 X P2
Control group C1 C2
Subjects randomly
assigned to the project and
control groups or control group
selected using statistical or judgmental matching
Gain score [impact] = P2 – P1
C2– C1
Conditions of both groups are not
controlled during the project

31
Control group and comparison group
Control group = randomized allocation of subjects to project and non-treatment group
Comparison group = separate procedure for sampling project and non-treatment groups that are as similar as possible in all aspects except the treatment (intervention)

32
Reference sources for randomized field trial designs
1. MIT Poverty Action Lab
www.povertyactionlab.org
2. Center for Global Development“When will we ever learn?”
http://www.cgdev.org/content/publications/detail/7973

33
The limited use of strong evaluation designs
In the realworld we estimate that• Less than 5-10% of impact evaluations use a
strong quasi-experimental design• Significantly less than 5% use randomized
control trials (experimental design)

34
There are other methods for assessing the counterfactual
Reliable secondary data that depicts relevant trends in the population
Longitudinal monitoring data (if it includes non-reached population)
Qualitative methods to obtain perspectives of key informants, participants, neighbors, etc.
We’ll talk more about this in the 5th session

35
Step 1
PLANNING AND SCOPING THE EVALUATION
RealWorld Evaluation
Designing Evaluations under Budget, Time,
Data and Political Constraints

36
Step 1: Planning and Scoping the Evaluation
Understanding client information needs Defining the program theory model Preliminary identification of constraints to
be addressed by the RealWorld Evaluation

37
A. Understanding client information needs
Typical questions clients want answered: Is the project achieving its objectives? Are all sectors of the target population
benefiting? Are the results sustainable? Which contextual factors determine the
degree of success or failure?

38
A full understanding of client information needs can often reduce the types of information collected and the level of detail and rigor necessary.
However, this understanding could also increase the amount of information required!
A. Understanding client information needs

39
B. Defining the program theory model
All programs are based on a set of assumptions (hypothesis) about how the project’s interventions should lead to desired outcomes.
Sometimes this is clearly spelled out in project documents.
Sometimes it is only implicit and the evaluator needs to help stakeholders articulate the hypothesis through a logic model.
40
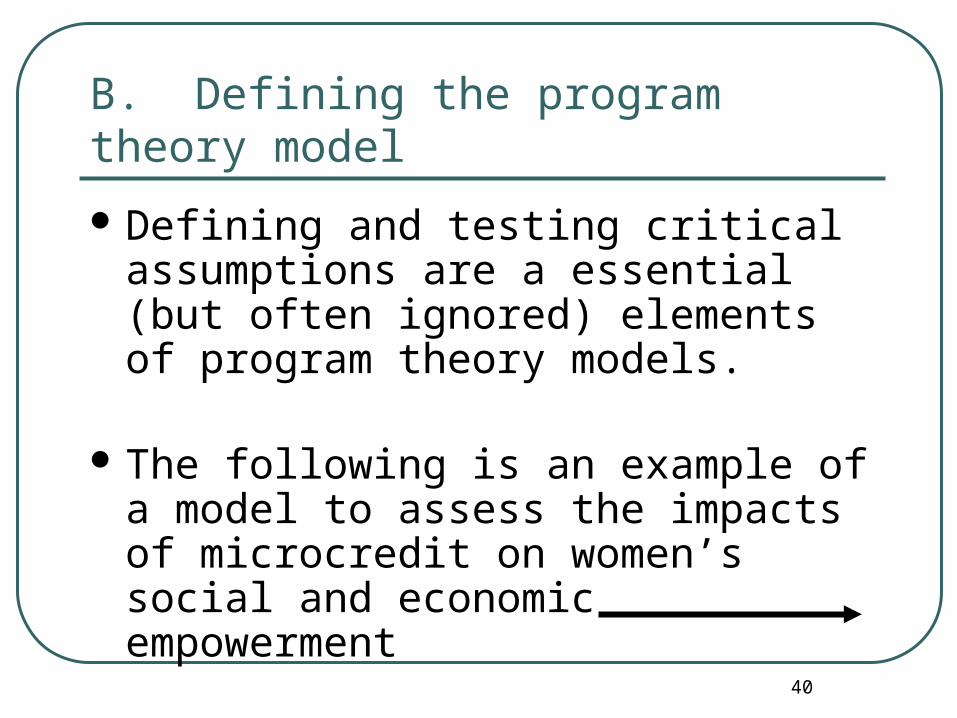
Defining and testing critical assumptions are a essential (but often ignored) elements of program theory models.
The following is an example of a model to assess the impacts of microcredit on women’s social and economic empowerment
B. Defining the program theory model

41
Outputs• If credit is available women will be willing and able to obtain loans
and technical assistance. Short-term outcomes
• If women obtain loans they will start income-generating activities.• Women will be able to control the use of loans and reimburse them.
Medium/long-term impacts• Economic and social welfare of women and their families will
improve.• Increased women’s economic and social empowerment.
Sustainability• Structural changes will lead to long-term impacts.
Critical Hypothesis for a Gender-Inclusive Micro-Credit Program

PROBLEM
PRIMARY CAUSE 2
PRIMARYCAUSE 1
PRIMARY CAUSE 3
Secondary cause 2.2
Secondary cause 2.3
Secondary cause 2.1
Tertiary cause 2.2.1
Tertiary cause 2.2.2
Tertiary cause 2.2.3
Consequences Consequences Consequences

Children are malnourished
Diarrheal disease
Insufficient food
Poor quality of food
Unsanitary practices
Need for improved health
policies
Contaminated water
Flies and rodents
Do not use facilities correctly
People do not wash hands
before eating
High infant mortality rate

Women empowered
Women able to reimburse loans
Women in leadership roles
Women educated
Credit provided to
entrepreneurs
Improved economic conditions
Women achieve rights within household
S&L groups organized
MFI provides credit
Training of agents
Reduction in poverty

What does it take to measure indicators at each level?
Program Impact: Population-based survey (program baseline, program evaluation some time after projects completd)
Effect: b) Population-based survey (usually only during baseline and evaluation)
Effect: a) Follow-up survey of participants (can be done annually)
Output: Measured by project staff annually
Activities: On-going (monitoring)
Inputs: On-going (financial accounts)
Project Impact :Population-based survey (baseline, evaluation)

We need to recognize which evaluative process is most appropriate for measurement at various levels
• Impact • Effect
• Output• Activities• Inputs
PERFORMANCE MONITORING
PROJECT EVALUATION
PROGRAM EVALUATION

47
This can be a sensitive issue: Project staff generally don’t like to be held accountable for more than the output level, while donors (and intended beneficiaries) may insist on evaluating higher-level outcomes.
An approach evaluators might take is that if the correlation between intermediary outcomes (or even qualified outputs) and impact has been adequately established though research and program evaluations, then assessing intermediary outcome-level indicators might suffice, as long as the contexts can be shown to be sufficiently similar to where such hypotheses have been tested.
Coming to agreement on what levels of the logic model to include in evaluation

48
Determining appropriate (and feasible) evaluation design
Based on an understanding of client information needs, required level of rigor, and what is possible given the constraints, the evaluator and client need to determine what evaluation design is required and possible under the circumstances.

Let’s focus for a while on evaluation design (a quick review)
1: Review different evaluation (experimental /quasi-experimental) designs
2: Develop criteria for determining appropriate Terms of Reference (ToR) for evaluating a project, given its own (planned or un-planned) evaluation design.
3: Use decision tree to make choices of what’s required (or feasible) to include in an evaluation ToR.
4: A life-of-project evaluation design perspective.
4949

baseline end of project evaluation
Illustrating the need for quasi-experimental longitudinal time series evaluation design
Project participants
Comparison group
post project evaluation
An introduction to various evaluation designs
scale of major impact indicator50

OK, let’s stop the action to identify each of the major types of evaluation (research) design
…
… one at a time, beginning with the most rigorous design.
51

First of all: the key to the traditional symbols:
X = Intervention (treatment), I.e. what the project does in a community
O = Observation event (e.g. baseline, mid-term evaluation, end-of-project evaluation)
P (top row): Project participants C (bottom row): Comparison (control) group
52
Note: the 7 RWE evaluation designs are laid out on page 46 of your handout

baseline end of project evaluation
Comparison group
post project evaluation
Design #1: Longitudinal Quasi-experimental
P1 X P2 X P3 P4
C1 C2 C3 C4
Project participants
midterm
53

baseline end of project evaluation
Control group
post project evaluation
Design #1+: Longitudinal Randomized Control Trial
P1 X P2 X P3 P4
C1 C2 C3 C4
Project participants
midterm
54
Research subjects randomly assigned either to project or control group.

baseline end of project evaluation
Control group
Design #2+: Randomized Control Trial
P1 X P2
C1 C2
Project participants
55
Research subjects randomly assigned either to project or control group.

baseline end of project evaluation
Comparison group
Design #2: Quasi-experimental (pre+post, with comparison)
P1 X P2
C1 C2
Project participants
56

end of project evaluation
Comparison group
Design #3: Truncated Longitudinal
X P1 X P2
C1 C2
Project participants
midterm
57

baseline end of project evaluation
Comparison group
Design #4: Pre+post of project; post-only comparison
P1 X P2
C
Project participants
58

end of project evaluation
Comparison group
Design #5: Post-test only of project and comparison
X P
C
Project participants
59

baseline end of project evaluation
Design #6: Pre+post of project; no comparison
P1 X P2
Project participants
60

end of project evaluation
Design #7: Post-test only of project participants
X P
Project participants
61
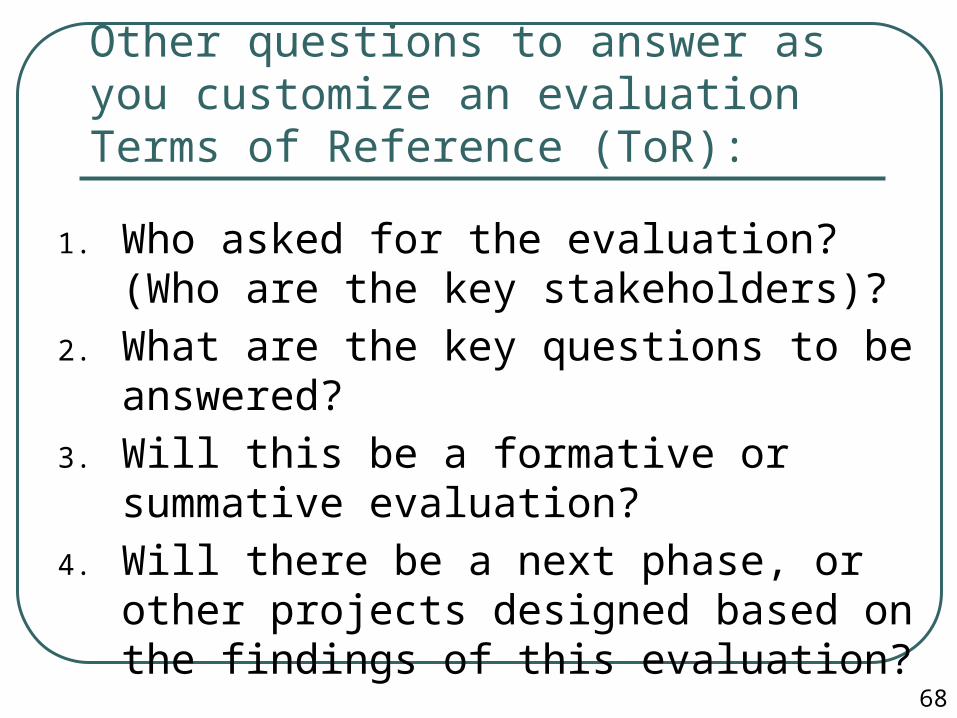
Other questions to answer as you customize an evaluation Terms of Reference (ToR):
1. Who asked for the evaluation? (Who are the key stakeholders)?
2. What are the key questions to be answered?
3. Will this be a formative or summative evaluation?
4. Will there be a next phase, or other projects designed based on the findings of this evaluation?
68

5. What decisions will be made in response to the findings of this evaluation?
6. What is the appropriate level of rigor?7. What is the scope / scale of the
evaluation / evaluand (thing to be evaluated)?
8. How much time will be needed / available?
9. What financial resources are needed / available?
Other questions to answer as you customize an evaluation ToR:
69

10. Should the evaluation rely mainly on quantitative or qualitative methods?
11. Should participatory methods be used?12. Can / should there be a household
survey?13. Who should be interviewed?14. Who should be involved in planning /
implementing the evaluation?15. What are the most appropriate media
for communicating the findings to different stakeholder audiences?
Other questions to answer as you customize an evaluation ToR:
70

Does this help, or just confuse things more? Who said evaluations (like life) would be easy?!!
Evaluation (research) design?Key questions?
Evaluand (what to evaluate)?
Qualitative?
Quantitative?
Scope?
Appropriate level of rigor?
Resources available?
Time available?
Skills available?
Evaluation FOR whom?
Participatory?
Extractive?
71

Before we return to the RealWorld steps,
let’s gain a perspective on levels of rigor, and what a
Life-Of-Project Evaluation Plan could
look like
72

Different levels of rigordepends on source of evidence; level of confidence; use of information
Level 0: Decision-maker’s impressions based on anecdotes and sound bytes heard during brief encounters (hallway gossip), mostly intuition; Level of confidence +/- 50%; Decision made in a few seconds
Level 1: A few people are asked their perspectives about project; P= +/- 40% Decision made in a few minutes
Level 3: A rapid survey is conducted on a convenient sample of participants; P= +/- 15% Decision maker reads 10-page summary of report
Level 2: A fairly good mix of people are asked their perspectives about project; P= +/- 25% Decision maker reads at least executive summary of report
Level 4: Good sampling and data collection methods used to gather data which is representative of target population; P= +/- 5% Decision maker reads full report
Level 5: A thorough research project is undertaken to conduct in-depth analysis of situation; P= +/- 1% Book published!
Objective, High precision, More time & expense
Subjective , Sloppy, Quick & cheap 73

Determining appropriate levels of precision for
events in a life-of-project evaluation plan
Annualself-evaluation
Mid-termevaluation
Baselinestudy
Needs assessment
Finalevaluation
Time during project life cycle
Special Study
Same level of rigor
High rigor
Low rigor
2
3
4
74

TIME FOR DISCUSSION75

76
Now, where were we?
Oh, yes, we’re ready for Steps 2 and 3 of the RealWorld Evaluation Approach.
Let’s continue …

77
Steps 2 + 3
ADDRESSING BUDGET AND TIME CONSTRAINTS
RealWorld Evaluation
Designing Evaluations under Budget, Time,
Data and Political Constraints

78
Step 2: Addressing budget constraints
A. Clarifying client information needs
B. Simplifying the evaluation design
C. Look for reliable secondary data
D. Review sample size
E. Reducing costs of data collection and analysis

79
2A: Simplifying the evaluation design
For quantitative evaluations it is possible to select among the 7 most common evaluation designs (noting the trade-offs when using a simpler design).
For qualitative evaluations the options will vary depending on the type of design.

80
2A (cont): Qualitative designs
Depending upon the design, some of the options might include:• Reducing the number of units studied
(communities, families, schools)• Reducing the number of case studies or the
duration and complexity of the cases.• Reducing the duration or frequency of
observations

81
2.B. Rationalize data needs
Use information from Step 1 to identify client information needs
Review all data collection instruments and cut out any questions not directly related to the objectives of the evaluation.

82
2.C. Look for reliable secondary sources
Planning studies, project administrative records, government ministries, other NGOs, universities / research institutes, mass media.

83
Assess the relevance and reliability of sources for the evaluation with respect to:
Coverage of the target population Time period Relevance of the information collected Reliability and completeness of the data Potential biases
2.C. Look for reliable secondary sources, cont.
84
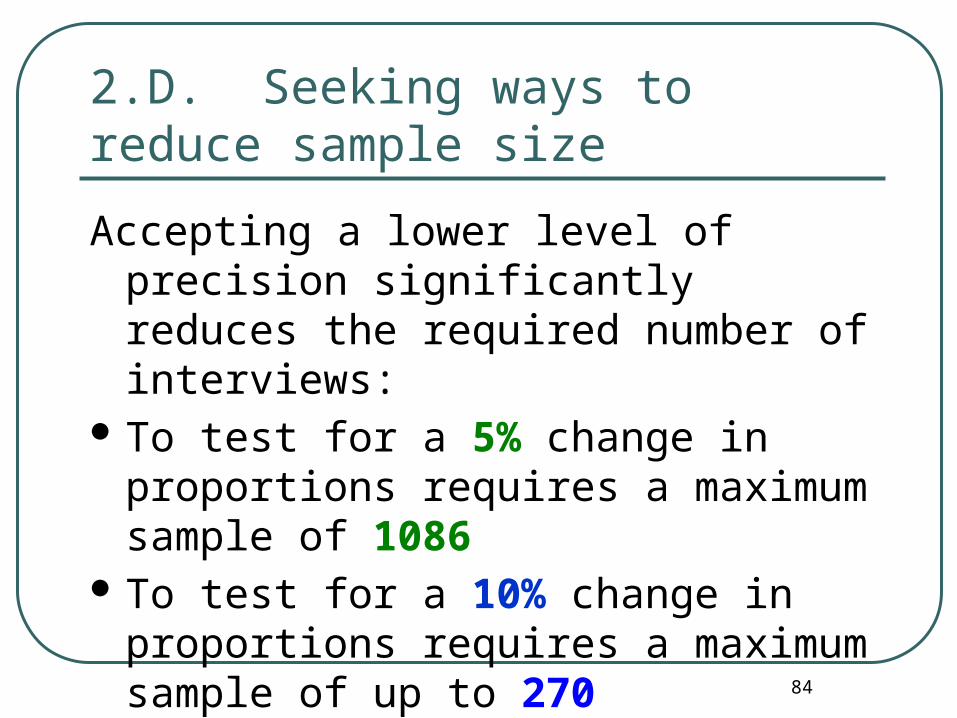
2.D. Seeking ways to reduce sample size
Accepting a lower level of precision significantly reduces the required number of interviews:
To test for a 5% change in proportions requires a maximum sample of 1086
To test for a 10% change in proportions requires a maximum sample of up to 270

86
2.E. Reducing costs of data collection and analysis
Use self-administered questionnaires Reduce length and complexity of
instrument Use direct observation Obtain estimates from focus groups and
community forums Key informants Participatory assessment methods Multi-methods and triangulation

87
Step 3: Addressing time constraints
In addition to Step 2 methods: Reduce time pressures on external
consultants • Commission preparatory studies• Video conferences
Hire more consultants/researchers Incorporate outcome indicators in project
monitoring systems and documents Technology for data inputting/coding

88
Addressing time constraints
It is important to distinguish between approaches that reduce the: a) duration in terms of time over the life of the project (e.g. from baseline to final evaluation over 5 years)b) duration in terms of the time needed to undertake the actual evaluation study/studies (e.g. 6 weeks, whether completed in an intensive consecutive 6 weeks or a cumulative total of 6 weeks periodically over the course of a year), and b) the level of effort (person-days, i.e. number of staff x total days required).

89
Addressing time constraints
Negotiate with the client to discuss questions such as the following:
1. What information is essential and what could be dropped or reduced?
2. How much precision and detail is required for the essential information? E.g. is it necessary to have separate estimates for each geographical region or sub-group or is a population average acceptable?
3. Is it necessary to analyze all project components and services or only the most important?
4. Is it possible to obtain additional resources (money, staff, computer access, vehicles etc) to speed up the data collection and analysis process?

90TIME FOR A BREAK ! 90

Step 4
Addressing data constraints
RealWorld Evaluation
Designing Evaluations under Budget, Time,
Data and Political Constraints

Step 4 Addressing data constraints
Step 1 Planning and Scoping the Evaluation
Step 2Addressing budget
constraints
Step 3
Addressing time constraints
Step 4Addressing data
constraints
Step 4Addressing data constraintsA. Reconstructing baseline dataB. Special challenges in working with
comparison groups.C. Collecting data on sensitive topicsD. Collecting data on difficult to
reach groups
Step 6 Assessing the strengths and weaknesses of the evaluation
design
Step 7 Strengthening the Evaluation Design
Step 5Addressing political
constraints

93
1. The importance of baseline data
Hard to assess change without data on pre-project conditions
Post-test comparisons do not fully address:• Selection bias: initial differences between participants
and non-participants • Propensity score matching and instrumental variables
partially addresses this
• Historical factors influencing outcomes that were assumed to have been caused by the project intervention

94
1. Ways to reconstruct baseline conditions
A. Secondary data.
B. Project records.
C. Recall
D. Key informants
E. PRA and other participatory techniques such as timelines, and critical incidents to help establish the chronology of important changes in the community

95
1-A. Assessing the utility of potential secondary data
Reference period Population coverage Inclusion of required indicators Completeness Accuracy Free from bias

96
1-A. Using secondary data to reconstruct baselines
Census Surveys Project administrative data Agency reports Special studies by NGOs, donors University studies Mass media (newspapers, radio, TV)

97
1-B. Using project records
Types of data Feasibility/planning studies Application/registration forms Supervision reports Management Information System (MIS) data Meeting reports Community and agency meeting minutes Progress reports Construction costs
98
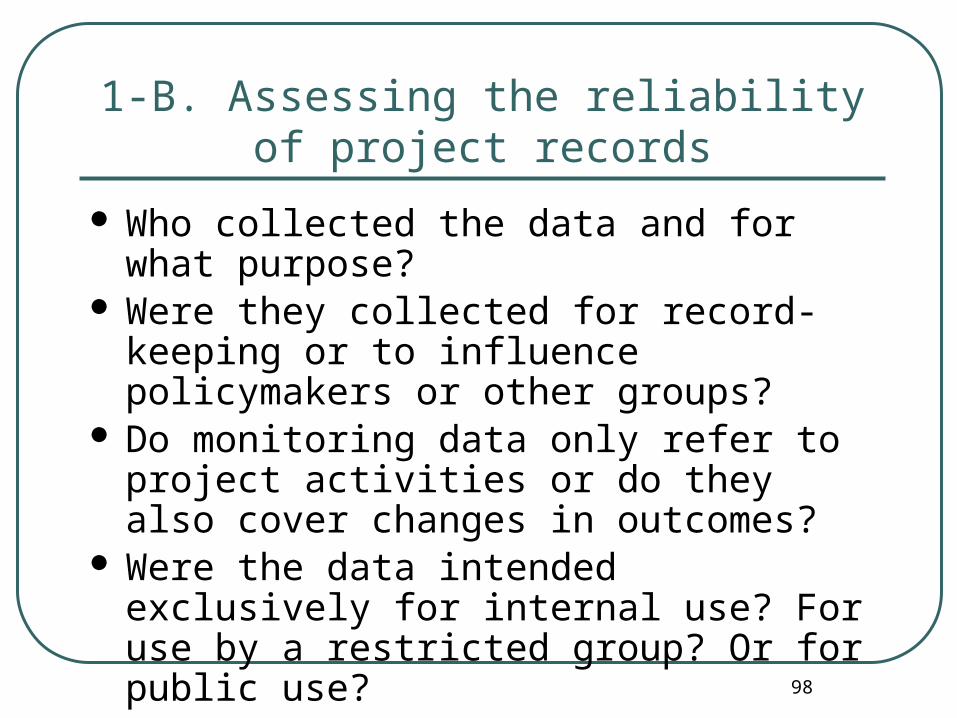
1-B. Assessing the reliability of project records
Who collected the data and for what purpose?
Were they collected for record-keeping or to influence policymakers or other groups?
Do monitoring data only refer to project activities or do they also cover changes in outcomes?
Were the data intended exclusively for internal use? For use by a restricted group? Or for public use?

99
1-B. Assessing the reliability of project records
How accurate and complete are the data? Are there obvious gaps? Were these intentional or due to poor record-keeping.
Potential biases with respect to the key indicators required for the impact evaluation?

100
1-B. Working with the client to improve the utility of project monitoring data for evaluation
Collecting additional information on applicants or participants
Ensure identification data is included and accurate.
Ensure data organized in the way needed for evaluation [by community/ types of service/ family rather than just individuals/ economic level etc]
101
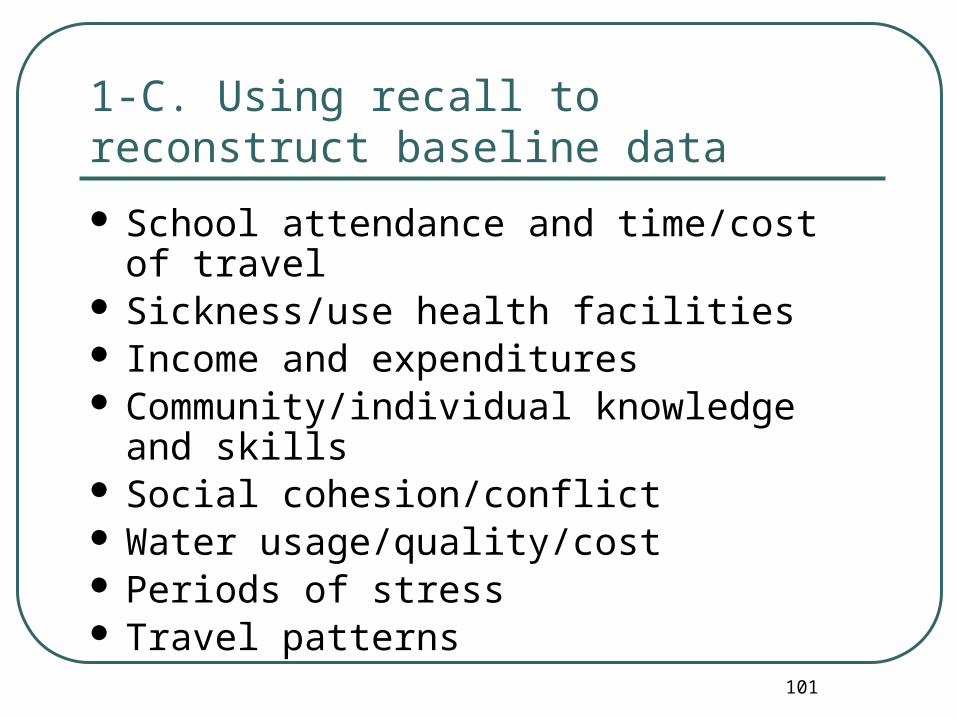
1-C. Using recall to reconstruct baseline data
School attendance and time/cost of travel Sickness/use health facilities Income and expenditures Community/individual knowledge and skills Social cohesion/conflict Water usage/quality/cost Periods of stress Travel patterns

102
1-C. Where Knowledge about Recall is Greatest
Areas where most research has been done on the validity of recall• Income and expenditure surveys• Demographic data and fertility behavior
Types of Questions• Yes/No; fact• Scaled• Easily related to major events

103
1-C. Limitations of recall
Generally not reliable for precise quantitative data
Sample selection bias Deliberate or unintentional distortion Few empirical studies (except on
expenditure) to help adjust estimates.

104
1-C. Sources of bias in recall
Who provides the information Under-estimation of small and routine expenditures “Telescoping” of recall concerning major expenditures. Distortion to conform to accepted behavior.
• Intentional or unconscious• Romanticizing the past• Exaggerating (e.g. “We had nothing before this project came.”)
Contextual factors:• Time intervals used in question• Respondents expectations of what interviewer wants to
know Implications for the interview protocol

105
1-C. Improving the validity of recall
Conduct small studies to compare recall with survey or other findings.
Ensure all groups interviewed Triangulation Link recall to important reference events
• Elections• Drought/floods• Construction of road, school etc

111
1-F. Summary of issues in baseline reconstruction
Variations in reliability of recall. Memory distortion. Secondary data not easy to use Secondary data incomplete or unreliable. Key informants may distort the past

112
2. Reconstructing comparison (control) groups

113
2. Ways to reconstruct control groups
Judgmental matching of communities. When phased introduction of project
services beneficiaries entering in later phases can be used as “pipeline” control group.
Internal controls when different subjects receive different combinations and levels of services

114
2. Using propensity scores to strengthen comparison groups
Propensity score matching Rapid assessment studies can compare
characteristics of project and control groups using:• Observation• Key informants• Focus groups• Secondary data• Aerial photos and GIS data

115
2. Using propensity scores to strengthen comparison groups
Logistical regression (Logit) on project and comparison population to identify determinants of project participation
Select “nearest neighbors” (usually around 5) from comparison group who most closely match a participant.
Project impact = gain score = difference between project participant score and mean score for nearest neighbors.

116
Issues in reconstructing control groups Project areas often selected purposively and
difficult to match. Differences between project and control
groups - difficult to assess if outcomes due to project or to these initial differences.
Lack of good data to select control groups Contamination Econometric methods cannot fully adjust for
initial differences between the groups [unobservables].

Pause for DISCUSSION

Mixed-method evaluation
RealWorld Evaluation
Designing Evaluations under Budget, Time,
Data and Political Constraints

120
I. Mixed Method Designs
1. Quantitative data collection methods
Structured surveys (household, farm, transport usage, etc)
Structured observation Anthropometric methods Aptitude and behavioral tests

121
1. Quantitative data collection methodsStrengths and weaknesses
Strengths Statistically representative Generalization Estimate magnitude and
distribution of impacts Clear documentation of
methods Standardized approach Statistical control of bias and
external factors
Weaknesses Surveys cannot capture many
types of information Do not work for difficult to reach
groups Lack analysis of context Survey situation may alienate Long delay in obtaining results Data reduction loses information

122
2. Qualitative data collection methods
Interviewing ObservationAnalysis of Documents
and Artifacts
Structured Semi-structured Unstructured Focus groups Community
interviews Participatory Rapid
Appraisal (PRA) methods
Audio recording
Participant observation Structured observation Unstructured observation Photography and video
recording
Project documents Published reports E-mail Legal documents:
• birth and death certificates, • property transfer documents • marriage certificates
Posters Decorations in the house Clothing and gang insignia

123
2. Qualitative data collection methodsCharacteristics
The researcher’s perspective is an integral part of what is recorded about the social world
Scientific detachment is not possible Meanings given to social phenomena and situations
must be understood Programs cannot be studied independently of their
context Difficult to define clear cause and effect Change must be studied holistically

124
2. Qualitative data collection methodsStrengths and weaknesses
Strengths Flexible to evolve Sampling focuses on high
value subjects Holistic focus (“the big picture”) Multiple sources provide
complex understanding Narrative more accessible to
non-specialists Triangulation strengthens
validity of findings
Weaknesses Lack of clear design may
frustrate clients Lack of generalizability Multiple perspectives - hard to
reach consensus Individual factors not isolated. Interpretive methods appear too
subjective

125
3. Mixed method evaluation designs
Combine the strengths of both QUANT and QUAL approaches
One approach ( QUANT or QUAL) is often dominant and the other complements it
Can have both approaches equal but harder to design and manage.
Can be used sequentially or concurrently

It should NOT be a fight between pure
Qualoid!Quantoid!
QUANTITATIVE (numbers alone)OR
QUALITATIVE (verbiage alone)
126

127
“Your human
interest story
sounds nice, but
let me show you
the statistics.”
“Your numbers
look impressive,
but let me tell
you the human
interest story.”

What’s needed is the right combination of BOTH QUALITATIVE methods
AND QUANTITATIVE methods
128

Participatory approaches should be used as much as possible
but even they should be used with appropriate rigor: how many (and which) people’s perspectives contributed to the story? 129

130
3. Mixed method evaluation designsHow quantitative and qualitative methods
complement each other
A. Broaden the conceptual framework• Combining theories from different disciplines:• Exploratory QUAL studies can help define framework
B. Combine generalizability with depth and context• Random subject selection ensures representativity and generalizability• Case studies, focus groups, etc., can help understand the characteristics of
the different groups selected in the sample
C. Permit access to difficult to reach groups [QUAL]• PRA, focus groups, case studies, etc., can be effective ways to reach
women, ethnic minorities and other vulnerable groups• Direct observation can provide information on groups difficult to interview. For
example, informal sector and illegal economic activities
D. Enable Process analysis [QUAL]• Observation, focus groups and informal conversations are more effective for
understanding group processes or interaction between people and public agencies, and studying the organization

131
3. Mixed method evaluation designsHow quantitative and qualitative methods
complement each other (cont.)D. Analysis and control for underlying structural factors [QUANT]
• Sampling and statistical analysis can avoid misleading conclusions • Propensity scores and multivariate analysis can statistically control for
differences between project and control groups
Example: • Meetings with women may suggest gender biases in local firms’ hiring
practices; however,
• Using statistical analysis to control for years of education or experience may show there are no differences in hiring policies for workers with comparable qualifications
Example: • Participants who volunteer to attend a focus group may be strongly in
favor or opposed to a certain project, but• A rapid sample survey may show that most community residents have
different views

132
3. Mixed method evaluation designs How quantitative and qualitative methods
complement each other (cont.)
E. Triangulation and consistency checks• Direct observation may identify inconsistencies in interview responses• Examples:
• A family may say they are poor but observation shows they have new furniture, good clothes, etc.
• A woman may say she has no source of income, but an early morning visit may show she operates an illegal beer brewing business
F. Broadening the interpretation of findings:• Combining personal experience with “social facts”• Statistical analysis frequently includes unexpected or interesting
findings which cannot be explained through the statistics. Rapid follow-up visits may help explain the findings

133
3. Mixed method evaluation designs How quantitative and qualitative methods
complement each other (cont.)
G. Interpreting findings
Example:• A QUANT survey of community water management in
Indonesia found that with only one exception all village water supply was managed by women
• Follow-up visits found that in the one exceptional village women managed a very profitable dairy farming business – so men were willing to manage water to allow women time to produce and sell dairy produceSource: Brown (2000)
134
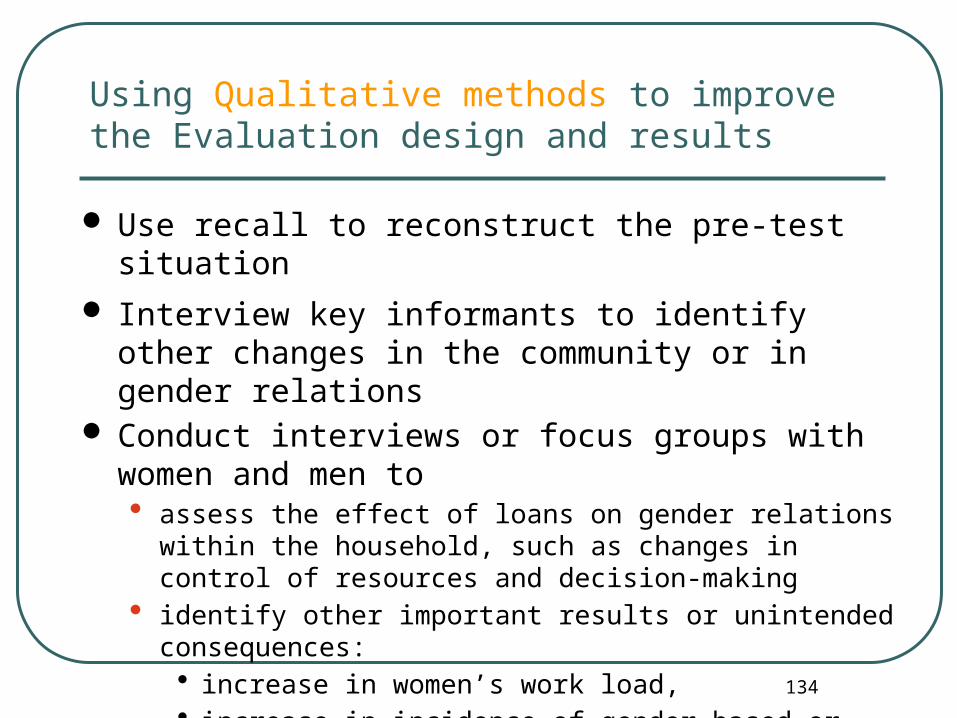
Using Qualitative methods to improve the Evaluation design and results
Use recall to reconstruct the pre-test situation
Interview key informants to identify other changes in the community or in gender relations
Conduct interviews or focus groups with women and men to • assess the effect of loans on gender relations within the
household, such as changes in control of resources and decision-making
• identify other important results or unintended consequences: • increase in women’s work load, • increase in incidence of gender-based or domestic violence

Questions?135

Enough of my presentations: it’s time
for you (THE RealWorld PEOPLE!)
to get involved yourselves.

Time for small-group work. Read your case
studies and begin your discussions. (To be
continued after lunch.)

138
Small group case study work
1. Some of you are playing the role of evaluation consultants, others are clients commissioning the evaluation.
2. Decide what your group will propose to do to address the given constraints/ challenges.
3. Prepare to negotiate the ToR with the other group (later this afternoon).

139
Step 6Identifying and addressing threats to the validity of the
evaluation design and conclusions
RealWorld Evaluation
Designing Evaluations under Budget, Time,
Data and Political Constraints

The Real World Evaluation [RWE] Approach
Step 2Addressing budget constraints
Step 3 Addressing time constraints
Step 4 Addressing data constraints
Step 7 Helping clients use the evaluation
Step 1Planning and scoping the evaluation
Step 5Addressing political influences
Step 6 Strengthening the evaluation design and the validity of the conclusions
A. Identifying threats to validity of quasi-experimental designsB. Assessing the adequacy of qualitative designsC. An integrated checklist for mixed-method designsD. Addressing threats to quantitative evaluation designsE. Addressing threats to the adequacy of qualitative designsF. Addressing threats to mixed-method designs
Step 6Strengthening the evaluation design
and validity

1. What is validity and why does it matter?

142
Defining validity
The degree to which the evaluation findings and recommendations are supported by:
The conceptual framework describing how the project is supposed to achieve its objectives
Statistical techniques (including sample design) How the project and the evaluation were
implemented The similarities between the project population and
the wider population to which findings are generalized

143
Evaluations provide recommendations for future decisions and action. If the findings and interpretation are not valid:
Programs which do not work may continue or even be expanded
Good programs may be discontinued Priority target groups may not have
access or benefit
Importance of validity

144
RWE quality control goals The evaluator must achieve greatest possible
methodological rigor within the limitations of a given context
Standards must be appropriate for different types of evaluation
The evaluator must identify and control for methodological weaknesses in the evaluation design.
The evaluation report must identify methodological weaknesses and how these affect generalization to broader populations.

145
2. General guidelines for assessing the validity of all evaluation designs[see Overview Handout Appendix 1, p. 69]
A. ConfirmabilityB. ReliabilityC. CredibilityD. TransferabilityE. Utilization

146
A. Confirmability
Are the conclusions drawn from the available evidence and is the research relatively free of researcher bias?
Examples: A-1: Inadequate documentation of methods and
proceduresA-2: Is data presented to support the conclusions and
are the conclusions consistent with the findings? [Compare the executive summary with the data in the main report]

147
B. Reliability
Is the process of the study consistent, reasonably stable over time and across researchers and methods?
Examples:
B-2: Data was only collected from people who attended focus groups or community meetings
B-4: Were coding and quality checks made and did they show agreement?

148
C. Credibility
Are the findings credible to the people studied and to readers? Is there an authentic picture of what is being studied?
Examples:
C-1: Is there sufficient information to provide a credible description of the subjects or situations studied?
C-3: Was triangulation among methods and data sources systematically applied? Were findings generally consistent? What happened if they were not?

149
D. Transferability (generalizability)
Do the conclusions fit other contexts and how widely can they be generalized?
Examples:
D-1: Are the characteristics of the sample described in enough detail to permit comparisons with other samples?
D-4: Does the report present enough detail for readers to assess potential transferability?

150
E. Utilization
Were findings useful to clients, researchers and communities studied?
Examples:E-1: Were findings intellectually and
physically accessible to potential users?
E-3: Do the findings provide practical guidance for future action?

151
3. Additional threats to validity for Quasi-Experimental Designs [QED][see Overview Handout Appendix 2]
F. Threats to statistical conclusion validity why inferences about statistical association between two variables (for example project intervention and outcome) may not be valid
G. Threats to internal validity why assumptions that project interventions have caused observed outcomes may not be valid
H. Threats to construct validity why selected indicators may not adequately describe the constructs and causal linkages in the evaluation model
I. Threats to external validity why assumptions about the potential replicability of a project in other locations or with other groups may not be valid

Example of threat to internal validity: The assumed causal model
Women join the village bank where they receive loans, learn skills and gain self-confidence
WHICH ………
Increases women’s income
Increases women’s control over
household resources

An alternative causal model
Some women had
previously takenliteracy training which increased
their self- confidence and
work skills
Women who had taken literacy training are more likely to join the village bank.
Their literacy and self-confidence makes
them more effectiveentrepreneurs
Women’s income and control over
household resourcesincreased as a
combined result of literacy, self-
confidence and loans

158
RealWorld Evaluation book
• Appendix 2 gives a worksheet for assessing the quality and validity of an evaluation design
• Appendix 3 gives a worked examples

Lightning feedback
What are some of the most serious threats to validity affecting your evaluations?
How can they be addressed?

Time for small groups to meet together to
negotiate the ToRs for the evaluation of the
housing project.166

167
In conclusion:
Evaluators must be prepared to:1. Enter at a late stage in the project cycle;2. Work under budget and time restrictions;3. Not have access to comparative baseline
data;4. Not have access to identified comparison
groups;5. Work with very few well qualified evaluation
researchers;6. Reconcile different evaluation paradigms and
information needs of different stakeholders.

168
Main workshop messages1. Evaluators must be prepared for realworld
evaluation challenges
2. There is considerable experience to draw on
3. A toolkit of rapid and economical “RealWorld” evaluation techniques is available (see www.RealWorldEvaluation.org)
4. Never use time and budget constraints as an excuse for sloppy evaluation methodology
5. A “threats to validity” checklist helps keep you honest by identifying potential weaknesses in your evaluation design and analysis

169
Thank you!
169