1. rÉsume de la proposition de projet proposal...
TRANSCRIPT

1. RÉSUME DE LA PROPOSITION DE PROJET / PROPOSAL ABSTRACT
In 2006, the funding of the TOMOGLOB project by the ANR ''young researcher'' program led to the creation of the first global SH-wave tomographic model of the mantle constrained by a finite frequency theory applied to a travel time dataset measured in several frequency bands (Zaroli, 2010). In addition, the TOMOGLOB project allowed us to build one of the best resolved SV-wave tomographic model of the upper mantle and transition zone (Debayle and Ricard, 2010). Finally, we were able to show the global character of the low velocity layer located atop the 410 km discontinuity, a result that has just been published in Nature Geoscience (Tauzin et al., 2010). These results were made possible through the construction of three databases : a first database for the dispersion of the fundamental and first higher modes of Rayleigh waves (sensitive to the SV wave-speed), a second database for long period SH-type body waves (S, ScS and SS) measured in different frequency bands, and a third database for waves reflected and converted at the 410-km and 660-km discontinuities.
The current project aims at exploiting these recent results and the expertise of a young and motivated scientific team in order to improve S-wave imaging of the Earth mantle. This requires to complete the S-wave databases which have been built as part of the TOMOGLOB project. We aim to add a database of normal mode observations, including the existing observations and our own observations using data provided by several very large earthquakes recorded in the last 5 years. These new data will provide new constraints on the long wavelength pattern of SH and SV-wave heterogeneities, as well as on the attenuation and density structure. We also propose to build a comprehensive database for Love wave fundamental and higher mode dispersion curves in order to constrain SH-wave heterogeneities in the upper mantle. Finally, we propose to build a global database of long period SV-type body waves measured in different frequency bands.
These databases will first allow us to build an S-wave tomographic model from the simultaneous inversion of surface waves, normal modes and long period body waves. This model will be the first model of this type built in France, as the simultaneous inversion of these three types of data has so far been performed only by a limited number of US groups (Harvard, Caltech, Berkeley).
We will then built other seismic models by applying more sophisticated modelling to different subsets of our data. We will apply a finite frequency theory to our Rayleigh and Love wave dataset in order to improve resolution in the upper mantle and transition zone. Similarly, we will apply a finite frequency theory to our global dataset of long period SV and SH waves in order to refine seismic imaging in the lower mantle. By inverting data that are sensitive to SV and SH waves, we will extract an information on the 3D distribution of radial anisotropy in the Earth mantle. Finally, we will develop techniques to invert surface wave attenuation and normal mode. The project also incorporates an exploratory part on laboratory measurements of S-wave attenuation at high pressure and temperature which should stimulate discussions on the interpretation of attenuation.
This kind of model is expected to have an important impact on the community. It will contribute to answering geodynamical questions of primordial importance concerning the size of convection cells, vertical circulation within the mantle and material exchange between upper and lower mantle, and the existence of hidden reservoirs in the lower mantle. A detailed knowledge of the geometry and amplitude of seismic anomalies within the mantle is of fundamental importance for constraining the physical parameters and the forms of mantle convection.
2. CONTEXTE, POSITIONNEMENT ET OBJECTIFS DE LA PROPOSITION / CONTEXT, POSITIONNING AND OBJECTIVES OF THE PROPOSAL
2.1. CONTEXTE DE LA PROPOSITION DE PROJET / CONTEXT OF THE PROPOSAL
A major paradox in Earth sciences is the contrast between the geochemical evidence for limited mass-exchange between lower and upper mantle, and the geophysical arguments for significant mass exchange. Tomography has already shown evidence for slabs penetrating into the lower mantle. However, seismic evidences for deep mantle plumes remain controversial and the amount of exchange between upper and lower mantle is unknown. It is crucial that the mantle, especially

the boundary between upper and lower mantle, be imaged at greater precision. This requires both observational and methodological efforts.
Until 2000, seismic models were based on ray theory, an infinite frequency approximation which implies that all the sensitivity of the wave is confined to the ray. In the last ten years, efforts have been directed toward the development of more sophisticated theories that take into account the fact that seismic waves have a finite frequency. Until now, these finite frequency approaches have resulted in small improvements of the tomographic models. Although mantle plume detections was announced by the Princeton group and attributed to the use of a finite-frequency theory (Montelli et al., 2004), this finding remains controversial, because the effect of the improved theory is believed to be smaller than that of practical considerations such as the level of damping, the weighting of different data sets and the choice of data fit (van der Hilst and de Hoop, 2005).
The most promising finite-frequency approaches use numerical methods for forward calculations (Komatitsch et al., 2002) and the adjoint approach for the inversion (Tarantola, 1987,1988). Progress is however very slow and large scale tomographic applications are currently limited to a few thousands paths analysed at periods greater than 50 s where the dominant part of the signal correspond to surface waves (Fichtner et al., 2009). At the same time, global surface wave tomography using ray theory now includes 400 000 paths (Debayle et al., 2010) which can be coupled with similar amount of long period body-wave data (Zaroli et al. 2010). For surface waves, the benefit of using 3D kernels based on single scattering theory is currently balanced by a reduction in the number of data, due to the difficulty in properly processing 400 000 fundamental and higher mode surface waves with a finite frequency theory. The benefit is larger for long period S-wave, which are more severely affected by wavefront healing, and for which single scattering kernels open the way for multiple frequency analysis (Zaroli et al., 2010). Again, improvement is small, and it remains therefore sensible to use ray theory for large scale global tomography combining different datasets.
The present project builds up on the expertise of a motivated team, and on a unique travel-time database of long period body and surface waves, Pds converted and SS precursors waves, assembled during the TOMOGLOB project. It aims to :
1) Complete our current S-wave database with new surface waves, multiple frequency body-waves and normal mode observations, for future inversions of S-wave velocity, seismic anisotropy and attenuation.
2) Use these databases to built improved seismic models of the Earth mantle.3) Explore the effect of new finite frequency approaches on these models.4) Obtain a multidisciplinary interpretation of new tomographic results through intensive interaction
with geodynamicists and geochemists.
This project using S waves nicely complete the efforts developed by the Nice group to achieve a better mapping of 3D P-wave structure through the deployment of hydrophone-equipped floats.
2.2. ÉTAT DE L'ART ET POSITION DE LA PROPOSITION DE PROJET / STATE OF THE ART AND POSITIONNING OF THE PROPOSAL
Different kinds of approaches are commonly used to investigate the mantle seismic structure at global scale. Surface waves are well suited to determine upper mantle S-wave velocity (e.g. Montagner and Tanimoto, 1991; Debayle et al. 2005), while teleseismic body waves penetrate deeper and provide a good sampling of the lower mantle both for P (e.g. van der Hilst et al. 1997) or S-waves (Grand et al., 1997). Reflected (Flanagan and Shearer, 1998) and converted (Tauzin et al, 2008) body waves can also be used to determine the topography of the different seismic discontinuities. These different seismic approaches have provided important constraints on mantle dynamics.
Since the pioneer work of Woodhouse and Dziewonski, (1984) the lateral resolution of surface wave velocity and anisotropy models of the upper mantle has decreased from 5000 km (Nataf et al., 1984) to about 1000 km in the most recent seismic models, allowing the caracterisation of lithospheric thickness variations and the identification of different anisotropic behaviours among continents (Debayle et al., 2005). At greater depths, global body-wave travel-time tomography has

revealed a variety of behaviours of lithospheric slabs, some stagnant around the 670 km discontinuity whereas others penetrate into the lower mantle (e.g. Fukao et al. 2001).
Although the mantle has been the object of intensive study by seismologists over the past 30 years, these studies are often focused on small regions, depending on the seismological tools used. 3D global tomographic models of the entire mantle have only been built by a limited number of groups (e.g. Harvard, Caltech, Berkeley, Utrecht, Tokyo...), and only a handful of them have tried to combine body waves, surface waves and normal modes. These models are long period S-wave models, because global coverage of the upper mantle can currently be achieved only with surface waves, which constrain S-wave, but not P-wave velocity. This situation may evolve in the next ten years : one major goal of the ERC project leaded by Guust Nolet in Nice, is to improve the global P-wave coverage by expanding seismic data acquisition in the oceans through the development of hydrophone-equipped floats. The recent move of Guust Nolet to Nice has initiated a new dynamic in the french community.
Our project focus on improving global S-wave tomography. It builds upon the unique S-wave database assembled during the TOMOGLOB project, a ‘‘young researcher ANR project’’ granted in 2006 for four years and leaded by Eric Debayle. TOMOGLOB has allowed us to measure in a consistent manner the phase velocity and attenuation curves up to the 5th overtone for 357143 Rayleigh waveforms (Debayle et al., 2010). We have also built a global database of converted and reflected waves at the 410 and 660 km discontinuity (Tauzin et al., 2010). Finally, we have built the first global dataset of about ∼400 000 long period S-wave travel-times measured in different frequency band (Zaroli et al., 2010). These achievements have allowed us to : 1) built an SV model of the upper mantle with improved resolution within the transition zone (Debayle et al., 2010); 2) demonstrate the global character of a low velocity layer located atop the 410-km discontinuity, a result just published in Nature Geoscience (Tauzin et. al., 2010); 3) show the role of the garnet phase transition on the topography of the 660 km discontinuity in the vicinity of some mantle plumes (Tauzin et al., 2008); 4) demonstrate that a residual dispersion, which is at least partly related to seismic heterogeneity and attenuation, is present in long period S-wave (Zaroli et al., 2010); 5) built the first multiple frequency global S-wave tomographic model of the entire mantle (Zaroli, 2010). They place us in a leading position to tackle new challenges in global S-wave tomography in the next four years. Figures 1-3 summarise some of the major results of The TOMOGLOB project.
Figure 1 : Slices in the Debayle et al., (2010) SV-wave tomographic model. SV-wave perturbations (in per cent relative to the reference value on each map) are represented with the colour scale. Black bars indicate

fast anisotropic directions and have lengths proportional to the maximum amplitude of azimuthal anisotropy (bar length for 2% peak to peak anisotropy shown at top of each map).
Figure 2 : Slices in Zaroli (2010) S-wave tomographic model. This model is the first multiple frequency global S-wave tomographic model of the entire mantle.
Figure 3 : a) Detection of a low velocity layer (LVL) located atop the 410-km discontinuity. Stations where the LVL is detected are shown with red stars. Our strongest observations are outlined with red circles. Black triangles indicate stations where the LVL is not observed. b) Global map of the estimated LVL thickness. These results have just been published in Nature Geoscience (Tauzin et al., 2010).
Our understanding of mantle dynamics requires high resolution 3D seismic images of the entire mantle that can be compared directly with geodynamic simulations and interpreted using geochemical findings. We will adopt a pragmatic approach and built upon the unique dataset provided by TOMOGLOB. By adding new S-wave observations, we aim to shift towards models including S-wave velocity, radial anisotropy and attenuation of the Earth mantle. Eric Debayle will coordinate the project from Lyon and lead the surface wave researches. Christophe Zaroli, currently a post-doc in geoscience azur, Nice, will lead the task on acquisition and inversion of long period S-wave datasets. Sophie Lambotte is Physicienne Adjointe in Strasbourg and will lead the task devoted to the incorporation of new normal mode constraints.
2.3. OBJECTIFS ET CARACTÈRE AMBITIEUX ET/OU NOVATEUR DE LA PROPOSITION DE PROJET / OBJECTIVES, ORIGINALITY AND/OR NOVELTY OF THE PROPOSAL
LETTERS NATURE GEOSCIENCE DOI: 10.1038/NGEO969
LVL thickness (km)
LVL
a
b
20 40 60 80 100
LVL LVL notpossible observed
Figure 3 |Mapping the layer atop the 410-km discontinuity. a, Global map
of the LVL. Stations where the LVL is detected are shown with red stars.
Our strongest observations (see Methods section) are outlined with red
circles. Black triangles indicate stations where the LVL is not observed.
b, Global map of the estimated LVL thickness.
our experiments show that in the range of observable thicknesses(>20 km), a close fit to the observed signal is obtained, assuming a0.2 km s−1 downward shear-wave velocity decrease (Fig. 2c,d).
The LVL is found beneath all continents and, despite a sparsesampling of the oceans, at a few oceanic stations (Fig. 3a andSupplementary Fig. S3). The LVL is not related to a particular typeof geodynamical environment atop the ‘410’: it is found below 34stations located in the vicinity of large igneous provinces (LIPs) orhotspots, below 9 stations located in the vicinity of deep subductionzones and below 46 stations located away from recent volcanismand subduction (Supplementary Figs S4, S5). Also, among the63 stations where it is not observed, 21 are located near LIPs orhotspots, 7 are in the vicinity of recent subduction zones and 37are located away from LIPs, hotspots and subduction. Finally, thedetection of the LVL is not correlated to a particular subdivision ofthe lithosphere according to its age24 (Supplementary Fig. S6).
The LVL thickness varies from ∼30 to ∼100 km. Variations ex-ceeding 20 km at stations distant by∼200 km are frequent (Fig. 3b).Furthermore, the LVL can disappear over short distances (Fig. 3a),as can be seen in regions where the station coverage is dense, such asNorth America, Europe and Asia. Short-scale horizontal variationsfrom a thick (>30 km) to a thin layer, undetectable with ourdata, could explain these differences. Our results can be comparedwith two previous regional studies of the LVL in the western US(refs 9,15) (see Supplementary Fig. S1). From the dense networks ofstations available in this region, the LVL atop the ‘410’ was found tochange rapidly in thickness over length scales of about 100–200 km.Our global observations indicate that thickness variations oversimilar length scales could be present at a global scale.
Our observations indicate a compositional origin for the LVL:lateral variations of the LVL thickness are difficult to reconcilewith the effect of temperature alone. Furthermore, there is no
correlation between the presence of a LVL and the depth of the‘410’ (Fig. 1a) or the transition zone thickness, which are supposedto be markers of the temperature. Partial melting is the mostprobable candidate1–3,5–9 and can be explained by either high waterconcentrations, which decrease the solidus temperature of mantlerocks under the Earth geotherm, or anomalously high temperaturesexceeding the dry solidus of mantle silicate rocks.
A subset of our observations located in the vicinity of subductionzones may be explained by dehydration, either due to volatileentrainment by subduction1 to the top of the ‘410’, or to bottom-upwater release from a stagnant slab in the mantle transition zone(MTZ; refs 9,17). Another subset could be attributed to the effect ofhigh temperatures on water rich mantle silicate rocks, as has beensuggested in previous Sp studies2,12,13. Our results, on the basis ofa larger sampling of the Earth mantle, indicate however that theLVL is not solely found beneath subduction zones or Precambrianplatforms in associationwithMesozoic orCenozoicmantle plumes.
The transition zone water filter (TZWF) model3,4 predicts theexistence of a partial-melt layer atop the ‘410’, extending over greatareas, and could explain a greater variety of our observations. Inthis model, a global diffuse vertical ascendant flow is transmitted tothe material of the MTZ to compensate the excess mass penetratinginto the deep mantle under the subduction zones. On reachingthe pressure condition of the phase transition at 410 km depth,phase transforming and hydrated MTZ minerals would becomewater saturated or super-saturated as a result of the weaker waterstorage capacity of the upper mantle minerals25. The high watercontent of the rocks above the ‘410’ would decrease the wet solidustemperature under the Earth geotherm and initiate partial meltingeven without anomalously high temperatures.
However, this model also predicts a reduced LVL thickness inthe vicinity of mantle plumes, due to high ascent velocities orto a thermally induced decrease of the water solubility in MTZminerals26. This reduced thickness is not observed in our data, as wefind a ‘thick’ (>30 km) LVL in the vicinity of several possiblemantleplumes (for example, the Afar plume on Fig. 3b).
Our observations of a ‘thick’ LVL atop the 410-km discontinuityin various regions of the world, including the vicinity of mantleplumes, remain to be explained. Short-scale variations in the LVLthickness indicate a possible lens-type structure with localized thickpockets of partial melt. Our results show that the development ofsuch pockets is not specific to a particular geodynamical environ-ment and seems to be largely controlled by local conditions near the410-kmdiscontinuity. It is possible that we sample the thickest partsof a global partial melt layer showing rapid variations in thickness.If the melt layer has a global character, it must change global mantlecirculation and geochemistry, for instance by filtering incompatibleelements3. Melt distribution and interconnectivity play an impor-tant role in the stability and steady-state thickness of a melt layer27.A recent work28 suggests that grain boundary tension may preventsimple gravitational settling of a heavy melt into a thin completelydecompacted layer, and may give rise to a thicker boundary layer.The effect of grain boundary tension is modulated by the grain sizeand the matrix viscosity, which can vary by orders of magnitudein the Earth mantle. Consequently, the steady state thickness of thedensemelt-rich layer will also show substantial variation.
Methods
The receiver functions are time series showing the elastic response to an excitationof the Earth structure beneath the receivers. These RFs are computed fromseismograms filtered in four period ranges ([3; 75] s, [5; 75] s, [7; 75] s, [10;75] s) using a methodology explained in ref. 19. The type of filtering (forwardand reverse using linear-phase Butterworth filters) enables us to reduce signalphase distortions on the seismograms. The deconvolution method20 is chosento reduce frequency-dependent artefacts (side-lobes) on the RFs. During thedeconvolution20 process, the RFs are normalized so that Ps amplitudes areexpressed as a percentage of the P-wave amplitude. At a given station, the RFs are(1) stacked20 in the time domain and (2) time-to-depth converted20 using a 3D
720 NATURE GEOSCIENCE | VOL 3 | OCTOBER 2010 | www.nature.com/naturegeoscience
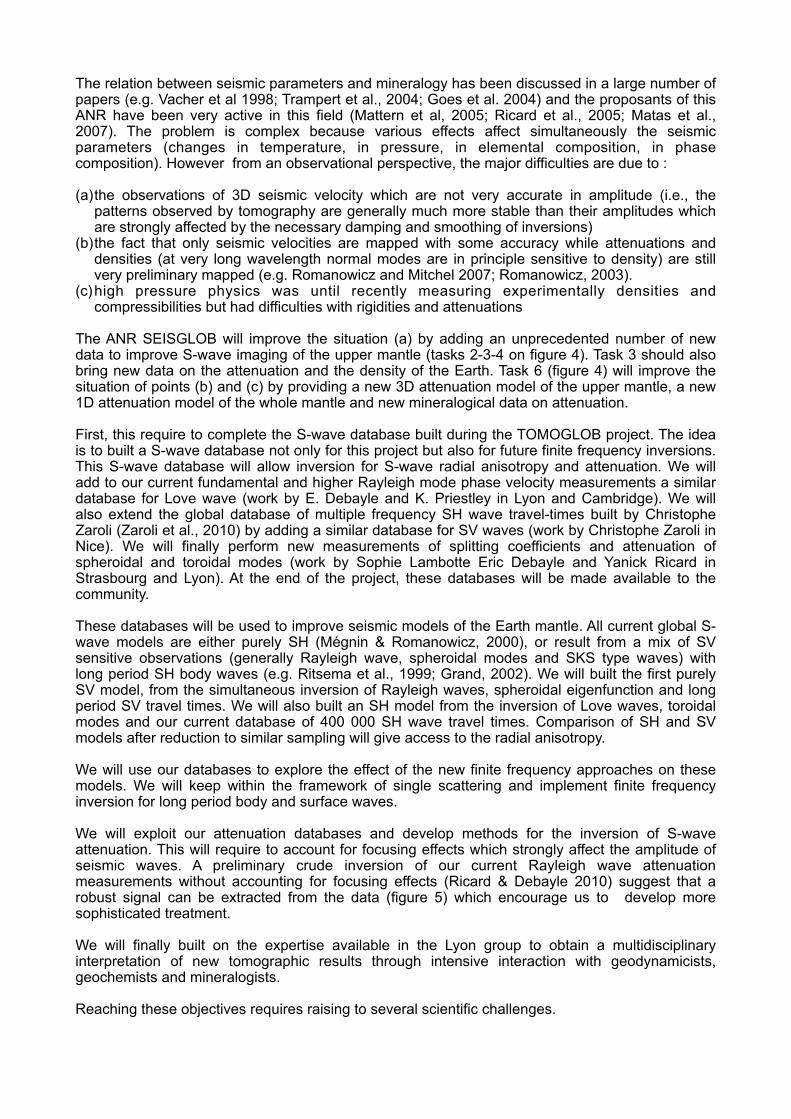
The relation between seismic parameters and mineralogy has been discussed in a large number of papers (e.g. Vacher et al 1998; Trampert et al., 2004; Goes et al. 2004) and the proposants of this ANR have been very active in this field (Mattern et al, 2005; Ricard et al., 2005; Matas et al., 2007). The problem is complex because various effects affect simultaneously the seismic parameters (changes in temperature, in pressure, in elemental composition, in phase composition). However from an observational perspective, the major difficulties are due to :
(a)the observations of 3D seismic velocity which are not very accurate in amplitude (i.e., the patterns observed by tomography are generally much more stable than their amplitudes which are strongly affected by the necessary damping and smoothing of inversions)
(b)the fact that only seismic velocities are mapped with some accuracy while attenuations and densities (at very long wavelength normal modes are in principle sensitive to density) are still very preliminary mapped (e.g. Romanowicz and Mitchel 2007; Romanowicz, 2003).
(c)high pressure physics was until recently measuring experimentally densities and compressibilities but had difficulties with rigidities and attenuations
The ANR SEISGLOB will improve the situation (a) by adding an unprecedented number of new data to improve S-wave imaging of the upper mantle (tasks 2-3-4 on figure 4). Task 3 should also bring new data on the attenuation and the density of the Earth. Task 6 (figure 4) will improve the situation of points (b) and (c) by providing a new 3D attenuation model of the upper mantle, a new 1D attenuation model of the whole mantle and new mineralogical data on attenuation.
First, this require to complete the S-wave database built during the TOMOGLOB project. The idea is to built a S-wave database not only for this project but also for future finite frequency inversions. This S-wave database will allow inversion for S-wave radial anisotropy and attenuation. We will add to our current fundamental and higher Rayleigh mode phase velocity measurements a similar database for Love wave (work by E. Debayle and K. Priestley in Lyon and Cambridge). We will also extend the global database of multiple frequency SH wave travel-times built by Christophe Zaroli (Zaroli et al., 2010) by adding a similar database for SV waves (work by Christophe Zaroli in Nice). We will finally perform new measurements of splitting coefficients and attenuation of spheroidal and toroidal modes (work by Sophie Lambotte Eric Debayle and Yanick Ricard in Strasbourg and Lyon). At the end of the project, these databases will be made available to the community.
These databases will be used to improve seismic models of the Earth mantle. All current global S-wave models are either purely SH (Mégnin & Romanowicz, 2000), or result from a mix of SV sensitive observations (generally Rayleigh wave, spheroidal modes and SKS type waves) with long period SH body waves (e.g. Ritsema et al., 1999; Grand, 2002). We will built the first purely SV model, from the simultaneous inversion of Rayleigh waves, spheroidal eigenfunction and long period SV travel times. We will also built an SH model from the inversion of Love waves, toroidal modes and our current database of 400 000 SH wave travel times. Comparison of SH and SV models after reduction to similar sampling will give access to the radial anisotropy.
We will use our databases to explore the effect of the new finite frequency approaches on these models. We will keep within the framework of single scattering and implement finite frequency inversion for long period body and surface waves.
We will exploit our attenuation databases and develop methods for the inversion of S-wave attenuation. This will require to account for focusing effects which strongly affect the amplitude of seismic waves. A preliminary crude inversion of our current Rayleigh wave attenuation measurements without accounting for focusing effects (Ricard & Debayle 2010) suggest that a robust signal can be extracted from the data (figure 5) which encourage us to develop more sophisticated treatment.
We will finally built on the expertise available in the Lyon group to obtain a multidisciplinary interpretation of new tomographic results through intensive interaction with geodynamicists, geochemists and mineralogists.
Reaching these objectives requires raising to several scientific challenges.

A first challenge is to built a global database of long period SV body wave travel times. This is not trivial because the P and SV wavefields are coupled and numerous interference with P waves are present on the seismograms. However, this problem can be solved with the methods developed by Christophe Zaroli. These have proved to be very efficient in selecting the phases and rejecting spurious signals (Zaroli et al., 2010). It is likely that interference with P waves will result in a larger number of rejections, with a poorer sampling than in the case of SH. However, we hope to achieve a reasonable coverage using S, SS SSS and SKS waves.
A second challenge will be the inversion for a quality factor of the Earth. We will probably focus in this project on Rayleigh waves and spheroidal modes which provide the most robust observations. We believe that our database of 357143 Rayleigh waveforms contains a large amount of information that can be extracted with a bit of methodological developments. We will not measure the amplitude of long period SV waves.
A third challenge is to implement a finite frequency inversion workable on very large (about 400 000 Rayleigh wave) datasets. This will require significant optimisation of the tomographic codes and significant computational facilities.
The project will make various databases available to the community (figure 4) :
1) Secondary observables for vertical polarised shear waves (SV) :-Surface waveform modelling of phase velocity and attenuation (~1/2 million observations
already processed during the ANR TOMOGLOB)-Body wave arrival times measured in various frequencies (Zaroli, task 4)- Low frequency spheroidal mode observations (frequencies, splitting, attenuation) (Lambotte +
post-doc, task 3)
2) Secondary observables for horizontally polarised shear waves (SH) :-Surface waveform modelling of phase velocity and attenuation (Debayle, task 2)-Body wave arrival times measured in various frequencies (~100 000 observations times 4
frequencies already processed during the ANR TOMOGLOB)- Low frequency toroidal mode observations (frequencies, splitting, attenuation) (Lambotte +
post-doc, task 3)
From these databases, various tomographic models will be computed :
1) A global whole mantle isotropic model combining all our data, potentially including the interface topographies (observed during the ANR TOMOGLOB). This model will be the first global model of this type in France (Debayle + postdoc, task 7a)
Then various combinations of our databases can be used to get more specific models :
2) A global whole mantle radially anisotropic model obtained by inverting separately the SV and SH databases (Debayle + post doc, task 7a).
3) Surface wave SH and SV finite frequency models from Love and Rayleigh inversion (Debayle + PhD ANR, task 6)
4) Body wave finite frequency models radially anisotropic of the whole mantle (including all SH and SV body waves observations), Zaroli, task 7b (the SH model has already be made during the ANR TOMOGLOB, see figure 2)
5) Attenuation model of the upper mantle with reassessment of the radial 1D model of the whole mantle (Ricard + PhD ENS, tasks 5a, 5b)
In addition,
6) the implications of our tomographic models for geodynamics and mineralogy will be studied, in particular with what concerns attenuation (Ricard, task 5)

3. PROGRAMME SCIENTIFIQUE ET TECHNIQUE, ORGANISATION DE LA PROPOSITION DE PROJET / SCIENTIFIC AND TECHNICAL PROGRAMME, PROPOSAL ORGANISATION
3.1. PROGRAMME SCIENTIFIQUE, STRUCTURATION DE LA PROPOSITION DE PROJET/ SCIENTIFIC PROGRAMME, PROPOSAL STRUCTURE
The scientific program is divided in a coordination task plus 6 tasks. There are three observational tasks and three inversion/interpretation tasks. Each observational task (tasks 2 to 4) is devoted to the acquisition of a new dataset which require a specific expertise. For this reason, these tasks are distinct and leaded by a scientist with the required expertise. These tasks will provide global databases of S-wave attenuation and travel time measurements, which is one deliverable of the project.
Inversion/interpretation is split in 3 different tasks (tasks 5 to 7). Task 5 is devoted to the inversion/interpretation of the S-wave quality factor. A PhD student provided by ENS Lyon will work on this part of the project. This task also incorporates an exploratory sub-task on laboratory measurements of S-wave attenuation at high pressure and temperature. Task 6 is devoted to the finite frequency inversion of surface waves. We require a PhD student to develop finite frequency approaches for the inversion of our global dataset of fundamental and higher modes dispersion curves. Task 7 is devoted to other global inversions : this include a ray theory inversion of the whole travel time datasets (including those acquired during the TOMOGLOB project) as well as a finite frequency inversions of SV and SH long period body waves. We require a 2 years post-doc to perform free oscillation measurements and the ray theory inversion. Christophe Zaroli will perform the finite frequency inversion of SV and SH long period body waves in Nice.
Malcolm Sambridge is professor at the Australian National University and is one of the world leader in the development of innovative inversion approaches. Eric Debayle, has been collaborating with Malcolm Sambridge for 10 years and recently Eric Debayle, Christophe Zaroli and Malcolm Sambridge had a very fruitful collaboration during the TOMOGLOB project. Although Malcolm does not appear explicitly as a partner in the administrative part of this project, his expertise will be extremely useful to the inversion part of the project (task 5, 6 and 7). For this reason, he appears as a consultant in tasks 5, 6 and 7. We intend to maintain regular discussions with Malcolm and we have planed to invite him once in Lyon and to visit ANU once during the ANR project.
A flow chart of the different tasks is shown on figure 4.

Task 1: CoordinationEric Debayle
Task 2:Surface wave observations
Eric Debayle
Task 4:Body wave observations
Christophe Zaroli
Task 3:Free oscillationobservations
Sophie Lambotte
Task 5:Quality factor inversion
and interpretationYanick Ricard
Task 6:Surface wave finite frequency inversion
Eric Debayle
Task 7:Global inversions
Eric Debayle
TOMOGLOB RESULTS:400 000 SH travel times
+357143 Rayleigh wave path
average measurements+
Global constraints on the 410 and 660 kn discontinuities (SS
precursors and Pds data)
‘‘Send data to’’
observational task
inversion task
input from previous work
mardi 11 janvier 2011
Figure 4 : flow chart of the different tasks.

3.2. DESCRIPTION DES TRAVAUX PAR TÂCHE / DESCRIPTION BY TASK
3.2.1 TÂCHE 1 / TASK 1 COORDINATION (ERIC DEBAYLE)The scientific program is divided into 6 distinct tasks. A leader for each task has been chosen according to his/her scientific expertise. The role of each task leader will be to organise the activity, coordinate the work of the participants and make sure the deliverables are obtained in time. The project coordinator will follow the evolution of each task and the effective co-operation and communication among participants. The coordinator and the task leaders will be in charge of monitoring the progress of the research activities, as well as taking decisions regarding the global orientation of the project.
We plan to organise meeting of the team on a regular basis.
3.2.2 TÂCHE 2 / TASK 2 SURFACE WAVE OBSERVATIONS (ERIC DEBAYLE)Responsible : Eric DebayleOther Scientists : Keith PriestleyDeliverable : a global database of Love wave phase velocity measurements.This task consists to built a global database of Love wave dispersion measurements. This work can be carried out with the automated waveform inversion approach developed by Debayle (1999) which has already been applied to a few hundred Love waves by Debayle & Kennett (2000). Although there is no conceptual difficulty to extend Love wave measurements for a global study, this task requires a huge amount of work. First, we have extended the Debayle (1999) approach during the TOMOGLOB project to extract more information from the higher modes and this extension needs to be adapted to Love wave analysis. Second, processing hundred of thousands of Love wave will require a major efforts in data analysis. This effort will be shared between Lyon and Cambridge through a collaboration between Eric Debayle and Keith Priestley. This collaboration has proved to be very efficient in the last few years : it allowed us to built the Debayle et al. (2005) global model constrained by 100 000 Rayleigh waves. Eric Debayle wrote his automated waveform modelling codes. He will adapt these codes for Love wave inversion. We will then collect a global dataset of horizontal components from the global permanent networks. Our current database of 357 143 Rayleigh wave measurements has been obtained from about one million of seismograms. Collecting the same amount of Love wave measurements requires to extract more data because horizontal components are usually more noisy. As Love wave are obtained from the rotation of two seismograms (the north-south and east-west components) we anticipate the extraction and pre-processing of about 3 millions of horizontal seismograms. We will install our extension of the automated waveform modelling on the cluster in Cambridge (the Debayle (1999) version of the automated code is already running on the Cambridge cluster) and share the job between Cambridge and Lyon. Processing 1.5 millions of waveform in Lyon can only be done on mid-size cluster (about 45 nodes, each with two six-core processors) which is included in this ANR application.
Our waveform modelling approach can be seen as a way to extract a set of fundamental and higher modes dispersion curves compatible with a recorded seismogram. We will use the waveform modelling to built a database of Love wave dispersion curves in the period range 50 and 300 s. This dataset will then be used in task 6 and 7 for building 3D SH models and for constraining radial anisotropy.
3.2.3 TÂCHE 3 / TASK 3 NORMAL MODES STRUCTURE COEFFICIENTS OBSERVATIONS (SOPHIE LAMBOTTE)
Responsible: Sophie LambotteOther Scientists: Yanick Ricard, Eric DebayleManpower: 1 postdoc studentDeliverable: structure coefficients, and free oscillation quality factor estimations
Normal modes data have been commonly used to investigate the global 3D Earth structure (Smith and Master 1989, Widmer et al. 1991, Master et al. 1996, Resovsky and Ritzwoller 1998), sometimes used simultaneously with surface waves and/or body waves data. In the

last 5 years, several very large earthquakes have occurred (Sumatra 2004, Nias 2005, Chile, 2010) and allowed very clear observations of the Earth free oscillations, even the gravest ones (often hidden in the noise and rarely observed). We have therefore the opportunity to add new data to investigate the elastic and anelastic structure of the Earth. In this task, we will built a database of structure coefficients (which can be considered as secondary observables between seismograms and the 3D Earth structure) and quality factor estimates, including new estimates and estimates from literature. This database will be used simultaneously with surface wave, and/or body wave data to invert for a global Earth velocity and density model (task 7) and to constraint a 1D model for mantle attenuation (task 5). We will compute new structure coefficients using spectral fitting techniques, including self- and/or cross-coupling interactions between modes. We will consider mainly the gravest free oscillations, which contain useful information to better constrain the 1D density profile of the Earth, as well as 3D velocity models. We will also estimate structure coefficients of odd degrees not often computed (Resovsky and Ritzwoller 1995) by considering the coupling between normal modes; the introduction of coupling also permits to improve even-degree structure coefficient estimations. For this study, we will use data from long-period seismometers, super-conducting gravimeters as well as strainmeters. For structure coefficient computations from horizontal instruments, we will take care of cavity effects not to introduce bias in estimates. These cavity effects are commonly observed on Earth tides records (Lambotte et al. 2006), and firstly observed in the normal mode frequency band for the Sumatra earthquake (Lambotte, 2007) on the gravest fundamental free oscillations (spheroidal and toroidal). This is critical for the structure coefficient computations for the gravest fundamental toroidal modes. In addition, error analysis will be performed using bootstrap techniques to quantify the accuracy and precision of the coefficient estimates.In this task, we will also investigate the possibility to compute complex structure coefficients using spectral fitting techniques in order to explore the 3D anelastic structure of the Earth. We will estimate individual singlet or multiplet mean quality factor; the precision on these measurements are less good as those perform for the eigenfrequencies, and are often insufficient to allow this to be done (Masters and Gilbert 1983). We will try to perform this using the gravest well split normal modes. If not successful, these data will be used simultaneously with surface wave and body wave data to improve the 1D profile of the attenuation into the Earth (task 5).This work will be carried out in Lyon and Strasbourg by a postdoc student co-supervised by Sophie Lambotte, Eric Debayle and Yanick Ricard.
3.2.4 TÂCHE 4 / TASK 4 LONG PERIOD FINITE FREQUENCY BODY WAVE OBSERVATIONS (CHRISTOPHE ZAROLI)
Responsible : Christophe ZaroliOther Scientists : Guust NoletDeliverable : a global database of SV travel-time measurements.
This task 4 mainly consists to build the first global database of "SV-wave" travel times measured in different frequency bands (between 10 and 50 s period).
We will start with the measurement procedure of Zaroli et al. (2010). This methodology has already been very successful for building the first global dataset of multiple-frequency "SH-wave" travel times. The target seismic phases will be S, ScS and SS, with a possible extension to other phases (e.g Sdiff, SSS, SKS, SKKS, etc).
Zaroli et al. (2010) method uses the Harvard centroid moment tensor (CMT) catalogue to get an estimate of the seismic source parameters (moment tensor, source depth and Gaussian source time function), which are used to calculate the synthetic seismograms. In addition, crustal phases reverberated in the global crustal model CRUST2.0 are also incorporated in the synthetics, in order to remove the crustal signature from tele-seismic travel times. Provided that the CMT catalogue and the CRUST2.0 model are accurate enough, the Zaroli et al. (2010) method gives reliable S-wave travel times measured in a broad frequency range. Measurements are made by cross-correlation between the observed and synthetic targeted seismic waveforms.

We also plan to refine the measurement procedure of Zaroli et al. (2010). The main idea is to make the travel time measurements by cross-correlation less sensitive or insensitive to errors in source location or source time function, using "soft clustering" (i.e. dividing the stations in overlapping clusters of highly correlating waveforms).
The output of this task 4 will be the two first global datasets of multiple-frequency SV- and SH-wave travel times. These two datasets will then be used for sub-task 7b in order to perform the first simultaneous multiple-frequency inversion SV-SH. This will result in the first global multiple-frequency S-wave tomographic model that attempts to take into account seismic anisotropy present in the deep mantle.
3.2.5 TÂCHE 5 / TASK 5 QUALITY FACTOR INVERSION (YANICK RICARD)Responsible : Yanick RicardOther Scientists : Eric Debayle, Jean Philippe Perrillat, Malcolm SambridgeManpower : 1 PhD student provided by ENS or UCB LyonDatasets : 357143 Rayleigh wave fundamental and higher modes attenuation curves from the TOMOGLOB project plus free oscillations attenuation coefficients from task 3.Deliverable : a 3D quality factor model of the upper mantle and a 1D model of the whole mantle attenuation.
Sub-task 5a : A new 3D attenuation model of the upper mantle (Ricard, Debayle, PhD A)The quality factors Q or attenuations q=1/Q for all the rays included in Eric Debayle database have been already obtained through waveform inversion. This database include about half million rays. These attenuations have a normalised histogram which is highly non-Gaussian. This is due to the fact that q is positive and that below some value a low attenuation is undistinguishable from no attenuation. However log(q) seems close enough to a Gaussian variable that we can invert the local quality factor with a least square inversion.
The tomography of attenuation is obtained through a non-linear inversion process and therefore the runs are about n times longer (where n≈4 is the number of iterations) than for velocity tomography. A preliminary inversion was presented at the 2010 AGU Fall Meeting (Ricard & Debayle, 2010) for which we selected ∼50.000 data. For all these data, the inverted seismic moment is close to the CMT value and the attenuation observed for each ray has a satisfactory depth resolution.
This preliminary inversion shows that a very clear signal can be inverted (figure 5).

Figure 5 : ray density map (a) and Q maps at 50 km (b), 150 km (c) and 250 km (d) after Ricard and Debayle (2010).
-The ratio between maximum and minimum attenuation can be very large up to a factor 50 in the lithosphere.-The attenuation at 50 km depth shows that all cratons have very high quality factors (500<Q<3000). The oceans and young continents have a much higher attenuation (Q around 150) but there is no very localised attenuating signature of mid oceanic ridges. -In the asthenosphere (150 km), the oceanic mantle has a low quality factor (Q around 80) but the continents and all the slabs have 140<Q<250.-At larger depth, all the convergence domains of the Earth have large Q.
This result is very preliminary. The final inversion should include up to 10 times more data depending on our selection criteria. We must therefore re-think, parallelize... our code to include all our data that cannot be handled simultaneously on our present computer. The correction of the attenuation for focussing-defocussing effects will also have to be performed although with our selection of short paths, this effect is not expected to change drastically the results. We plan to start a PhD on this subject.
sub-task 5b: A new 1D model of the whole mantle attenuation (Lambotte, Durand, Ricard, Zaroli, PhD student, coll Matas)
In the last years, we have shown that the mantle attenuation should not be taken as frequency independent (Matas and Bukowinski 2007, Lekic et al, 2009, Zaroli et al., 2010) and that phase change could be associated with a localized attenuation (Ricard et al, 2009). Stéphanie Durand, a PhD student in Lyon supervised by Yanick Ricard, is presently building a database of lower mantle attenuation from ScS-S «t-star» measurements (Durand et al., 2010). We plan to start a systematic re-evaluation of normal mode attenuations following the approach of Lambotte et al. (2007). We hope to reduce the uncertainties for modes already observed and to add new mode observations. The PhD student will be associated to this project, and will establish a 1D attenuation model of the Earth taking into account these new data (ScS-S «t-star», normal modes, and finite frequency observations) and the new theorical considerations (frequency dependence of attenuation, possibility of localized attenuations on interfaces).

sub-task 5c : Laboratory observations of attenuation (Perillat, Ricard)
This sub-task is dedicated to the multidisciplinary interpretation of the new S-wave tomography and attenuation models through a comparison with mineral physics data on the viscoelastic properties of mantle minerals and rocks. This is a prospective work that will benefit from the concomitant efforts of the mineral physics group in Lyon (Dr. Jean-Philippe Perrillat) to develop the laboratory measurements of S-wave attenuation at mantle conditions and seismic frequencies.
Laboratory measurements of attenuation
Laboratory information on seismic properties of geological materials is typically obtained at MHz-GHz frequencies with ultrasonic and opto-acoustic techniques and hence cannot be applied with any confidence at the sub-Hz frequencies of teleseismic wave propagation. To date, teleseismic frequencies (mHz-Hz) are only accessible with cyclic loading methods that measure the dynamic mechanical response of minerals to an applied stress. Torsional forced-oscillation tests provides for the measurement of shear modulus and the associated strain energy dissipation. A complete description of the technique can be found in Jackson (2005). In brief, the sample and an elastic standard of know modulus and negligible dissipation, connected mechanically in series, are subjected to a low-frequency sinusoidally time-varying torque (figure 6). The measurement of the relative amplitudes and phases of the torsional mode displacements in standard and sample provides the determination of the shear modulus (G), and of the strain energy dissipation (QG-1 = tan δ) for the sample.
The method has been extensively applied at high-temperature and atmospheric pressure. As an example, for olivine, measurements have revealed a pronounced strain energy absorption band (QG-1 ~ ω-α with 0.1 < α < 0.3) and associated frequency dependence (dispersion) of the shear modulus at subsolidus temperatures (Jackson et al., 2002). Forced-oscillation measurements have also been implemented at high pressure by loading the experimental assembly in an internally heated gas-charged pressure vessel (Jackson, 1993). However, the maximum accessible pressure to date is 0.3 GPa, which is a major limitation to the application of attenuation data to Earth’s mantle conditions.
Implementation of the forced-oscillation method to upper mantle conditionsWe propose to extend the forced-oscillation measurements up to upper mantle conditions thanks to the recent development of an apparatus capable of performing controlled torsional shear stress experiments on a sample held at simultaneous high P-T conditions, currently up to 8 GPa and 2000 °C (figure 6). This device, named “RoToPEc” (for Rotational and Tomography Paris-Edinburgh Cell) has been designed in a collaborative project founded by the French CNRS agency (MRCT grant 2010-11 to Perrillat et al. “New generation of large volume presses for research under extreme conditions”).
Figure 6 – Principle of the forced-oscillation measurements in the rotational Paris-Edinburgh cell.

The main challenge in applying the forced-oscillation method at high pressure is the need of a technique for measuring stress and strain with sufficient precision, and with sufficiently short measurement time, while the sample is embedded in the high-pressure vessel. These technical difficulties can be overcome through the use of synchrotron radiation. The strain is measured in situ and in real-time through X-ray radiography, while X-ray diffraction enables the estimation of stress and P-T conditions. Hence, coupling the new RoToPEc device with synchrotron radiation provides a unique facility for investigating the viscoelastic behaviour of materials under extreme conditions.
Seismic wave attenuation in polycrystalline olivineAttenuation measurements will be performed in priority on polycrystalline olivine, owing to its relevance for the mineralogy of the upper mantle and the availability of previous attenuation data at lower pressures (<0.3 GPa) for comparison (Jackson et al., 2002). Dr Jean-Philippe Perrillat, assistant professor at the Université de Lyon, will be in charge of these experiments. He is a specialist of high-pressure and synchrotron techniques, and actively participated in the design of the RoToPEc device (Perrillat et al. 2010). A long-term proposal will be submitted at the European Synchrotron Radiation Facility (Grenoble) to get beamtime allocation. Pioneer mechanical tests will be performed on polycrystalline olivine samples under 1 to 6 GPa hydrostatic pressure, seismic frequencies 0.01 to 1 Hz, and within the linear regime of strain (amplitude < 5. 10-5). Both the shear modulus G, which governs the shear waves speed Vs, and the dissipation of shear strain energy QG-1 will be measured as functions of oscillation period, temperature and grain size, for the first time at the relevant PT conditions of the Earth’s upper mantle. Microstructural investigation on the quenched samples (i.e. electron microscopy) will complete the mechanical data in order to retrieve the inter- and intragranular processes responsible for dissipation.The final objective is to fit the experimental data to a Burgers rheological model (e.g. Faul & Jackson, 2005) that describes the temperature, frequency and grain size dependence of the shear modulus and attenuation. This model will be used to perform indicative calculations of shear wave speed (Vs) and attenuation (QG-1) along representative mantle geotherms that could be compared with the S-wave and quality factor Q models achieved in the present project. If this prospective work shows conclusive, the attenuation of other major mantle phases and the effect of water or partial melt will be explore in further research projects.
3.2.6 TÂCHE 6 / TASK 6 SURFACE WAVE FINITE FREQUENCY INVERSION
Responsible : Eric DebayleOther Scientists : Yanick Ricard, Malcolm SambridgeManpower : 1 PhD studentDatasets : 357143 Rayleigh wave fundamental and higher modes phase velocity curves from the TOMOGLOB project + output of task 3Deliverable : a finite frequency SV-SH tomographic models
In this task, we will develop finite frequency approaches for the inversion of massive Rayleigh and Love wave datasets. This work will be carried out in Lyon by a PhD student (PhD 1) co-supervised by Eric Debayle and Yanick Ricard. We will keep the architecture of the waveform inversion in 2 steps : a first step which extracts from each individual waveform a path average Vs model and a set of fundamental and higher modes dispersion curves compatible with the recorded seismogram; a second step in which these path average constraints (phase velocity or Vs models) are combined in a regionalization that gives access to lateral heterogeneities. Keeping this architecture will allow us to take advantage of the massive datasets of phase velocity measurements provided by the first step of our waveform inversion during TOMOGLOB and task 2.
The formalism for the finite frequency inversion of surface waves based on single scattering has been developed by Spetzler et al., (2002) and has been implemented by us (Sieminski et al., 2003) on a small number of data (∼3000 paths). A difficulty is the computational cost of the finite frequency inversion. The computation of the sensitivity within each point of the 2D Fresnel zone is heavy. In addition, using a finite frequency theory, the inversion has to be performed on each period of the phase velocity curves. The fundamental mode and five

overtones used in our study are parameterized with 77 periods. Therefore, 77 inversions of ∼350 000 data are needed to get 77 phase velocity maps which then need to be inverted at depth. For comparison, within the framework of ray theory, the sensitivity kernel does not vary and a simple integral along the ray is sufficient. In addition, ray theory allows to regionalise directly the path average S-wave slowness obtained at each depth. The upper mantle is in our case parameterized with 33 depths. Therefore, ‘‘only’’ 33 inversion of ∼350 000 paths are needed to build a 3D upper mantle S-wave model. We therefore need to rethink entirely (optimize and parallelize) our surface wave tomography codes for performing finite frequency inversions.
The finite frequency phase velocity maps obtained in the period range 30-250 s for the fundamental and up to the 5th overtone will then be inverted as a function of depth. At this stage, we plan to use the ‘‘reversible jump algorithm’’ which has recently been developed by Malcolm Sambridge’s PhD student, Thomas Bodin (Bodin et al., 2009). This approach considers the issue of model parameterization as part of the inversion process. The size, position and shape of the cells defining the velocity model are directly determined by the data. This procedure is particularly adapted at imaging rapid changes or discontinuities in wave speed. This can be very useful, for example to let the data decide where the Moho should be located and what the characteristics of the crustal structure should be.
We will develop the codes and first apply the finite frequency approach on the Rayleigh wave fundamental and higher mode phase velocity curves provided by the TOMOGLOB project. After completion of task 3, we will extend the codes for the Love wave inversion and the incorporation of radial anisotropy.
The formalism for the calculation of fundamental mode surface waves three dimensional sensitivity kernels has been developed by Zhou et al. (2004), based on the Born approximation (single scattering). Although applying 3D kernels to 400 000 multimodes measurements is still a computational challenge, we will explore this direction, at least on a subset of our data in a second step of this task.
The expectations of this work is to improve the resolution of small-scale mantle heterogeneities by properly taking into account finite frequency effects such as wavefront healing.
3.2.7 TÂCHE 7 / TASK 7 GLOBAL INVERSION AND INTERPRETATION (ERIC DEBAYLE)Responsible : Eric DebayleOther Scientists : Yanick Ricard, Christophe Zaroli, Stephane Rondenay, Malcolm SambridgeManpower : 1 post-docDatasets : Rayleigh wave datasets from TOMOGLOB and task 2, free oscillation dataset from task 3, SV and SH long period body wave datasets from TOMOGLOB and task 4, SS precursor and Ps dataset from TOMOGLOB.Deliverable : SV and SH tomographic models of the lower mantle, a global SV-SH model of the entire mantle. models including the topography the 410 and 660 km discontinuity.
sub-task 7a : global inversion of the whole dataset (post-doc, Eric Debayle, Yanick Ricard, Stephane Rondenay)
The idea is to invert the whole dataset (body waves, surface waves, and free oscillations) for a global tomographic model of the entire mantle. At this stage we will apply ray theory and the great circle approximation to describe the propagation of body and surface waves. The idea is to obtain a model of the entire mantle that can be used for geodynamic interpretation and for future more detailed simulations. As in other work by Ritsema et al., (2010) or Kustowski et al. (2008), we will relate phase velocity anomalies, travel time anomalies and splitting functions to shear velocity heterogeneity by assuming that surface waves are affected by structure in the plane of propagation, that the travel times are

affected by velocity heterogeneity along the geometrical ray and that splitting functions can be mapped into velocity heterogeneity using depth-dependent kernel functions.
The model will use a standard parametrization with spherical harmonics and spline functions to parametrize lateral and vertical variations. Crustal corrections will be performed using the 3SMAC model of Nataf and Ricard (1995).
We will start to built an ‘‘isotropic’’ model by mixing Rayleigh waves, spheroidal splitting functions and SV-type body waves such as SKS with SH-wave travel times from our current database (essentially S, SS and ScS waves). We may at this stage incorporate our SS precursor and PdS database (Tauzin et al. 2008) to constrain the depth of the major discontinuities at 410 and 660 km. Although this procedure is somewhat rough, because it neglects anisotropy which is probably strong at the bottom and top of the mantle, it allows to maximise coverage and it has been extensively used in modern global seismology (see e.g. Ritsema et al., 1999).
Note that we are currently trying to attract Stéphane Rondenay on a CNRS ‘’chaire d’excellence’’ which should be open at LGLTPE in 2011. Stéphane is currently associate professor at MIT (Massachusset Institute of Technology) in Boston. Although the recruitment process is still at a early stage that precludes including him formally in this proposal, he is interested in this project and will participate if he gets a permanent position in Lyon. His expertise in the analysis of converted and scattered teleseismic waves (e.g. Rondenay, 2009) will be extremely useful, for example to test the vertical resolution of our estimates of absolute discontinuity depth in key tectonic environments.
An easy step ahead will be to invert separately our SV and SH datasets : Rayleigh waves will be inverted with spheroidal splitting functions, and the SV wave database from task 4. Love waves will be inverted with toroïdal splitting functions and with our SH long period database. Although coverage is likely to be weaker these inversion should provide the first purely SV model of the entire mantle in addition to an SH model of the entire mantle.
Comparing SV and SH models with different coverage is not easy and we will then try a simultaneous inversion of the whole dataset for a radially anisotropic model. We anticipate that the number of model parameters should only double if we can restrict the inversion to SV and SH parameters, which should be the best resolved by surface waves and splitting parameters.
sub-task 7b : SV and SH finite frequency models (Christophe Zaroli, Guust Nolet)
This sub-task will perform the first simultaneous inversion of multiple-frequency SV- and SH-wave travel times, using the finite-frequency approach of Dahlen et al. (2000). This will result in the first global multiple-frequency S-wave tomographic model that attempts to take into account radial seismic anisotropy present in the deep mantle.
For this purpose, we will use two global multiple-frequency travel time datasets : The SH-wave global travel time dataset from the TOMOGLOB results and the SV-wave global travel time dataset provided by task 4.
We will explore two strategies for the tomographic inversion.
The first one will largely rely on the experience acquired by Zaroli during his PhD. It will consist in using a data adaptive model parameterization (see Nolet and Montelli 2005), in conjunction with the LSQR algorithm to perform the inversion. The regularization of the inverse problem will be based on the use of a damping factor and a trade-off curve analysis (see Nolet 2008). This approach has already been applied to SH wave by Christophe Zaroli during his PhD.
The second strategy will incorporate wavelet expansions into the tomographic inversion, with the aim to resolve more detail in the model where the data allow a higher resolution.

This new technique is currently under development in the GLOBALSEIS team (GeoAzur, Nice) leaded by Guust Nolet.
In both inversion strategies, SH- and SV-wave travel time measurements will be inverted with the finite-frequency sensitivity kernels developed by the Princeton group (Dahlen et al. 2000).
Expectations of this sub-task are to get refined images of small-scale objects in the Earth's interior (e.g. plumes), and then contribute to a better understanding of mantle dynamics.
7. ANNEXES / ANNEXES
7.1. RÉFÉRENCES BIBLIOGRAPHIQUES / REFERENCES
Bodin T & M. Sambridge, Seismic tomography with the reversible jump algorithm, Geophys.,J., Int., 178, 1411-1436, 2009.
Dahlen, F.A., S.-H. Hung & G. Nolet, 2000. Frechet kernels for finite-frequency traveltimes - I. Theory, Geophys. J. Int., 141, 157-174.
Debayle E., SV-wave azimuthal anisotropy in the Australian upper mantle: preliminary results from automated Rayleigh waveform inversion, Geophys. J. Int., 137, 747-754, 1999.
Debayle E. & B.L.N. Kennett, Anisotropy in the Australasian upper mantle from Love and Rayleigh waveform inversion, Earth Planet. Sci. Lett., 184/1, 339-351, 2000.
Debayle E., J.J. Lévêque & M. Cara, Seismic evidence for a deeply rooted low velocity anomaly in the upper mantle beneath the northeastern Afro/Arabian continent, Earth Planet. Sci. Lett., 193/3-4, 369-382, 2001.
Debayle E. & M. Sambridge, Inversion of massive surface wave data sets : model construction and resolution assessments, J. Geophys. Res. , 109, B02316, doi:10.1029/2003JB002652 , 2004.
Debayle E., B. Kennett and K. Priestley, Global azimuthal seismic anisotropy and the unique plate-motion deformation of Australia, Nature, 433, 509-512, doi:10.1038/nature03247, 2005.
Debayle E., Ricard Y. and Priestley K., Global upper mantle and transition zone shear wave structure from fundamental and higher mode surface waves, EGU General Assembly 2010, held 2-7 May, 2010 in Vienna, Austria, p.10528.
Faul, U.H., Jackson, I. (2005) The seismological signature of temperature and grain size variations in the upper mantle, Earth and Planetary Science Letters, 234, 139-134.
Fichtner, Andreas, Brian L. N. Kennett, Heiner Igel, and Hans-Peter Bunge (2009), Full waveform tomography for upper-mantle structure in the Australasian region using adjoint methods, Geophys. J. Int., 179(3), 1703-1725.
Flanagan, M.P. and P.M. Shearer, Global mapping of topography on transition zone velocity /discontinuities by stacking SS precursors, J. Geophys. Res., 103, 2673-2692, 1998.
Fukao, Y., S. Widiyantoro, and M. Obayashi, Stagnant slabs in the upper and lower mantle transition region, Reviews of Geophysics, 39 (3), 291-323, 2001.
Goes S, Cammarano F, Hansen U,Synthetic seismic signature of thermal mantle plumes, Earth and Planet. Sci. Lett., 218, 3-4, 403-419, 2004.
Grand S.P., van der Hilst R.D., Widiyantoro S. 1997. Global seismic tomography: a snapshot of convection in the Earth, Geol. Soc. Am. Today, 141, 1–7.
Grand, S. P., 2002. Mantle shear wave tomography and the fate of subducted slabs, Phil. Trans. R. Soc. Lond. A, 360, pp. 2475-2491.
Gribb, T.T., Copper, R.F. (1998) Low-frequency shear attenuation in polycrystalline olivine: grain boundary diffusion and the physical significance of the Andrade model for viscoelastic rheology, Journal of Geophysical Research, 103 (B11), 22,267-22,279.
Jackson, I. (1993) A high-pressure, high-temperature apparatus for studies of seismic wave dispersion and attenuation, Pure & Applied Geophysics, 141, 445-466.
Jackson, I., Fitz Gerald, J.D., Faul, U.H., Tan, B.H. (2002) Grain-size-sensitive seismic wave attenuation in polycrystalline olivine, Journal of Geophysical Research, 107 (B12), doi:10.1029/2001JB001225.

Jackson, I. (2005) Laboratory measurement of seismic wave dispersion and attenuation at high pressure and temperature, in Advances in High Pressure Technology for Geophysical Applications, Eds. J. Chen, Y. Wang, T. Duffy, G. Shen, L.F. Dobrzhinetskaya, 95-119, Elsevier, Amsterdam.
Komatitsch, D., J. Ritsema and J. Tromp, The spectral-element method, Beowulf computing, and three-dimensional seismology, Science, vol. 298, p. 1737-1742 (2002).
Kustowski, B., Ekstrom, G. & Dziewonski, A.M., 2008. The anisotropic shear-wave velocity structure of the Earth’s mantle, J. geophys. Res., 1390, doi:10.1029/2007JB005169.
Lambotte S., L. Rivera et J. Hinderer, 2006, Vertical and horizontal seismometric observations of tides, J. Geodynamics, 41, 39-58.
Lambotte, S, Vibration propres basse fréquence et déformation de marée. Impact des hétérogénéités locales et contribution à l’étude des grands séismes, PhD thesis, Université de Strasbourg.
Maggi A. , Debayle E., K. Priestley & G. Barruol, Multimode surface waveform tomography of the Pacific Ocean: a closer look at the lithospheric cooling signature, Geophys. J. Int., 166 (3): 1384-1397, 2006a.
Maggi A., Debayle E, Priestley K, & G. Barruol., Azimuthal anisotropy of the Pacific region, Earth. Planet. Sci. Letters, 250 (1-2): 53-71, 2006b.
Masters G. and Gilbert F., 1983, Attenuation in the Earth at low frequencies, Phil. Trans. R. Soc. Lond. A, 308, 479-522.
Masters G., Johnson S., Laske G., Bolton H., and Davies J. H., 1996, A shear-velocity model of the mantle [and discussions], Phil. Trans.: Math. Phys. And Eng. Sciences, 354, 1385-1411.
Matas J, Bass J, Ricard Y, et al. On the bulk composition of the lower mantle: predictions and limitations from generalized inversion of radial seismic profiles, Geophy. J. Int., 170, 2, 764-780, 2007.
Mattern E, Matas J, Ricard Y, et al. Lower mantle composition and temperature from mineral physics and thermodynamic modelling, Geophy. J. Int., 160, 3 ,973-990, 2005.
Mégnin C. and B. Romanowicz , The shear velocity structure of the mantle from the inversion of of body, surface and higher modes waveforms, Geophys. J. Int, 143,709-728, 2000.
Montagner, J.P. & Tanimoto, T., Global upper mantle tomography of seismic velocities and anisotropies, J. Geophys. Res., 96, 20337-20351, 1991.
Montelli R., Nolet, G., Dahlen F.A. Master G., Engdahl E.R. & Hung, S.H., Finite -frequency tomography reveals a variety of plumes in the mantle, Science, 303, 338-343, 2004.
Nataf, H.C., Nakanishi, I. & Anderson, D.L., Anisotropy and shear-velocity heterogeneities in the upper mantle, Geophys. Res. Lett., 11, 109-112, 1984.
Nataf, H. & Ricard, Y., 1995. 3SMAC: an a priori tomographic model of the upper mantle based on geophysical modeling, Phys. Earth planet. Inter.,95, 101–122.
Nolet, G., 2008. A breviary of seismic tomography, Cambridge University Press, Cambridge, UK.Nolet, G. & R. Montelli, 2005. Optimum parameterization of tomographic models, Geophys. J. Int.,
161, 365-372.Pilidou S., K.Priestley, O.Gudmundsson & E. Debayle, Upper mantle S-wave speed heterogeneity
beneath the North Atlantic and the surrounding region from regional surface wave tomography, Geophys. J. Int., 159, 1057-1076, doi:10.1111/j.1365-246X.2004.02462.x, 2004
Pilidou S., K.Priestley, E. Debayle & O.Gudmundsson , Rayleigh wave tomography in the North Atlantic : High resolution images of the Iceland, Azores and Eiffel mantle plumes, Lithos,79, 453-473, doi:10.1016/j.lithos.2004.09.012, 2005.
Perrillat, J.P., Alvarez, M., Morard, G., Hodeau, J.l., LeGodec, Y., Merkel, S., Philippe, J., Ratteron, P., Siebert, J. “New generation of large volume presses for research under extreme conditions” MRCT grant 2010-11.
Priestley K. & E. Debayle, Seismic evidence for a moderately thick lithosphere beneath the Siberian Platform, Geoph. Res. Lett., vol. 30, no 3, 1118 , doi:10.1029/2002GL015931, 2003.
Priestley, K., D. McKenzie & E. Debayle, The state of the upper mantle beneath southern Africa, Tectonophysics, 416 (1-4), 101-112, 2006a.
Priestley, K., E. Debayle, D. McKenzie, et Pilidou S. Upper mantle structure of eastern Asia from multimode surface waveform tomography, J. Geophys. Res., 111, B10304, doi:10.1029/2005JB004082, 2006b.
Priestley K., D. McKenzie, E. Debayle & S. Pilidou, The African upper mantle and its relationship to tectonics and surface geology, Geophys. J. Int., 175, 1108–1126, doi: 10.1111/j.1365-246X.2008.03951.x, 2008.
Resovsky J. S. and Ritzwoller M. H., 1995, Constraining odd-degree earth structure with coupled

free oscillation overtone, Geophys. Res. lett., vol. 22, no 16.Resovsky J. S. and Ritzwoller M. H., 1998, New and refined constraints on the three-dimensional
Earth structure from normal modes below 3 mHz, J. Geophys. Res., 103, 783-810.Ricard & Debayle TOMOGLOB-DR2010 : Global 3D uppermantle shear velocity, anisotropy and
attenuation, DI11A-1824 Poster, AGU 2010 Fall meetting.Ricard Y, Matas J, Chambat F, Seismic attenuation in a phase change coexistence loop, Phys.
Earth and Planet Int., 176, 1-2, 124-131, 2009.Ricard Y, Mattern E, Matas J, Synthetic tomographic images of slabs from mineral physics, Earth’s
Deep Mantle : Structure, composition and evolution, Geophysical Monograph Series, 160, 283-300, 2005.
Ritsema, J., van Heijst H.J. And Woodhouse, J.H., Complex shear wave velocity structure imaged beneath Africa and Icelan, Science, 286, 1925-1928, 1999.
Ritsema, J., H. J. van Heijst, A. Deuss, and J. H. Woodhouse, S40RTS: a degree-40 shear velocity model for the mantle from new Rayleigh wave dispersion, teleseismic traveltimes, and normal-mode splitting function measurements, Geophys. J. Int., in press, 2010.
Romanowicz, B. and B. Mitchell (2007) Q in the Earth from crust to core, Treatise of Geophysics, Volume 1, published by Elsevier.
Romanowicz, B. (2003) Global mantle tomography: progress status in the last 10 years, Annu. Rev. Geoph. Space Phys, 31 (1), 303.
Rondenay, S., Upper mantle imaging with array recordings of converted and scattered teleseismic waves, Surv. Geophys., 30, 377-405, 2009.
Sieminski A., J.J. Lévêque & E. Debayle, Can finite-frequency effects be accounted for in ray theory sur face wave tomography? Geophys. Res. Let t . , 31, L24614, do i :10.1029/2004GL021402, 2004.
Sigloch, K. & Nolet, G., 2006. Measuring finite-frequency body wave amplitudes and travel times, Geophys. J. Int., 167, 271-287.
Smith M. F. and Master G., 1989, Aspherical structure constraints from free oscillation frequency and attenuation measurements, J. Geophys. Res., 94, 1953-1976.
Spetzler, J., J. Trampert, and R. Snieder, The effect of scattering in surface wave tomography, Geophys. J. Int., 149, 755-767, 2002
Tarantola, A., 1987. Inversion of travel times and seismic waveforms, in Seismic Tomography, pp. 135–157, ed. Nolet G., Reidel, Dordrecht.
Tarantola, A., 1988. Theoretical background for the inversion of seismic waveforms, including elasticity and attenuation, Pure appl. Geophys., 128, 365–399.
Tauzin B., E. Debayle & G. Wittlinger, The mantle transition zone as seen by global Pds phases : no clear evidence for a thin transition zone beneath hotspots, J. Geophys. Res., 113, B08309, doi:10.1029/2007JB005364, 2008.
Tauzin, B., E. Debayle & G. Wittlinger, Seismic evidence for a global low velocity layer within the Earth’s upper mantle, Nature Geoscience, doi: 10.1038/NGEO969, octobre 2010.
Trampert J, Deschamps F, Resovsky J, et al. Probabilistic tomography maps chemical heterogeneities throughout the lower mantle, Science, 306, 853-856, 2004.
Vacher P, Mocquet A, Sotin C, Computation of seismic profiles from mineral physics: the importance of the non-olivine components for explaining the 660 km depth discontinuity Phys. Earth and Planet Int., 106, 3-4, 275-298, 1998.
Van der Caar J. C. & Crosson R. S., 1990. Determination of teleseismic relative phase arrival times using multi-channel cross-correlation and least squares, BSSA, 80, 150-169.
van der Hilst, R.D., S. Widiyantoro & E.R. Engdahl, Evidence for deep mantle circulation from global tomography, Nature, 386, 578-584,1997.
Van der Hilst, R.D., and De Hoop, M.V., Banana-dougnut kernels and mantle tomography, Geophysical Journal International, v. 163, p. 956-961, 2005
Webb, S., Jackson, I. (2003) Anelasticity and microcreep in polycrystalline MgO at high temperature: an exploratory study, Physics and Chemistry of Minerals, 30, 157-166.
Webb, S., Jackson, I., Fitz Gerald, J. (1999) Viscoelasticity of the titanate perovskites CaTiO3 and SrTiO3 at high temperature, Physics of the Earth and Planetary Interiors, 115, 259-291.
Widmer R, Masters G. and Gilbert F, 1991, spherically attenuation within the Earth from normal mode data, Geophys. J. Int., 104, 541-553.
Woodhouse, J.H. and A.M. Dziewonski, Mapping the upper mantle: Three dimensional modelling of earth structure by inversion of seismic waveforms, J. Geophys. Res. 89, 5953-5986, 1984.
Zaroli C., Debayle E., & Sambridge M., 2010. Frequency-dependent effects on global S-wave traveltimes: wavefront-healing, scattering and attenuation, Geophys. J. Int., 182, 1025-1042.

Zaroli C., 2010. Global multiple-frequency S-wave tomography of the Earth's mantle, PhD, Strasbourg University.
Zhou, Y., F.A. Dahlen and G. Nolet, Three-dimensional sensitivity kernels for surface wave observables, Geophys. J. Int., 158, 142-168, 2004.