1 sediment quality objectives for california enclosed bays and estuaries benthic indicator...
TRANSCRIPT

1
Sediment Quality Objectivesfor California Enclosed Bays and Estuaries
Benthic Indicator Development
Scientific Steering Committee
26th July 2005

2
Overview
• Why Benthos and Benthic Indices?
• The Index Development Process– Define Habitat Strata
– Calibrate Candidate Benthic Indices
– Validate and Evaluate Candidate Indices
• Proposed Next Steps
3
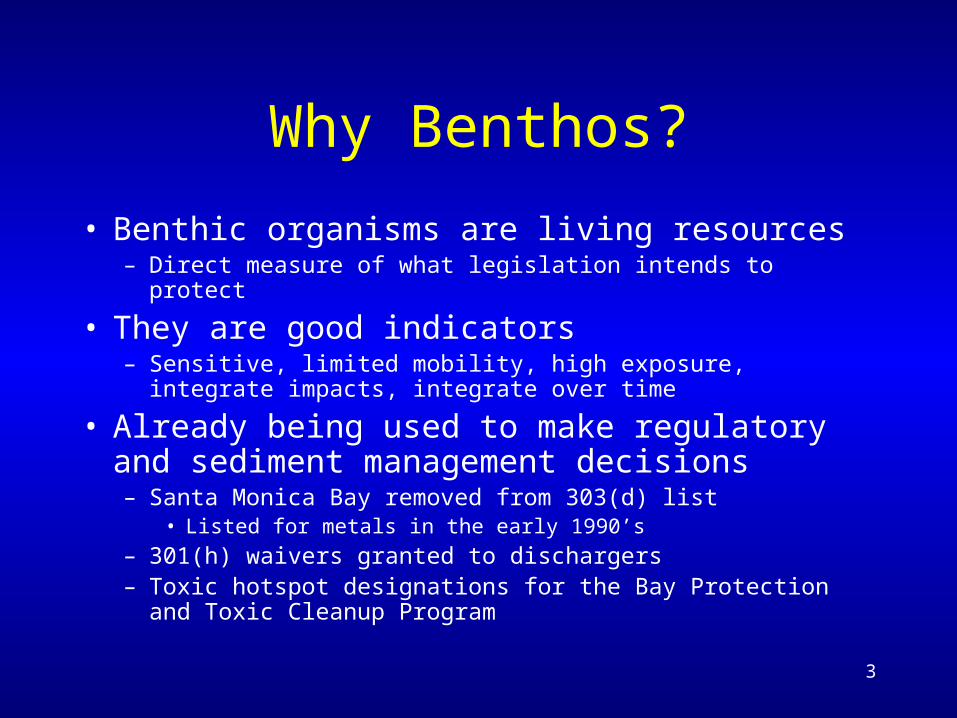
Why Benthos?
• Benthic organisms are living resources– Direct measure of what legislation intends to protect
• They are good indicators– Sensitive, limited mobility, high exposure, integrate impacts,
integrate over time
• Already being used to make regulatory and sediment management decisions– Santa Monica Bay removed from 303(d) list
• Listed for metals in the early 1990’s
– 301(h) waivers granted to dischargers– Toxic hotspot designations for the Bay Protection and Toxic Cleanup
Program

4
Benthic Assessments Pose Several Challenges
• Interpreting species abundances is difficult– Samples may have tens of species and hundreds of organisms
• Benthic species and abundances vary naturally with habitat– Different assemblages occur in different habitats
– Comparisons to determine altered states should vary accordingly
• Sampling methods vary– Gear, sampling area and sieve size affect species and individuals
captured

5
Benthic Indices Meet These Challenges
• Benthic Indices– Remove much of the subjectivity associated with data
interpretation– Account for habitat differences– Are single values – Provide simple means of
• Communicating complex information to managers• Tracking trends over time• Correlating benthic responses with stressor data
– Are included in the U.S. EPA’s guidance for biocriteria development

6
Overview
• Why Benthos and Benthic Indices?
• The Index Development Process– Define Habitat Strata
– Calibrate Candidate Benthic Indices
– Validate and Evaluate Candidate Indices
• Proposed Next Steps
7
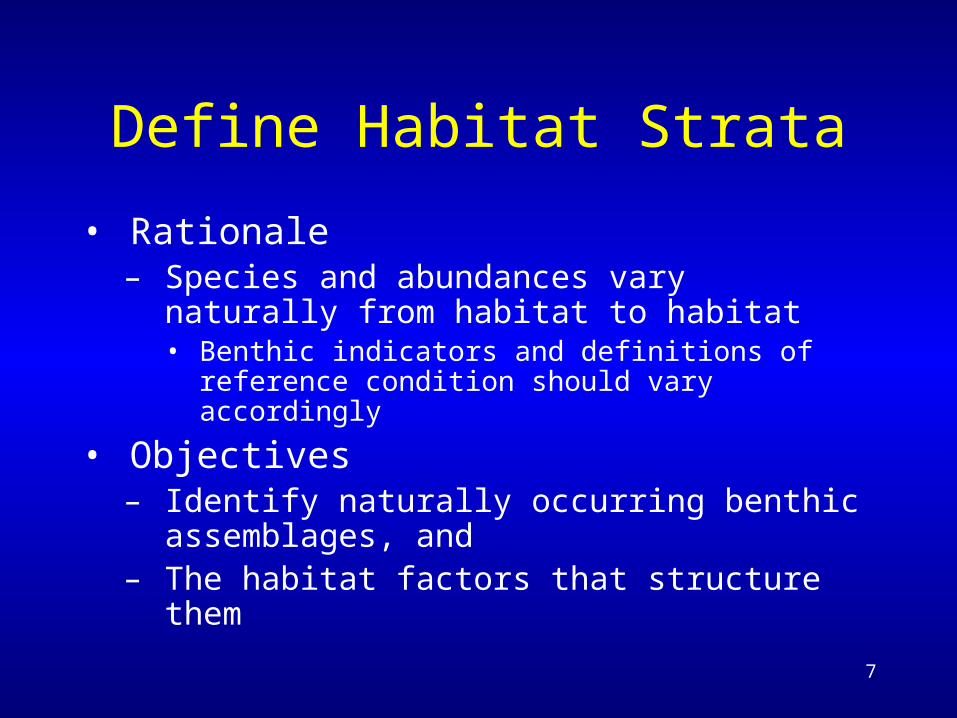
Define Habitat Strata
• Rationale– Species and abundances vary naturally from
habitat to habitat• Benthic indicators and definitions of reference
condition should vary accordingly
• Objectives– Identify naturally occurring benthic
assemblages, and– The habitat factors that structure them

8
Approach
• Identify assemblages by cluster analysis– Standard choices
• Species in ≥ 2 samples
• ³√ transform, species mean standardization
• Bray Curtis dissimilarity with step-across adjustment
• Flexible sorting ß=-0.25
• Evaluate habitat differences between assemblages– Salinity, % fines, depth, latitude, longitude, TOC
– Using Mann-Whitney tests

9
Data• EMAP data enhanced by regional data sets
– Comparable methods• Sampling, measurements, taxonomy
– OR and WA data included• Potential to increase amount of data for index development
– 1164 samples in database
• Eliminated potentially contaminated sites– ≥ 1 chemical > ERM or ≥ 4 chemicals > ERL– Toxic to amphipods– Located close to point sources– DO < 2 ppm
• 714 samples analyzed

10
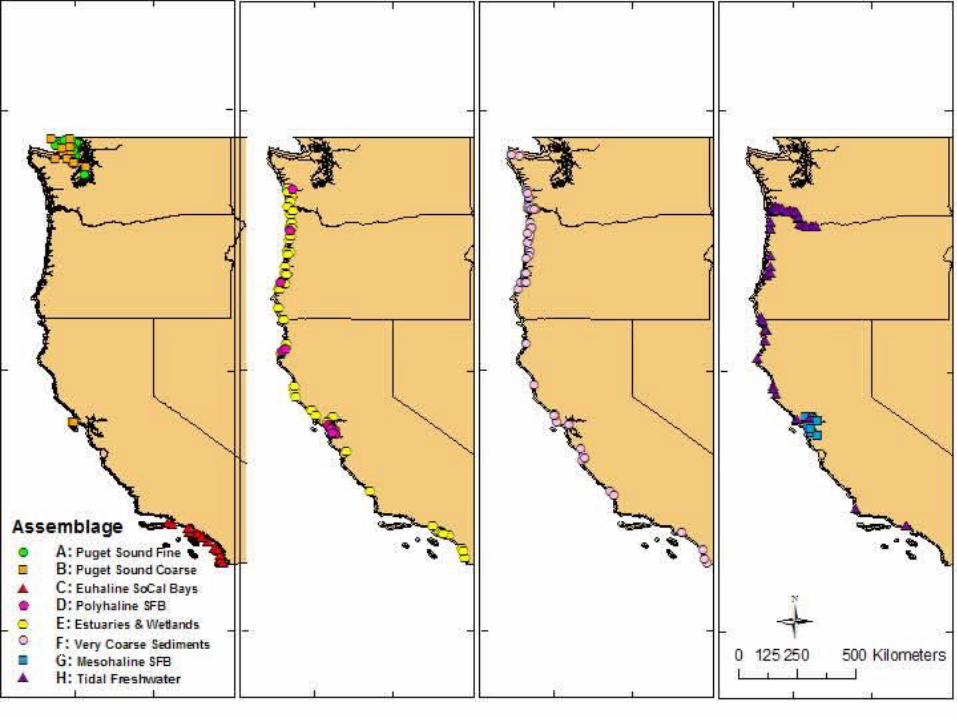
Identified Eight Assemblages
A Puget Sound Fine Sediments
B Puget Sound Coarse Sediments
C Southern California Euhaline Bays
D Polyhaline San Francisco Bay
E Estuaries and Wetlands
F Very Coarse Sediments
G Mesohaline San Francisco Bay
H Limnetic or Freshwater

11
SalinityS
alin
ity (
psu
)
0
10
20
30
40
Assemblage
A B C D E F G H
% Fine Sediments
Fin
e s
ed
ime
nts
(%
)
0
20
40
60
80
100
Assemblage
A B C D E F G H
Depth
Bo
tto
m d
ep
th (
m)
0
50
100
150
200
Assemblage
A B C D E F G H
Latitude
La
titu
de
(d
eci
ma
l de
gre
es)
30
35
40
45
50
Assemblage
A B C D E F G H
12

13
Overview
• Why Benthos and Benthic Indices?
• The Index Development Process– Define Habitat Strata
– Calibrate Candidate Benthic Indices
– Validate and Evaluate Candidate Indices
• Proposed Next Steps
14
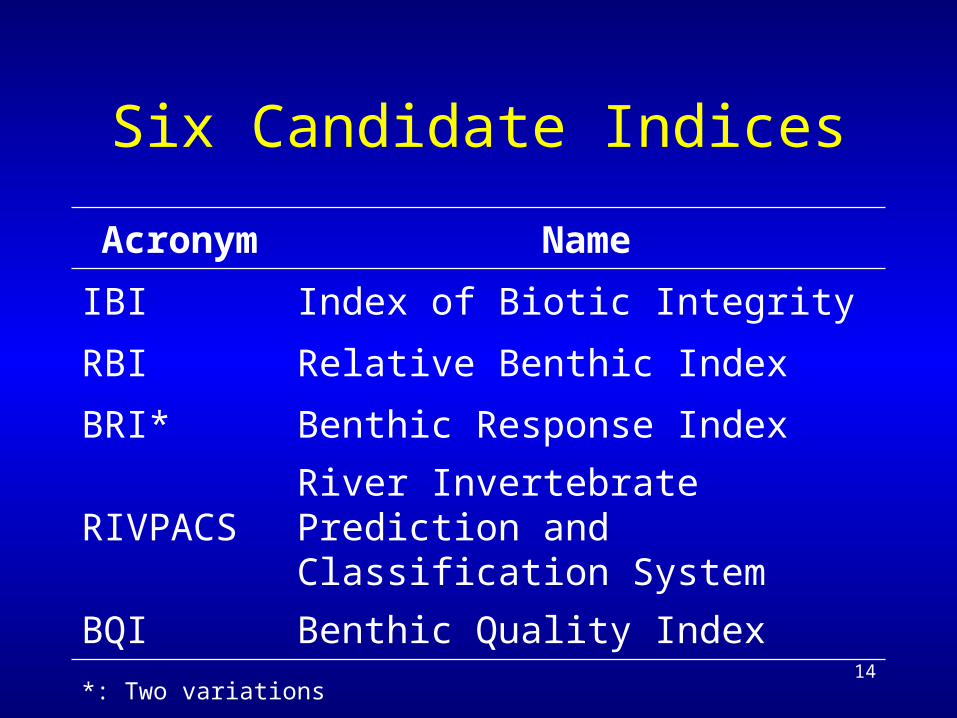
Six Candidate Indices
Acronym Name
IBI Index of Biotic Integrity
RBI Relative Benthic Index
BRI* Benthic Response Index
RIVPACSRiver Invertebrate Prediction and Classification System
BQI Benthic Quality Index
*: Two variations

15
Candidate IndicesComponents
Candidate Index Data
IBI Community measures
RBI Community measures
BRI-TC Species abundances
BRI-MNDF Species abundances
RIVPACS Presence/absence of multiple species
BQISpecies abundances & community measures

16
Index Development Teams
Candidate Index
Index Leader Reference
IBI Bruce ThompsonThompson and Lowe (2004)
RBI Jim Oakden Hunt et al. (2001)
BRI* Bob Smith Smith et al. (2001, 2003)
RIVPACS David Huff Wright et al. 1993
BQI Bob Smith Rosenberg et al. (2004)
*: Two variations

17
Common Definitions
• A common set of definitions were established– For “Good” and “Bad” sites
• Used in two ways– Identify data to be withheld from index development
• Subsequently used to validate index
• Goal: A set of clearly affected or reference sites to evaluate index performance
– “A Gold Standard”
– Identify reference and degraded condition for index calibration

18
Common Criteria
“Good” (Reference) Sites• Meet all the following criteria:
– Far from known point sources– Data available for sediment chemistry and at least one
amphipod toxicity test– No ERM* exceedences– No more than 3 ERL* exceedences– No toxicity
• Amphipod survival > 83%
– Species abundance list does not indicate bad biology (In progress)
*: As, Cd, Cu, Pb, Hg, Ag, Zn, Hmw(8) & Lmw(11) PAH, Total PCB

19
Common Criteria
“Bad” (Degraded) Sites
• Meet both of the following criteria– 1 or more ERM exceedences, or
3 or more ERL exceedences, and– >50% mortality in an acute amphipod test

20
National vs. CA data
SouthNorth
21
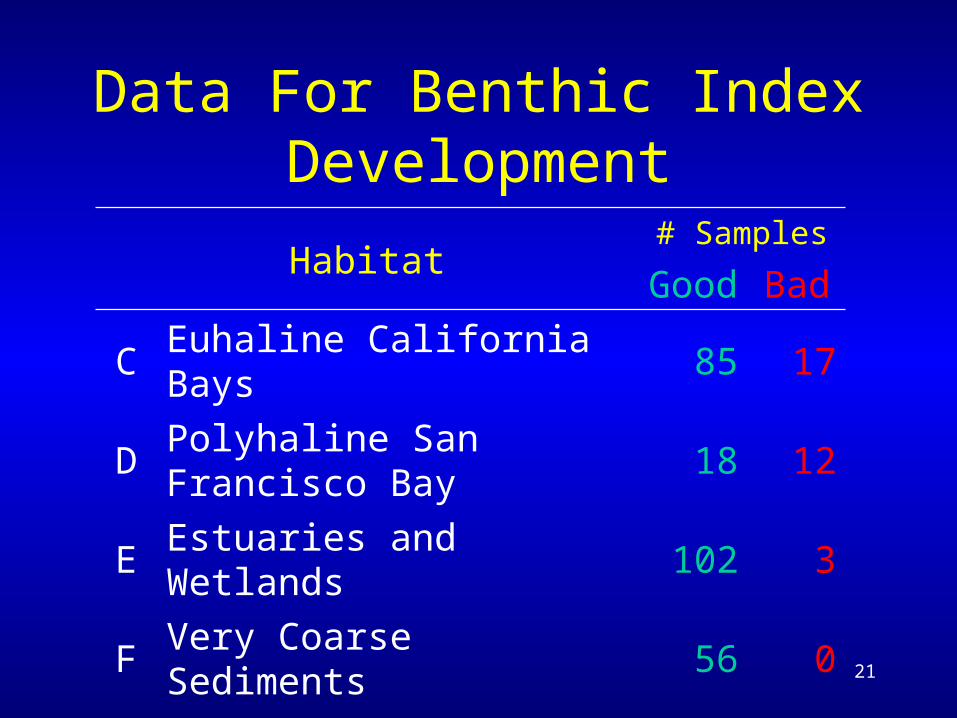
Data For Benthic Index Development
Habitat# Samples
Good Bad
C Euhaline California Bays 85 17
D Polyhaline San Francisco Bay 18 12
E Estuaries and Wetlands 102 3
F Very Coarse Sediments 56 0
G Mesohaline San Francisco Bay 20 4
H Tidal Freshwater 65 0

22
Data For Benthic Index DevelopmentNumbers of samples
HabitatCalibration Validation
G B G B
C Euhaline California Bays 75 9 10 8
D Polyhaline San Francisco Bay 9 6 11 6

23
The Calibration Process
• Identify habitats with sufficient data– “Good” and “Bad” sites– For index calibration and validation
• Distribute calibration data– Teams calibrate candidate indices
• Distribute independent data for validation– Teams apply candidates to data
• Results compiled for evaluation

24
Overview
• Why Benthos and Benthic Indices?
• The Index Development Process– Define Habitat Strata
– Calibrate Candidate Benthic Indices
– Validate and Evaluate Candidate Indices
• Proposed Next Steps

25
Index Validation Approaches• Classification accuracy
– Chemistry and toxicity– Biologist best professional judgment
• Repeatability– Same day– Same site on different days
• Independence from natural gradients• Correlations with other information
– Species richness– Other indices

26
Overall Classification AccuracyValidation Data (%)
Index Overall(n=35)
RIVPACS 83
BRI-TC 77
IBI 70
BRI-MNDF 63
BQI 63
RBI 51

27
Habitat Classification Accuracy Validation Data (%)
IndexSouthern California
(n=18)
San Francisco Bay(n=17)
RIVPACS 72 94
BRI-TC 72 82
IBI 67 73
BRI-MNDF 56 71
BQI 50 76
RBI 22 82

28
Status Classification Accuracy Validation Data (%)
Index“Good”
Sites(n=21)
“Bad”
Sites(n=14)
RIVPACS 86 79
BRI-TC 81 71
IBI 100 29
BRI-MNDF 67 57
BQI 81 36
RBI 52 50

29
Potential Reasons for Low Classification Accuracy
• Do threshold and scaling problems exist?– Does an index correlate well with condition,
but an incorrect threshold lead to the wrong interpretation?
• Are chemistry-toxicity “bad” definitions inadequate?– Chemistry criteria were less stringent than
many other benthic index efforts

30
RIVPACS vs Amphipod Mortality - San Francisco BayA
mp
hip
od
Mo
rta
lity
(%)
-20
0
20
40
60
80
100
RIVPACS Score
-1.5 -1.0 -0.5 0.0

31
RBI vs Amphipod Mortality - San Francisco BayA
mp
hip
od
Mo
rta
lity
(%)
-20
0
20
40
60
80
100
RBI Score
-1.0 -0.8 -0.6 -0.4 -0.2 0.0

32
BQI vs Amphipod Mortality - Southern CaliforniaA
mp
hip
od
Mo
rta
lity
(%)
-20
0
20
40
60
80
100
BQI Score
-20 -15 -10 -5 0
33
Are Validation Sites Misclassified?
• Is our “Gold Standard” correct?– Are multiple indices disagreeing?– How do index disagreements relate to biology?
• Samples with multiple disagreements evaluated– Using biologist best professional judgment

34
Disagreements with Status Designations
Number of Candidates Disagreeing
N(Σ=35)
0 8
1 9
2 5
3 6
4 4
5 2
6 1

35
Biology Comparison
• For six of seven samples– Biologists agreed that the chemistry-toxicity
status was incorrect• All four biologists agreed for four samples
• 75% agreement for other two
• “Gold Standard” is tarnished

36
Effect of Status Changeon Overall Classification Accuracy
Index Original After Change
RIVPACS 83 83
BRI-TC 77 89
IBI 70 76
BRI-MNDF 63 74
BQI 63 80
RBI 51 63

37
Overview
• Why Benthos and Benthic Indices?
• The Index Development Process– Define Habitat Strata
– Calibrate Candidate Benthic Indices
– Validate and Evaluate Candidate Indices
• Proposed Next Steps

38
Complete the Index Validation Process
• Classification accuracy– Chemistry and toxicity– Biologist best professional judgment
• Repeatability– Same day– Same site on different days
• Independence from natural gradients• Correlations with other information
– Species richness– Other indices

39
Biology Classification
• Panel of six external experts– Evaluate 20-25 samples– Samples where 5 of 6 experts agree will
establish a new “Gold Standard”• To be used in the same way as the chemistry-
toxicity classification
40
Repeatability
• Identify sites where– Multiple samples were collected on the same
visit– Multiple visits to the same site
• Evaluate candidate index stability

41
Summary
• We will be able to develop benthic indices for two habitats– Some indices validating well
• Validation rates with sediment toxicity and chemistry data are low– Need to re-visit our scaling methods for some indices– Need to establishing biology-based good and bad criteria
• Best professional judgment of an independent panel of experts
• Have more validation steps to complete before making final selections