1. service request performance by city service area - top
TRANSCRIPT

Service Request (SR) Performance by City Service Area - January 2018
City Service Area ReportFor January 2018
Central (1)
North Central (6)
Northeast (2)
Northwest (5)
South Ce...
Southeast (3)
Southwest (4)
Unknown
Central (1)
North Central (6)
Northeast (2)
Northwest (5)
South Ce...
Southeast (3)
Southwest (4)
Unknown
SRs Created
Service AreaCentral (1)North Central (6)Northeast (2)Northwest (5)South Central (7)Southeast (3)Southwest (4)Unknown
Service Area SRs Created % of City Wide Total % Closed On Time
Central (1) 4,086 12.1% 97.2%
North Central (6) 2,646 7.8% 96.1%
Northeast (2) 4,850 14.3% 96.6%
Northwest (5) 4,328 12.8% 98.0%
South Central (7) 5,334 15.7% 93.9%
Southeast (3) 6,967 20.6% 95.3%
Southwest (4) 5,533 16.3% 97.2%
Unknown 129 0.4% 97.3%
Total 33,873 100.0% 96.2%
R-csr017-cmoS V1 Page: 1 Run Date: Feb 10, 2018 11:15:59 PMCITY OF DALLAS, TX NOTE: Values represent status as of the run date and time.

Service Request (SR) Performance by City Service Area - January 2018
Service Level Performance Report by City Service AreaFor January 2018
Citywide
Most Common SRs Created During the Reporting Period
Top Services Requested
SRs Created
Total Open SRs
Total Open On
Time
% Open On
Time
SLA Goal
Average Days to Close
Total Closed
% of SRs
Closed
Total Closed On
Time
% Closed
On Time
Total SRs On Time
Total On
Time %
Litter - CCS 1,900 450 375 83.3% 20 8.3 1,450 76.3% 1,259 86.8% 1,634 86.0%
Garbage Roll Cart - Residential - SAN
1,706 0 0 0.0% 7 1.9 1,706 100.0% 1,705 99.9% 1,705 99.9%
Garbage - Missed - SAN
1,603 0 0 0.0% 3 1.0 1,603 100.0% 1,558 97.2% 1,558 97.2%
Recycling - Roll Cart - SAN
1,222 110 0 0.0% 7 1.8 1,112 91.0% 1,112 100.0% 1,112 91.0%
Dead Animal Pick Up - SAN
1,082 0 0 0.0% 1 0.4 1,082 100.0% 1,061 98.1% 1,061 98.1%
Water/Wastewater Line Locate - SCS
1,050 0 0 0.0% 2 0.0 1,050 100.0% 1,050 100.0% 1,050 100.0%
Bulky Trash Violations - CCS
1,049 20 2 10.0% 7 3.7 1,029 98.1% 892 86.7% 894 85.2%
Signs - Public Right of Way - CCS
898 1 0 0.0% 5 0.5 897 99.9% 870 97.0% 870 96.9%
Animal - Vaccination Investigation - DAS
887 0 0 0.0% 30 0.0 887 100.0% 887 100.0% 887 100.0%
24 Hour Parking Violation - DPD
865 0 0 0.0% 7 3.7 865 100.0% 789 91.2% 789 91.2%
Animal - Loose Dog (Owned) - DAS
853 0 0 0.0% 3 0.2 853 100.0% 830 97.3% 830 97.3%
Parking - Report a Violation - TRN
784 0 0 0.0% 2 0.5 784 100.0% 760 96.9% 760 96.9%
Smoke Detector Request - DFD
767 0 0 0.0% 10 0.9 767 100.0% 756 98.6% 756 98.6%
Brush Busters - SAN 752 0 0 0.0% 5 1.6 752 100.0% 735 97.7% 735 97.7%
Substandard Structure - CCS
739 484 484 100.0% 120 8.0 255 34.5% 255 100.0% 739 100.0%
Recycle - Missed - SAN
707 0 0 0.0% 3 1.1 707 100.0% 682 96.5% 682 96.5%
Obstruction Alley/Sidewalk/Street - CCS
676 252 252 100.0% 45 7.8 424 62.7% 424 100.0% 676 100.0%
Miscellaneous Service Request - CTY
651 0 0 0.0% 10 0.6 651 100.0% 651 100.0% 651 100.0%
Animal - Stray Dog - DAS
597 0 0 0.0% 25 0.1 597 100.0% 597 100.0% 597 100.0%
Illegal Dumping - CCS
521 32 18 56.2% 10 3.3 489 93.9% 457 93.5% 475 91.2%
R-csr017-cmoS V1 Page: 2 Run Date: Feb 10, 2018 11:15:59 PMCITY OF DALLAS, TX NOTE: Values represent status as of the run date and time.

Service Request (SR) Performance by City Service Area - January 2018
Service Level Performance Report by City Service AreaFor January 2018
Central (1)
Top 10 Service Requests
SR Type Service Request Count
Litter - CCS 232
Water/Wastewater Line Locate - SCS 186
Miscellaneous Service Request - CTY 179
Parking - Report a Violation - TRN 173
Graffiti Abatement Request - CCS 171
Garbage Roll Cart - Residential - SAN 144
Signs - Public Right of Way - CCS 143
Garbage - Missed - SAN 132
24 Hour Parking Violation - DPD 128
Obstruction Alley/Sidewalk/Street - CCS 115 14.5%
11.6%11.2%
10.8%
10.7%
9.0%
8.9% 8.2%
8.0%
7.2%
Top 10 Requests
SR Type DescriptionLitter - CCSWater/Wastewater Line L...Miscellaneous Service Req...Parking - Report a Violatio...Graffiti Abatement Reques...Garbage Roll Cart - Resid...Signs - Public Right of Wa...Garbage - Missed - SAN24 Hour Parking Violation ...Obstruction Alley/Sidewal...
Summary - All Services Requested
SRs Created Total Closed Total Closed on Time % Closed On Time Total Open SRs Total Open On Time % Open On Time Total On Time %
4,086 3,713 3,610 97.2% 373 351 94.1% 96.9%
Monthly Trend of Service Requests
0
500
1,000
1,500
2,000
2,500
3,000
3,500
4,000
4,500
0
500
1,000
1,500
2,000
2,500
3,000
3,500
4,000
4,500 Year/Month2015/12016/12017/12018/1
SRs
Cre
ated
SRs
Cre
ated
Monthly Trend of % SRs Closed On Time
50%
60%
70%
80%
90%
100%
50%
60%
70%
80%
90%
100% Year/Month2015/12016/12017/12018/1
% C
lose
d O
n Ti
me
% C
lose
d O
n Ti
me
R-csr017-cmoS V1 Page: 3 Run Date: Feb 10, 2018 11:15:59 PMCITY OF DALLAS, TX NOTE: Values represent status as of the run date and time.

Service Request (SR) Performance by City Service Area - January 2018
Service Level Performance Report by City Service AreaFor January 2018
Central (1)
Most Common SRs Created During the Reporting Period
Top Services Requested
SRs Created
Total Open SRs
Total Open On
Time
% Open On
Time
SLA Goal
Average Days to Close
Total Closed
% of SRs
Closed
Total Closed On
Time
% Closed
On Time
Total SRs On Time
Total On
Time %
Litter - CCS 232 37 32 86.5% 20 8.2 195 84.1% 176 90.3% 208 89.7%
Water/Wastewater Line Locate - SCS
186 0 0 0.0% 2 0.0 186 100.0% 186 100.0% 186 100.0%
Miscellaneous Service Request - CTY
179 0 0 0.0% 10 0.6 179 100.0% 179 100.0% 179 100.0%
Parking - Report a Violation - TRN
173 0 0 0.0% 2 0.4 173 100.0% 171 98.8% 171 98.8%
Graffiti Abatement Request - CCS
171 0 0 0.0% 30 5.0 171 100.0% 171 100.0% 171 100.0%
Garbage Roll Cart - Residential - SAN
144 0 0 0.0% 7 1.9 144 100.0% 144 100.0% 144 100.0%
Signs - Public Right of Way - CCS
143 0 0 0.0% 5 0.2 143 100.0% 142 99.3% 142 99.3%
Garbage - Missed - SAN
132 0 0 0.0% 3 1.1 132 100.0% 128 97.0% 128 97.0%
24 Hour Parking Violation - DPD
128 0 0 0.0% 7 4.4 128 100.0% 118 92.2% 118 92.2%
Obstruction Alley/Sidewalk/Street - CCS
115 47 47 100.0% 45 6.6 68 59.1% 68 100.0% 115 100.0%
Recycling - Roll Cart - SAN
105 11 0 0.0% 7 2.0 94 89.5% 94 100.0% 94 89.5%
Substandard Structure - CCS
101 80 80 100.0% 120 6.6 21 20.8% 21 100.0% 101 100.0%
Street Repair - Routine - PBW
85 22 22 100.0% 90 4.4 63 74.1% 63 100.0% 85 100.0%
Homeless Encampment - OHS
70 2 2 100.0% 30 5.4 68 97.1% 68 100.0% 70 100.0%
Bulky Trash Violations - CCS
69 0 0 0.0% 7 2.6 69 100.0% 66 95.7% 66 95.7%
Traffic Sign - Maintenance (Other) - TRN
65 1 1 100.0% 10 4.5 64 98.5% 63 98.4% 64 98.5%
Recycle - Missed - SAN
64 0 0 0.0% 3 1.2 64 100.0% 63 98.4% 63 98.4%
Dead Animal Pick Up - SAN
63 0 0 0.0% 1 0.4 63 100.0% 61 96.8% 61 96.8%
Traffic Signal - Flashing - TRN
62 0 0 0.0% 4 0.4 62 100.0% 62 100.0% 62 100.0%
Traffic Signal - Other Dispatch - TRN
61 0 0 0.0% 4 0.4 61 100.0% 61 100.0% 61 100.0%
R-csr017-cmoS V1 Page: 4 Run Date: Feb 10, 2018 11:15:59 PMCITY OF DALLAS, TX NOTE: Values represent status as of the run date and time.

Service Request (SR) Performance by City Service Area - January 2018
Service Level Performance Report by City Service AreaFor January 2018
North Central (6)
Top 10 Service Requests
SR Type Service Request Count
Garbage - Missed - SAN 253
Garbage Roll Cart - Residential - SAN 229
Recycling - Roll Cart - SAN 219
Recycle - Missed - SAN 153
Bulky Trash Violations - CCS 88
Water/Wastewater Line Locate - SCS 86
Dead Animal Pick Up - SAN 84
24 Hour Parking Violation - DPD 70
Miscellaneous Service Request - CTY 63
Street Repair - Routine - PBW 5519.5%
17.6%
16.8%
11.8%
6.8%6.6%
6.5%
5.4%
4.8%
4.2%
Top 10 Requests
SR Type DescriptionGarbage - Missed - SANGarbage Roll Cart - Resid...Recycling - Roll Cart - SANRecycle - Missed - SANBulky Trash Violations - CCSWater/Wastewater Line L...Dead Animal Pick Up - SAN24 Hour Parking Violation ...Miscellaneous Service Req...Street Repair - Routine - ...
Summary - All Services Requested
SRs Created Total Closed Total Closed on Time % Closed On Time Total Open SRs Total Open On Time % Open On Time Total On Time %
2,646 2,484 2,387 96.1% 162 136 84.0% 95.4%
Monthly Trend of Service Requests
0
400
800
1,200
1,600
2,000
2,400
2,800
3,200
0
400
800
1,200
1,600
2,000
2,400
2,800
3,200 Year/Month2015/12016/12017/12018/1
SRs
Cre
ated
SRs
Cre
ated
Monthly Trend of % SRs Closed On Time
50%
60%
70%
80%
90%
100%
50%
60%
70%
80%
90%
100% Year/Month2015/12016/12017/12018/1
% C
lose
d O
n Ti
me
% C
lose
d O
n Ti
me
R-csr017-cmoS V1 Page: 5 Run Date: Feb 10, 2018 11:15:59 PMCITY OF DALLAS, TX NOTE: Values represent status as of the run date and time.

Service Request (SR) Performance by City Service Area - January 2018
Service Level Performance Report by City Service AreaFor January 2018
North Central (6)
Most Common SRs Created During the Reporting Period
Top Services Requested
SRs Created
Total Open SRs
Total Open On
Time
% Open On
Time
SLA Goal
Average Days to Close
Total Closed
% of SRs
Closed
Total Closed On
Time
% Closed
On Time
Total SRs On Time
Total On
Time %
Garbage - Missed - SAN
253 0 0 0.0% 3 0.9 253 100.0% 252 99.6% 252 99.6%
Garbage Roll Cart - Residential - SAN
229 0 0 0.0% 7 2.1 229 100.0% 229 100.0% 229 100.0%
Recycling - Roll Cart - SAN
219 19 0 0.0% 7 2.0 200 91.3% 200 100.0% 200 91.3%
Recycle - Missed - SAN
153 0 0 0.0% 3 1.6 153 100.0% 136 88.9% 136 88.9%
Bulky Trash Violations - CCS
88 3 0 0.0% 7 3.5 85 96.6% 77 90.6% 77 87.5%
Water/Wastewater Line Locate - SCS
86 0 0 0.0% 2 0.0 86 100.0% 86 100.0% 86 100.0%
Dead Animal Pick Up - SAN
84 0 0 0.0% 1 0.4 84 100.0% 79 94.0% 79 94.0%
24 Hour Parking Violation - DPD
70 0 0 0.0% 7 5.8 70 100.0% 44 62.9% 44 62.9%
Miscellaneous Service Request - CTY
63 0 0 0.0% 10 0.6 63 100.0% 63 100.0% 63 100.0%
Street Repair - Routine - PBW
55 21 21 100.0% 90 2.7 34 61.8% 34 100.0% 55 100.0%
Fire Inspection - DFD
49 30 30 100.0% 35 10.2 19 38.8% 19 100.0% 49 100.0%
Parking - Report a Violation - TRN
49 0 0 0.0% 2 0.8 49 100.0% 46 93.9% 46 93.9%
Brush Busters - SAN 48 0 0 0.0% 5 2.1 48 100.0% 47 97.9% 47 97.9%
Inlet/Storm Drain Cleaning - TWM
42 0 0 0.0% 45 1.1 42 100.0% 42 100.0% 42 100.0%
Brush/Bulk Items - Missed - SAN
37 0 0 0.0% 10 1.9 37 100.0% 37 100.0% 37 100.0%
Animal - Neglect - DAS
34 0 0 0.0% 1 0.3 34 100.0% 30 88.2% 30 88.2%
Pot hole - Hazardous - PBW
31 0 0 0.0% 1 0.0 31 100.0% 31 100.0% 31 100.0%
Signs - Public Right of Way - CCS
31 0 0 0.0% 5 1.2 31 100.0% 30 96.8% 30 96.8%
Litter - CCS 30 4 4 100.0% 20 7.8 26 86.7% 25 96.2% 29 96.7%
Sanitation Compliment/Complaint - SAN
27 0 0 0.0% 10 2.4 27 100.0% 27 100.0% 27 100.0%
R-csr017-cmoS V1 Page: 6 Run Date: Feb 10, 2018 11:15:59 PMCITY OF DALLAS, TX NOTE: Values represent status as of the run date and time.

Service Request (SR) Performance by City Service Area - January 2018
Service Level Performance Report by City Service AreaFor January 2018
Northeast (2)
Top 10 Service Requests
SR Type Service Request Count
Garbage - Missed - SAN 305
Garbage Roll Cart - Residential - SAN 276
Recycling - Roll Cart - SAN 255
Bulky Trash Violations - CCS 245
Smoke Detector Request - DFD 173
Obstruction Alley/Sidewalk/Street - CCS 153
Litter - CCS 144
Dead Animal Pick Up - SAN 141
24 Hour Parking Violation - DPD 139
Recycle - Missed - SAN 127 15.6%
14.1%
13.0%
12.5%
8.8%
7.8%7.4%
7.2%
7.1%
6.5%
Top 10 Requests
SR Type DescriptionGarbage - Missed - SANGarbage Roll Cart - Resid...Recycling - Roll Cart - SANBulky Trash Violations - CCSSmoke Detector Request -...Obstruction Alley/Sidewal...Litter - CCSDead Animal Pick Up - SAN24 Hour Parking Violation ...Recycle - Missed - SAN
Summary - All Services Requested
SRs Created Total Closed Total Closed on Time % Closed On Time Total Open SRs Total Open On Time % Open On Time Total On Time %
4,850 4,440 4,287 96.6% 410 361 88.0% 95.8%
Monthly Trend of Service Requests
0
1,000
2,000
3,000
4,000
5,000
6,000
0
1,000
2,000
3,000
4,000
5,000
6,000 Year/Month2015/12016/12017/12018/1
SRs
Cre
ated
SRs
Cre
ated
Monthly Trend of % SRs Closed On Time
50%
60%
70%
80%
90%
100%
50%
60%
70%
80%
90%
100% Year/Month2015/12016/12017/12018/1
% C
lose
d O
n Ti
me
% C
lose
d O
n Ti
me
R-csr017-cmoS V1 Page: 7 Run Date: Feb 10, 2018 11:15:59 PMCITY OF DALLAS, TX NOTE: Values represent status as of the run date and time.

Service Request (SR) Performance by City Service Area - January 2018
Service Level Performance Report by City Service AreaFor January 2018
Northeast (2)
Most Common SRs Created During the Reporting Period
Top Services Requested
SRs Created
Total Open SRs
Total Open On
Time
% Open On
Time
SLA Goal
Average Days to Close
Total Closed
% of SRs
Closed
Total Closed On
Time
% Closed
On Time
Total SRs On Time
Total On
Time %
Garbage - Missed - SAN
305 0 0 0.0% 3 1.4 305 100.0% 291 95.4% 291 95.4%
Garbage Roll Cart - Residential - SAN
276 0 0 0.0% 7 2.1 276 100.0% 276 100.0% 276 100.0%
Recycling - Roll Cart - SAN
255 27 0 0.0% 7 2.0 228 89.4% 228 100.0% 228 89.4%
Bulky Trash Violations - CCS
245 3 1 33.3% 7 3.4 242 98.8% 221 91.3% 222 90.6%
Smoke Detector Request - DFD
173 0 0 0.0% 10 1.0 173 100.0% 166 96.0% 166 96.0%
Obstruction Alley/Sidewalk/Street - CCS
153 51 51 100.0% 45 9.5 102 66.7% 102 100.0% 153 100.0%
Litter - CCS 144 46 40 87.0% 20 8.5 98 68.1% 95 96.9% 135 93.8%
Dead Animal Pick Up - SAN
141 0 0 0.0% 1 0.4 141 100.0% 140 99.3% 140 99.3%
24 Hour Parking Violation - DPD
139 0 0 0.0% 7 4.7 139 100.0% 130 93.5% 130 93.5%
Recycle - Missed - SAN
127 0 0 0.0% 3 0.8 127 100.0% 126 99.2% 126 99.2%
Water/Wastewater Line Locate - SCS
124 0 0 0.0% 2 0.1 124 100.0% 124 100.0% 124 100.0%
Brush Busters - SAN
115 0 0 0.0% 5 1.8 115 100.0% 107 93.0% 107 93.0%
Parking - Report a Violation - TRN
105 0 0 0.0% 2 0.5 105 100.0% 100 95.2% 100 95.2%
Street Repair - Routine - PBW
103 47 47 100.0% 90 3.7 56 54.4% 56 100.0% 103 100.0%
Miscellaneous Service Request - CTY
98 0 0 0.0% 10 0.6 98 100.0% 98 100.0% 98 100.0%
Fire Inspection - DFD
85 22 22 100.0% 35 10.8 63 74.1% 63 100.0% 85 100.0%
Signs - Public Right of Way - CCS
79 1 0 0.0% 5 0.8 78 98.7% 74 94.9% 74 93.7%
Graffiti Abatement Request - CCS
76 0 0 0.0% 30 2.2 76 100.0% 76 100.0% 76 100.0%
Animal - Neglect - DAS
75 0 0 0.0% 1 0.2 75 100.0% 67 89.3% 67 89.3%
Animal - Stray Dog - DAS
65 0 0 0.0% 25 0.1 65 100.0% 65 100.0% 65 100.0%
R-csr017-cmoS V1 Page: 8 Run Date: Feb 10, 2018 11:15:59 PMCITY OF DALLAS, TX NOTE: Values represent status as of the run date and time.

Service Request (SR) Performance by City Service Area - January 2018
Service Level Performance Report by City Service AreaFor January 2018
Northwest (5)
Top 10 Service Requests
SR Type Service Request Count
Taxi - Transportation Complaint - AVI 411
Signs - Public Right of Way - CCS 261
Water/Wastewater Line Locate - SCS 212
Garbage - Missed - SAN 194
Garbage Roll Cart - Residential - SAN 173
Parking - Report a Violation - TRN 142
24 Hour Parking Violation - DPD 132
Obstruction Alley/Sidewalk/Street - CCS 123
Recycling - Roll Cart - SAN 118
Litter - CCS 114
21.9%
13.9%
11.3%
10.3%
9.2%
7.6% 7.0%6.5%
6.3%
6.1%
Top 10 Requests
SR Type DescriptionTaxi - Transportation Com...Signs - Public Right of Wa...Water/Wastewater Line L...Garbage - Missed - SANGarbage Roll Cart - Resid...Parking - Report a Violatio...24 Hour Parking Violation ...Obstruction Alley/Sidewal...Recycling - Roll Cart - SANLitter - CCS
Summary - All Services Requested
SRs Created Total Closed Total Closed on Time % Closed On Time Total Open SRs Total Open On Time % Open On Time Total On Time %
4,328 3,987 3,906 98.0% 341 315 92.4% 97.5%
Monthly Trend of Service Requests
0
500
1,000
1,500
2,000
2,500
3,000
3,500
4,000
4,500
0
500
1,000
1,500
2,000
2,500
3,000
3,500
4,000
4,500 Year/Month2015/12016/12017/12018/1
SRs
Cre
ated
SRs
Cre
ated
Monthly Trend of % SRs Closed On Time
50%
60%
70%
80%
90%
100%
50%
60%
70%
80%
90%
100% Year/Month2015/12016/12017/12018/1
% C
lose
d O
n Ti
me
% C
lose
d O
n Ti
me
R-csr017-cmoS V1 Page: 9 Run Date: Feb 10, 2018 11:15:59 PMCITY OF DALLAS, TX NOTE: Values represent status as of the run date and time.

Service Request (SR) Performance by City Service Area - January 2018
Service Level Performance Report by City Service AreaFor January 2018
Northwest (5)
Most Common SRs Created During the Reporting Period
Top Services Requested
SRs Created
Total Open SRs
Total Open On
Time
% Open On
Time
SLA Goal
Average Days to Close
Total Closed
% of SRs
Closed
Total Closed On
Time
% Closed
On Time
Total SRs On Time
Total On
Time %
Taxi - Transportation Complaint - AVI
411 0 0 0.0% 14 0.0 411 100.0% 411 100.0% 411 100.0%
Signs - Public Right of Way - CCS
261 0 0 0.0% 5 0.3 261 100.0% 250 95.8% 250 95.8%
Water/Wastewater Line Locate - SCS
212 0 0 0.0% 2 0.0 212 100.0% 212 100.0% 212 100.0%
Garbage - Missed - SAN
194 0 0 0.0% 3 0.8 194 100.0% 193 99.5% 193 99.5%
Garbage Roll Cart - Residential - SAN
173 0 0 0.0% 7 1.9 173 100.0% 173 100.0% 173 100.0%
Parking - Report a Violation - TRN
142 0 0 0.0% 2 0.4 142 100.0% 141 99.3% 141 99.3%
24 Hour Parking Violation - DPD
132 0 0 0.0% 7 2.2 132 100.0% 132 100.0% 132 100.0%
Obstruction Alley/Sidewalk/Street - CCS
123 52 52 100.0% 45 3.4 71 57.7% 71 100.0% 123 100.0%
Recycling - Roll Cart - SAN
118 15 0 0.0% 7 1.9 103 87.3% 103 100.0% 103 87.3%
Litter - CCS 114 38 37 97.4% 20 7.2 76 66.7% 74 97.4% 111 97.4%
Bulky Trash Violations - CCS
107 0 0 0.0% 7 3.0 107 100.0% 96 89.7% 96 89.7%
Recycle - Missed - SAN
102 0 0 0.0% 3 0.9 102 100.0% 101 99.0% 101 99.0%
Dead Animal Pick Up - SAN
100 0 0 0.0% 1 0.4 100 100.0% 99 99.0% 99 99.0%
Brush Busters - SAN
95 0 0 0.0% 5 2.2 95 100.0% 90 94.7% 90 94.7%
Miscellaneous Service Request - CTY
89 0 0 0.0% 10 0.7 89 100.0% 89 100.0% 89 100.0%
Street Repair - Routine - PBW
72 33 33 100.0% 90 4.6 39 54.2% 39 100.0% 72 100.0%
Fire Inspection - DFD
63 44 44 100.0% 35 5.4 19 30.2% 19 100.0% 63 100.0%
Animal - Neglect - DAS
61 0 0 0.0% 1 0.3 61 100.0% 50 82.0% 50 82.0%
Parking - Unapproved Surface - CCS
54 0 0 0.0% 7 1.0 54 100.0% 53 98.1% 53 98.1%
Motor Vehicle Repair Violation - CCS
48 8 8 100.0% 20 2.5 40 83.3% 40 100.0% 48 100.0%
R-csr017-cmoS V1 Page: 10 Run Date: Feb 10, 2018 11:15:59 PMCITY OF DALLAS, TX NOTE: Values represent status as of the run date and time.

Service Request (SR) Performance by City Service Area - January 2018
Service Level Performance Report by City Service AreaFor January 2018
South Central (7)
Top 10 Service Requests
SR Type Service Request Count
Litter - CCS 533
Garbage Roll Cart - Residential - SAN 315
Dead Animal Pick Up - SAN 230
Garbage - Missed - SAN 227
Bulky Trash Violations - CCS 212
Animal - Loose Dog (Owned) - DAS 187
Brush Busters - SAN 183
Smoke Detector Request - DFD 179
Animal - Aggressive Activity - DAS 148
Substandard Structure - CCS 147
22.6%
13.3%
9.7%
9.6%
9.0%
7.9%7.8%
7.6%
6.3%
6.2%
Top 10 Requests
SR Type DescriptionLitter - CCSGarbage Roll Cart - Resid...Dead Animal Pick Up - SANGarbage - Missed - SANBulky Trash Violations - CCSAnimal - Loose Dog (Own...Brush Busters - SANSmoke Detector Request -...Animal - Aggressive Activi...Substandard Structure - C...
Summary - All Services Requested
SRs Created Total Closed Total Closed on Time % Closed On Time Total Open SRs Total Open On Time % Open On Time Total On Time %
5,334 4,667 4,384 93.9% 667 598 89.7% 93.4%
Monthly Trend of Service Requests
0
1,000
2,000
3,000
4,000
5,000
6,000
0
1,000
2,000
3,000
4,000
5,000
6,000 Year/Month2015/12016/12017/12018/1
SRs
Cre
ated
SRs
Cre
ated
Monthly Trend of % SRs Closed On Time
50%
60%
70%
80%
90%
100%
50%
60%
70%
80%
90%
100% Year/Month2015/12016/12017/12018/1
% C
lose
d O
n Ti
me
% C
lose
d O
n Ti
me
R-csr017-cmoS V1 Page: 11 Run Date: Feb 10, 2018 11:15:59 PMCITY OF DALLAS, TX NOTE: Values represent status as of the run date and time.

Service Request (SR) Performance by City Service Area - January 2018
Service Level Performance Report by City Service AreaFor January 2018
South Central (7)
Most Common SRs Created During the Reporting Period
Top Services Requested
SRs Created
Total Open SRs
Total Open On
Time
% Open On
Time
SLA Goal
Average Days to Close
Total Closed
% of SRs
Closed
Total Closed On
Time
% Closed
On Time
Total SRs On Time
Total On
Time %
Litter - CCS 533 157 133 84.7% 20 9.2 376 70.5% 317 84.3% 450 84.4%
Garbage Roll Cart - Residential - SAN
315 0 0 0.0% 7 1.7 315 100.0% 315 100.0% 315 100.0%
Dead Animal Pick Up - SAN
230 0 0 0.0% 1 0.4 230 100.0% 224 97.4% 224 97.4%
Garbage - Missed - SAN
227 0 0 0.0% 3 1.0 227 100.0% 210 92.5% 210 92.5%
Bulky Trash Violations - CCS
212 9 1 11.1% 7 5.5 203 95.8% 143 70.4% 144 67.9%
Animal - Loose Dog (Owned) - DAS
187 0 0 0.0% 3 0.2 187 100.0% 184 98.4% 184 98.4%
Brush Busters - SAN
183 0 0 0.0% 5 1.6 183 100.0% 183 100.0% 183 100.0%
Smoke Detector Request - DFD
179 0 0 0.0% 10 0.8 179 100.0% 179 100.0% 179 100.0%
Animal - Aggressive Activity - DAS
148 0 0 0.0% 1 0.0 148 100.0% 134 90.5% 134 90.5%
Substandard Structure - CCS
147 122 122 100.0% 120 8.3 25 17.0% 25 100.0% 147 100.0%
Obstruction Alley/Sidewalk/Street - CCS
146 48 48 100.0% 45 10.4 98 67.1% 98 100.0% 146 100.0%
Recycling - Roll Cart - SAN
142 11 0 0.0% 7 1.6 131 92.3% 131 100.0% 131 92.3%
Parking - Unapproved Surface - CCS
123 5 0 0.0% 7 3.7 118 95.9% 102 86.4% 102 82.9%
Animal - Stray Dog - DAS
121 0 0 0.0% 25 0.1 121 100.0% 121 100.0% 121 100.0%
Illegal Dumping - CCS
120 19 11 57.9% 10 4.3 101 84.2% 89 88.1% 100 83.3%
Signs - Public Right of Way - CCS
114 0 0 0.0% 5 0.5 114 100.0% 111 97.4% 111 97.4%
Animal - Attack in Progress - DAS
99 0 0 0.0% 1 0.0 99 100.0% 90 90.9% 90 90.9%
Junk Motor Vehicle - CCS
93 55 55 100.0% 90 10.5 38 40.9% 38 100.0% 93 100.0%
24 Hour Parking Violation - DPD
86 0 0 0.0% 7 3.8 86 100.0% 83 96.5% 83 96.5%
Parking - Report a Violation - TRN
85 0 0 0.0% 2 0.5 85 100.0% 81 95.3% 81 95.3%
R-csr017-cmoS V1 Page: 12 Run Date: Feb 10, 2018 11:15:59 PMCITY OF DALLAS, TX NOTE: Values represent status as of the run date and time.

Service Request (SR) Performance by City Service Area - January 2018
Service Level Performance Report by City Service AreaFor January 2018
Southeast (3)
Top 10 Service Requests
SR Type Service Request Count
Animal - Vaccination Investigation - DAS 884
Litter - CCS 523
Smoke Detector Request - DFD 370
Animal - Loose Dog (Owned) - DAS 343
Garbage Roll Cart - Residential - SAN 337
Substandard Structure - CCS 313
Dead Animal Pick Up - SAN 238
Recycling - Roll Cart - SAN 201
Animal - Stray Dog - DAS 184
Bulky Trash Violations - CCS 173
24.8%
14.7%
10.4%
9.6%
9.5%
8.8% 6.7%
5.6%
5.2%
4.9%
Top 10 Requests
SR Type DescriptionAnimal - Vaccination Inve...Litter - CCSSmoke Detector Request -...Animal - Loose Dog (Own...Garbage Roll Cart - Resid...Substandard Structure - C...Dead Animal Pick Up - SANRecycling - Roll Cart - SANAnimal - Stray Dog - DASBulky Trash Violations - CCS
Summary - All Services Requested
SRs Created Total Closed Total Closed on Time % Closed On Time Total Open SRs Total Open On Time % Open On Time Total On Time %
6,967 6,406 6,107 95.3% 561 523 93.2% 95.2%
Monthly Trend of Service Requests
0
1,000
2,000
3,000
4,000
5,000
6,000
7,000
8,000
0
1,000
2,000
3,000
4,000
5,000
6,000
7,000
8,000 Year/Month2015/12016/12017/12018/1
SRs
Cre
ated
SRs
Cre
ated
Monthly Trend of % SRs Closed On Time
50%
60%
70%
80%
90%
100%
50%
60%
70%
80%
90%
100% Year/Month2015/12016/12017/12018/1
% C
lose
d O
n Ti
me
% C
lose
d O
n Ti
me
R-csr017-cmoS V1 Page: 13 Run Date: Feb 10, 2018 11:15:59 PMCITY OF DALLAS, TX NOTE: Values represent status as of the run date and time.
Service Request (SR) Performance by City Service Area - January 2018
Service Level Performance Report by City Service AreaFor January 2018
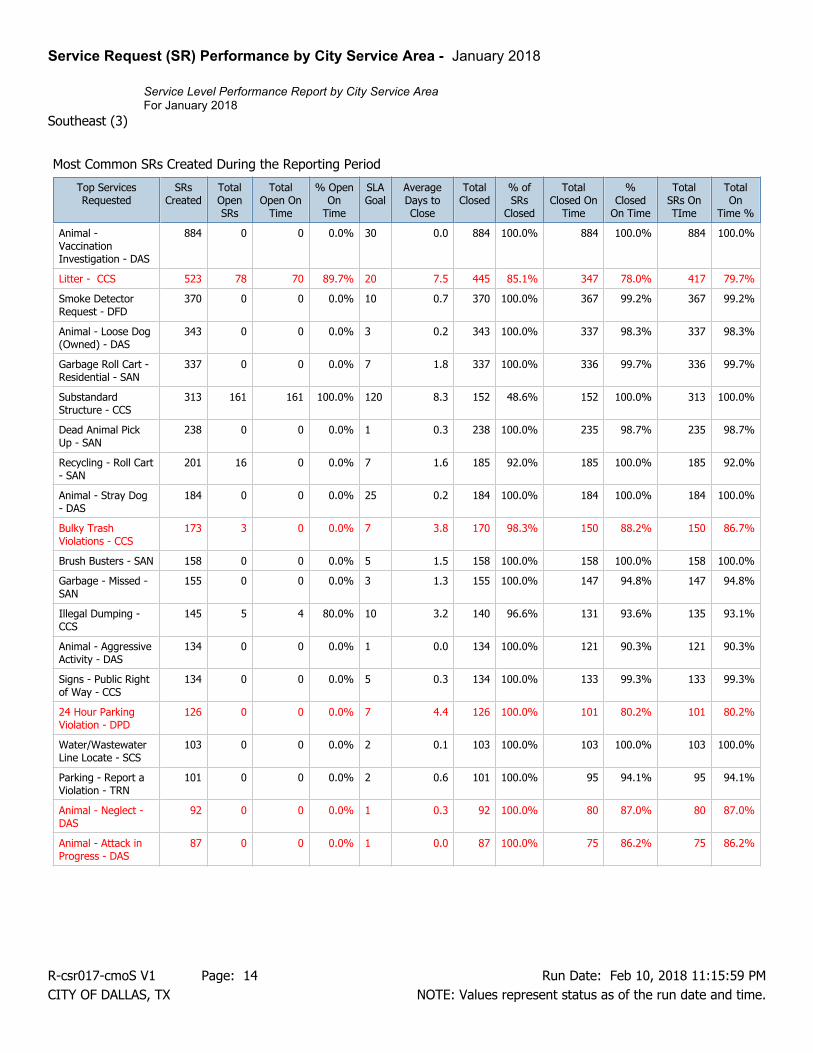
Southeast (3)
Most Common SRs Created During the Reporting Period
Top Services Requested
SRs Created
Total Open SRs
Total Open On
Time
% Open On
Time
SLA Goal
Average Days to Close
Total Closed
% of SRs
Closed
Total Closed On
Time
% Closed
On Time
Total SRs On TIme
Total On
Time %
Animal - Vaccination Investigation - DAS
884 0 0 0.0% 30 0.0 884 100.0% 884 100.0% 884 100.0%
Litter - CCS 523 78 70 89.7% 20 7.5 445 85.1% 347 78.0% 417 79.7%
Smoke Detector Request - DFD
370 0 0 0.0% 10 0.7 370 100.0% 367 99.2% 367 99.2%
Animal - Loose Dog (Owned) - DAS
343 0 0 0.0% 3 0.2 343 100.0% 337 98.3% 337 98.3%
Garbage Roll Cart - Residential - SAN
337 0 0 0.0% 7 1.8 337 100.0% 336 99.7% 336 99.7%
Substandard Structure - CCS
313 161 161 100.0% 120 8.3 152 48.6% 152 100.0% 313 100.0%
Dead Animal Pick Up - SAN
238 0 0 0.0% 1 0.3 238 100.0% 235 98.7% 235 98.7%
Recycling - Roll Cart - SAN
201 16 0 0.0% 7 1.6 185 92.0% 185 100.0% 185 92.0%
Animal - Stray Dog - DAS
184 0 0 0.0% 25 0.2 184 100.0% 184 100.0% 184 100.0%
Bulky Trash Violations - CCS
173 3 0 0.0% 7 3.8 170 98.3% 150 88.2% 150 86.7%
Brush Busters - SAN 158 0 0 0.0% 5 1.5 158 100.0% 158 100.0% 158 100.0%
Garbage - Missed - SAN
155 0 0 0.0% 3 1.3 155 100.0% 147 94.8% 147 94.8%
Illegal Dumping - CCS
145 5 4 80.0% 10 3.2 140 96.6% 131 93.6% 135 93.1%
Animal - Aggressive Activity - DAS
134 0 0 0.0% 1 0.0 134 100.0% 121 90.3% 121 90.3%
Signs - Public Right of Way - CCS
134 0 0 0.0% 5 0.3 134 100.0% 133 99.3% 133 99.3%
24 Hour Parking Violation - DPD
126 0 0 0.0% 7 4.4 126 100.0% 101 80.2% 101 80.2%
Water/Wastewater Line Locate - SCS
103 0 0 0.0% 2 0.1 103 100.0% 103 100.0% 103 100.0%
Parking - Report a Violation - TRN
101 0 0 0.0% 2 0.6 101 100.0% 95 94.1% 95 94.1%
Animal - Neglect - DAS
92 0 0 0.0% 1 0.3 92 100.0% 80 87.0% 80 87.0%
Animal - Attack in Progress - DAS
87 0 0 0.0% 1 0.0 87 100.0% 75 86.2% 75 86.2%
R-csr017-cmoS V1 Page: 14 Run Date: Feb 10, 2018 11:15:59 PMCITY OF DALLAS, TX NOTE: Values represent status as of the run date and time.

Service Request (SR) Performance by City Service Area - January 2018
Service Level Performance Report by City Service AreaFor January 2018
Southwest (4)
Top 10 Service Requests
SR Type Service Request Count
Garbage - Missed - SAN 335
Litter - CCS 318
Water/Wastewater Line Locate - SCS 244
Garbage Roll Cart - Residential - SAN 231
Dead Animal Pick Up - SAN 222
24 Hour Parking Violation - DPD 183
Recycling - Roll Cart - SAN 181
Recycle - Missed - SAN 176
Animal - Loose Dog (Owned) - DAS 167
Bulky Trash Violations - CCS 155 15.1%
14.4%11.0%
10.4%
10.0%
8.3%
8.2%8.0%
7.5%
7.0%
Top 10 Requests
SR Type DescriptionGarbage - Missed - SANLitter - CCSWater/Wastewater Line L...Garbage Roll Cart - Resid...Dead Animal Pick Up - SAN24 Hour Parking Violation ...Recycling - Roll Cart - SANRecycle - Missed - SANAnimal - Loose Dog (Own...Bulky Trash Violations - CCS
Summary - All Services Requested
SRs Created Total Closed Total Closed on Time % Closed On Time Total Open SRs Total Open On Time % Open On Time Total On Time %
5,533 5,053 4,911 97.2% 480 415 86.5% 96.3%
Monthly Trend of Service Requests
0
1,000
2,000
3,000
4,000
5,000
6,000
7,000
0
1,000
2,000
3,000
4,000
5,000
6,000
7,000 Year/Month2015/12016/12017/12018/1
SRs
Cre
ated
SRs
Cre
ated
Monthly Trend of % SRs Closed On Time
50%
60%
70%
80%
90%
100%
50%
60%
70%
80%
90%
100% Year/Month2015/12016/12017/12018/1
% C
lose
d O
n Ti
me
% C
lose
d O
n Ti
me
R-csr017-cmoS V1 Page: 15 Run Date: Feb 10, 2018 11:15:59 PMCITY OF DALLAS, TX NOTE: Values represent status as of the run date and time.

Service Request (SR) Performance by City Service Area - January 2018
Service Level Performance Report by City Service AreaFor January 2018
Southwest (4)
Most Common SRs Created During the Reporting Period
Top Services Requested
SRs Created
Total Open SRs
Total Open On
Time
% Open On
Time
SLA Goal
Average Days to Close
Total Closed
% of SRs
Closed
Total Closed On
Time
% Closed
On Time
Total SRs On Time
Total On
Time %
Garbage - Missed - SAN
335 0 0 0.0% 3 0.7 335 100.0% 335 100.0% 335 100.0%
Litter - CCS 318 89 58 65.2% 20 8.7 229 72.0% 220 96.1% 278 87.4%
Water/Wastewater Line Locate - SCS
244 0 0 0.0% 2 0.0 244 100.0% 244 100.0% 244 100.0%
Garbage Roll Cart - Residential - SAN
231 0 0 0.0% 7 1.9 231 100.0% 231 100.0% 231 100.0%
Dead Animal Pick Up - SAN
222 0 0 0.0% 1 0.3 222 100.0% 219 98.6% 219 98.6%
24 Hour Parking Violation - DPD
183 0 0 0.0% 7 2.6 183 100.0% 181 98.9% 181 98.9%
Recycling - Roll Cart - SAN
181 11 0 0.0% 7 1.8 170 93.9% 170 100.0% 170 93.9%
Recycle - Missed - SAN
176 0 0 0.0% 3 0.7 176 100.0% 176 100.0% 176 100.0%
Animal - Loose Dog (Owned) - DAS
167 0 0 0.0% 3 0.2 167 100.0% 160 95.8% 160 95.8%
Bulky Trash Violations - CCS
155 2 0 0.0% 7 3.0 153 98.7% 139 90.8% 139 89.7%
Animal - Stray Dog - DAS
147 0 0 0.0% 25 0.2 147 100.0% 147 100.0% 147 100.0%
Parking - Report a Violation - TRN
126 0 0 0.0% 2 0.5 126 100.0% 124 98.4% 124 98.4%
Signs - Public Right of Way - CCS
124 0 0 0.0% 5 1.2 124 100.0% 118 95.2% 118 95.2%
Brush Busters - SAN
122 0 0 0.0% 5 0.9 122 100.0% 122 100.0% 122 100.0%
Animal - Neglect - DAS
108 0 0 0.0% 1 0.6 108 100.0% 92 85.2% 92 85.2%
Animal - Aggressive Activity - DAS
106 0 0 0.0% 1 0.2 106 100.0% 97 91.5% 97 91.5%
Miscellaneous Service Request - CTY
100 0 0 0.0% 10 0.6 100 100.0% 100 100.0% 100 100.0%
Illegal Dumping - CCS
99 4 2 50.0% 10 2.5 95 96.0% 90 94.7% 92 92.9%
Graffiti Abatement Request - CCS
87 4 4 100.0% 30 9.7 83 95.4% 83 100.0% 87 100.0%
Parking - Unapproved Surface - CCS
76 3 0 0.0% 7 1.7 73 96.1% 71 97.3% 71 93.4%
R-csr017-cmoS V1 Page: 16 Run Date: Feb 10, 2018 11:15:59 PMCITY OF DALLAS, TX NOTE: Values represent status as of the run date and time.

Service Request (SR) Performance by City Service Area - January 2018
Service Level Performance Report by City Service AreaFor January 2018
Unknown
Top 10 Service Requests
SR Type Service Request Count
Water/Wastewater Line Locate - SCS 15
Signs - Public Right of Way - CCS 12
Animal - Stray Dog - DAS 8
Litter - CCS 6
Miscellaneous Service Request - CTY 5
Court and Detention Services - CDS 4
Dead Animal Pick Up - SAN 4
Fire Inspection - DFD 3
Parking - Report a Violation - TRN 3
Traffic Sign - Stop Knockdown - TRN 3
23.8%
19.0%
12.7%
9.5%
7.9%6.3%
6.3%
4.8%
4.8%
4.8%
Top 10 Requests
SR Type DescriptionWater/Wastewater Line L...Signs - Public Right of Wa...Animal - Stray Dog - DASLitter - CCSMiscellaneous Service Req...Court and Detention Servi...Dead Animal Pick Up - SANFire Inspection - DFDParking - Report a Violatio...Traffic Sign - Stop Knockd...
Summary - All Services Requested
SRs Created Total Closed Total Closed on Time % Closed On Time Total Open SRs Total Open On Time % Open On Time Total On Time %
129 113 110 97.3% 16 11 68.8% 93.8%
Monthly Trend of Service Requests
0
20
40
60
80
100
120
140
160
0
20
40
60
80
100
120
140
160 Year/Month2015/12016/12017/12018/1
SRs
Cre
ated
SRs
Cre
ated
Monthly Trend of % SRs Closed On Time
50%
60%
70%
80%
90%
100%
50%
60%
70%
80%
90%
100% Year/Month2015/12016/12017/12018/1
% C
lose
d O
n Ti
me
% C
lose
d O
n Ti
me
*** Improved GIS accuracy and tools implemented in the last year have led to better geocoding abilities, resulting in fewer service requests with an “UNKNOWN” location.
R-csr017-cmoS V1 Page: 17 Run Date: Feb 10, 2018 11:15:59 PMCITY OF DALLAS, TX NOTE: Values represent status as of the run date and time.

Service Request (SR) Performance by City Service Area - January 2018
Service Level Performance Report by City Service AreaFor January 2018
Unknown
Most Common SRs Created During the Reporting Period
Top Services Requested
SRs Created
Total Open SRs
Total Open On
Time
% Open On
Time
SLA Goal
Average Days to Close
Total Closed
% of SRs
Closed
Total Closed On
Time
% Closed
On Time
Total SRs On Time
Total On
Time %
Water/Wastewater Line Locate - SCS
15 0 0 0.0% 2 0.0 15 100.0% 15 100.0% 15 100.0%
Signs - Public Right of Way - CCS
12 0 0 0.0% 5 0.0 12 100.0% 12 100.0% 12 100.0%
Animal - Stray Dog - DAS
8 0 0 0.0% 25 0.2 8 100.0% 8 100.0% 8 100.0%
Litter - CCS 6 1 1 100.0% 20 12.4 5 83.3% 5 100.0% 6 100.0%
Miscellaneous Service Request - CTY
5 0 0 0.0% 10 0.6 5 100.0% 5 100.0% 5 100.0%
Court and Detention Services - CDS
4 0 0 0.0% 10 1.5 4 100.0% 4 100.0% 4 100.0%
Dead Animal Pick Up - SAN
4 0 0 0.0% 1 0.2 4 100.0% 4 100.0% 4 100.0%
Fire Inspection - DFD 3 2 2 100.0% 35 14.0 1 33.3% 1 100.0% 3 100.0%
Parking - Report a Violation - TRN
3 0 0 0.0% 2 1.0 3 100.0% 2 66.7% 2 66.7%
Traffic Sign - Stop Knockdown - TRN
3 0 0 0.0% 4 0.5 3 100.0% 3 100.0% 3 100.0%
Traffic Signal - Other Dispatch - TRN
3 0 0 0.0% 4 0.3 3 100.0% 3 100.0% 3 100.0%
Animal - Aggressive Activity - DAS
2 0 0 0.0% 1 0.0 2 100.0% 2 100.0% 2 100.0%
Animal - Confined Stray - DAS
2 0 0 0.0% 2 0.0 2 100.0% 2 100.0% 2 100.0%
Animal - Neglect - DAS
2 0 0 0.0% 1 0.0 2 100.0% 2 100.0% 2 100.0%
Animal - Sick/Injured - DAS
2 0 0 0.0% 3 0.0 2 100.0% 2 100.0% 2 100.0%
Garbage - Missed - SAN
2 0 0 0.0% 3 1.5 2 100.0% 2 100.0% 2 100.0%
Graffiti - General - CTY
2 2 2 100.0% 0.0 0 0.0% 0 0.0% 2 100.0%
Heat Inoperative Apts - CCS
2 0 0 0.0% 7 3.0 2 100.0% 2 100.0% 2 100.0%
Illegal Dumping - CCS 2 2 0 0.0% 10 0.0 0 0.0% 0 0.0% 0 0.0%
Litter - Equipment and Building Services - EBS
2 0 0 0.0% 30 0.0 2 100.0% 2 100.0% 2 100.0%
R-csr017-cmoS V1 Page: 18 Run Date: Feb 10, 2018 11:15:59 PMCITY OF DALLAS, TX NOTE: Values represent status as of the run date and time.