1 stat 500 – statistics for managers stat 500 statistics for managers
TRANSCRIPT

1
STAT 500 – Statistics for Managers
STAT 500Statistics for Managers
STAT 500Statistics for Managers
2
STAT 500 – Statistics for Managers
Agenda for this Session
• Continuous Random Variables
• Uniform Distribution
• Exponential Distribution
• Applications
3
STAT 500 – Statistics for Managers
Agenda for this Session
• Continuous Random Variables
• Uniform Distribution
• Exponential Distribution
• Applications
4
STAT 500 – Statistics for Managers
Continuous Random Variables
•A continuous random variable takes a large set of possible values over an interval. •Examples:
The fuel efficiency of your car Your body temperature The value of your stock portfolio The daily sales value in a grocery store
5
STAT 500 – Statistics for Managers
Continuous Vs Discrete Random Variables
•A discrete variable takes specific values while the continuous variable could take any value in a range or interval. •Look at the following questions:
•In what region of the country were you born? •How many siblings do you have? •What is the speed of travel of a jet plane?
6
STAT 500 – Statistics for Managers
Probability Density Function
•When dealing with continuous random variables, we attempt to define a function, f(x) called probability density function, the graph of which approximates the relative frequency polygon for the population. A probability density function must satisfy two conditions:
•f(x) is non-negative. •The total area under the curve representing f(x) is 1
7
STAT 500 – Statistics for Managers
Probability Density Function
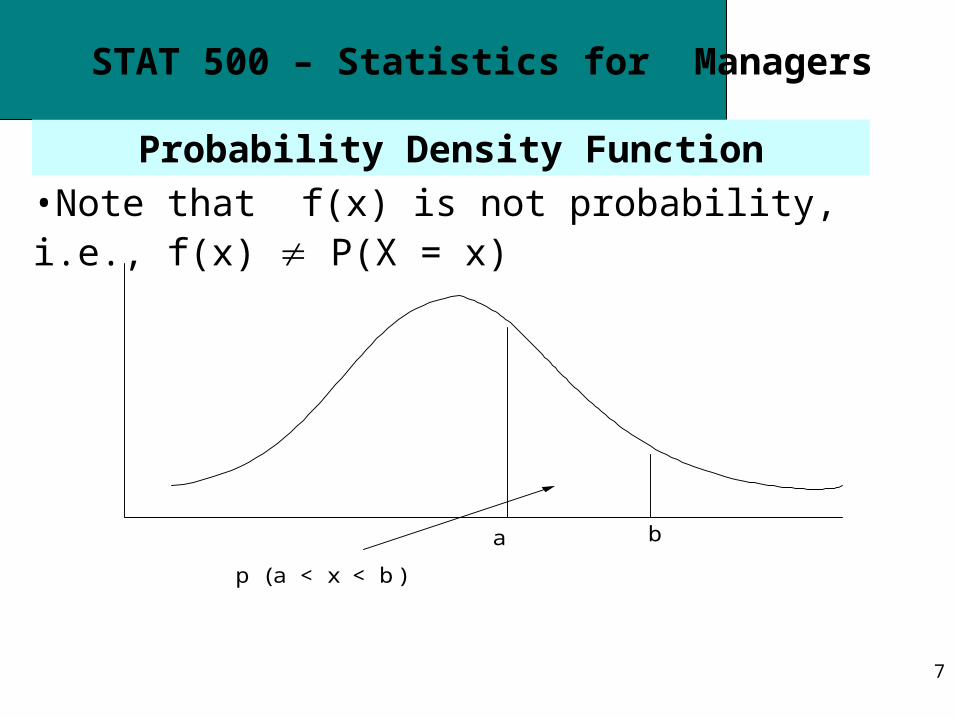
•Note that f(x) is not probability, i.e., f(x) P(X = x)
a b
p (a < x < b)
8
STAT 500 – Statistics for Managers
Probability Density Function
•The area under the curve (corresponding to the probability density function) between 2 points a and b gives the probability the random variable, x lies between a and b or •p(a < x < b) = Area under the curve

9
STAT 500 – Statistics for Managers
Agenda for this Session# 3 Part 3
• Continuous Random Variables
• Uniform Distribution
• Exponential Distribution
• Applications
10
STAT 500 – Statistics for Managers
Uniform Distribution
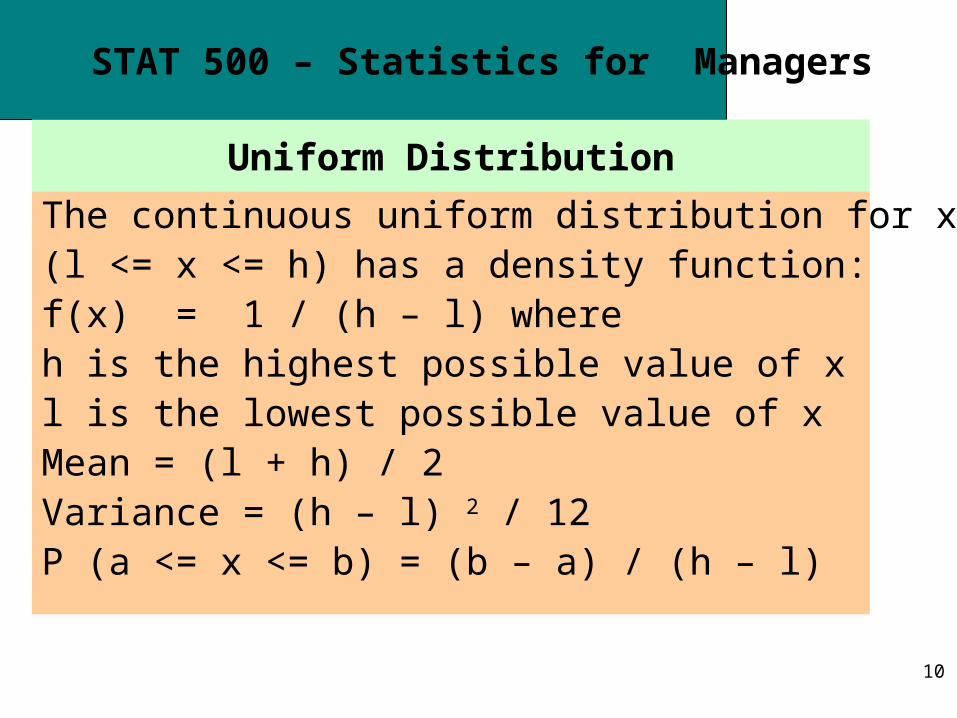
The continuous uniform distribution for x with (l <= x <= h) has a density function: f(x) = 1 / (h – l) where h is the highest possible value of x l is the lowest possible value of x Mean = (l + h) / 2 Variance = (h – l) 2 / 12 P (a <= x <= b) = (b – a) / (h – l)
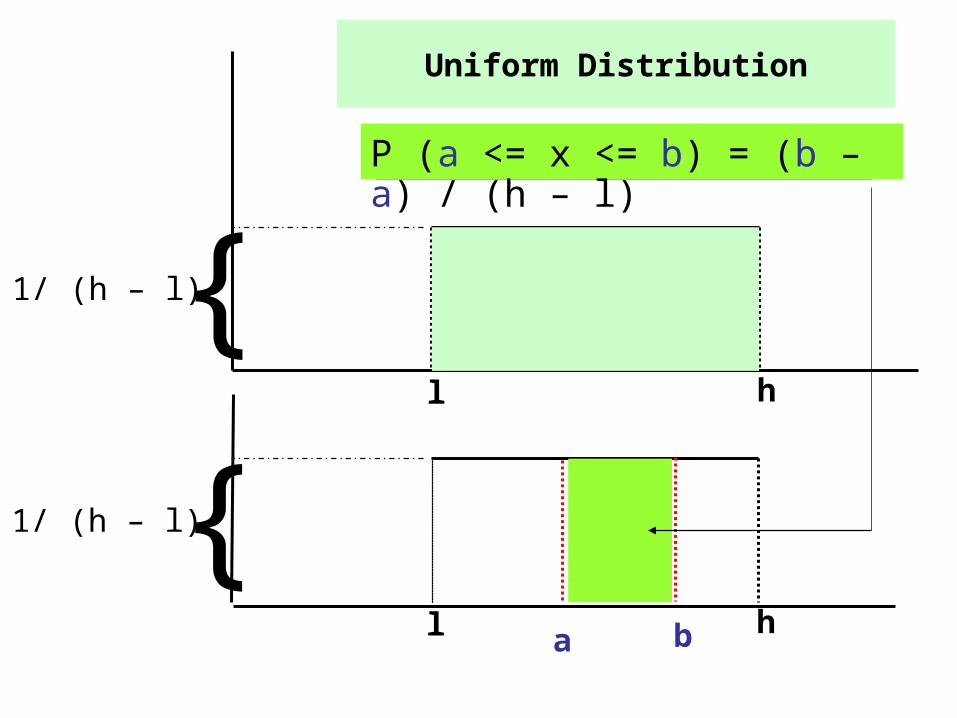
l h
{1/ (h – l)
l h
{1/ (h – l)
a b
Uniform Distribution
P (a <= x <= b) = (b – a) / (h – l)
12
STAT 500 – Statistics for Managers
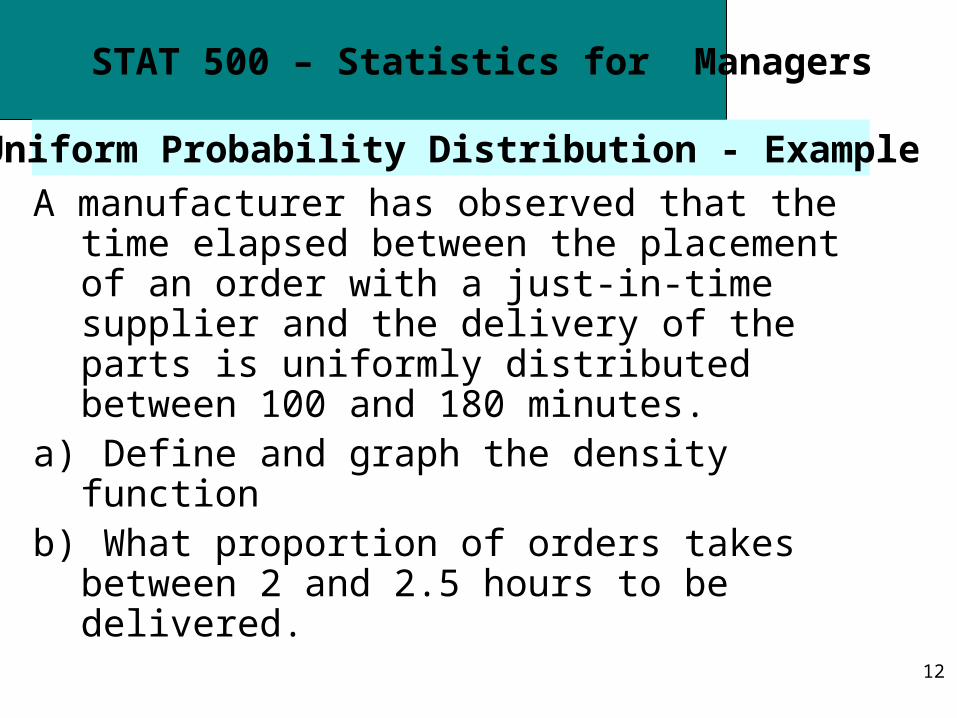
Uniform Probability Distribution - Example
A manufacturer has observed that the time elapsed between the placement of an order with a just-in-time supplier and the delivery of the parts is uniformly distributed between 100 and 180 minutes.
a) Define and graph the density function b) What proportion of orders takes between 2
and 2.5 hours to be delivered.

100 180
{1/ 80
120 150
Uniform Distribution
P (a <= x <= b) = (b – a) / (h – l)
P (120 <= x <= 150) = 30 / 80 = 0.375
14
STAT 500 – Statistics for Managers
Agenda for this Session
• Continuous Random Variables
• Uniform Distribution
• Exponential Distribution
• Applications

15
STAT 500 – Statistics for Managers
Exponential Distribution
A continuous probability distribution that is often useful in describing the time required to complete a task is the exponential probability distribution
Let Lambda, be the parameter of the distribution. The probability density function is: f (x) = 0, if x <= 0;
f(x) = e- x if x > 0

16
STAT 500 – Statistics for Managers
Exponential Distribution
f(x)
x0=5
=1
.5
1.0
1.5
2.0
17
STAT 500 – Statistics for Managers
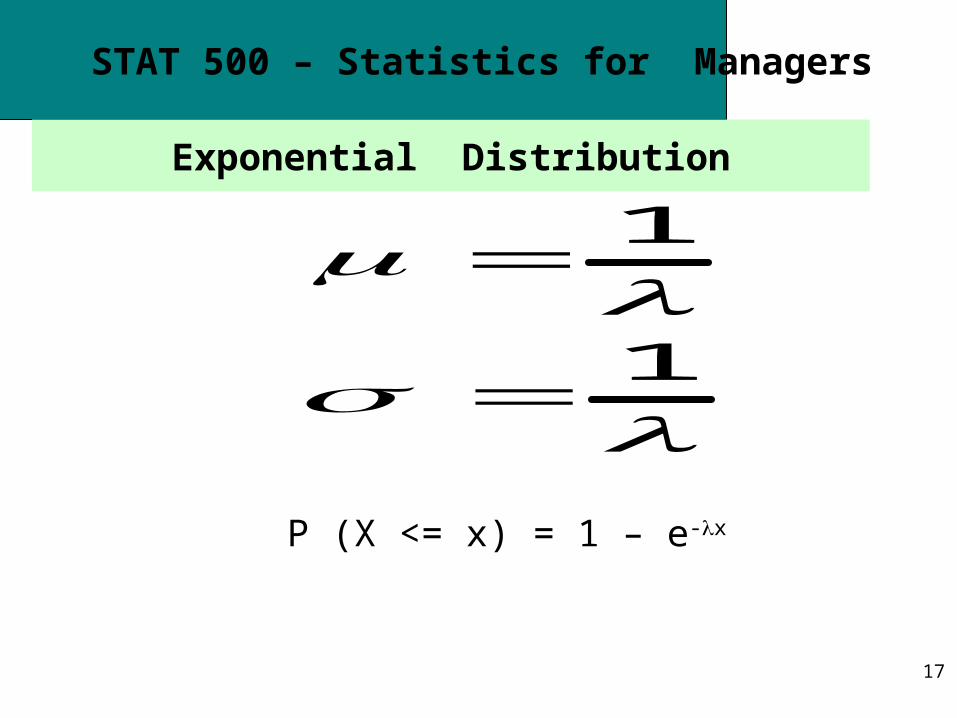
Exponential Distribution
1
1
P (X <= x) = 1 – e-x
18
STAT 500 – Statistics for Managers
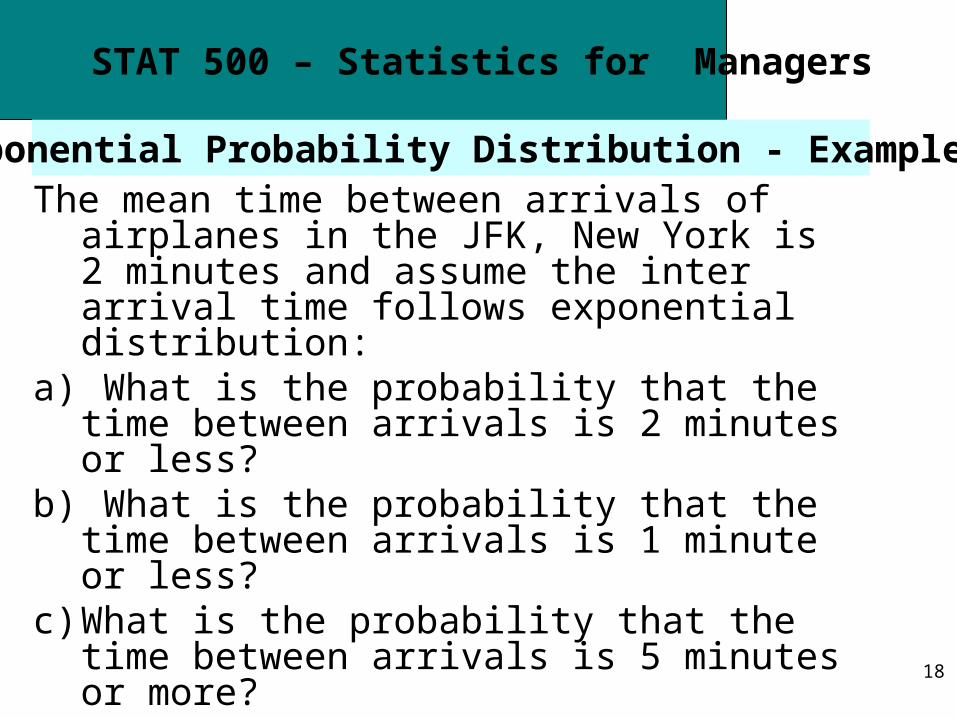
Exponential Probability Distribution - ExampleThe mean time between arrivals of airplanes in
the JFK, New York is 2 minutes and assume the inter arrival time follows exponential distribution:
a) What is the probability that the time between arrivals is 2 minutes or less?
b) What is the probability that the time between arrivals is 1 minute or less?
c) What is the probability that the time between arrivals is 5 minutes or more?
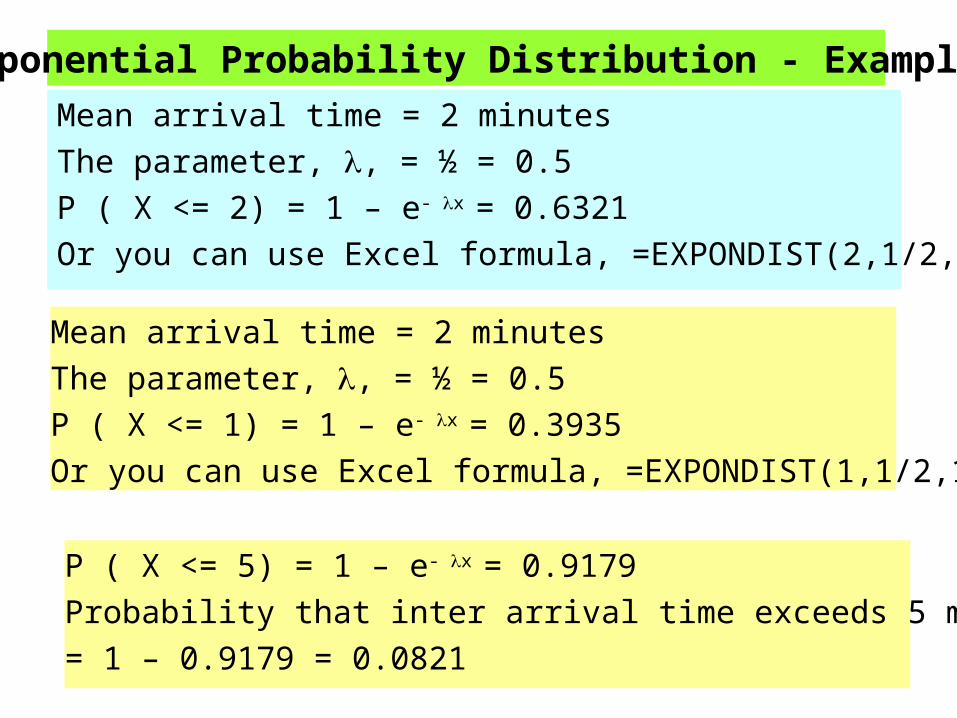
Mean arrival time = 2 minutes
The parameter, , = ½ = 0.5
P ( X <= 2) = 1 – e- x = 0.6321
Or you can use Excel formula, =EXPONDIST(2,1/2,1)
Mean arrival time = 2 minutes
The parameter, , = ½ = 0.5
P ( X <= 1) = 1 – e- x = 0.3935
Or you can use Excel formula, =EXPONDIST(1,1/2,1)
P ( X <= 5) = 1 – e- x = 0.9179
Probability that inter arrival time exceeds 5 minutes
= 1 – 0.9179 = 0.0821
Exponential Probability Distribution - Example
20
STAT 500 – Statistics for Managers
Agenda for this Session# 3 Part 3
• Continuous Random Variables
• Uniform Distribution
• Exponential Distribution
• Applications
21
STAT 500 – Statistics for Managers
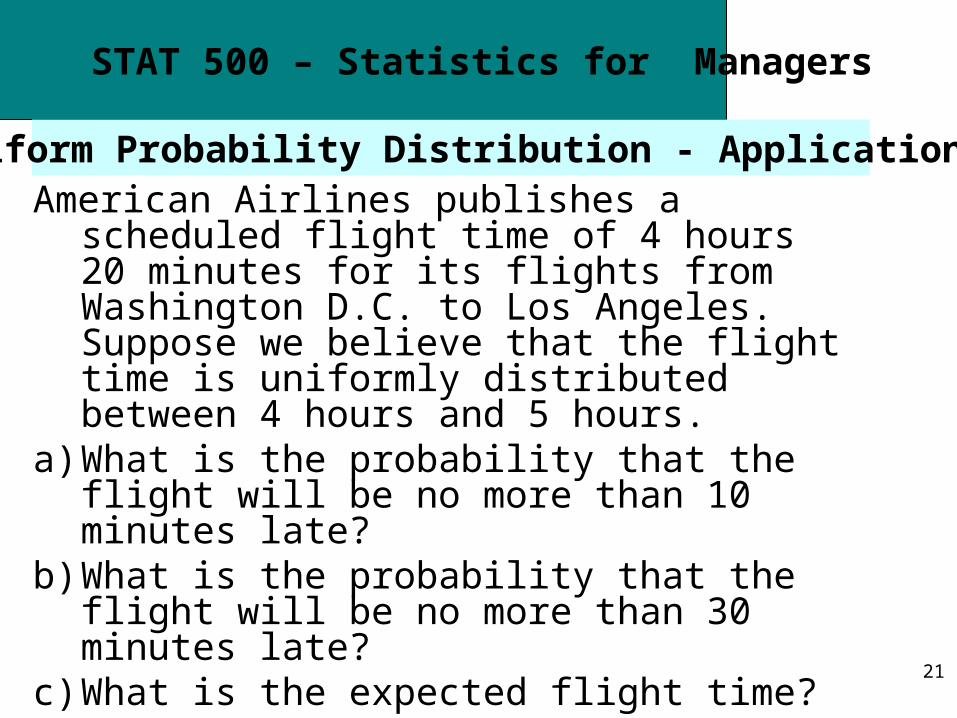
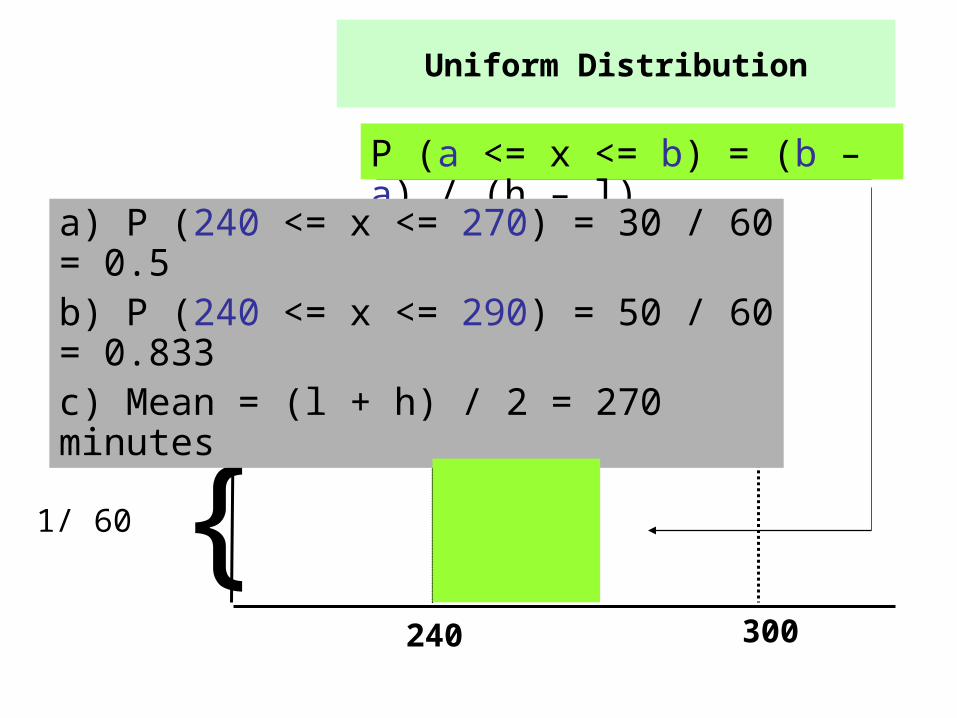
Uniform Probability Distribution - ApplicationAmerican Airlines publishes a scheduled flight
time of 4 hours 20 minutes for its flights from Washington D.C. to Los Angeles. Suppose we believe that the flight time is uniformly distributed between 4 hours and 5 hours.
a) What is the probability that the flight will be no more than 10 minutes late?
b) What is the probability that the flight will be no more than 30 minutes late?
c) What is the expected flight time?
240 300
{1/ 60
Uniform Distribution
P (a <= x <= b) = (b – a) / (h – l)
a) P (240 <= x <= 270) = 30 / 60 = 0.5 b) P (240 <= x <= 290) = 50 / 60 = 0.833 c) Mean = (l + h) / 2 = 270 minutes
23
STAT 500 – Statistics for Managers
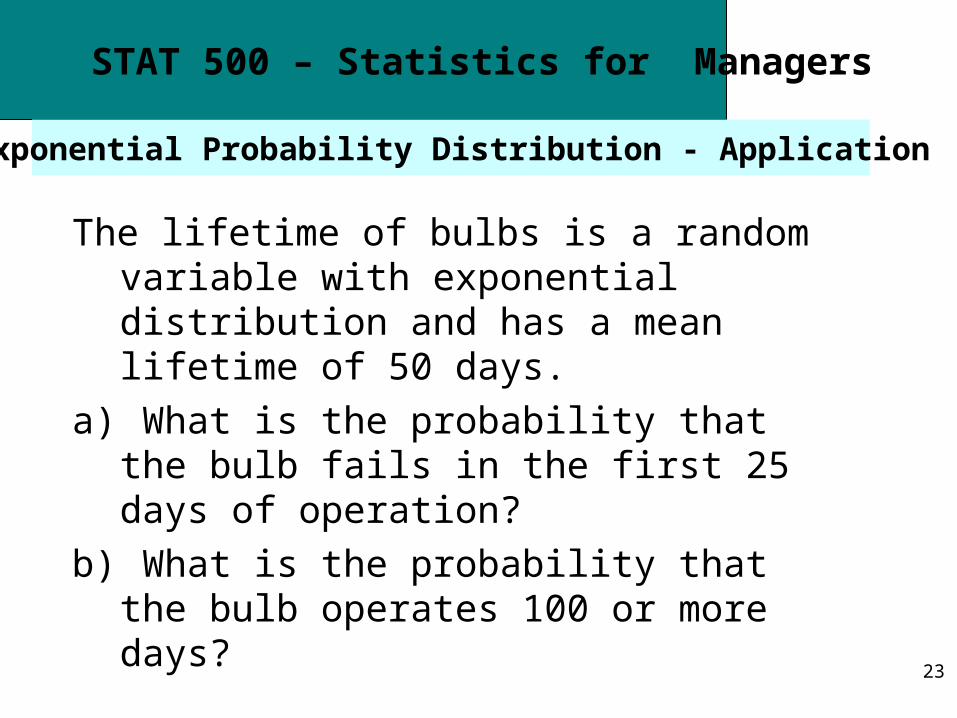
Exponential Probability Distribution - Application
The lifetime of bulbs is a random variable with exponential distribution and has a mean lifetime of 50 days.
a) What is the probability that the bulb fails in the first 25 days of operation?
b) What is the probability that the bulb operates 100 or more days?
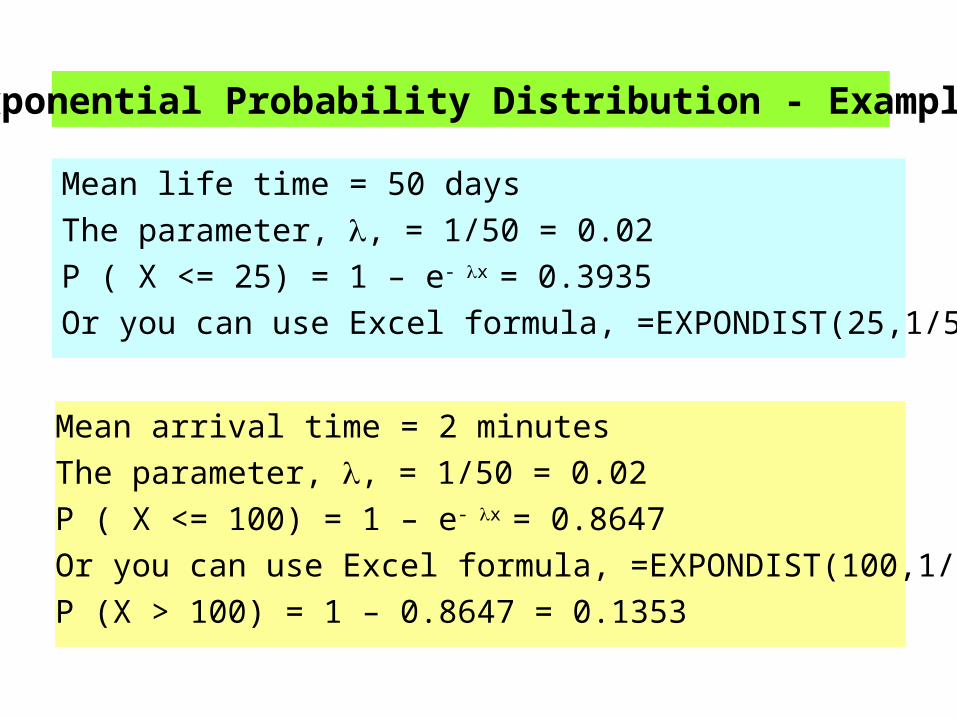
Mean life time = 50 days
The parameter, , = 1/50 = 0.02
P ( X <= 25) = 1 – e- x = 0.3935
Or you can use Excel formula, =EXPONDIST(25,1/50,1)
Mean arrival time = 2 minutes
The parameter, , = 1/50 = 0.02
P ( X <= 100) = 1 – e- x = 0.8647
Or you can use Excel formula, =EXPONDIST(100,1/50,1)
P (X > 100) = 1 – 0.8647 = 0.1353
Exponential Probability Distribution - Example
25
STAT 500 – Statistics for Managers
Agenda for this Session# 3 Part 3
Continuous Random Variables
Uniform Distribution
Exponential Distribution
Applications