1. study sites - geological society of america. study sites in the unglaciated ... (cdf). using...
TRANSCRIPT

Supplemental information for Dixon et al., Climate Driven Processes of Hillslope Weathering
GSA DATA REPOSITORY 2009248
32
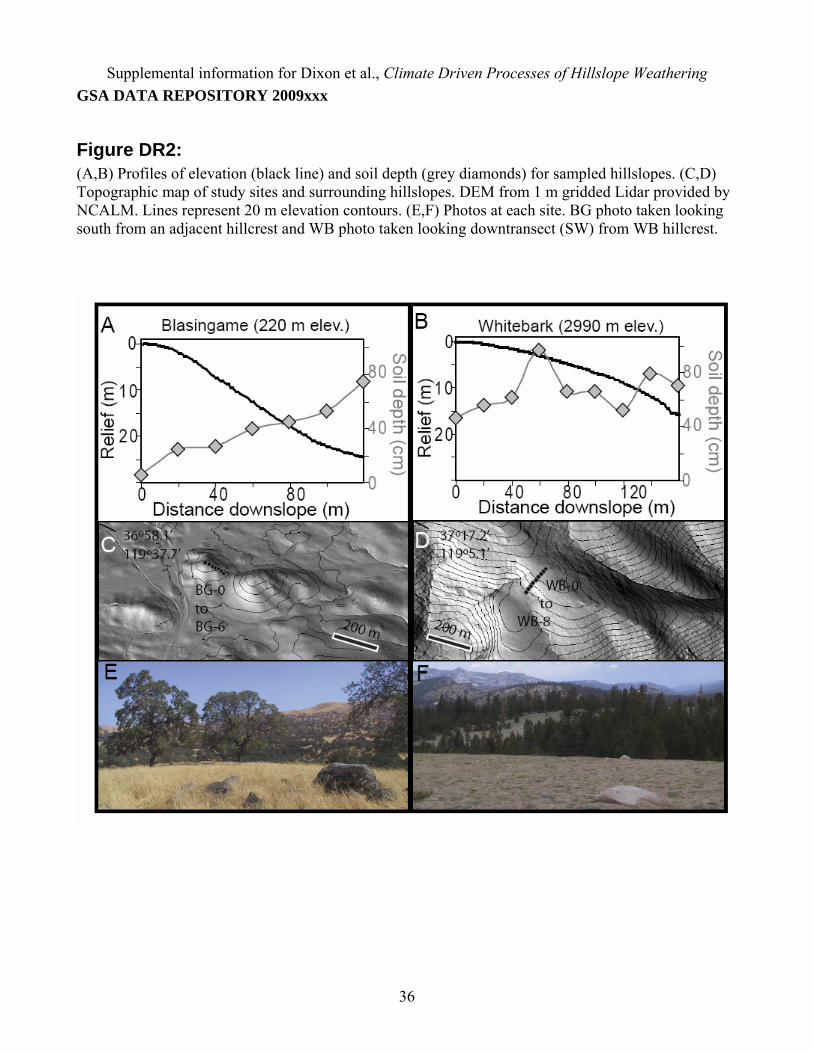
1. Study Sites In the unglaciated upland landscape of the southern Sierra Nevada Range, we chose sites at low (~220 m) and high elevations (~2990 m) that were soil mantled, displayed similar average gradients (Table DR2), and were underlain by similar granitic rocks. The high elevation site, Whitebark (WB), is located 2 km from Kaiser Pass within a subalpine Canadian vegetative zone. Traveling NE from Fresno, the mountains at Kaiser Pass are the first expression of the Sierra Crest in this region, which then drops to less than 2000 m elevation before rising again to around 4000 m in the bedrock dominated region west of Owens Valley. The low elevation site, Blasingame (BG), in the oak grassland vegetative zone, is located southeast of Millerton Lake, approximately 30 km from Fresno, CA. At each site, soil pits were excavated every 20 meters along downslope transects. Soil exposures displayed clear boundaries between soils and the saprolite layer, and at both BG and WB gopher burrows had disturbed the soil/saprolite boundary (Figure DR1). We dug beneath the soil/saprolite boundary to accurately characterize local soil thickness and to collect saprolite for chemical analyses. Figure DR2 shows downslope topographic profiles and the variation of soil thickness along the two sampled hillslopes. Soil depth at BG increases from 6 to 75 cm with increasing distance from the hillcrest. Soil depths at WB do not vary systematically downslope, however the variation shown in Figure DR2 suggests the potential for roughly uniform soil thickness or slightly increasing thicknesses downslope at this site. We note that the lack of a clear soil production function (decreasing soil production rate with increasing soil thickness) at WB in Figure 2B of the manuscript is due to three data points, and that Figure DR2 suggests soil thicknesses at these same sample locations may not be at steady state. Hillslopes at the two sites are low gradient <20deg and show evidence of gopher burrowing within soil pits and at the ground surface. Burrow holes exposed at the surface lead to transit channels that are between 15-150 cm deep. The BG hillslopes selected for this study have thick grass cover with patchy blue oak cover. Outcropping rock makes up <5% the land surface. Based on field observations, gopher burrowing appears to be the dominant soil transport mechanism active at BG (e.g., Black and Montgomery, 1991). The WB hillslope selected here is sparsely vegetated and small Conifers dot the landscape. Outcropping tors cover <10% of the landsurface and shallow rills (~1/2 m deep) run downslope with an average spacing between 10 and 20m.
2. Measuring Soil Production Rates from Cosmogenic 10Be We sampled the top-most 2 cm layer of saprolite immediately beneath soil. These samples were processed at Dartmouth College to isolate the beryllium fraction in quartz, following methods outlined by Heimsath et al. (Heimsath et al., 1999). Samples were spiked with a known concentration of 9Be, and the ratio of 10Be:9Be was measured by Accelerator Mass Spectrometry at Lawrence Livermore and Purdue Laboratories to determine the concentration of in-situ produced 10Be. We calculated surface denudation rates, or soil production rates assuming local steady state soil thickness, following methods of Balco et al. (2008), and applying a topographic and soil-depth corrections for spallogenic nuclide production. In-situ 10Be concentrations and derived soil production rates are provided in Table DR1.

Supplemental information for Dixon et al., Climate Driven Processes of Hillslope Weathering
GSA DATA REPOSITORY 2009xxx
33
3. Determining Physical Erosion and Chemical Weathering Rates Theoretical Framework and Equations Changes in soil mass, expressed as the product of soil density (ρsoil) and soil thickness (h), reflects the balance between soil production (Psoil), erosion (E) and weathering (Wsoil), such that:
soilsoilsoil WEPt
h
, (Equation DR1)
where rates are in units tons km-2 y-1. If soil thickness (h) is constant over time, then the rate of soil mass loss equals the rate of soil production:
soilsoil WEPt
hif
,0. (Equation DR2)
Riebe et al. (2003) developed a method to calculate chemical weathering rates in actively eroding terrains by coupling a mass balance approach using immobile elements in weathered residuum (Brimhall and Dietrich, 1987) to rates of landscape lowering derived from cosmogenic radionuclides (CRNs). Fractional enrichment of an immobile element in parent material and the weathered product can be used to calculate relative mass loss due to chemical weathering. Riebe (2001) termed this the chemical depletion fraction (CDF). Using zirconium as the conservative element, the CDF is calculated as:
w
p
Zr
ZrCDF
][
][1 . (Equation DR3)
Where the subscript ‘p’ reflects the parent material concentration and ‘w’ denotes the concentration in the weathered product. The chemical depletion fraction due to soil weathering (soil relative to saprolite), saprolite weathering (saprolite relative to rock), or total weathering processes (soil relative to rock) can be calculated. We term these respective depletions fractions CDFsoil, CDFsaprolite and CDFtotal. Soil weathering from equation 2 can then be calculated as the product of the soil production rate and the fraction of this rate due to chemical processes:
soilsoilsoil
saprolitesoilsoil CDFP
Zr
ZrPW *
][
][1*
. (Equation DR4)
The Erosion rate (E) is the difference between soil production and weathering rates:
soilsoil WPE . (Equation DR5) Assuming all regolith, including soil and saprolite, displays a local steady-state thickness over timescales of production, then the saprolite weathering rate is:
1
][
][*
rock
saprolitesoilsap Zr
ZrPW . (Equation DR6)
It is important to note that equations (4-5) differ from ones presented by Riebe et al (2003) in the assumption that CRN derived rates reflect soil production, and not total denudation in regions mantled by saprolite. Sampling and Laboratory Methodology

Supplemental information for Dixon et al., Climate Driven Processes of Hillslope Weathering
GSA DATA REPOSITORY 2009xxx
34
Saprolite and soil were sampled at various depths for trace element chemistry. Unweathered bedrock was sampled where available, from beneath soil pits or from outcropping tors. One to three inches of the outside of the sampled rock were removed by rock saw to avoid weathering rinds. All samples were oven dried at 115°C for 48 hours, and homogenized by pulverizing in a tungsten carbide mill to less than 250 µm. Approximately 40g of pulverized material was subsampled for XRF analysis. We pulverized sample before subsampling in order to obtain as representative a bulk sample as possible, and avoid bias due to oversampling of fines or gravels. Zirconium concentrations in rock, saprolite and soil were measured by pressed pellet XRF at Keene State University (Keene, NH) and ALS-CHEMEX (Reno, NV). These data are used in conjunction with equations presented above to calculate the total CDF, soil CDF, saprolite CDF, soil weathering, saprolite weathering, and physical erosion rates (Table DR2).
4. Fallout Radionuclides 210Pb and 137Cs and Diffusion-Like Soil Mixing Sampling and Laboratory Methodology Soil profiles were sampled at a 2 cm resolution from the surface to the soil/saprolite interface by carefully removing the soil layer by layer with a spatula from a 15x15 cm2 area. Samples were oven dried at 115°C for 48 hours to remove moisture, and dry sieved with a 2 mm mesh. Soil fines (<2 mm) were then packed into a container of known volume and geometry, and the activity of short-lived radionuclides was measured by gamma ray spectroscopy. Data for activity profiles are provided in Table DR3. Nuclide inventory is measured in Becquerels/cm2 as the depth weighted sum of nuclide activity. Within some soils, we additionally sampled at low resolution (5-10 cm) and used these samples to measure bulk soil inventory. Inventory measurements are provided in Table DR5. Transport processes and Relevant Timescales Steady state profiles of 210Pb provide insight into mixing and soil transport over short timescales (102-103 years). The depth distribution of 210Pb in soils can be described by the steady-state solution to the advection-diffusion equation (e.g., He and Walling, 1997; Kaste et al., 2007):
)(
2
4exp*)(
2
0 zD
DVVAzA
.
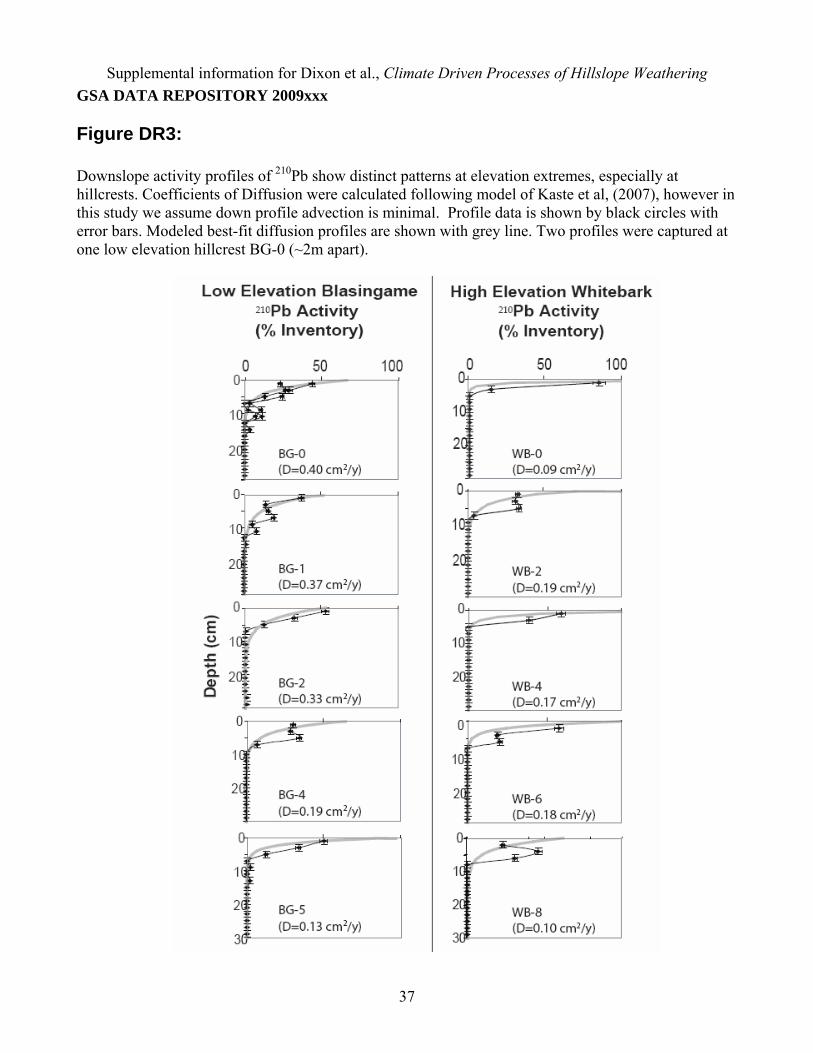
Where ‘A(z)’, is the nuclide activity at a specific depth (in Bq cm-3), ‘A0’ is the activity at the surface, ‘V’ is the downward advection velocity due to leaching (cm y-1), ‘λ’ is radioactive decay (y-1), and ‘D’ is a diffusion like mixing coefficient (cm2 y-1). Advection rates have previously been measured using the depth of concentration of weapons-derived 137Cs, which was delivered to soils as a thermonuclear bomb product between 1950 and 1970, peaking in 1964 (e.g., Kaste et al., 2007). We were unable to determine clear subsurface peaks in 137Cs activity profiles that correspond to this delivery. Instead, we calculated diffusion-like mixing coefficients by assuming advection plays a minimal role in subsurface nuclide redistribution. Nuclide activity profiles were converted to percent-inventory profiles by dividing activity at depth by the measured inventory for that pit. We then modeled a best fit diffusion equation to each profile by minimizing the sum of residuals. Figure DR3 shows measured profiles and best-fit models for each site.

Supplemental information for Dixon et al., Climate Driven Processes of Hillslope Weathering
GSA DATA REPOSITORY 2009xxx
35
Table DR1: 10Be derived Soil Production Rates
Sample Name
10Be Concentration (atoms g-1) 1
Sample Depth (cm)
Depth Shielding
Factor
Topo Shielding
Factor
Soil Production Rate
(t km-2 yr-1)
Blasingame (36.96° latitude, 220 m elevation at crest) BG-0 187403 ± 34399 6 0.96 1.00 66.2 ± 14.4 BG-1 90282 ± 3745 25 0.80 0.99 126.4 ± 9.9 BG-2 107038 ± 7076 27 0.82 0.99 104.9 ± 10.1 BG-3 132701 ± 5745 40 0.70 1.00 69.2 ± 5.5 BG-4 93307 ± 2265 45 0.67 1.00 93.3 ± 6.4 BG-5 136789 ± 4587 53 0.62 1.00 59.8 ± 4.4 BG-6 131622 ± 5941 75 0.51 0.99 51.2 ± 4.2
White Bark (37.28° latitude, 2991 m elevation at crest) WB-0 581657 ± 17376 53 0.61 1.00 70.5 ± 6.0 WB-1 578575 ± 48527 64 0.55 1.00 65.1 ± 7.6 WB-2 801896 ± 32260 70 0.52 1.00 34.2 ± 3.1 WB-3 367081 ± 13488 110 0.35 1.00 66.1 ± 5.8 WB-4 824462 ± 19688 75 0.49 1.00 40.2 ± 3.4 WB-5 688245 ± 18081 75 0.50 1.00 48.7 ± 4.1 WB-6 1081770 ± 25628 60 0.57 0.99 35.0 ± 3.0 WB-7 406837 ± 13257 90 0.43 0.98 71.4 ± 6.1 WB-8 789064 ± 30516 80 0.47 1.00 40.0 ± 3.6
1 Samples for cosmogenic analysis were processed at Dartmouth College to isolate the beryllium fraction in quartz and then run on an accelerator mass spectrometer at Lawrence Livermore National Laboratory (LLNL) and Purdue Prime Laboratory to determine concentrations of 10Be. We used a production rate of 5.1 atoms 10Be/g quartz/yr and scaled 10Be concentrations for soil depth, slope, topographic shielding, latitude and altitude (Dunne et al., 1999; Gosse and Phillips, 2001; Lal, 1991).

Supplemental information for Dixon et al., Climate Driven Processes of Hillslope Weathering
GSA DATA REPOSITORY 2009xxx
36
Table DR2: Chemical Weathering and Erosion
Sample Name
Soil Depth (cm)
Curvature (m-1) 1
Slope (°)
[Zr] soil
(ppm)
[Zr] sap
(ppm)
CDF soil
CDF Sap2
CDF total2
Wsoil (t km-2 y-1)
Wsap (t km-2 y-1)
E (t km-2 y-1)
Blasingame (220 m elev; 36 cm; 16.6 °C) 3
LD-0 6 -0.030 1.4 120 130 0.00 0.53 0.50 0.0 75.4 66.2LD-1 25 -0.027 15.4 103 111 0.00 0.45 0.41 0.0 104.8 126.4LD-2 27 -0.005 18.5 105 81 0.23 0.25 0.42 24.4 34.4 80.5LD-3 40 -0.005 15.9 129 64 0.50 0.05 0.53 34.9 3.8 34.3LD-4 45 0.002 10.1 134 79 0.41 0.23 0.55 38.5 27.5 54.8LD-5 53 -0.019 6.4 130 81 0.38 0.25 0.53 22.7 19.7 37.1LD-6 75 -0.012 2.6 139 124 0.11 0.51 0.56 5.5 53.4 45.7Mean 39 -0.014 10.1 123 96 0.23 0.32 0.50 18.0 45.6 63.6
Std err 8 0.005 2.6 5 10 0.08 0.07 0.02 6.1 13.2 12.1
Whitebark (2991 m elev; 107 cm; 3.9 °C) 3
WB-0 53 0.000 0.8 182 148 0.18 0.36 0.48 13.0 39.5 57.5WB-1 64 -0.002 3.6 185 154 0.17 0.38 0.49 10.9 40.7 54.2WB-2 70 -0.005 6.4 168 215 0.00 0.56 0.43 0.0 43.1 34.2WB-3 110 0.000 7.1 180 95 0.47 0.00 0.47 31.3 0.0 34.8WB-4 75 -0.009 9.5 178 155 0.13 0.39 0.47 5.1 25.4 35.1WB-5 75 -0.004 13.1 223 126 0.44 0.25 0.57 21.2 15.9 27.5WB-6 60 -0.005 18.8 166 112 0.32 0.15 0.43 11.4 6.4 23.6WB-7 90 0.000 15.1 234 142 0.40 0.33 0.59 28.3 35.1 43.2WB-8 80 0.006 7.8 160 138 0.14 0.31 0.41 5.7 18.0 34.3Mean 75 -0.002 9.1 186 143 0.25 0.30 0.48 14.1 24.9 38.3
Std err 6 0.001 1.9 9 11 0.05 0.05 0.02 3.6 5.3 3.8
1 Curvature measured as the laplacian of elevation from 8m gridded LiDAR data; slope measured from 2m gridded LiDAR data.
2Sap CDF and Total CDF calculated using measured zirconium concentrations in rock of 61 ppm at BG and 95 ppm at WB. 3Study site (elevation at hillcrest; avg. annual precipitation; avg. annual temperature). Climate data from PRISM online
database (Prism-Database).
Supplemental information for Dixon et al., Climate Driven Processes of Hillslope Weathering
GSA DATA REPOSITORY 2009xxx
37
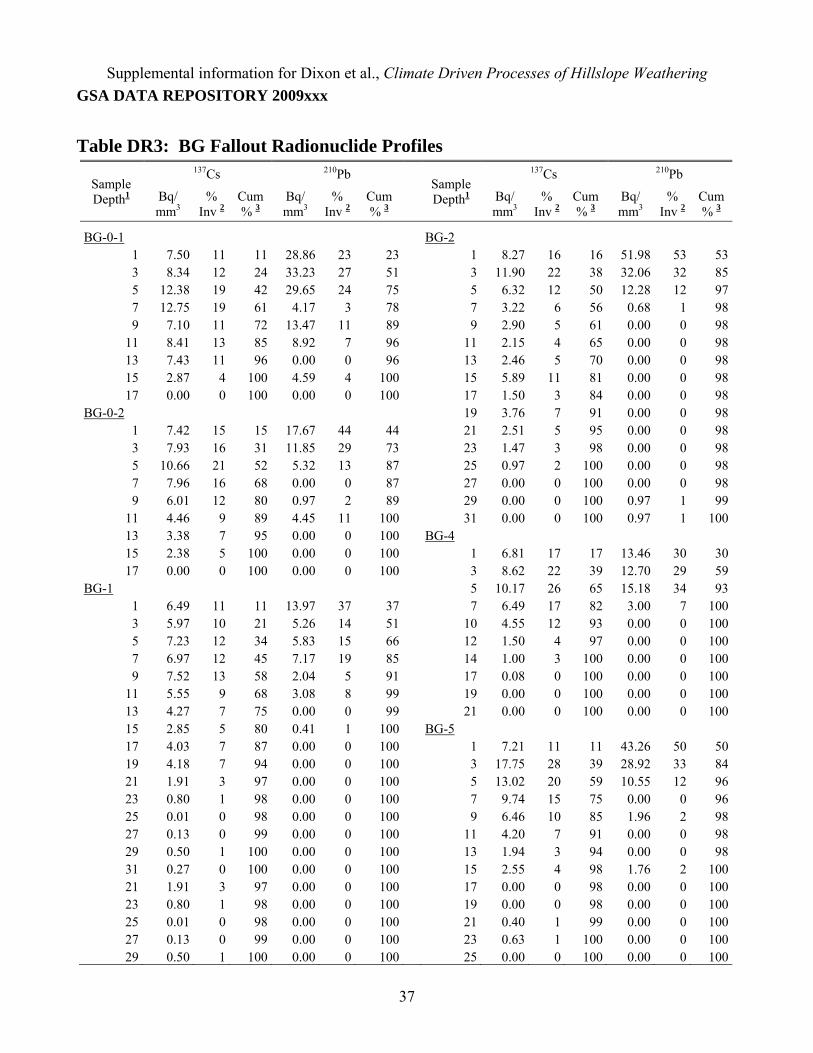
Table DR3: BG Fallout Radionuclide Profiles
Sample Depth1
137Cs 210Pb Sample Depth1
137Cs 210Pb
Bq/ mm3
% Inv 2
Cum % 3
Bq/ mm3
% Inv 2
Cum % 3
Bq/ mm3
% Inv 2
Cum % 3
Bq/ mm3
% Inv 2
Cum % 3
BG-0-1 BG-2 1 7.50 11 11 28.86 23 23 1 8.27 16 16 51.98 53 533 8.34 12 24 33.23 27 51 3 11.90 22 38 32.06 32 855 12.38 19 42 29.65 24 75 5 6.32 12 50 12.28 12 977 12.75 19 61 4.17 3 78 7 3.22 6 56 0.68 1 989 7.10 11 72 13.47 11 89 9 2.90 5 61 0.00 0 98
11 8.41 13 85 8.92 7 96 11 2.15 4 65 0.00 0 9813 7.43 11 96 0.00 0 96 13 2.46 5 70 0.00 0 9815 2.87 4 100 4.59 4 100 15 5.89 11 81 0.00 0 9817 0.00 0 100 0.00 0 100 17 1.50 3 84 0.00 0 98
BG-0-2 19 3.76 7 91 0.00 0 981 7.42 15 15 17.67 44 44 21 2.51 5 95 0.00 0 983 7.93 16 31 11.85 29 73 23 1.47 3 98 0.00 0 985 10.66 21 52 5.32 13 87 25 0.97 2 100 0.00 0 987 7.96 16 68 0.00 0 87 27 0.00 0 100 0.00 0 989 6.01 12 80 0.97 2 89 29 0.00 0 100 0.97 1 99
11 4.46 9 89 4.45 11 100 31 0.00 0 100 0.97 1 10013 3.38 7 95 0.00 0 100 BG-4 15 2.38 5 100 0.00 0 100 1 6.81 17 17 13.46 30 3017 0.00 0 100 0.00 0 100 3 8.62 22 39 12.70 29 59
BG-1 5 10.17 26 65 15.18 34 931 6.49 11 11 13.97 37 37 7 6.49 17 82 3.00 7 1003 5.97 10 21 5.26 14 51 10 4.55 12 93 0.00 0 1005 7.23 12 34 5.83 15 66 12 1.50 4 97 0.00 0 1007 6.97 12 45 7.17 19 85 14 1.00 3 100 0.00 0 1009 7.52 13 58 2.04 5 91 17 0.08 0 100 0.00 0 100
11 5.55 9 68 3.08 8 99 19 0.00 0 100 0.00 0 10013 4.27 7 75 0.00 0 99 21 0.00 0 100 0.00 0 10015 2.85 5 80 0.41 1 100 BG-5 17 4.03 7 87 0.00 0 100 1 7.21 11 11 43.26 50 5019 4.18 7 94 0.00 0 100 3 17.75 28 39 28.92 33 8421 1.91 3 97 0.00 0 100 5 13.02 20 59 10.55 12 9623 0.80 1 98 0.00 0 100 7 9.74 15 75 0.00 0 9625 0.01 0 98 0.00 0 100 9 6.46 10 85 1.96 2 9827 0.13 0 99 0.00 0 100 11 4.20 7 91 0.00 0 9829 0.50 1 100 0.00 0 100 13 1.94 3 94 0.00 0 9831 0.27 0 100 0.00 0 100 15 2.55 4 98 1.76 2 10021 1.91 3 97 0.00 0 100 17 0.00 0 98 0.00 0 10023 0.80 1 98 0.00 0 100 19 0.00 0 98 0.00 0 10025 0.01 0 98 0.00 0 100 21 0.40 1 99 0.00 0 10027 0.13 0 99 0.00 0 100 23 0.63 1 100 0.00 0 10029 0.50 1 100 0.00 0 100 25 0.00 0 100 0.00 0 100

Supplemental information for Dixon et al., Climate Driven Processes of Hillslope Weathering
GSA DATA REPOSITORY 2009xxx
38
Table DR4: WB Fallout Radionuclide Profiles
Sample Depth 1
137Cs 210Pb Sample Depth 1
137Cs 210Pb
Bq/ mm3
% Inv 2
Cum % 3
Bq/ mm3
% Inv 2
Cum % 3
Bq/ mm3
% Inv 2
Cum % 3
Bq/ mm3
% Inv 2
Cum % 3
WB-0 WB-4 1 20.69 38 38 162.04 86 86 1 28.13 52 52 71.24 61 613 18.86 34 72 26.88 14 100 3 19.37 36 87 46.47 39 1005 2.24 4 76 0.00 0 100 5 6.82 13 100 0.00 0 1007 2.56 5 81 0.00 0 100 7 0.03 0 100 0.00 0 1009 3.51 6 87 0.00 0 100 9 0.00 0 100 0.00 0 100
11 4.81 9 96 0.00 0 100 11 0.00 0 100 0.00 0 10013 1.66 3 99 0.00 0 100 13 0.00 0 100 0.00 0 10015 0.06 0 99 0.00 0 100 15 0.00 0 100 0.00 0 10017 0.12 0 100 0.00 0 100 WB-6 19 0.00 0 100 0.00 0 100 2 20.45 23 23 115.01 59 5921 0.11 0 100 0.00 0 100 4 27.98 31 53 37.91 20 7923 0.12 0 100 0.00 0 100 6 31.34 35 88 41.25 21 10025 0.00 0 100 0.00 0 100 8 10.13 11 99 0.00 0 10027 0.00 0 100 0.00 0 100 10 0.75 1 100 0.00 0 10029 0.00 0 100 0.00 0 100 12 0.00 0 100 0.00 0 10031 0.00 0 100 0.00 0 100 14 0.00 0 100 0.00 0 100
WB-2 16 0.00 0 100 0.00 0 1001 25.77 29 29 163.80 32 32 WB-8
26.38 29 58 154.41 31 63 2 7.65 11 11 51.94 23 235 24.69 27 85 168.30 33 96 4 11.34 16 27 102.93 46 697 7.71 9 93 19.17 4 100 6 13.27 19 46 69.53 31 1009 5.67 6 100 0.00 0 100 8 10.45 15 61 0.00 0 100
11 0.21 0 100 0.00 0 100 10 10.50 15 76 0.00 0 10013 0.00 0 100 0.00 0 100 12 17.02 24 100 0.00 0 10015 0.00 0 0.00 0 14 0.00 0 100 0.00 0 100
16 0.00 0 100 0.00 0 100 1Average sample depth. Each sample is ~2 cm thick. 2Percent inventory measured as ratio of activity to total nuclide inventory. 3Cumulative inventory measured as 100%-percent inventory. The depth at which 95% of the inventory is obtained
corresponds to the ‘Profile Depth’ shown in figure 3A of the manuscript.

Supplemental information for Dixon et al., Climate Driven Processes of Hillslope Weathering
GSA DATA REPOSITORY 2009xxx
33
Table DR5: Nuclide Inventories
Sample1
210Pb Inventory
137Cs Inventory
Upslope Contributing
Area Slope (Bq/m2) (Bq/m2) (m2) (°)
WB-0 3778 1096 0 0.8 WB-2 10114 1808 40 6.4 WB-4 2354 1087 80 9.5 WB-6 3883 1813 120 18.8 WB-8 4488 1405 160 7.8
WB-1 Bulk 9804 2048 20 3.6 WB-2 Bulk 5776 2875 40 6.4 WB-3 Bulk 8540 2776 60 7.1 WB-4 Bulk 6193 2530 80 9.5 WB-8 Bulk 2092 808 160 7.8
BG-0-1 2458 1336 0 1.4 BG-0-2 805 1004 0 1.4
BG-1 755 1174 20 15.4 BG-2 1979 1066 40 18.5 BG-4 887 784 80 10.1 BG-5 1729 1278 100 6.4
1 Inventories are calculated from profiles shown in Table DR4, and bulk soil samples (noted by ‘Bulk’).
Supplemental information for Dixon et al., Climate Driven Processes of Hillslope Weathering
GSA DATA REPOSITORY 2009xxx
34
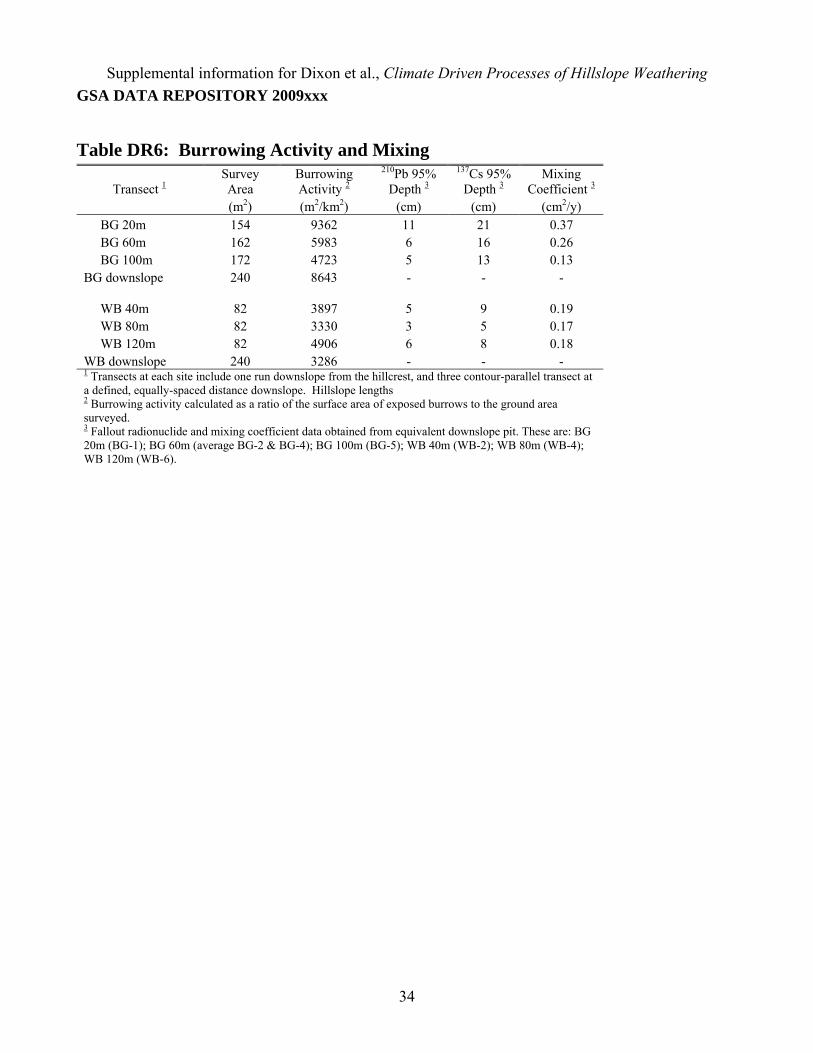
Table DR6: Burrowing Activity and Mixing
Transect 1 Survey Area
Burrowing Activity 2
210Pb 95% Depth 3
137Cs 95% Depth 3
Mixing Coefficient 3
(m2) (m2/km2) (cm) (cm) (cm2/y) BG 20m 154 9362 11 21 0.37 BG 60m 162 5983 6 16 0.26 BG 100m 172 4723 5 13 0.13 BG downslope 240 8643 - - -
WB 40m 82 3897 5 9 0.19 WB 80m 82 3330 3 5 0.17 WB 120m 82 4906 6 8 0.18 WB downslope 240 3286 - - - 1 Transects at each site include one run downslope from the hillcrest, and three contour-parallel transect at a defined, equally-spaced distance downslope. Hillslope lengths 2 Burrowing activity calculated as a ratio of the surface area of exposed burrows to the ground area surveyed. 3 Fallout radionuclide and mixing coefficient data obtained from equivalent downslope pit. These are: BG 20m (BG-1); BG 60m (average BG-2 & BG-4); BG 100m (BG-5); WB 40m (WB-2); WB 80m (WB-4); WB 120m (WB-6).

Supplemental information for Dixon et al., Climate Driven Processes of Hillslope Weathering
GSA DATA REPOSITORY 2009xxx
35
Figure DR1: Image from a soil pit at Blasingame. Note the clear, irregular soil saprolite boundary. It has been actively disrupted by gopher burrowing, a soil production mechanism at this site.
Saprolite
Soil
Gopher Burrow
Supplemental information for Dixon et al., Climate Driven Processes of Hillslope Weathering
GSA DATA REPOSITORY 2009xxx
36
Figure DR2: (A,B) Profiles of elevation (black line) and soil depth (grey diamonds) for sampled hillslopes. (C,D) Topographic map of study sites and surrounding hillslopes. DEM from 1 m gridded Lidar provided by NCALM. Lines represent 20 m elevation contours. (E,F) Photos at each site. BG photo taken looking south from an adjacent hillcrest and WB photo taken looking downtransect (SW) from WB hillcrest.
Supplemental information for Dixon et al., Climate Driven Processes of Hillslope Weathering
GSA DATA REPOSITORY 2009xxx
37
Figure DR3: Downslope activity profiles of 210Pb show distinct patterns at elevation extremes, especially at hillcrests. Coefficients of Diffusion were calculated following model of Kaste et al, (2007), however in this study we assume down profile advection is minimal. Profile data is shown by black circles with error bars. Modeled best-fit diffusion profiles are shown with grey line. Two profiles were captured at one low elevation hillcrest BG-0 (~2m apart).
Supplemental information for Dixon et al., Climate Driven Processes of Hillslope Weathering
GSA DATA REPOSITORY 2009xxx
38
REFERENCES CITED Balco, G., Stone, J.O., Lifton, N.A., and Dunai, T.J., 2008, A complete and easily accessible means of
calculating surface exposure ages or erosion rates from 10Be and 26Al measurements: Quaternary Geochronology, v. 3, p. 174.
Black, T.A., and Montgomery, D.R., 1991, Sediment transport by burrowing animals, Marin County, California: Earth Surface Processes and Landforms, v. 16, p. 163-172.
Brimhall, G.H., and Dietrich, W.E., 1987, Constitutive mass balance relations between chemical composition, volume, density, porosity, and strain in metasomatic hydrochemical systems: Results on weathering and pedogenesis: Geochimica et Cosmochimica Acta, v. 51, p. 567.
Dunne, J., Elmore, D., and Muzikar, P., 1999, Scaling factors for the rates of production of cosmogenic nuclides for geometric shielding and attenuation at depth on sloped surfaces: Geomorphology, v. 27, p. 3-11.
Gosse, J.C., and Phillips, F.M., 2001, Terrestrial in situ cosmogenic nuclides: theory and application: Quaternary Science Reviews, v. 20, p. 1475-1560.
He, Q., and Walling, D.E., 1997, The distribution of fallout Cs-137 and Pb-210 in undisturbed and cultivated soils: Applied Radiation And Isotopes, v. 48, p. 677-690.
Heimsath, A.M., Dietrich, W.E., Nishiizumi, K., and Finkel, R.C., 1999, Cosmogenic nuclides, topography, and the spatial variation of soil depth: Geomorphology, v. 27, p. 151-172.
Kaste, J.M., Heimsath, A.M., and Bostick, B.C., 2007, Short-term soil mixing quantified with fallout radionuclides: Geology, v. 35, p. 243-246.
Kaste, J.M., Heimsath, A.M., and Bostick, B.C., 2007, Short-term soil mixing quantified with fallout radionuclides: Geology, v. 35, p. 243-246.
Lal, D., 1991, Cosmic ray labeling of erosion surfaces: in situ nuclide production rates and erosion models: Earth and Planetary Science Letters, v. 104, p. 424-439.
Prism-Database, http://www.prismclimate.org, created 5 Mar 2008, PRISM Group, Oregon State University
Riebe, C.S., Kirchner, J.W., and Finkel, R.C., 2003, Long-term rates of chemical weathering and physical erosion from cosmogenic nuclides and geochemical mass balance: Geochimica et Cosmochimica Acta, v. 67, p. 4411-4427.
Riebe, C.S., Kirchner, J.W., Granger, D.E., and Finkel, R.C., 2001, Strong tectonic and weak climatic control of long-term chemical weathering rates: Geology, v. 29, p. 511-514.