1 things can only get better…… the story of the transportation security administration’s...
TRANSCRIPT
1
THINGS CAN ONLY GET BETTER……
THE STORY OF THE TRANSPORTATION SECURITY ADMINISTRATION’S PROGRAM
CONTROL OFFICE (PCO)
Shelly L. Myers, PMPSenior Vice President
MSB Associates, Inc.
2
IN THE BEGINNING…..
WHAT WE HAD:
A $1 BILLION MANAGED SERVICES CONTRACT
3
IN THE BEGINNING…..
WHAT WE DID NOT HAVE: DEFINED PROJECTS ESTABLISHED PROCESSES AND PROCEDURES ENTERPRISE ARCHITECTURE SYSTEMS DEVELOPMENT LIFECYCLE COST, SCHEDULE, PERFORMANCE MONITORING
AND REPORTING CAPITAL PLANNING AND BUSINESS CASE
DEVELOPMENT PROJECTS MAPPED TO STRATEGIC GOALS
4
THE SITUATION…..
TSA WAS UNDER CONGRESSIONAL MANDATE TO STAND UP ACROSS THE NATION
HEROES AND COWBOYS WERE RUNNING THE SHOW
THE CONTRACT WAS RUNNING HOT
PATRIOTISM WAS STRONG AND PROJECT MANAGEMENT SKILLS WERE WEAK

5
THE NEED…..
TO SET UP A SYSTEM TO MONITOR CONTRACT COST, SCHEDULE, AND PERFORMANCE
TO SYNTHESIZE, ANALYZE, AND VALIDATE INFORMATION
TO SET UP A FRAMEWORK FOR REPORTING INFORMATION
TO TRAIN AND MENTOR THE STAFF
TO CHANGE THE CULTURE OF THE ORGANIZATION
6
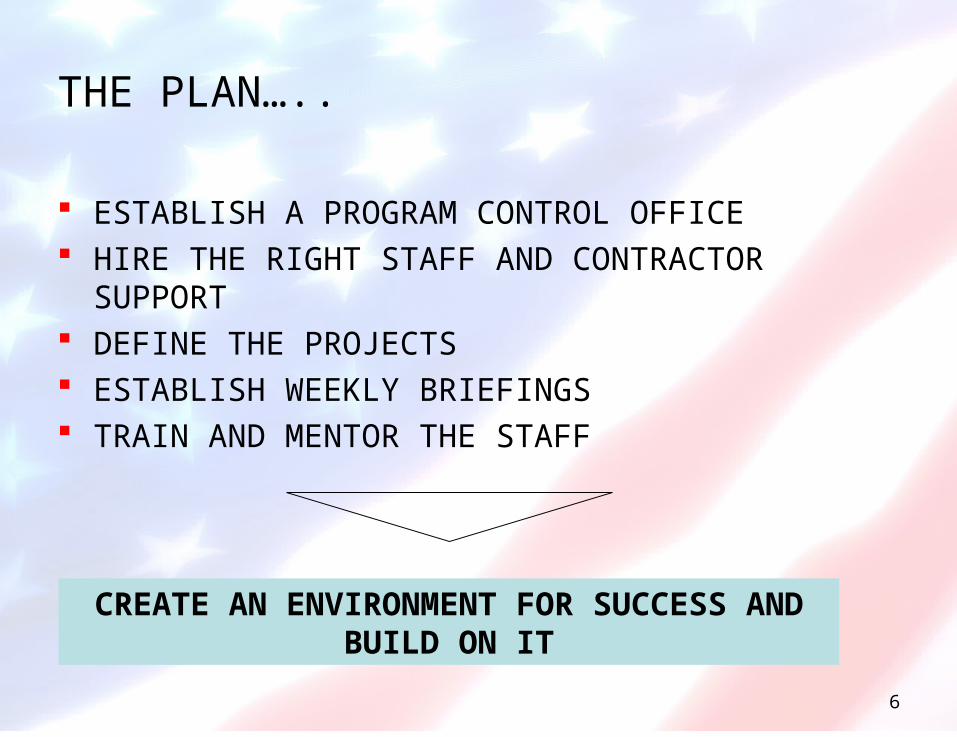
THE PLAN…..
ESTABLISH A PROGRAM CONTROL OFFICE HIRE THE RIGHT STAFF AND CONTRACTOR
SUPPORT DEFINE THE PROJECTS ESTABLISH WEEKLY BRIEFINGS TRAIN AND MENTOR THE STAFF
CREATE AN ENVIRONMENT FOR SUCCESS AND BUILD ON IT

7
THE RESULT…..
GUIDES AND SUPPORTS THE MANAGEMENT OF THE LIFE CYCLE AND GOVERNANCE BOARDS
DEVELOPS, MANAGES AND MONITORS:• PROGRAM/PROJECT STRUCTURES, CONTROLS,
PROCESSES, AND PROCEDURES• PROGRAM/PROJECT TREND INFORMATION
INCLUDING: COST, SCHEDULE, TECHNICAL PERFOMANCE, ISSUES AND RISKS
• PROGRAM/PROJECT REPORTING STANDARDS MENTORING AND COACHING SUPPORT TO
PROJECT MANAGERS

8
THE RESULT (CON’T)…..
INTERFACES WITH THE CIO, QUALITY, AND FINANCE/BUDGET STAFFS
INTERFACES WITH CONTRACTOR’S PMO OWNS THE PERFORMANCE MANAGEMENT
PROGRAM CREATES AND MANAGES THE PCO WEB SITE MANAGES AND MONITORS PM TRAINING AND
CERTIFICATION
CREATES THE ENVIRONMENT FOR SUCCESS
9
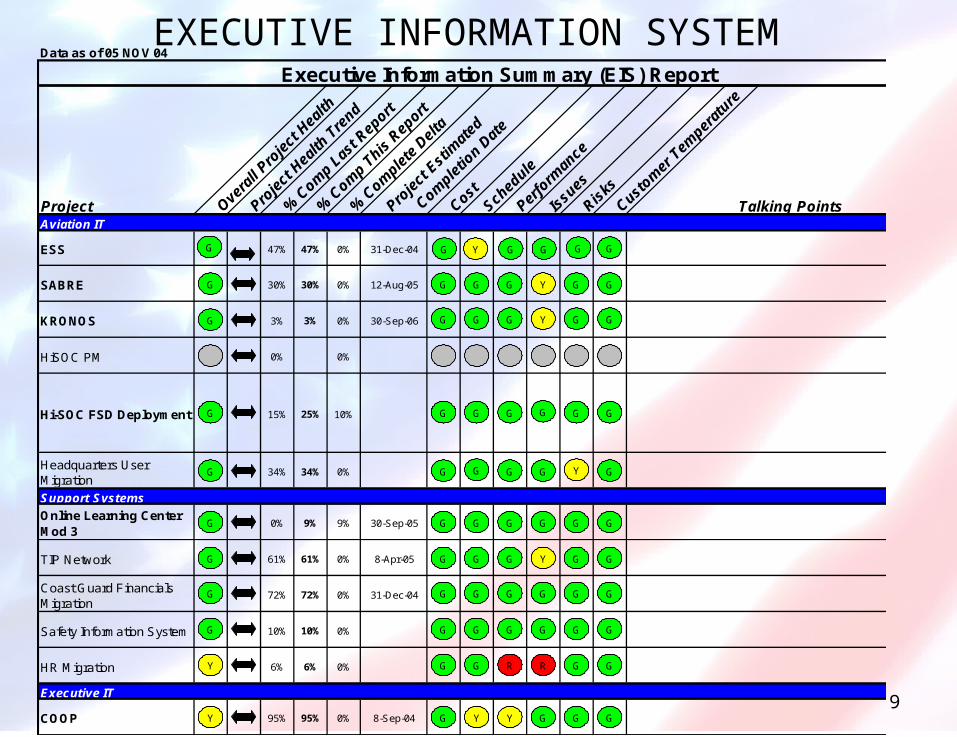
EXECUTIVE INFORMATION SYSTEM Executive Information Summary (EIS) Report
Data as of 05 NOV 04
Project Talking PointsAviation IT
ESS 47% 47% 0% 31-Dec-04
SABRE 30% 30% 0% 12-Aug-05
KRONOS 3% 3% 0% 30-Sep-06
HiSOC PM 0% 0%
Hi-SOC FSD Deployment 15% 25% 10%
Headquarters User Migration
34% 34% 0%
Support Systems
Online Learning Center Mod 3
0% 9% 9% 30-Sep-05
TIP Network 61% 61% 0% 8-Apr-05
Coast Guard Financials Migration
72% 72% 0% 31-Dec-04
Safety Information System 10% 10% 0%
HR Migration 6% 6% 0%
Executive IT
COOP 95% 95% 0% 8-Sep-04
Y
Y G Y
GGG
G
G
G G G G Y G
G G G
G
G
G G G G G G
G Y GG G
G
G
G
G
G
G G G G Y G
G G G
G G
Y G
GG G G G G G
G GG G GG Y
G
Y
G
G
G
G
G
R
G
R
G
G
G
G
10
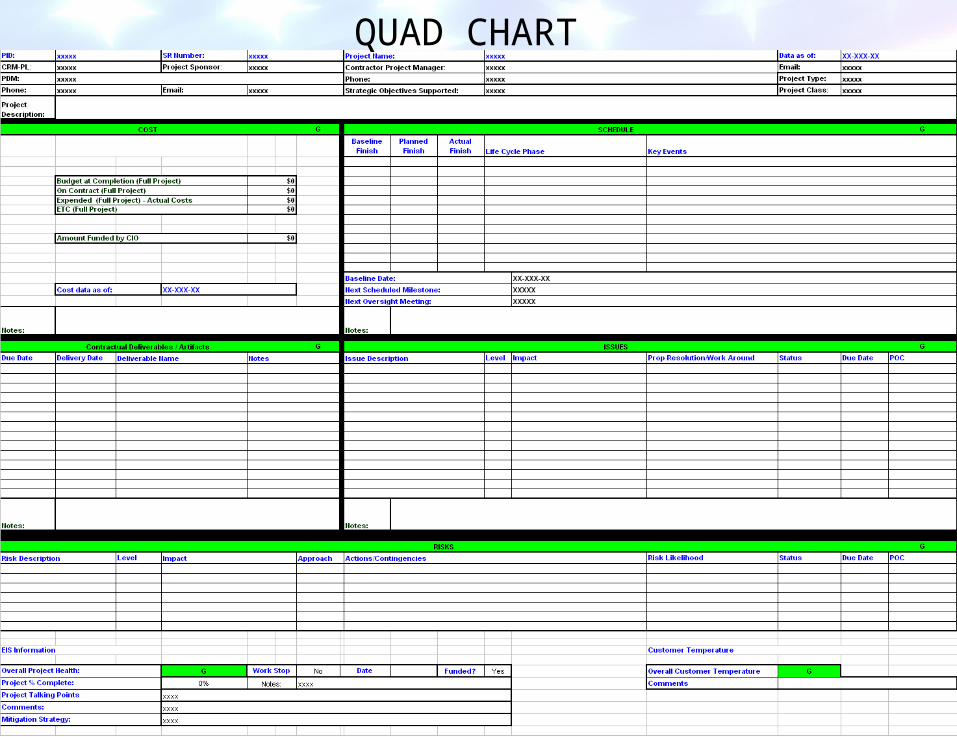
QUAD CHART
11
Project
Overall Project Health
Project Health Trend
% Comp Last
Report
% Comp This
Report% Comp
DeltaProject Est. Comp. Date Cost Sched. Perf. Issues Risks
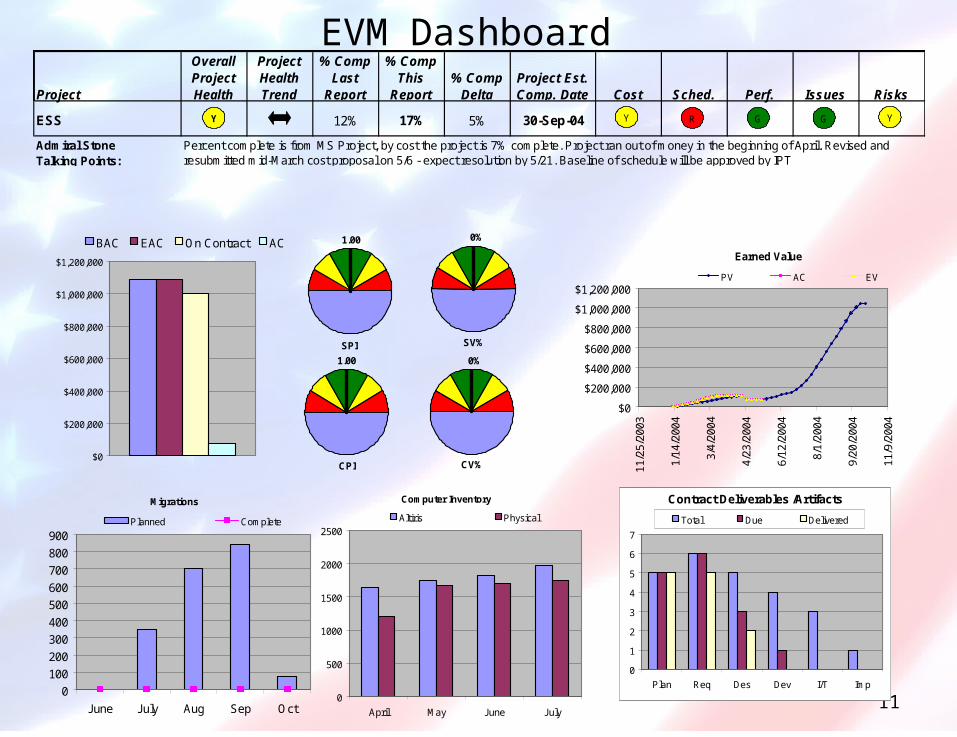
ESS 12% 17% 5% 30-Sep-04
Admiral Stone Talking Points:
Percent complete is from MS Project, by cost the project is 7% complete. Project ran out of money in the beginning of April. Revised and resubmitted mid-March cost proposal on 5/6 - expect resolution by 5/21. Baseline of schedule will be approved by IPT
Computer Inventory
0
500
1000
1500
2000
2500
April May June July
Altiris Physical
Earned Value
$0
$200,000
$400,000
$600,000
$800,000
$1,000,000
$1,200,000
11/2
5/20
03
1/14
/200
4
3/4/
2004
4/23
/200
4
6/12
/200
4
8/1/
2004
9/20
/200
4
11/9
/200
4
PV AC EV
Migrations
0
100
200
300
400
500
600
700
800
900
June July Aug Sep Oct
Planned Complete
CPI
1.00
CV%
0%
SPI
1.00
SV%
0%
$0
$200,000
$400,000
$600,000
$800,000
$1,000,000
$1,200,000
BAC EAC On Contract AC
GY Y R YG
Contract Deliverables /Artifacts
0
1
2
3
4
5
6
7
Plan Req Des Dev I/T Imp
Total Due Delivered
EVM Dashboard
12
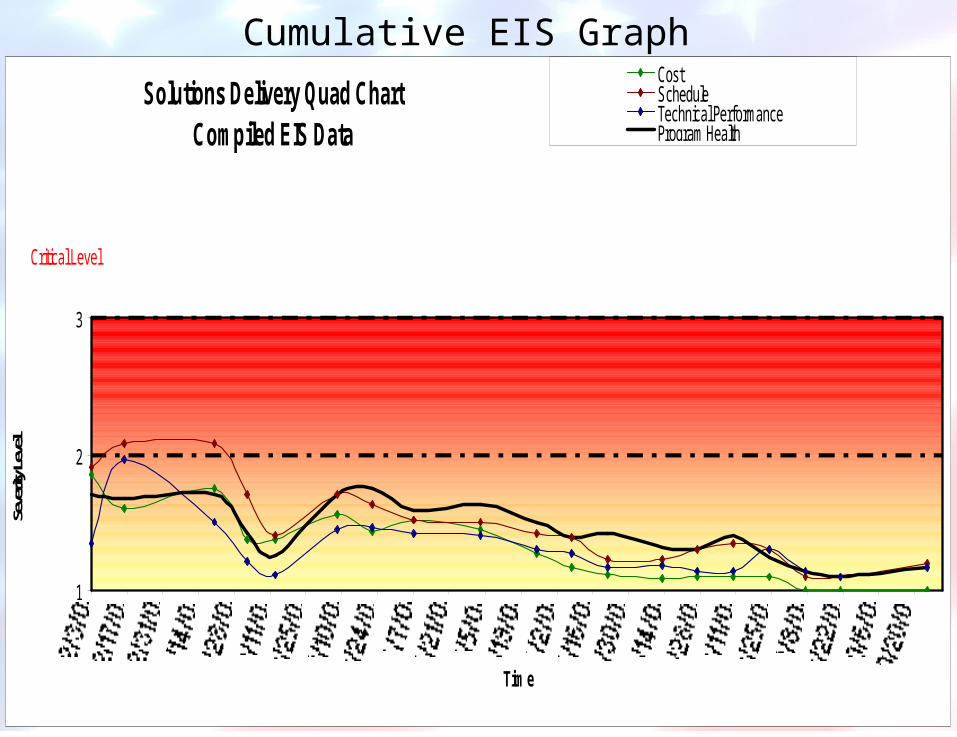
Solutions Delivery Quad Chart Compiled EIS Data
1
2
3
Time
Seve
rity L
evel
CostScheduleTechnical PerformanceProgram Health
Critical Level
Caution Level
Cumulative EIS Graph

13
SUMMARY…..
GOVERNANCE THE CUSTOMER AND THE CONTRACTOR HAVE CLEAR
EXPECTATIONS CONTRACTOR PERFORMANCE IS VISIBLE AND MEASURABLE STAFF IS TRAINED AND CAPABLE RISK IS MONITORED AND MANAGED PARTNERSHIP
TSA IS GETTING THE SERVICES IT PAYS FOR….

14
THINGS CAN ONLY GET BETTER……
THE STORY OF THE TRANSPORTATION SECURITY ADMINISTRATION’S PROGRAM
CONTROL OFFICE (PCO)
Shelly L. Myers, PMPSenior Vice PresidentMSB Associates, Inc.
Questions?
15
Close-up shots of selected slides

16
QUAD CHART - COST

17
QUAD CHART - SCHEDULE
18
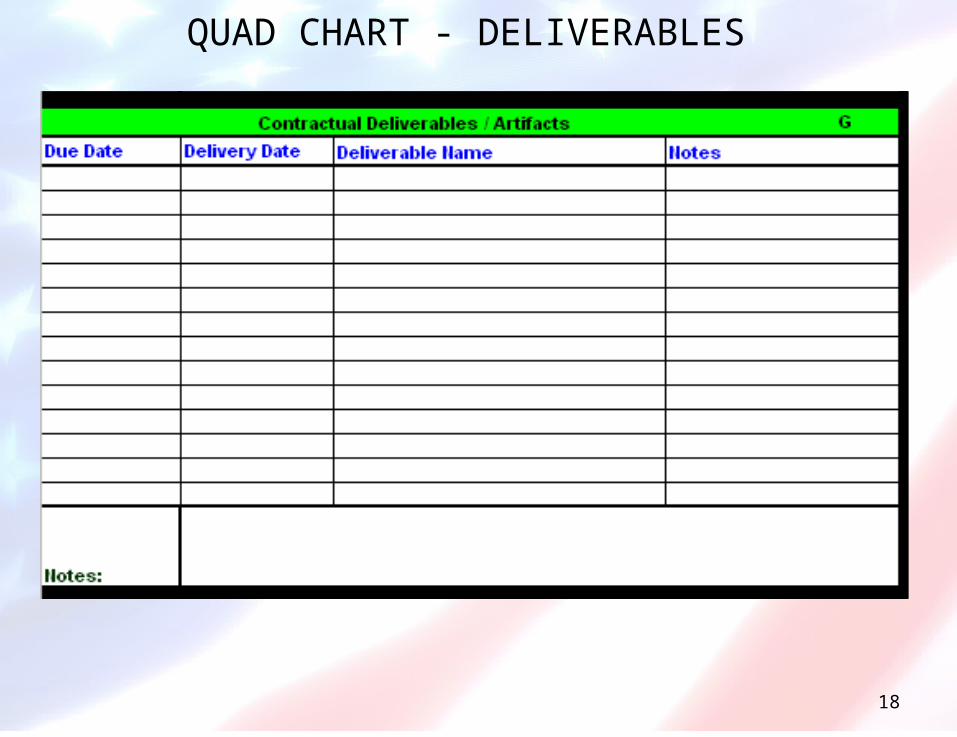
QUAD CHART - DELIVERABLES
19
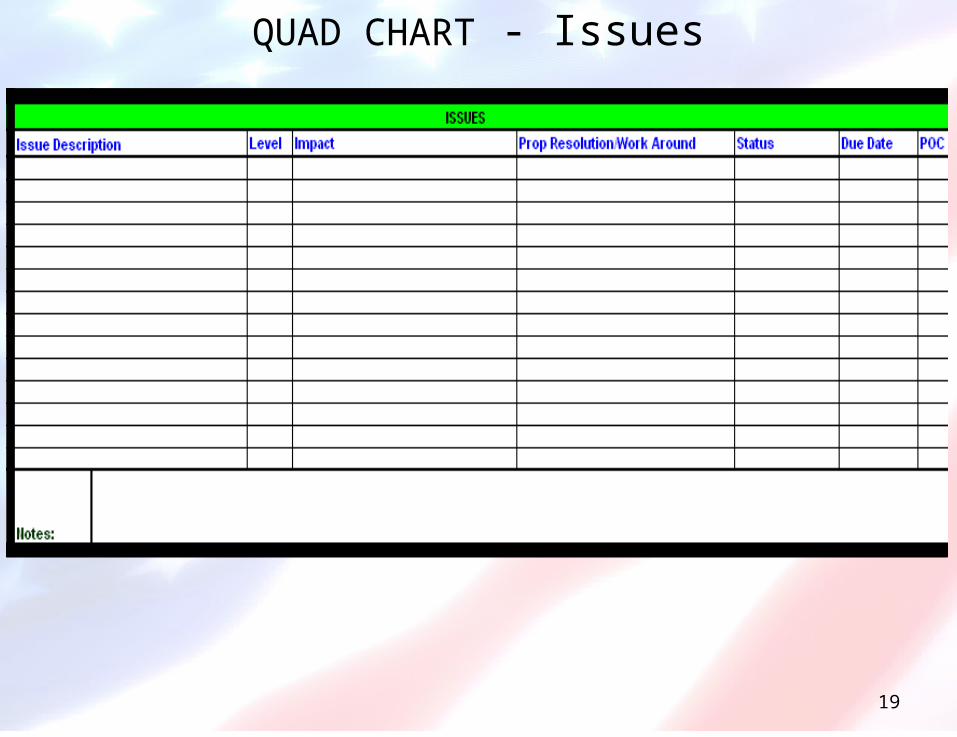
QUAD CHART - Issues

20
QUAD CHART - Risks

21
QUAD CHART – EIS Information

22
QUAD CHART – Customer Temperature
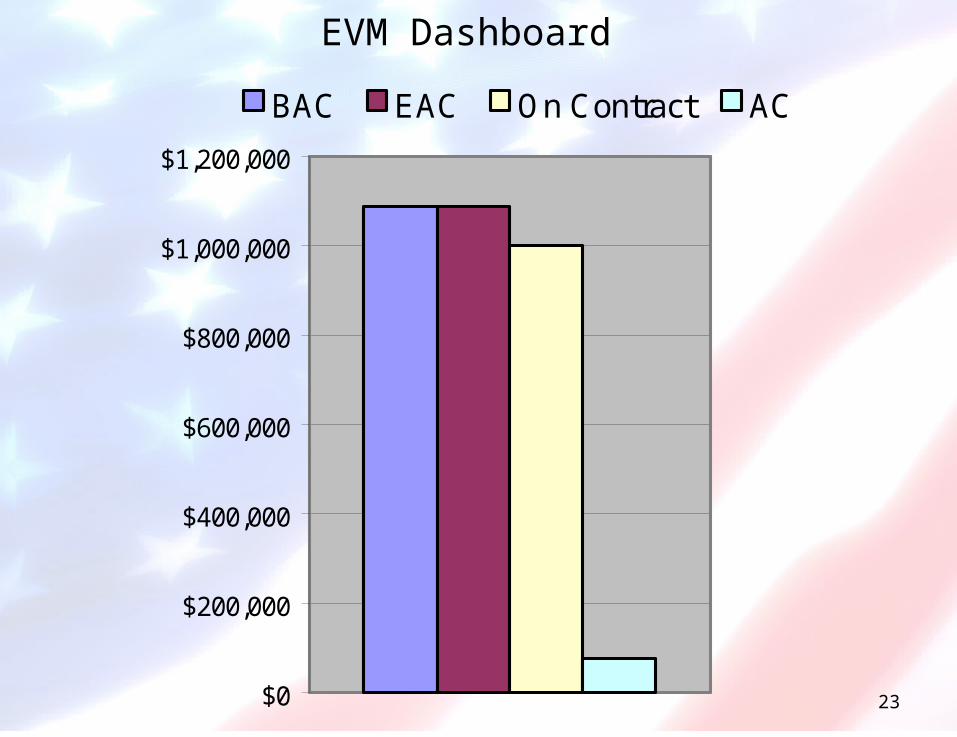
23
Project Cost Sched. Perf. Issues Risks
$0
$200,000
$400,000
$600,000
$800,000
$1,000,000
$1,200,000
BAC EAC On Contract AC
EVM Dashboard
24
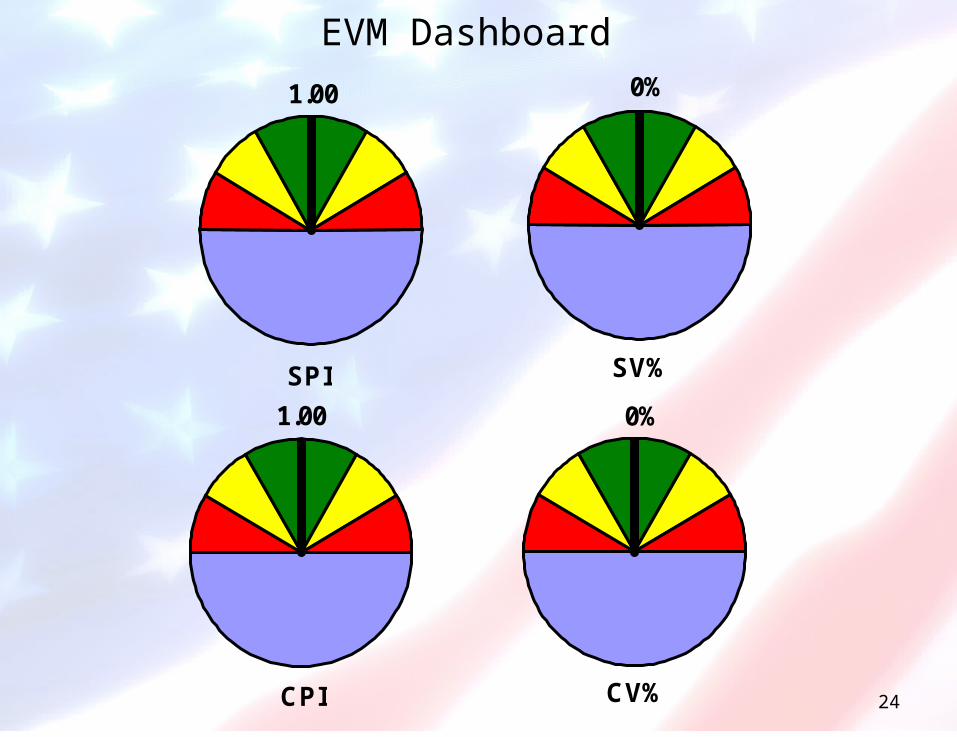
Project Cost Sched. Perf. Issues Risks
CPI
1.00
CV%
0%
SPI
1.00
SV%
0%
$0
$200,000
$400,000
$600,000
$800,000
$1,000,000
$1,200,000
EVM Dashboard

25
Project Cost Sched. Perf. Issues Risks
0
500
1000
1500
2000
2500
April May June July
Earned Value
$0
$200,000
$400,000
$600,000
$800,000
$1,000,000
$1,200,00011
/25/
2003
1/14
/200
4
3/4/
2004
4/23
/200
4
6/12
/200
4
8/1/
2004
9/20
/200
4
11/9
/200
4
PV AC EV
EVM Dashboard – Earned Value
26
Project Cost Sched. Perf. Issues Risks
0
500
1000
1500
2000
2500
April May June July
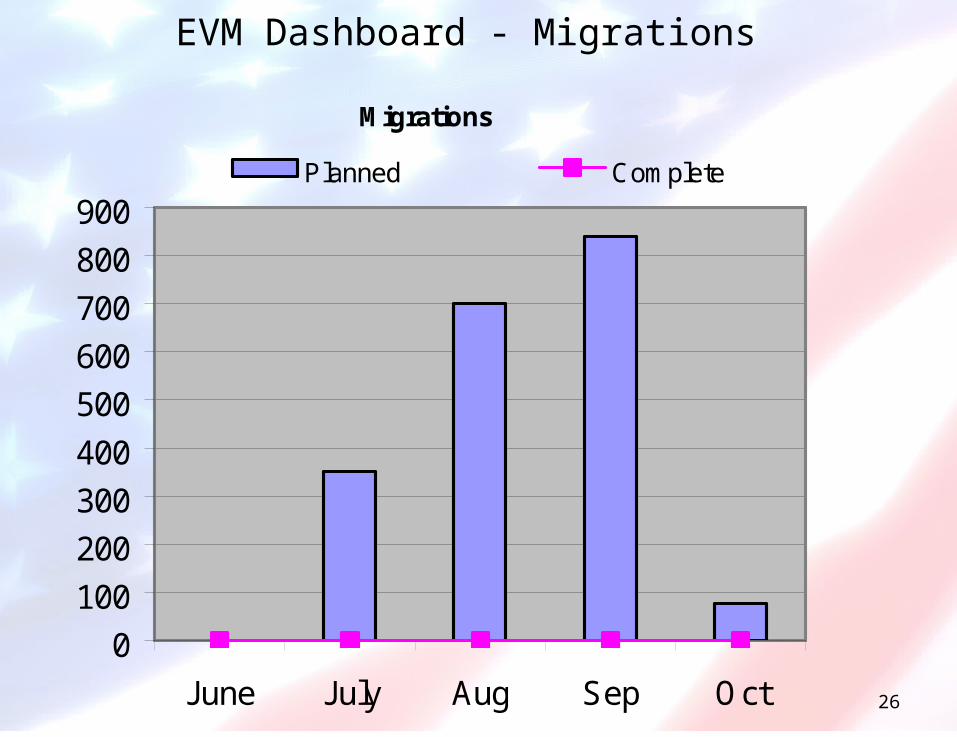
Migrations
0
100
200
300
400
500
600
700
800
900
June July Aug Sep Oct
Planned Complete
$0
$200,000
$400,000
$600,000
$800,000
$1,000,000
$1,200,000
EVM Dashboard - Migrations
27
Project Cost Sched. Perf. Issues Risks
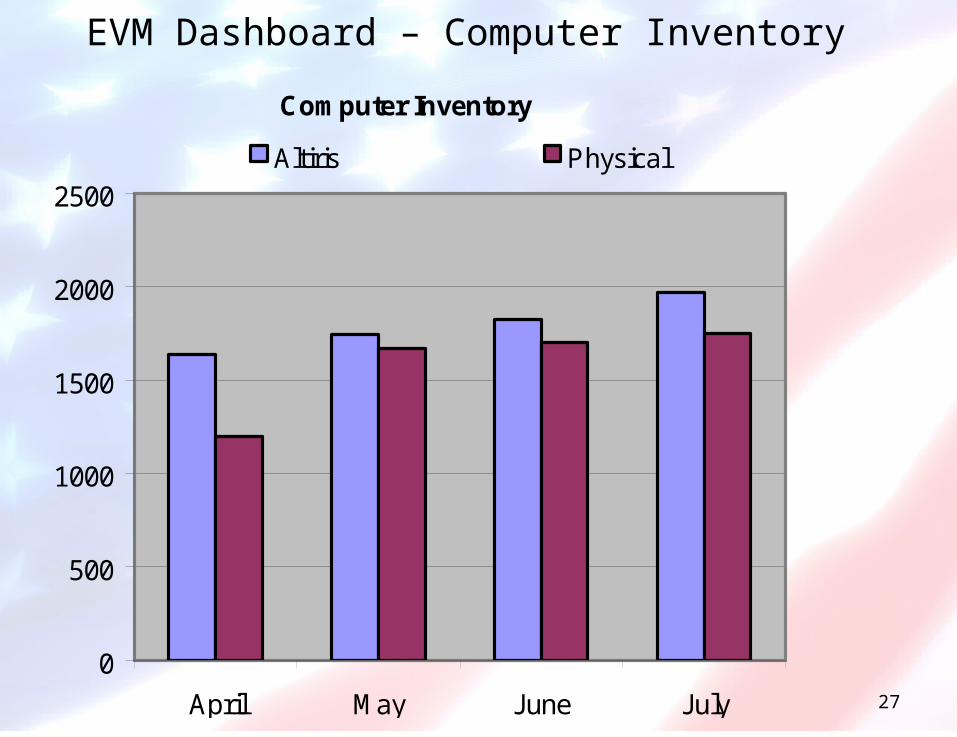
Computer Inventory
0
500
1000
1500
2000
2500
April May June July
Altiris Physical
$0
$200,000
$400,000
$600,000
$800,000
$1,000,000
$1,200,000
11/2
5/20
03
1/14
/200
4
3/4/
2004
4/23
/200
4
6/12
/200
4
8/1/
2004
9/20
/200
4
11/9
/200
4
0
100
200
300
400
500
600
700
800
900
June July Aug Sep Oct
EVM Dashboard – Computer Inventory
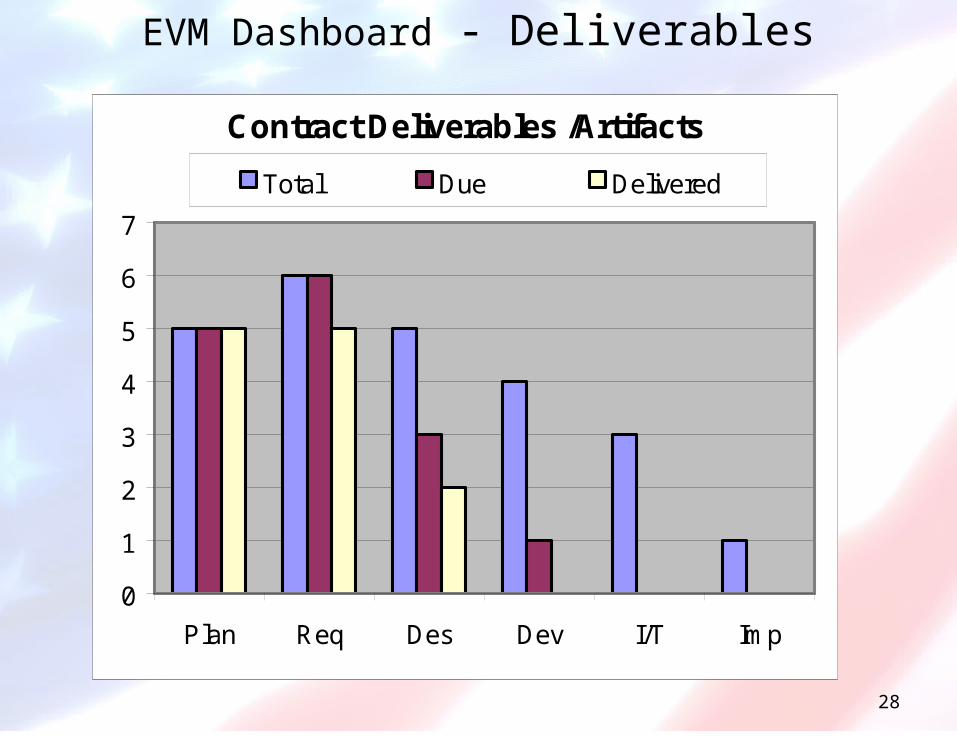
28
Project Cost Sched. Perf. Issues Risks
$0
$200,000
$400,000
$600,000
$800,000
$1,000,000
$1,200,000
11/2
5/20
03
1/14
/200
4
3/4/
2004
4/23
/200
4
6/12
/200
4
8/1/
2004
9/20
/200
4
11/9
/200
4
Contract Deliverables /Artifacts
0
1
2
3
4
5
6
7
Plan Req Des Dev I/T Imp
Total Due Delivered
EVM Dashboard - Deliverables