1 understanding the aortic isthmus doppler profile, and
TRANSCRIPT
1
Understanding the aortic isthmus Doppler profile, and its changes with gestational 1
age, using a lumped model of the fetal circulation 2
3
Patricia GARCIA-CANADILLA, PhD,1,2
Fatima CRISPI, MD,1,3
Monica CRUZ-LEMINI, 4
MD,1,3
Brenda VALENZUELA-ALCARAZ, MD1,3
Paula A. RUDENICK, PhD,2 Eduard 5
GRATACOS, MD,1,3
and Bart H. BIJNENS, PhD.2,4
6
7
1 Fetal i+D Fetal Medicine Research Center, BCNatal - Barcelona Center for Maternal-8
Fetal and Neonatal Medicine (Hospital Clínic and Hospital Sant Joan de Deu), IDIBAPS, 9
University of Barcelona, Spain. 10
2 Physense, DTIC, Universitat Pompeu Fabra, Barcelona, Spain. 11
3 Centre for Biomedical Research on Rare Diseases (CIBER-ER), Spain. 12
4 ICREA, Barcelona, Spain. 13
14
Short version of the title: Understanding the fetal aortic isthmus Doppler profile. 15
KEYWORDS: Aortic isthmus; computational model; fetal circulation; Doppler 16
17
Conflict of interest: The authors report no conflict of interest. 18
19
This study was partly supported by grants from Ministerio de Economia y Competitividad 20
(ref. SAF2012-37196, TIN2014-52923-R); the Instituto de Salud Carlos III (ref. 21
(PI11/01709, PI12/00801, PI14/00226) integrado en el Plan Nacional de I+D+I y 22
cofinanciado por el ISCIII-Subdirección General de Evaluación y el Fondo Europeo de 23
2
Desarrollo Regional (FEDER) “Otra manera de hacer Europa”; the EU FP7 for research, 1
technological development and demonstration under grant agreement VP2HF (no 611823); 2
The Cerebra Foundation for the Brain Injured Child (Carmarthen, Wales, UK); Obra Social 3
“la Caixa” (Barcelona, Spain); Fundació Mutua Madrileña and Fundació Agrupació Mutua 4
(Spain) and AGAUR 2014 SGR grant nº 928 (Barcelona, Spain). P.G.C. was supported by 5
the Programa de Ayudas Predoctorales de Formación en investigación en Salud 6
(FI12/00362) from the Instituto Carlos III, Spain. M.C.L. and B.V.A. wish to express her 7
gratitude to the Mexican National Council for Science and Technology (CONACyT, 8
Mexico City, Mexico) for supporting her predoctoral stay at Hospital Clinic, Barcelona, 9
Spain. 10
11
Address correspondence to: Patricia Garcia-Canadilla, Fetal i+D Fetal Medicine Research 12
Center, BCNatal - Barcelona Center for Maternal-Fetal and Neonatal Medicine, 13
Sabino de Arana 1, 08028, Barcelona, Spain. 14
Name: Patricia Garcia-Canadilla 15
Phone: +34932279946 or +34932279906. 16
Fax: +34932275605 17
E-mail: [email protected] 18
19
20

3
ABSTRACT 1
OBJECTIVE: The aortic isthmus (AoI) blood flow has a characteristic shape with a small 2
end-systolic notch observed during the third trimester of pregnancy. However, what causes 3
the appearance of this notch is not fully understood. We used a lumped model of the fetal 4
circulation to study the possible factors causing the end-systolic notch and the changes of 5
AoI flow through the gestation. 6
METHODS: A validation of the model was performed by fitting patient-specific data from 7
two normal fetuses. Then, different parametric analyses were performed to evaluate the 8
major determinants of the appearance of the end-systolic notch. The changes in the AoI 9
flow profile through gestation were assessed. 10
RESULTS: Our model allows to simulate the AoI waveform. The delay in the onset of 11
ejection together with the longer ejection duration of the right ventricle are the most 12
relevant factors in the origin of the notch. It appears around 25 week of gestation and 13
becomes more pronounced with advancing gestation. 14
DISCUSSION: We demonstrated that the end-systolic notch on the AoI flow occurs 15
mainly as a result of a delayed and longer ejection of the right ventricle. Our findings 16
improve the understanding of hemodynamic changes in the fetal circulation and the 17
interpretation of clinical imaging. 18
19

4
LIST OF ABBREVIATIONS 1
Ao - Aorta 2
AoI – Aortic isthmus 3
CA – Cerebral arteries 4
CO – Cardiac output 5
E – Young’s Modulus 6
ET – Ejection time 7
GA – Gestational age 8
IFI – Isthmic flow index 9
LCO – Left cardiac output 10
MCA – Middle cerebral artery 11
NRMSE – Normalized root mean square error 12
RCO – Right cardiac output 13
pA – Pulmonary artery 14
PEP – Pre-ejection period 15
Q - flow 16
TPV – Time-to-peak velocity 17
Tds – Time of deceleration of ejection 18
UA – Umbilical artery 19
V – Velocity 20
VTI – Velocity time integral 21
W – Womersley number 22
23
5
INTRODUCTION 1
The use of Doppler in Maternal-Fetal Medicine has become essential in the diagnosis and 2
monitoring of several fetal conditions such as intrauterine growth restriction, fetal anemia 3
or twin-to-twin transfusion syndrome. A good understanding of fetal hemodynamics and 4
Doppler patterns is necessary for the correct application and interpretation of Doppler 5
findings. However, some spectral Doppler tracing such as the fetal aortic isthmus (AoI) 6
waveforms are still not fully understood. The AoI is an aortic segment located between the 7
origin of the left subclavian artery and the junction of the ductus arteriosus to the 8
descending aorta. It behaves as a shunt that connects both upstream and downstream 9
circulations allowing the fetus to increase or reduce the amount of blood directed to the 10
brain (and heart), depending on the degree of oxygen supply from the placenta. The AoI 11
(Doppler) blood flow profile has a characteristic shape with a rapid systolic rise of the 12
velocity, followed by a more gradual deceleration with a small notch (in some cases) at the 13
end of systole, and forward flow during diastole. Some studies [1,2] have reported that this 14
small notch starts to appear at 25-30 weeks of gestation approximately with a progressive 15
increase with the progression of gestation, resulting in a brief peak of reversal flow at the 16
end of systole/beginning of diastole. However, the origin of this reversed peak is unclear. 17
Del Rio and colleagues considered this brief reversal of flow as artifactual [7]. Conversely, 18
some authors hypothesized that this peak occur as a result of delayed onset and longer 19
acceleration time of the flow coming from the ductus arteriosus [3–5]. Also, a recent study 20
found that the magnitude of the peak correlates with the right ventricular output [6]. 21
During systole, blood coming from the left ventricle causes forward flow through 22
the AoI, whereas flow from the right ventricle (through the ductus arteriosus) can be 23
6
directed to either the lower or upper body and thus potentially can have the opposite 1
direction in the AoI. Therefore, differences in timing and amount of flow between 2
pulmonary artery and aortic flows could play a role in the origin of the AoI end-systolic 3
notch. It is well known that prenatally the right ventricle ejects more blood than the left 4
ventricle, and this dominance of the right ventricle increases with advancing gestation 5
[12,13]. In addition, several clinical studies have reported a delay in the onset of right 6
ventricular ejection [4,8], differences in the duration of the ejection of both ventricles [9] 7
and time-to-peak velocity or acceleration time [10,11]. Finally, changes in the elastic 8
properties of the pulmonary vasculature could also have an effect in the appearance of the 9
notch [6]. As far as we know, since it is very challenging in–vivo, there are no studies 10
measuring the differential effect of each of these factors on the AoI flow profile and 11
specifically in the appearance of the end-systolic notch. In the present study, we propose to 12
use a computational model of the fetal circulation to evaluate the individual, as well as 13
combined, influence of all these parameters on the AoI flow profile and their role in the 14
appearance of the end-systolic notch. 15
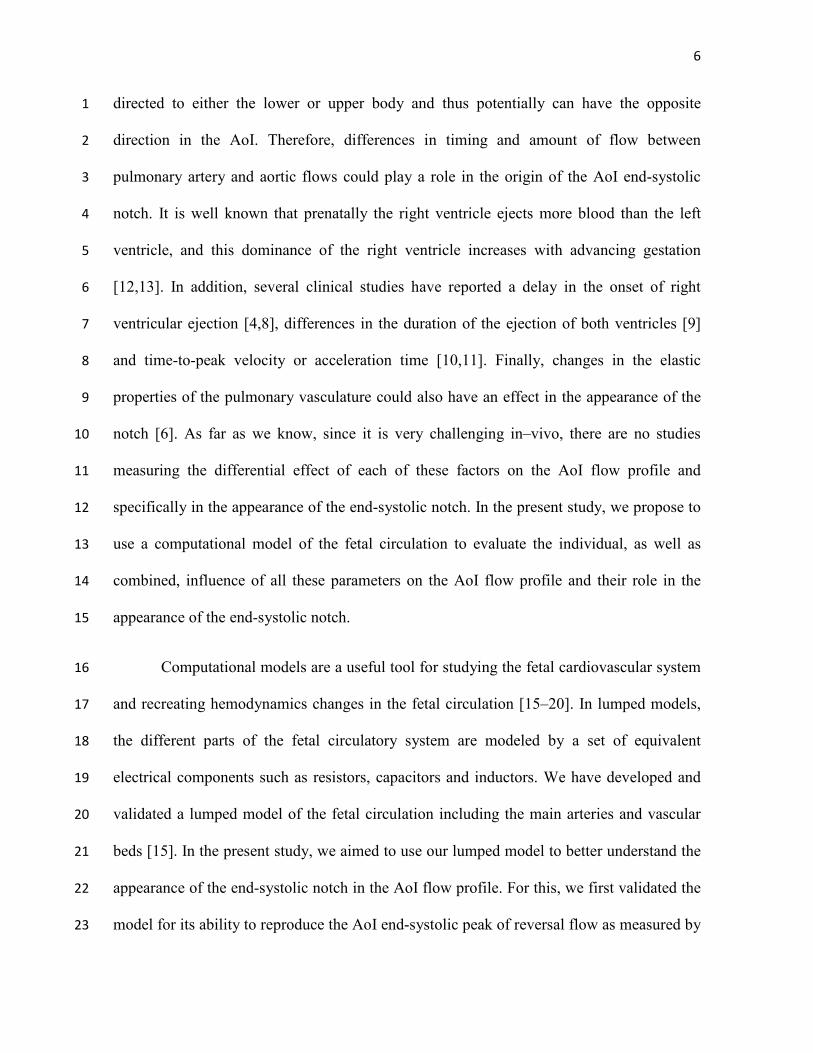
Computational models are a useful tool for studying the fetal cardiovascular system 16
and recreating hemodynamics changes in the fetal circulation [15–20]. In lumped models, 17
the different parts of the fetal circulatory system are modeled by a set of equivalent 18
electrical components such as resistors, capacitors and inductors. We have developed and 19
validated a lumped model of the fetal circulation including the main arteries and vascular 20
beds [15]. In the present study, we aimed to use our lumped model to better understand the 21
appearance of the end-systolic notch in the AoI flow profile. For this, we first validated the 22
model for its ability to reproduce the AoI end-systolic peak of reversal flow as measured by 23
7
Doppler by personalizing it to 2 normal control fetuses with different gestational ages (one 1
showing an end-systolic peak of reversal flow in the AoI, and the other not). Next, different 2
parametric studies were performed to evaluate which factors (for example timing, amount 3
of blood flow, resistance) influenced the appearance of the notch. Finally, the change of the 4
AoI flow pattern with advancing gestation was also studied. 5
METHODS 6
1. Lumped model of the fetal circulation 7
In this study, we used a previously published lumped model of the fetal circulation [15]. 8
Briefly, the model consisted of 14 arterial segments, including the AoI and the ductus 9
arteriosus, 8 vascular beds and 2 blood flow inputs: the aortic and pulmonary artery blood 10
flow profiles, as shown in Figure 1. Arterial segments were modeled with a resistor to 11
represent the local resistance of blood due to blood viscosity, a capacitor to represent the 12
arterial compliance and an inductor to represent the blood inertia (Figure 1). Vascular beds 13
consisted of a three-element Windkessel model, which included a resistor and a capacitor 14
representing the peripheral resistance and compliance respectively. The values of all the 15
electrical components were calculated according to the gestational age and the estimated 16
fetal weight of the fetus, under normal physiological conditions. The variation of the 17
arterial Young’s modulus and the vascular end compliances with the gestational age was 18
included. Specifically, the arterial Young’s moduli were scaled following the expression (of 19
van den Wijngaard et al (Eq. 5 in [18]). Vascular bed compliances were scaled to their 20
values at each corresponding gestational age, using the expression reported by van Gemert 21
et al (Eq. 4k-4l in [21]). 22

8
2. Validation of the lumped model for assessing the AoI flow profile 1
In order to validate the lumped model of the fetal circulation for its ability to reproduce the 2
AoI end-systolic peak of reversal flow, we used real Doppler data from 2 normal fetuses 3
with different gestational ages (one >30 weeks of gestation showing an end-systolic peak of 4
reversal flow in the AoI blood waveform, and the other <30 weeks of gestation not showing 5
the peak). The validation was performed by a patient-specific fitting that minimized the 6
error between the measured and the model-based blood velocities waveforms at the AoI 7
and middle cerebral artery (MCA). The detailed methodology of the validation procedure is 8
described in Appendix A. 9
3. Single and multi parametric analysis to study what influence the AoI flow. 10
Five variables determining aortic and pulmonary flows that could potentially affect the AoI 11
waveform were chosen for the single and multi parametric analysis including: (1) 12
difference in the duration of the slow deceleration of ejection (Tsd) between aortic and 13
pulmonary artery flows, (2) difference between LV and RV ejection times (ET), (3) delay 14
in the onset of RV and LV ejection or difference between pre-ejection periods (PEP), (4) 15
difference between aortic and pulmonary artery time-to-peak velocities (TPV) and (5) 16
relative CO. Additionally, two other variables of the pulmonary arterial network were 17
chosen for single parametric analysis: (6) pulmonary vasculature compliance and (7) lung 18
resistance. In each of the first five single parametric analyses, the aortic and pulmonary 19
flows waveforms were changed in only one of the variables while keeping the rest of them 20
equal between both blood flow profiles. Then, these blood flows (Figure S1) were set as 21
input of the computational model. In the last two single parametric analyses the both blood 22
flows were kept equals and only the pulmonary vascular or lung compliance was changed. 23
9
After each simulation, the model-based AoI flows were obtained in order to study the 1
influence of each variable on the AoI flow separately. Details on the single parametric 2
analysis can be found in section S.4 of the supplementary methods. The next step was to 3
perform a multi parametric study, including all the possible combinations between the 4
different five variables determining aortic and pulmonary flows. Details on the multi 5
parametric analysis can be found in section S.5 of the supplementary methods. These 6
different parametric studies were performed for a specific gestational age. However, some 7
variables change during gestation, such as the amount of blood ejected by both ventricles, 8
the heart rate, the TPV, etc. as well as other hemodynamics variables such as vascular 9
resistances and compliances. For this reason, the change of the AoI flow pattern with 10
advancing gestation was also studied. Details on simulating the advance of gestation can 11
be found in section S.6 of the supplementary methods. 12
RESULTS 13
1. Validation 14
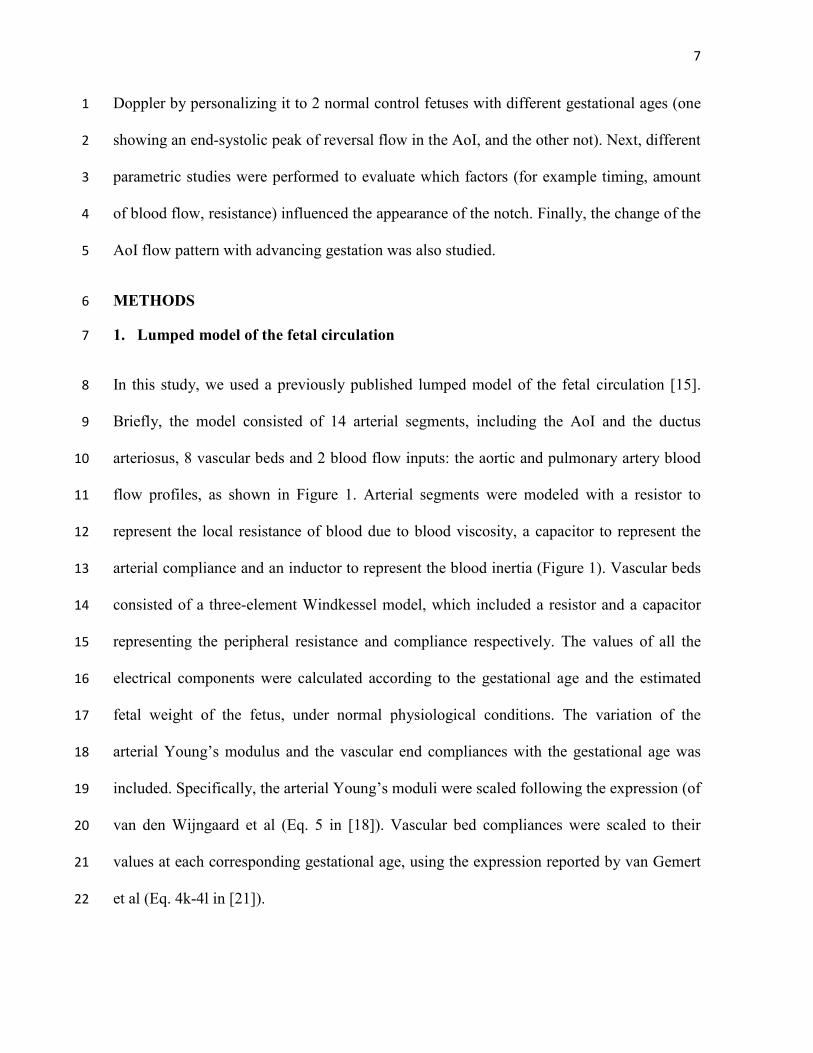
Ultrasound and perinatal data of the both fetuses is shown in Table A1. The measured and 15
model-based velocity waveforms in the AoI and MCA are displayed in Figure 2. The 16
estimated patient-specific parameters after the optimization procedure are shown in Table 17
A2, validating the good performance of the model in retrieving patient-specific data. 18
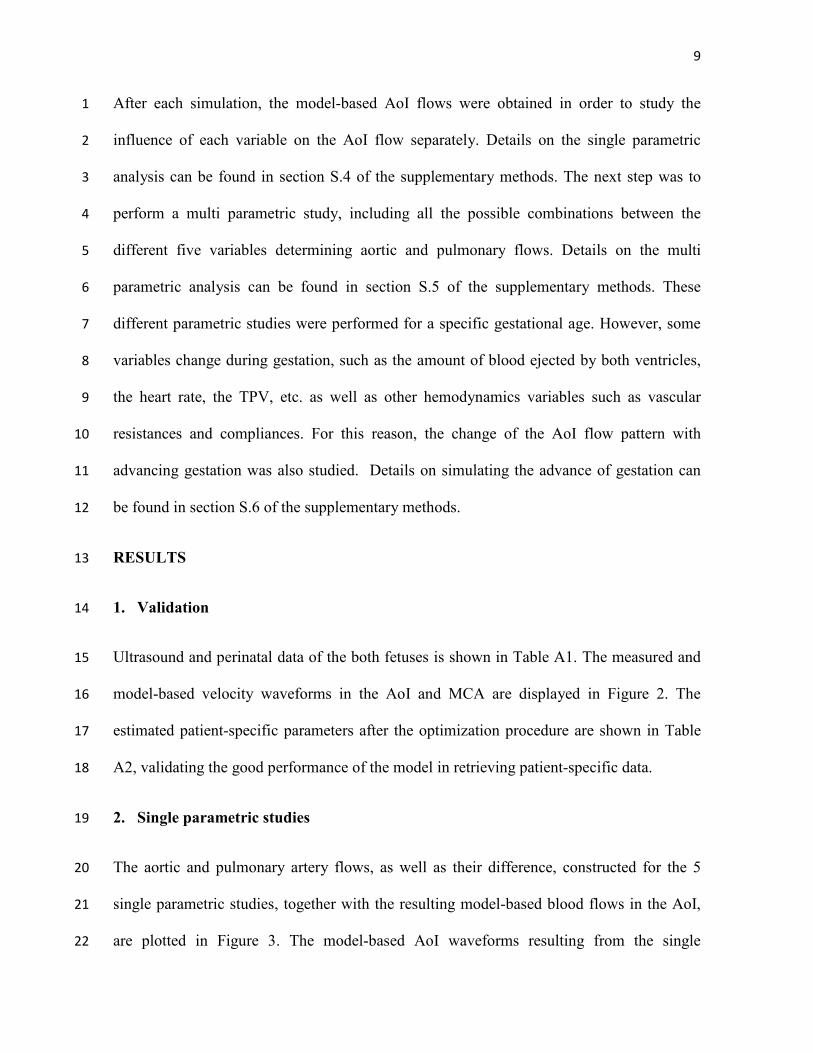
2. Single parametric studies 19
The aortic and pulmonary artery flows, as well as their difference, constructed for the 5 20
single parametric studies, together with the resulting model-based blood flows in the AoI, 21
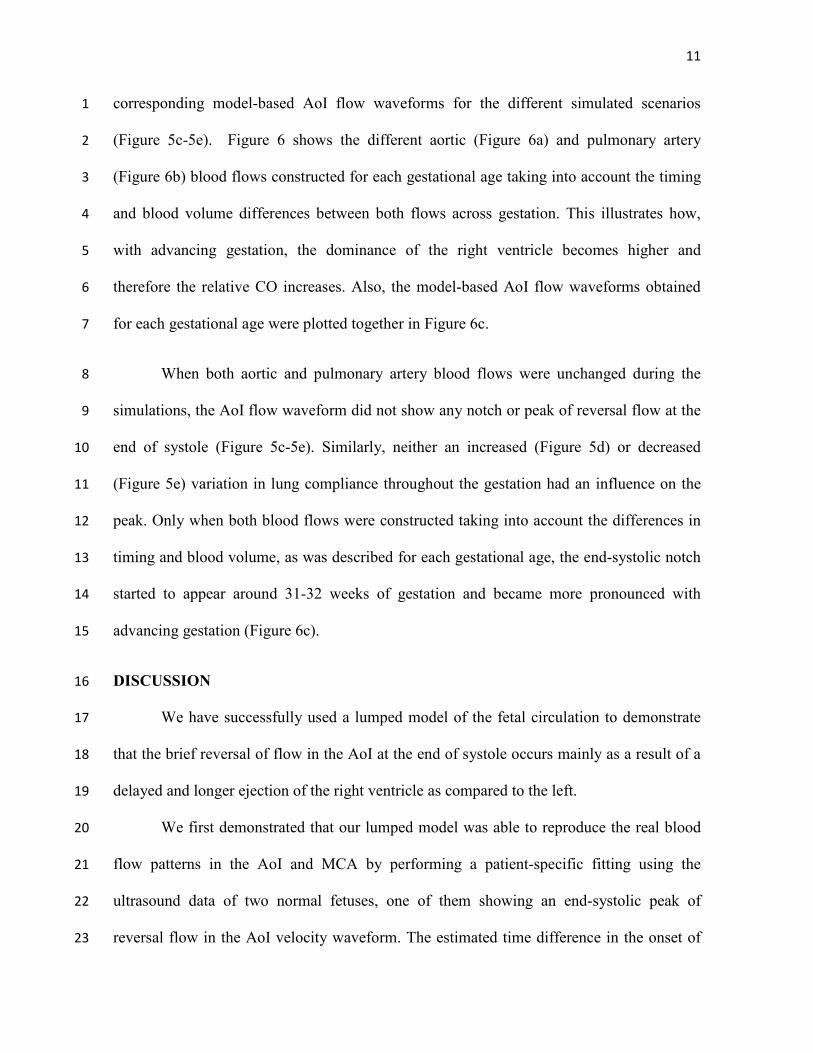
are plotted in Figure 3. The model-based AoI waveforms resulting from the single 22

10
parametric analysis on the variation of pulmonary vasculature compliances and on the 1
variation of lung resistance are shown in Figure 4. The graphs suggest that the delay in the 2
onset of ejection (Figure 3i-3l) and the longer ejection of the right ventricle (Figure 3e-3h) 3
are the factors that seem to have the mayor influence on the appearance of the end-systolic 4
notch in the AoI blood flow (Figure 3d,h,l,p,t). Furthermore, looking at the graphs 5
corresponding to the difference between aorta and pulmonary artery blood flows, it seems 6
that the appearance and magnitude of the end-systolic notch is explained by the difference 7
between pulmonary artery and aortic flows in the last milliseconds of the ejection, so that as 8
the flow difference increased the notch would be more pronounced. 9
3. Multi parametric study 10
The results of the linear regression analysis are shown in Table 1. The difference in the 11
onset of ejection and the longer ejection of the right ventricle are the strongest factors to 12
contribute to the appearance of the end-systolic notch in the AoI. The amount of flow of the 13
difference between pulmonary artery and aortic flows during the deceleration of ejection 14
was highly correlated with the magnitude of the end-systolic notch of the AoI flow (R = -15
0.7268 with p<0.001) showing that the higher the flow of the pulmonary artery at the last 16
part of systole compared to the aortic flow, the more pronounced (more negative its value) 17
the notch would be. 18
4. Simulating the advance of gestation 19
Figure 5 shows the different aortic (Figure 5a) and pulmonary artery (Figure 5b) blood 20
flows constructed for each gestational age, without considering any difference in timing 21
and with the same amount of blood ejected by both ventricles, together with the 22
11
corresponding model-based AoI flow waveforms for the different simulated scenarios 1
(Figure 5c-5e). Figure 6 shows the different aortic (Figure 6a) and pulmonary artery 2
(Figure 6b) blood flows constructed for each gestational age taking into account the timing 3
and blood volume differences between both flows across gestation. This illustrates how, 4
with advancing gestation, the dominance of the right ventricle becomes higher and 5
therefore the relative CO increases. Also, the model-based AoI flow waveforms obtained 6
for each gestational age were plotted together in Figure 6c. 7
When both aortic and pulmonary artery blood flows were unchanged during the 8
simulations, the AoI flow waveform did not show any notch or peak of reversal flow at the 9
end of systole (Figure 5c-5e). Similarly, neither an increased (Figure 5d) or decreased 10
(Figure 5e) variation in lung compliance throughout the gestation had an influence on the 11
peak. Only when both blood flows were constructed taking into account the differences in 12
timing and blood volume, as was described for each gestational age, the end-systolic notch 13
started to appear around 31-32 weeks of gestation and became more pronounced with 14
advancing gestation (Figure 6c). 15
DISCUSSION 16
We have successfully used a lumped model of the fetal circulation to demonstrate 17
that the brief reversal of flow in the AoI at the end of systole occurs mainly as a result of a 18
delayed and longer ejection of the right ventricle as compared to the left. 19
We first demonstrated that our lumped model was able to reproduce the real blood 20
flow patterns in the AoI and MCA by performing a patient-specific fitting using the 21
ultrasound data of two normal fetuses, one of them showing an end-systolic peak of 22
reversal flow in the AoI velocity waveform. The estimated time difference in the onset of 23

12
ejection between aorta and pulmonary artery flows was much bigger for the fetus showing 1
reversal of flow in the AoI as compared to the fetus without peak. This result fits well with 2
the experimental data of De Muylder et al [5] showing a delay in the onset of right 3
ventricular ejection, and suggest that this delay could explain the reversal of AoI flow at 4
late systole [4,8]. 5
The striking finding of the present study is the in silico demonstration that the 6
timing differences between pulmonary and aortic blood flows are the main determinants for 7
the appearance of the end-systolic reversal flow in the AoI. Our results are consistent with 8
previous studies describing a longer ejection [9] and pre-ejection period [5] of the right 9
ventricle in normal fetuses. In addition, the flow difference between pulmonary artery and 10
the aorta during the deceleration of ejection was highly correlated with the magnitude of the 11
end-systolic notch of the AoI flow. Our data confirms the previously formulated hypothesis 12
by Acharya et al. [4,8] that any difference in ejection force duration or volume between 13
both ventricles affects the shape of the AoI velocity waveform during systole. Our data is 14
also in agreement with the previously reported correlation between the right ventricular 15
output and the magnitude of the notch by Chabaneix et al. [6]. They hypothesized that this 16
can be explained by the variation in the compliance of the fetal pulmonary arterial network. 17
However, our results suggested that neither increased nor decreased variation in lung 18
compliance throughout gestation had an influence on the appearance of the end systolic 19
reversal peak even though the shape AoI flow was altered considerably. 20
This study also provides insights in the AoI flow changes throughout gestation. A 21
small notch could be seen at the end of systole in the model-based flow pattern of AoI 22
corresponding to week 25 that progressively became more pronounced as gestation 23
progressed into a short peak of reversal flow from week 34-35 onwards. These results are 24

13
consistent with human data as Acharya et al [4,8] describing a small AoI notch from 25 1
weeks that becomes more pronounced as gestation advances (with a clear AoI reversal peak 2
in almost all fetuses around 31 weeks of gestation) [4,8]. Our data also showed that 3
increased CO or changes in size and properties of the vasculature are not main determinants 4
for the appearance of AoI reversal end-systolic peak. 5
In conclusion, we demonstrated that the characteristic notch in the AoI at the end of 6
systole, and at late gestation, occurs mainly as a result of a delayed and longer ejection of 7
the right ventricle as compared to the left, and therefore it is not artifactual as suggested by 8
Del Rio et al [7]. Additionally, we demonstrated that our lumped model is a useful tool that 9
allows the estimation of patient-specific parameters that cannot be assessed clinically, 10
helping to improve the understanding of the hemodynamic changes in the fetal circulation 11
throughout gestation. A better comprehension of the AoI waveform might help in the 12
interpretation of normal and abnormal Doppler patterns observed in some fetal conditions 13
such as intrauterine growth restriction or fetal hypoxia, in which blood flow is redirected to 14
the brain or left/right outputs are disbalanced. For example, the AoI flow reversal can be 15
seen as an escape mechanism to easily and fast redistribute blood flow from lower to upper 16
body in some cases of intrauterine growth restriction. This also implies that, under healthy 17
conditions, the physiologic right to left shunt could be helpful for the fetus to withstand 18
intermittent episodes of lack of oxygen (such as the ones occurring during the 1-minute 19
stress at the peak of uterine contractions during labor), without damage to the brain. 20
Furthermore, future personalisation of the models, where measured velocity patterns from a 21
specific patient are used to fit the model, will enable distinguishing physiological (AoI) 22
traces from alterations induced by abnormalities of the placenta or other parts of the 23
circulation. Therefore we believe that the use of computational models might help to 24

14
advance in the general understanding of the complex fetal hemodynamics and improve the 1
current use and interpretation of Doppler in fetal medicine and offers possibilities for 2
individual interpretation of clinical measurements. 3
4
15
REFERENCES 1
1. Fouron J-CC: The unrecognized physiological and clinical significance of the fetal 2
aortic isthmus. Ultrasound Obstet Gynecol 2003 Nov;22:441–7. 3
2. Ruskamp J, Fouron J-CC, Gosselin J, Raboisson M-JJ, Infante-Rivard C, Proulx F: 4
Reference values for an index of fetal aortic isthmus blood flow during the second 5
half of pregnancy. Ultrasound Obstet Gynecol 2003 May;21:441–4. 6
3. Schmidt KG, Silverman NH, Rudolph AM: Phasic flow events at the aortic isthmus-7
ductus arteriosus junction and branch pulmonary artery evaluated by multimodal 8
ultrasonography in fetal lambs. Am J Obs Gynecol 1998;179:1338–1347. 9
4. Acharya G, Tronnes A, Rasanen J: Aortic isthmus and cardiac monitoring of the 10
growth-restricted fetus. Clin Perinatol 2011;38:113–25, vi–vii. 11
5. De Muylder X, Fouron JC, Bard H, Riopel L, Urfer F: The difference between the 12
systolic time intervals of the left and right ventricles during fetal life. Am J Obs 13
Gynecol 1984;149:737–740. 14
6. Chabaneix J, Fouron JC, Sosa-Olavarria A, Gendron R, Dahdah N, Berger A, et al.: 15
Profiling left and right ventricular proportional output during fetal life with a novel 16
systolic index in the aortic isthmus. Ultrasound Obs Gynecol 2014;44:176–181. 17
7. Del Río M, Martínez JM, Figueras F, López M, Palacio M, Gómez O, et al.: 18
Reference ranges for Doppler parameters of the fetal aortic isthmus during the 19
second half of pregnancy. Ultrasound Obstet Gynecol 2006 Jul;28:71–6. 20
8. Acharya G: Technical aspects of aortic isthmus Doppler velocimetry in human 21
fetuses. Ultrasound Obstet Gynecol 2009 Jun;33:628–33. 22
9. Fouron JC, Zarelli M, Drblik P, Lessard M: Flow velocity profile of the fetal aortic 23
isthmus through normal gestation. Am J Cardiol 1994;74:483–486. 24
10. Machado M V, Chita SC, Allan LD: Acceleration time in the aorta and pulmonary 25
artery measured by Doppler echocardiography in the midtrimester normal human 26
fetus. Br Hear J 1987;58:15–18. 27
11. Sutton MS, Gill T, Plappert T, Saltzman DH, Doubilet P: Assessment of right and 28
left ventricular function in terms of force development with gestational age in the 29
normal human fetus. Br Hear J 1991;66:285–289. 30
12. Kiserud T, Ebbing C, Kessler J, Rasmussen S: Fetal cardiac output, distribution to 31
the placenta and impact of placental compromise. Ultrasound Obs Gynecol 32
2006;28:126–136. 33
16
13. Molina FS, Faro C, Sotiriadis A, Dagklis T, Nicolaides KH: Heart stroke volume and 1
cardiac output by four-dimensional ultrasound in normal fetuses. Ultrasound Obs 2
Gynecol 2008;32:181–187. 3
14. Kiserud T, Acharya G: The fetal circulation. Prenat Diagn 2004 Dec 30;24:1049–59. 4
15. Garcia-Canadilla P, Rudenick PA, Crispi F, Cruz-Lemini M, Palau G, Camara O, et 5
al.: A computational model of the fetal circulation to quantify blood redistribution in 6
intrauterine growth restriction. PLoS Comput Biol 2014;10:e1003667. 7
16. Guettouche, Guettouche A, Challier JC, Ito Y, Papapanayotou C, Cherruault Y, et 8
al.: Mathematical modeling blood circulation of the human fetal arterial. Int J 9
Biomed Comput 1992;31:127–139. 10
17. Luria O, Bar J, Kovo M, Malinger G, Golan A, Barnea O: The role of blood flow 11
distribution in the regulation of cerebral oxygen availability in fetal growth 12
restriction. Med Eng Phys 2012 Apr;34:364–9. 13
18. Van den Wijngaard JPHM, Westerhof BE, Faber DJ, Ramsay MM, Westerhof N, 14
van Gemert MJC: Abnormal arterial flows by a distributed model of the fetal 15
circulation. Am J Physiol Regul Integr Comp Physiol 2006 Nov;291:R1222–33. 16
19. Pennati G, Bellotti M, Fumero R: Mathematical modelling of the human foetal 17
cardiovascular system based on Doppler ultrasound data. Med Eng Phys 1997 18
Jun;19:327–35. 19
20. Luria O, Bar J, Shalev J, Kovo M, Golan A, Barnea O: Inverse Solution of the Fetal-20
Circulation Model Based on Ultrasound Doppler Measurements. Cardiovasc Eng 21
Technol 2014;5:202–216. 22
21. Van Gemert MJC, Sterenborg HJ, C MJCVG: Haemodynamic Model of Twin-Twin 23
Transfusion Syndrome. Placenta 1998;19:195–208. 24
22. Arduini D, Rizzo G: Normal values of Pulsatility Index from fetal vessels: a cross-25
sectional study on 1556 healthy fetuses. J Perinat Med 1990;18:165–172. 26
23. Baschat AA, Gembruch U: The cerebroplacental Doppler ratio revisited. Ultrasound 27
Obs Gynecol 2003;21:124–127. 28
24. Schneider C, McCrindle BW, Carvalho JS, Hornberger LK, McCarthy KP, 29
Daubeney PEF: Development of Z-scores for fetal cardiac dimensions from 30
echocardiography. Ultrasound Obstet Gynecol 2005 Nov;26:599–605. 31
25. Ponzini R, Vergara C, Rizzo G, Veneziani A, Roghi A, Vanzulli A, et al.: 32
Womersley number-based estimates of blood flow rate in Doppler analysis: in vivo 33

17
validation by means of phase-contrast MRI. IEEE Trans Biomed Eng 2010;57:1807–1
1815. 2
26. DeVore GR: Assessing fetal cardiac ventricular function. Semin Fetal Neonatal Med 3
2005 Dec;10:515–41. 4
27. Gallivan S, Robson SC, Chang TC, Vaughan J, Spencer JA: An investigation of fetal 5
growth using serial ultrasound data. Ultrasound Obs Gynecol 1993;3:109–114. 6
7

18
TABLES 1
Table 1. Results from the regression analysis. 2
Coefficient SE p
TdspA - TdsAo -16.8 0.18 <0.001
ETpA - ETAo -41.8 0.38 <0.001
PEPpA - PEPAo -80.1 1.14 <0.001
TPVpA - TPVAo -29.5 0.93 <0.001
RCO/LCO -1.6 0.02 <0.001
Root Mean Squared Error: 0.215, R-squared: 0.908, p-value = 0.0 3
SE, standard error; Tds, Time of the slow deceleration of the ejection; ET, ejection time; 4
PEP, pre-ejection period (delay in the onset of ejection); TPV, time-to-peak velocity; RCO, 5
right cardiac output; LCO, left cardiac output; pA, pulmonary artery; Ao, aorta. 6
7

19
FIGURE LEGENDS 1
Figure 1. Anatomical simplified configuration of the fetal circulation. Anatomical 2
configuration used to model the fetal circulation, composed of 14 arterial segments, 8 3
vascular beds (CA = coronary arteries, B = brain, UB = upper body, L = lung and P = 4
peripheral) and 2 blood flow inputs. An example of the equivalent electrical lumped model 5
of one of the arterial segments is also displayed. 6
Figure 2. Patient-specific fitting. (a) Aortic isthmus (AoI) Doppler velocity waveform, (b) 7
AoI and (c) middle cerebral artery (MCA) blood velocity model-based (in solid line) and 8
measured (in dash line) waveforms for the fetus with 29 weeks of gestation. (d) AoI 9
Doppler velocity waveform, (e) AoI and (f) MCA blood velocity model-based (in solid 10
line) and measured (in dash line) waveforms for the fetus with 35 weeks of gestation. The 11
red dashed line indicates a flow of 0 ml/s. Red arrows point to the notch in the fetus of 29 12
weeks of gestation and to the peak of reversal flow in the fetus of 35 weeks of gestation, at 13
the end of systole. 14
Figure 3. Model-based waveforms of the single parametric analyses. From left to right: 15
Aortic flow, pulmonary artery flow, difference between pulmonary artery and aortic flows 16
and aortic isthmus model-based flow functions. From top to bottom: resulting plots from 17
the 5 single parametric studies (a)-(d) Duration of the slow deceleration of ejection phase, 18
(e)-(h) Ejection time, (i)-(l) Pre-ejection period, (m)-(p) Time to peak velocity and (q)-(t) 19
relative right and left cardiac outputs. The dashed line indicates a flow of 0 ml/s. 20
Figure 4. Model-based aortic isthmus waveforms of the single parametric analyses of 21
vasculature changes. Model-based flow waveforms in the aortic isthmus resulting from 22

20
the single parametric analysis on (a) the variation of pulmonary vasculature compliance and 1
(b) the variation of lungs resistance. Both aortic and pulmonary artery blood flows were 2
kept exactly equal. The dashed line indicates a flow of 0 ml/s. 3
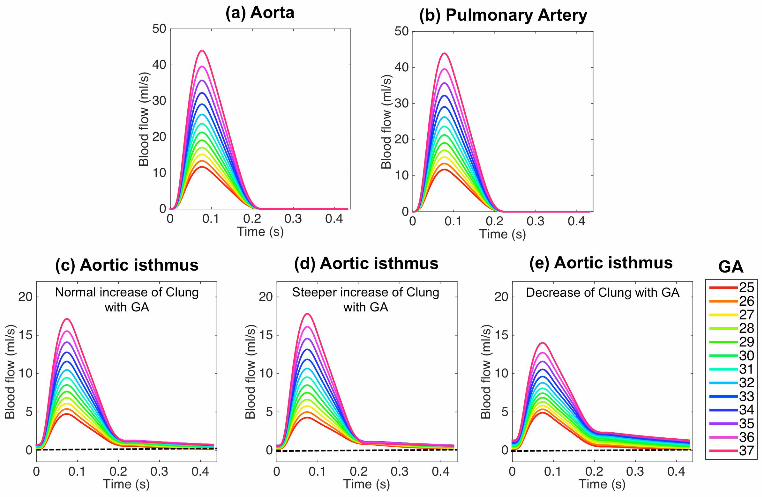
Figure 5. Model-based waveforms of the simulation of the advance of gestation 4
without considering changes throughout gestation of the timing variables of both 5
pulmonary and aortic flows. (a) Aortic and (b) pulmonary artery blood flows constructed 6
for each gestational age with fixed timing parameters (not considering the changes 7
throughout gestation of the timing variables of both pulmonary and aortic flows) and 8
relative amount of flow of 1.0 (c)-(e) Model-based flow waveforms in the aortic isthmus 9
obtained for each simulated gestational age using (c) normal (d) steeper and (e) decreasing 10
scaling function for the lungs compliance. The dashed line indicates a flow of 0 ml/s. GA 11
denotes gestational age. 12
Figure 6. Model-based waveforms of the simulation of the advance of gestation 13
considering changes throughout gestation of the timing variables of both pulmonary 14
and aortic flows (a) Aortic and (b) pulmonary artery blood flows constructed for each 15
gestational age with different timing (considering the changes throughout gestation of the 16
timing variables of both pulmonary and aortic flows) and relative amount of flow between 17
both flow functions. (c) Model-based flow waveforms in the aortic isthmus obtained for 18
each simulated gestational age. The dashed line indicates a flow of 0 ml/s. GA denotes 19
gestational age. 20
21
Appendix A: Validation of the lumped model for assessing the AoI flow profile 1
A.1 Study individuals 2
Both fetuses underwent an ultrasound examination during the third trimester of gestation 3
using a Siemens Sonoline Antares machine (Siemens Medical Systems, Malvern, PA, 4
USA) which included estimation of fetal weight and umbilical artery (UA), middle cerebral 5
artery (MCA), AoI, aorta and pulmonary artery Doppler waveforms. The UA pulsatility 6
index (PI) was evaluated in a free loop of the umbilical cord. PI was calculated as: systolic 7
velocity minus diastolic velocity divided by time-averaged maximum velocity. The MCA 8
was evaluated in a transverse view of the fetal skull at the level of its origin from the circle 9
of Willis [22]. The cerebroplacental ratio was calculated by dividing MCA and UA PI [23]. 10
AoI flow velocity was obtained either in a sagittal view of the fetal thorax with a clear 11
visualization of the aortic arch or in a cross section of the fetal thorax at the level of the 3-12
vessel and trachea view [7]. The AoI flow velocity was quantified by measuring the AoI PI 13
and flow index (IFI). The IFI was calculated as: (systolic + diastolic)/systolic velocity 14
integrals. The aortic waveform was obtained from an apical or basal 5-chamber view of the 15
heart, and the pulmonary artery waveform was obtained from a right ventricular outflow 16
tract view. Peak systolic velocity, ejection time and heart rate were measured from both 17
aortic and pulmonary artery flows. The diameters of the aortic and pulmonary valves were 18
measured in frozen real-time images during systole by the leading-edge-to-edge method 19
[24]. The relative cardiac output (CO) was computed as the ratio between right (RCO) and 20
left (LCO) CO. The angle of insonation was kept as close as possible to 0º and always 21
below 30º. Upon delivery, gestational age, birth weight, birth weight centile, mode of 22

22
delivery, Apgar scores, presence of preeclampsia and length of stay at the neonatal 1
intensive care unit were recorded. 2
A.2 Patient-specific fitting 3
Patient-specific blood velocity waveforms from aorta, pulmonary artery, AoI and MCA 4
were obtained by manual delineation of the envelope of the Doppler blood velocity traces 5
(VM) of the two normal fetuses using a custom graphical user interface (GUI) implemented 6
in MATLAB (2013b, The MathWorks Inc., Natick, MA). The flow rates (QAo, QpA, QAoI 7
and QMCA; pA denotes pulmonary artery and Ao aorta) could be obtained from VM taking 8
into account the hemodynamics conditions and the shape of the velocity profile. Details on 9
obtaining the flow waveforms from the Doppler recordings are explained in the section S.1 10
of the supplementary methods. 11
The lumped model was personalized to the normal fetuses. To do this, the specific 12
blood flows functions QAo and QpA obtained from the measured aortic and pulmonary artery 13
flows for each fetus were used as inputs of the model. The gestational age and the fetal 14
estimated weight were used to compute the values of the different components of the 15
model, as described in our previous work [15]. A set of 12 parameters to be estimated 16
automatically was selected. These were: (1) the delay between the onset of pulmonary and 17
aortic ejections, because this was impossible to accurately measure non-invasively by 18
echocardiography; (2)-(5) the vascular bed resistances: brain, upper body, lungs and lower 19
body & placenta resistances; (6)-(9) the vascular bed compliances: brain, upper body, lungs 20
and lower body & placenta compliances; and the arterial Young’s modulus of the (10) 21
ascending aorta, pulmonary arteries, aortic isthmus and ductus arteriosus, (11) cerebral 22
23
arteries and (12) descending aorta. These 12 parameters were estimated automatically using 1
a constrained nonlinear optimization algorithm minimizing the error between the model-2
based and measured blood velocity waveforms of the AoI (VAoI) and the MCA (VMCA), 3
implemented in MATLAB. Details on the optimization process can be found in the section 4
S.2 of the supplementary methods. 5
A.3 Results of the validation of the lumped model for assessing AoI flow profile. 6
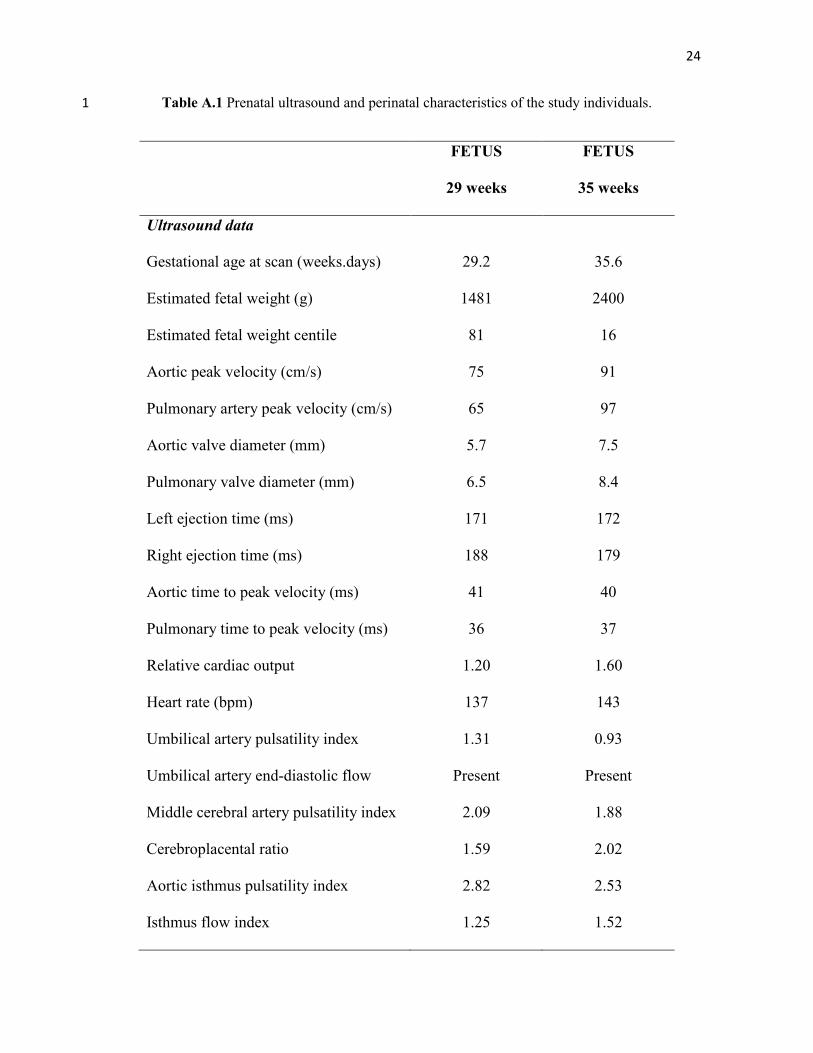
Ultrasound and perinatal data of the two normal fetuses used for the model validation are 7
shown in Table A.1. In both fetuses, the ET of the right ventricle was longer than that in the 8
left ventricle. In addition, the aortic TPV was longer than in the pulmonary artery. In both 9
cases, the lumped model was able to reproduce the measured blood velocity waveforms in 10
the AoI and MCA, as shown in Figure A.1. The AoI blood velocity waveform of the fetus 11
of 29 weeks of gestation showed a small (non-reversing) notch at the end of systole. 12
However, a remarked peak of reversal flow at the end of systole can be observed in the AoI 13
blood velocity waveform of the fetus of 35 weeks of gestation. This phenomenon was 14
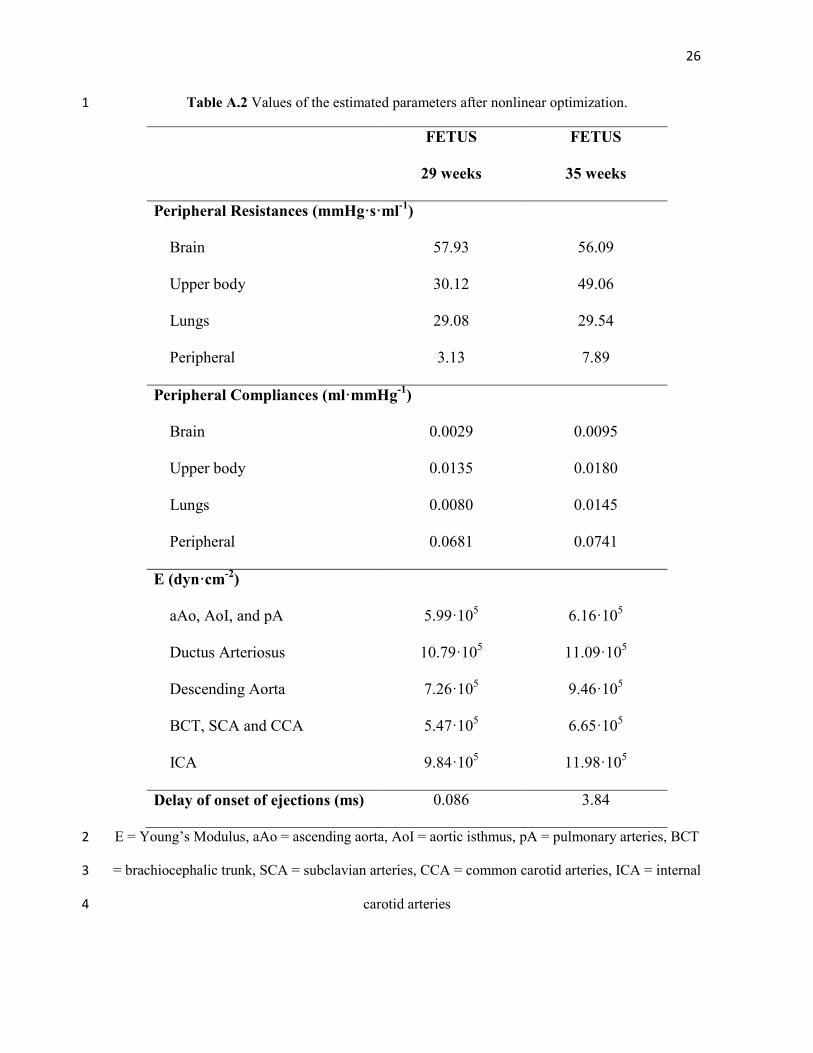
successfully reproduced by our lumped model. The estimated parameters after the nonlinear 15
optimization are shown in Table A.2. The estimated delay in the onset of ejection between 16
pulmonary artery and aorta blood flows was larger in the fetus with end-systolic peak of 17
reversal flow (3.8 ms) compared to the fetus showing only a small (non-reversing) notch in 18
the AoI waveform at the end of systole (0.1 ms). 19
20
21
22
24
Table A.1 Prenatal ultrasound and perinatal characteristics of the study individuals. 1
FETUS
29 weeks
FETUS
35 weeks
Ultrasound data
Gestational age at scan (weeks.days) 29.2 35.6
Estimated fetal weight (g) 1481 2400
Estimated fetal weight centile 81 16
Aortic peak velocity (cm/s) 75 91
Pulmonary artery peak velocity (cm/s) 65 97
Aortic valve diameter (mm) 5.7 7.5
Pulmonary valve diameter (mm) 6.5 8.4
Left ejection time (ms) 171 172
Right ejection time (ms) 188 179
Aortic time to peak velocity (ms) 41 40
Pulmonary time to peak velocity (ms) 36 37
Relative cardiac output 1.20 1.60
Heart rate (bpm) 137 143
Umbilical artery pulsatility index 1.31 0.93
Umbilical artery end-diastolic flow Present Present
Middle cerebral artery pulsatility index 2.09 1.88
Cerebroplacental ratio 1.59 2.02
Aortic isthmus pulsatility index 2.82 2.53
Isthmus flow index 1.25 1.52

25
Perinatal outcome
Gestational age at delivery
(weeks.days)
40.0 40.0
Birth weight (g) 3350 2990
Birth weight centile 52 15
Gender Male Male
Cesarean section No No
5-minute Apgar score 10 10
Umbilical artery pH 7.27 7.12
Preeclampsia No No
Days in neonatal intensive care unit 0 0
1
2
26
Table A.2 Values of the estimated parameters after nonlinear optimization. 1
FETUS
29 weeks
FETUS
35 weeks
Peripheral Resistances (mmHg·s·ml-1
)
Brain 57.93 56.09
Upper body 30.12 49.06
Lungs 29.08 29.54
Peripheral 3.13 7.89
Peripheral Compliances (ml·mmHg-1
)
Brain 0.0029 0.0095
Upper body 0.0135 0.0180
Lungs 0.0080 0.0145
Peripheral 0.0681 0.0741
E (dyn·cm-2
)
aAo, AoI, and pA 5.99·105 6.16·10
5
Ductus Arteriosus 10.79·105 11.09·10
5
Descending Aorta 7.26·105 9.46·10
5
BCT, SCA and CCA 5.47·105 6.65·10
5
ICA 9.84·105 11.98·10
5
Delay of onset of ejections (ms) 0.086 3.84
E = Young’s Modulus, aAo = ascending aorta, AoI = aortic isthmus, pA = pulmonary arteries, BCT 2
= brachiocephalic trunk, SCA = subclavian arteries, CCA = common carotid arteries, ICA = internal 3
carotid arteries 4

27
SUPPLEMENTARY METHODS 1
S.1 Obtaining blood flow waveforms from Doppler recordings 2
Patient-specific blood velocity waveforms were obtained by manual delineation of the 3
envelope of Doppler velocity traces (VM). The flow rates (Q) could be obtained from VM 4
taking into account the hemodynamic conditions and the shape of the velocity profile 5
(parabolic or flat) represented by the Womersley number (W). The Womersley number is a 6
dimensionless parameter calculated as: 7
fπ
W=D2η
(S1) 8
where D is the vessel diameter, η the blood viscosity and f the frequency given by the 9
heart rate. Flow rates could thus be computed as: 10
( )22= ⋅ ⋅ ⋅MQ V D / kπ (S2) 11
where k depends on the Womersley number and was calculated as described by Ponzini et 12
al [25]. In the case of the aortic (QAo) and pulmonary (QpA) flows, k was considered 1.0. 13
S.2 Patient-specific fitting 14
A constrained nonlinear optimization algorithm minimizing the normalized root mean 15
square error (NRMSE) between the model-based (denoted by ~) and measured blood 16
velocity waveforms of the AoI (VAoI) and MCA (VMCA), was implemented in MATLAB to 17
automatically estimate the patient-specific set of parameters. To ensure that the model 18
estimates correctly both systolic and diastolic values of the blood velocity waveforms, the 19
relative error between model-based and measured systolic and diastolic values of each 20

28
blood velocity profile was also minimized. Therefore, an objective function J was defined 1
as the sum of individual relative errors as: 2
2
1
1
=
=
− − − = + + −
∑∑
N ~~ ~
i ii sys i syst i dias i dias
i AoI ,MCA i i i sys i dias
V ( t ) V ( t )V ( t ) V ( t )N V ( t ) V ( t )
Jmax(V ( t )) min(V ( t )) V ( t ) V ( t )
(S3) 3
where i indicates one of the two locations of the fetal circulation were blood velocity were 4
measured: AoI or MCA; N is the number of time points and tsys and tdias are the systolic and 5
diastolic time points respectively. Model-based blood velocity waveforms were computed 6
from the model-based blood flow waveforms using the equation S2. Therefore, the 7
estimation problem consisted on searching the parameters set which minimizes J (equation 8
S3). The minimization algorithm was performed iteratively until the objective function J 9
reached a predefined minimum. The initial parameter set was chosen randomly within a 10
physiological range. Finally, to avoid local minimum solutions, we repeated the procedure 11
several times with different initial parameter sets, and we finally chose the parameter set 12
with a minimum value of J. 13
S.3 Aortic and pulmonary artery blood flows definition 14
Blood velocity profiles of the right and left ventricular outflows show different shapes. The 15
left ventricular outflow velocity profile is characterized by a rapid rise of velocity and a 16
slower and homogeneous decrease during systole (Figure S1a). However, the blood 17
velocity profile of the right ventricular outflow has a faster rise of velocity compared to the 18
left, with smaller systolic peak velocity followed by two well differentiated phases of 19
deceleration of the velocity, the first one slower than the second (Figure S1c). Both velocity 20

29
profiles could be described with five characteristic time points, as shown in Figure S1b and 1
2d. The first point (p1 = (t1,v1)) indicates the initiation of the ejection, and usually is set to 2
p1=(0,0). The second one (p2= (t2,v2)) represents the peak systolic velocity and the time to 3
peak velocity (TPV) or acceleration time; the third one (p3 = (t3,v3)) corresponds to the end 4
of the first deceleration of velocity phase; the fourth one (p4 = (t4,v4)) indicates the end of 5
the ejection and finally, the fifth point (p5 = (t5,v5)) is determined by the heart rate. Then, 6
left (VL(t)) and right (VR(t)) velocity functions could be defined as a set of four straight 7
lines built from the 5 points described above (t1…5,v1…5) as follows: 8
1 21 1
2 32 2i
3 43 3
4 5
t t ta t b
t t ta t bV (t)
t t ta t b
t t t0
< <+ < <+
= < <+
< <
(S4) 9
where i denotes R or L for the left and right ventricular outflows, respectively. The 10
difference between right and left time point t1 defines the difference in the onset of ejections 11
and therefore is related to the difference in the pre-ejection periods (PEP); t2-t1 corresponds 12
to the TPV, t4-t1 to the ET, t3-t2 is the duration of the slow deceleration of ejection and t5-t1 13
is determined by the waveform period calculated from the heart rate (HR) as: T = 60/HR, 14
where HR can be estimated according to the gestational age as follows [18]: 15
HR(bpm) 0.67 GA 162= ⋅ + (S5) 16
TPV was calculated for both aortic (Ao) and pulmonary artery (pA) blood velocities using 17
the following relationships estimated from DeVore [26]: 18
AoTPV (ms) 0.31 GA 36.25= ⋅ + (S6) 19
30
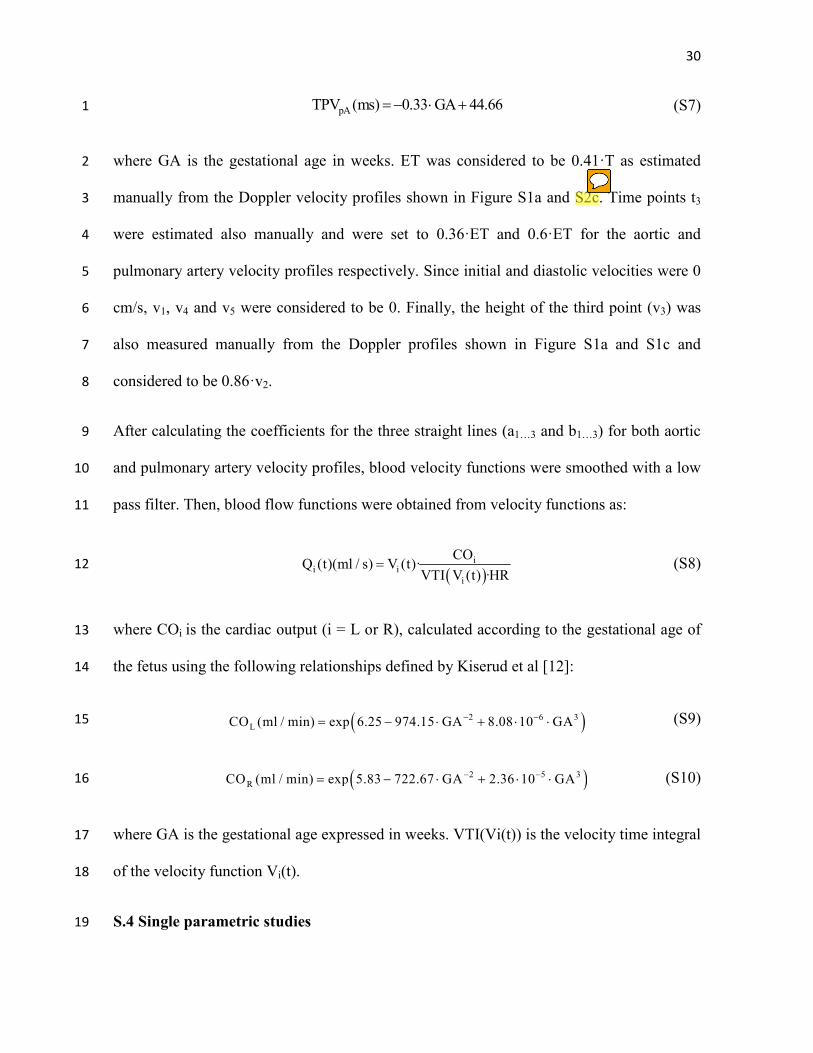
pATPV (ms) 0.33 GA 44.66=− ⋅ + (S7) 1
where GA is the gestational age in weeks. ET was considered to be 0.41·T as estimated 2
manually from the Doppler velocity profiles shown in Figure S1a and S2c. Time points t3 3
were estimated also manually and were set to 0.36·ET and 0.6·ET for the aortic and 4
pulmonary artery velocity profiles respectively. Since initial and diastolic velocities were 0 5
cm/s, v1, v4 and v5 were considered to be 0. Finally, the height of the third point (v3) was 6
also measured manually from the Doppler profiles shown in Figure S1a and S1c and 7
considered to be 0.86·v2. 8
After calculating the coefficients for the three straight lines (a1…3 and b1…3) for both aortic 9
and pulmonary artery velocity profiles, blood velocity functions were smoothed with a low 10
pass filter. Then, blood flow functions were obtained from velocity functions as: 11
( )
ii i
i
COQ (t)(ml / s) V (t)·
VTI V (t) ·HR= (S8) 12
where COi is the cardiac output (i = L or R), calculated according to the gestational age of 13
the fetus using the following relationships defined by Kiserud et al [12]: 14
( )2 6 3LCO (ml / min) exp 6.25 974.15 GA 8.08 10 GA− −= − ⋅ + ⋅ ⋅ (S9) 15
( )2 5 3RCO (ml / min) exp 5.83 722.67 GA 2.36 10 GA− −= − ⋅ + ⋅ ⋅ (S10) 16
where GA is the gestational age expressed in weeks. VTI(Vi(t)) is the velocity time integral 17
of the velocity function Vi(t). 18
S.4 Single parametric studies 19
31
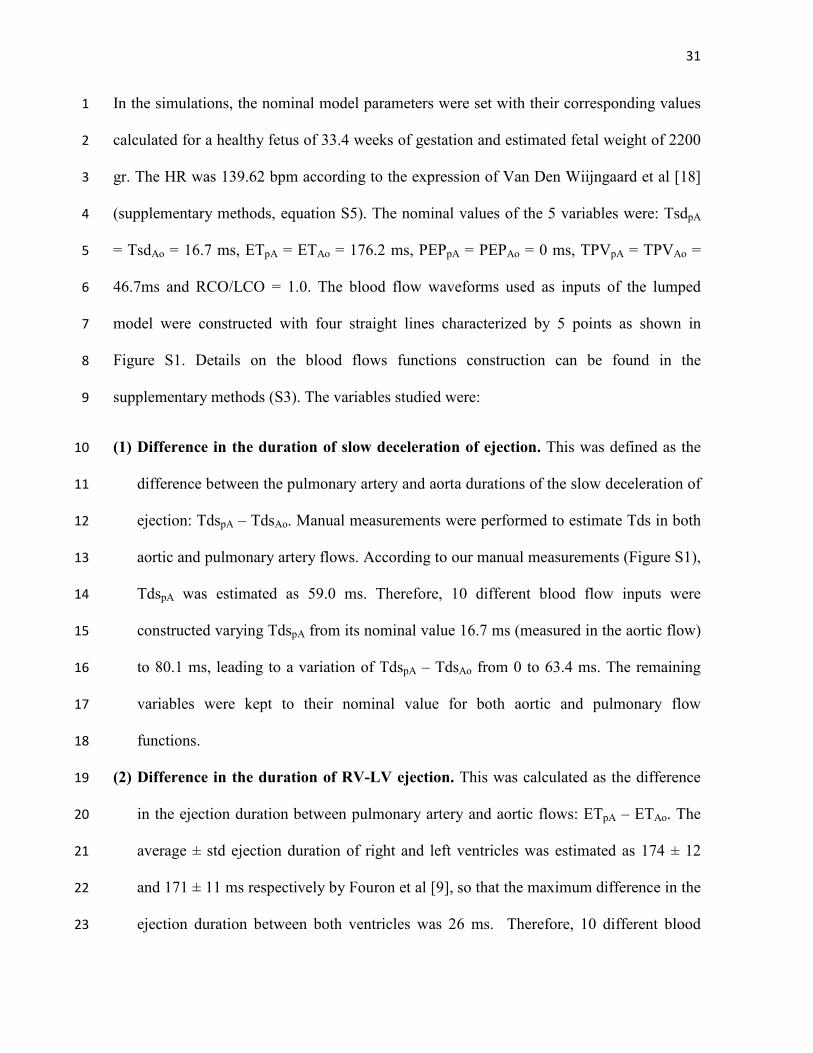
In the simulations, the nominal model parameters were set with their corresponding values 1
calculated for a healthy fetus of 33.4 weeks of gestation and estimated fetal weight of 2200 2
gr. The HR was 139.62 bpm according to the expression of Van Den Wiijngaard et al [18] 3
(supplementary methods, equation S5). The nominal values of the 5 variables were: TsdpA 4
= TsdAo = 16.7 ms, ETpA = ETAo = 176.2 ms, PEPpA = PEPAo = 0 ms, TPVpA = TPVAo = 5
46.7ms and RCO/LCO = 1.0. The blood flow waveforms used as inputs of the lumped 6
model were constructed with four straight lines characterized by 5 points as shown in 7
Figure S1. Details on the blood flows functions construction can be found in the 8
supplementary methods (S3). The variables studied were: 9
(1) Difference in the duration of slow deceleration of ejection. This was defined as the 10
difference between the pulmonary artery and aorta durations of the slow deceleration of 11
ejection: TdspA – TdsAo. Manual measurements were performed to estimate Tds in both 12
aortic and pulmonary artery flows. According to our manual measurements (Figure S1), 13
TdspA was estimated as 59.0 ms. Therefore, 10 different blood flow inputs were 14
constructed varying TdspA from its nominal value 16.7 ms (measured in the aortic flow) 15
to 80.1 ms, leading to a variation of TdspA – TdsAo from 0 to 63.4 ms. The remaining 16
variables were kept to their nominal value for both aortic and pulmonary flow 17
functions. 18
(2) Difference in the duration of RV-LV ejection. This was calculated as the difference 19
in the ejection duration between pulmonary artery and aortic flows: ETpA – ETAo. The 20
average ± std ejection duration of right and left ventricles was estimated as 174 ± 12 21
and 171 ± 11 ms respectively by Fouron et al [9], so that the maximum difference in the 22
ejection duration between both ventricles was 26 ms. Therefore, 10 different blood 23

32
flow inputs were constructed varying the ETpA from 176.2 ms to 206.2 ms, leading to a 1
variation of ETpA – ETAo from 0 to 30 ms. The remaining variables were kept to their 2
nominal value for both aortic and pulmonary flow functions. 3
(3) Delay in the onset of RV-LV ejection. This was calculated as the difference in the 4
initiation of the ejection between pulmonary artery and aortic blood flows: PEPpA – 5
PEPAo. The average value of the PEP of right and left ventricles reported by Acharya et 6
al. was 57 and 48 ms respectively [4,8], or a difference of 9 ms between right and left. 7
Therefore, 10 different blood flow inputs were constructed varying PEPpA – PEPAo from 8
0 to 10 ms. The remaining variables were kept to their nominal value for both aortic and 9
pulmonary flow functions. 10
(4) Difference between time-to-peak RV-LV velocities: This was calculated as the 11
difference between pulmonary artery and aorta time to peak velocities: TPVpA - TPVAo. 12
Machado et al [10] documented that, between 16 and 30 weeks, the TPV was 13
significantly shorter in the pulmonary artery than in the aorta (32.1ms vs. 43.7ms), 14
while Sutton et al [11] have confirmed these findings, and reported a mean TPV of 15
39.4ms and 44.6ms respectively in fetuses from 20 to 42 weeks of gestation. Therefore, 16
10 different blood flow inputs were constructed in which TPVAo remained unchanged 17
and equal to its nominal value, and the TPVpA was varied to obtain a variation of 18
TPVpA-TPVAo from -12 to 0 ms. The remaining variables were kept to their nominal 19
value for both aortic and pulmonary flow functions. 20
(5) Relative CO. 10 different blood flow inputs were constructed in which RCO/LCO was 21
varied from 1.0 to 1.5, without changing the total CO. The remaining variables were 22
kept to their nominal value for both aortic and pulmonary flow functions. 23

33
(6) Pulmonary vasculature compliance. 10 different scale factors were defined from 0.5 1
to 2.0. Main, right and left pulmonary arteries and lung compliances were scaled 2
according to the defined scale factors. The rest of vascular parameters and the timing 3
variables for both aortic and pulmonary flow functions were kept to their nominal 4
value. 5
(7) Lung resistance. 10 different scale factors were defined from 0.5 to 2.0. Lung 6
resistances were scaled according to the defined scale factors. The rest of vascular 7
parameters and the timing variables for both aortic and pulmonary flow functions were 8
kept to their nominal value. 9
S.5 Multi parametric analysis 10
Similarly to the single parametric studies, the 5 selected variables: (1) TdspA – TdsAo, (2) 11
ETpA – ETAo, (3) PEPpA – PEPAo, (4) TPVpA – TPVAo and (5) RCO/LCO ratio were varied 12
between the same ranges of values as in the single parametric studies. However, to decrease 13
the computational cost, 5 different values for each variable within the defined range were 14
considered instead of 10, as was done before. 15
The model-based AoI flow waveforms obtained in each simulation were quantified 16
by first detecting the presence or not of the end-systolic notch. Then, if the notch was 17
present, the magnitude of the end-systolic notch (or brief: end-systolic peak of reversal 18
flow) was obtained. Also the difference of flow between aortic and pulmonary flows was 19
computed, and the integral (the amount) of the blood flow during the deceleration of 20
ejection was obtained. The correlation between this amount of differential flow and the 21
end-systolic notch in the AoI flow was computed. 22

34
A linear regression model was constructed to evaluate the relationship between the AoI 1
end-systolic notch and the 5 variables. The regression equation was: 2
5
0
1
i i
i
Y X=
= + +∑β β ε (S11) 3
where the dependent variable Y represents the AoI end-systolic notch magnitude and the 4
independent variables Xi correspond the 5 variables under study, calculated as X1 = TdspA – 5
TdsAo, X2 = ETpA – ETAo, X3 = PEPpA – PEPAo, X4 = TPVpA – TPVAo and X5 = RCO/LCO. 6
S.6 Simulating the advance of gestation 7
The relationship between the appearance of the end-systolic notch in the AoI flow and the 8
gestational age was also evaluated. Firstly, the influence on the AoI flow waveform of the 9
change in total cardiac output, as well as growing fetal vasculature with gestational age was 10
evaluated separately from any differential change in LV and RV outflow. To do this, we 11
considered both aortic and pulmonary flow profiles equal and without changing any of the 12
flow functions’ variables with the gestational age, only the total amount of ejected blood 13
for each gestational age as well as the properties and size of the vasculature was varied. 14
Then, in order to evaluate if the scaling function used to describe the variation on the lung 15
compliance throughout the gestation may affect the appearance of the end-systolic notch in 16
the AoI waveform, two modifications of the function were done: (1) a steeper (but still 17
increasing with gestational age) and (2) a decreasing with gestational (inverse) functions. 18
Next, the differential changes in RV-LV output were added by constructing the specific 19
blood flow inputs considering the expected values for the aortic and pulmonary flows 20
(equations S9 and S10), aortic and pulmonary TPV (equations S6 and S7), and heart rate 21

35
(equations S5) for each gestational age. As described in previous sections, the pulmonary 1
artery velocity function was characterized by two differentiated relaxation periods, so we 2
considered this difference in the simulations. However, we did not find any data about the 3
relationship between PEP, ET and the gestational age, so we kept ETpA and ETAo equals to 4
0.41*T (where T was 60/HR), and did not consider any delay in the onset of ejection 5
between both ventricles, so PEPpA - PEPAo = 0 ms. The gestational age was varied from 25 6
to 37 weeks. In each simulation, the components of the lumped model were set with their 7
adequate values calculated according to the gestational age and the normal fetal weight 8
(W0) for each gestational age. W0 was estimated as log10(W0) = 0.2508 + 0.1458*GA -9
0.0016*GA2 [27], where GA is the gestational age in weeks. 10
11
12

36
FIGURE LEGENDS 1
Figure S1. Characterization of the aorta and pulmonary artery velocity profiles. 2
Doppler velocity waveforms from the (a) aortic and (c) pulmonary artery blood flows from 3
a healthy fetus of 33.4 weeks of gestation. (b) And (d) characterization of the velocity 4
profiles with 5 points (ti, vi) and 4 straight lines used to construct the custom velocity 5
profiles from the aortic and pulmonary artery flows. ti denotes the temporal points and vi 6
the velocity at each temporal point ti. 7