1 updated information 6 interim management 27 …
TRANSCRIPT

20
20
J A NUA RY – M A RCH 2020
Interim Report

1 U PDATED I N FORMATION 6 I NTERIM M ANAGEMENT REPORT
23 BRAN DS AN D BUSI N ESS FI ELDS
27 I NTERIM CONSOLI DATED FI NANCIAL STATEMENTS (CON DENSED)
1 Key Facts
2 Key Events 6 Volkswagen Shares
7 Business Development 16 Results of Operations, Finan- cial Position and Net Assets 22 Outlook
27 Income Statement 28 Statement of Comprehensive Income 29 Balance Sheet 30 Statement of Changes in Equity 32 Cash Flow Statement 33 Notes to the Interim Consolidated Financial Statements 52 Review Report
This version of the Interim Report is a translation of the German original. The German takes precedence. All figures shown in the Report are rounded, so minor discrepancies may arise from addition of these amounts. The figures from the previous fiscal year are shown in parentheses directly after the figures for the current reporting period. Specified vehicle ranges correspond to results obtained through the Worldwide Harmonized Light vehicles Test Procedure (WLTP) on the chassis dynamometer. WLTP value ranges for series-produced vehicles may vary depending on the equipment. The actual range will deviate in practice depending on various other factors.
VO L K SWA G E N G R O U P
Q1
2020 2019 %
Volume Data1 in thousands
Deliveries to customers (units) 2,006 2,606 –23.0
Vehicle sales (units) 1,937 2,583 –25.0
Production (units) 1,997 2,655 –24.8
Employees (on March 31, 2020/Dec. 31, 2019) 670.0 671.2 –0.2
Financial Data (IFRSs), € million
Sales revenue 55,054 60,012 –8.3
Operating result before special items 904 4,849 –81.4
Operating return on sales before special items (%) 1.6 8.1
Special items – –981 x
Operating result 904 3,868 –76.6
Operating return on sales (%) 1.6 6.4
Earnings before tax 682 4,071 –83.3
Return on sales before tax (%) 1.2 6.8
Earnings after tax 517 3,053 –83.1
Automotive Division2
Total research and development costs 3,563 3,483 +2.3
R&D ratio (%) 8.0 6.9
Cash flows from operating activities 1,546 5,364 –71.2
Cash flows from investing activities attributable to operating activities3 4,064 3,375 +20.4
of which: capex 2,087 2,008 +4.0
capex/sales revenue (%) 4.7 4.0
Net cash flow –2,518 1,990 x
Net liquidity at March 31 17,787 15,991 +11.2
1 Volume data including the unconsolidated Chinese joint ventures. These companies are accounted for using the equity method. Prior-year deliveries have been updated to reflect subsequent statistical trends.
2 Including allocation of consolidation adjustments between the Automotive and Financial Services divisions. 3 Excluding acquisition and disposal of equity investments: Q1 €3,553 (3,100) million.
Key Figures

Updated Information 1Key Facts
> Volkswagen Group’s business sustains a substantial blow from Covid-19 pandemic in first quarter of 2020
> Deliveries to Volkswagen Group customers 23.0% down on previous year at 2.0 (2.6) million vehicles; declines especially in Asia-Pacific and Europe
> Group sales revenue decreases by 8.3% to €55.1 billion
> Operating profit of €0.9 billion down €3.0 billion on prior-year figure including special items; demand-related fall in volumes, fair value measurement of commodity hedges and exchange-rate effects have a negative impact
> Profit before tax decreases to €0.7 (4.1) billion
> Automotive Division’s net cash flow down €4.5 billion on prior-year period to €–2.5 billion; capex ratio of 4.7 (4.0)%
> Net liquidity in the Automotive Division at €17.8 billion
> Exciting products:
- Volkswagen Passenger Cars shows off its ID.4, the second model based on the Modular Electric Drive Toolkit; GTI, GTE and GTD models expand the Golf range
- Fourth generation of the successful A3 Sportback launches at Audi - ŠKODA introduces the Octavia RS iV with plug-in hybrid drive - SEAT presents new Leon; CUPRA shows off its first standalone model, the Formentor - Bentley unveils the Bacalar, its most exclusive bespoke model yet - Porsche adds top-of-the-range 911 Turbo S to its 911 series - Volkswagen Commercial Vehicles impresses with new Caddy
Key Facts

Key Events 2 Updated Information
G L O B A L S P R E A D O F C O R O N A V I R U S ( S A R S - C O V - 2 )
At the end of December 2019, initial cases of a new, some-times fatal lung disease emerged in Wuhan, in the Chinese province of Hubei. This disease is attributable to a novel coronavirus. Infections also began to appear outside China from mid-January 2020. In Europe, the number of people infected rose continuously in February, and especially in March and April 2020. The countries particularly badly affected include Italy, Spain, France, Austria, Germany and the UK. Rising numbers of infections have also been registered in North and South America. In order to slow the spread of the SARS-CoV-2 virus and stem the resulting Covid-19 pandemic, governments around the world have introduced measures such as lockdowns during the course of 2020, resulting in an enormous disruption to everyday life and economic activity. N E W G R O U P M O D E L S P R E S E N T E D
Following the cancellation of the Geneva International Motor Show due to the spread of coronavirus, the Volkswagen Group brands primarily used online presentations to introduce their new vehicles and technologies.
The Volkswagen Passenger Cars brand held a webcast that provided a detailed outlook on its first all-electric SUV: the new ID.4 is the second model based on the Modular Electric Drive Toolkit (MEB) and is to enter production in 2020. Like the ID.3, the ID.4 will be launched on the market in Europe as a carbon-neutral vehicle. Its aerodynamic design reduces wind resistance and expands the range to up to 500 km, depending on the drive variant. Situated deep in the floor of the chassis, its high-voltage battery ensures a low center of gravity, optimizing driving dynamics and providing excel-lently balanced weight distribution. Like all MEB-based models, the ID.4 boasts a spacious interior thanks to its com-pact powertrain technology. The cockpit has a clear structure and is digitalized throughout: the vehicle is operated largely via touch surfaces and intelligent, intuitive voice control. The ID.4 will be launched as a rear-wheel-drive vehicle, with an electric all-wheel drive version to follow later. The company plans to produce and sell the model in Europe, China and the USA.
In addition to the ID.4, the webcast also showcased the new Touareg R with hybrid drive: the efficient plug-in hybrid system has now found its way into the brand’s top model. The combination of a 100 kW (136 PS) electric motor and a
250 kW (340 PS) V6 turbocharged petrol engine generates a power output of 340 kW (462 PS). The Touareg R’s battery capac-ity is designed to enable the average commuter to complete their daily journey to and from work with zero emissions. The vehicle can reach up to 140 km/h in pure electric mode.
The webcast concluded with the sporty GT versions of the new Golf. The new Golf GTE has a plug-in hybrid drive com-prising an 85 kW (115 PS) electric motor and a 110 kW (150 PS) four-cylinder turbocharged petrol engine with a combined power output of 180 kW (245 PS). Compared to the predecessor model, the vehicle's range in pure electric mode has increased to around 60 km. This extra range is achieved thanks to a 50% increase in the battery's energy content, which now amounts to 13 kWh. In pure electric mode, the Golf GTE can be driven at up to 130 km/h. The new Golf GTD impresses with a 147 kW (200 PS) four-cylinder TDI power-train. Like all new Golf turbodiesels, the Golf GTD has two downstream SCR catalytic converters. This new twin-dosing SCR system with dual AdBlue injection markedly reduces nitrogen oxide emissions compared with its predecessor. Volkswagen has been reinventing its iconic sporty compact car, the Golf GTI, for 44 years now. The eighth generation has been redesigned, consistently digitalized and connected. The GTI is powered by a 180 kW (245 PS) turbocharged direct injection engine. The four-cylinder powerplant is connected to a manual six-speed gearbox as standard. An optional seven-speed dual-clutch gearbox is also available.
Audi turned in the reporting period to the Internet to present the fourth generation of its successful A3 Sportback – sporty, digitalized and fully connected. In addition to its progressive exterior with sporty lines and matrix LED head-lights, the compact five-door vehicle impresses with a host of premium-segment innovations. The cockpit features a 10.1-inch touch display as standard, centrally mounted in the instrument cluster. This offers handwriting recognition, acoustic feedback and voice control. Behind the MMI control interface lies the third-generation Modular Infotainment Tool-kit. With ten times the computing power of its predecessor, this can perform all tasks related to vehicle connectivity with LTE Advanced speed, including phone calls and Audi connect services. It also integrates a Wi-Fi hotspot into the vehicle. Driver assistance systems such as Audi pre sense front and collision avoidance assist improve safety. Side assist, exit warning, cross traffic assist and park assist are optionally
Key Events

Updated Information 3Key Events
available. The adaptive driving assistant familiar from many premium-segment models boosts longitudinal and lateral control. The A3 Sportback will launch with a 1.5 TFSI engine generating 110 kW (150 PS) and a 2.0 TDI engine putting out 85 kW (116 PS) or 110 kW (150 PS).
ŠKODA exhibited its VISION IN concept vehicle at the Auto Expo in New Delhi in February 2020. The compact SUV offers a glimpse of the first locally developed model based on the Modular Transverse Toolkit (MQB). In early March, ŠKODA used an online presentation to unveil the first model in its RS family with plug-in hybrid drive: the new ŠKODA Octavia RS iV features a 110 kW (150 PS) 1.4 TSI petrol engine and an 85 kW (115 PS) electric motor, generating a combined power output of 180 kW (245 PS). With black detailing on the bodywork, the Octavia RS iV is instantly recognizable as the sporty top-of-the range model in the Octavia family. The fourth generation of ŠKODA’s best-selling Octavia is longer and wider than its predecessor, with a larger luggage com-partment, innovative connectivity functions, new assistance systems and a more exciting appearance thanks to the new ŠKODA design language. The Octavia iV has a plug-in hybrid drive with a combined power output of 150 kW (204 PS). The vehicle is available in the Ambition and Style trims.
SEAT showed off the fourth generation of its popular Leon. This impresses with a striking design, clear lines, harmo-nious proportions and innovative lighting, which includes the rear coast-to-coast light, dynamic indicators and full LED headlamps. LED technology is used in the vehicle’s interior, too: from the distinctive welcome light which illuminates when the doors are unlocked to the wraparound ambient lighting. The wide range of advanced drive concepts make the SEAT Leon even more efficient, with petrol, diesel, CNG, mild hybrid and plug-in hybrid models available. The Leon is SEAT’s first vehicle with complete digital connectivity – from infotainment apps to the Full Link connectivity technology and SEAT Connect technology, which allows the user to access vehicle data. Advanced driver assistance systems such as predictive Adaptive Cruise Control (ACC), Emergency Assist, Travel Assist, blind spot detection and rear cross traffic alert make the new Leon even safer. The enlarged dimensions make this an even more spacious vehicle in both the five-door and Sportstourer versions. At 620 l, the Sportstourer’s boot also now offers more capacity than its predecessor. CUPRA used an online presentation to celebrate the world premiere of its first standalone model: the Formentor. In terms of design and construction, the CUV is a standard-setter, combining elegance and innovation with a dynamic driving experience. The two-tone body is reminiscent of a robust all-terrain vehicle, while the sleek silhouette is styled on a coupé. The Formentor’s dimensions exemplify this blend of concepts and offer a generous feeling of space
with ample headroom, despite its coupé-like shape. The rear coast-to-coast light underscores the sporty appearance. Inside, occupants will find full LED ambient lighting, high-end materials featuring copper and brushed dark aluminum, and leather bucket seats. A digital cockpit and 12-inch pano-ramic floating screen operate a range of connectivity and infotainment functions. The Formentor’s driver assistance and safety systems include predictive Adaptive Cruise Control, Emergency Assist, Travel Assist, and Side and Exit Assist. In addition to the Formentor, CUPRA also presented the CUPRA Leon and CUPRA Leon Sportstourer.
In early March, Porsche held an Internet presentation of the new generation of the 911 Turbo S in Coupé and Cabriolet versions. The new range-topping 911 offers unprecedented power, driving dynamics and luxury. It is being launched with a new 3.8 l boxer engine that delivers 478 kW (650 PS) of power, 51 kW (70 PS) more than its predecessor. The 911 Turbo S sprints from 0 to 100 km/h in just 2.7 seconds, while top speed is 330 km/h. New equipment options under-line the sporty image of the all-wheel-drive 911. The larger rear wing has been designed for even more downforce, the Porsche Active Suspension Management (PASM) sports chassis has been lowered by 10 mm and the sports exhaust system with adjustable flaps guarantees a distinctive sound. Muscular rear wing sections with integrated air intakes, LED matrix headlights as standard, and, typical of the Turbo, rectangular twin tailpipes in high-gloss black define the rear view. Inside, there is a high-end, sporty finish featuring a two-tone full leather interior and carbon trim. The backrests of the 18-way adjustable sports seats pay homage to the first 911 Turbo. The center screen of the Porsche Communication Management (PCM) system now measures 10.9 inches and can be operated quickly and without distraction thanks to its new layout. The car also is equipped with a GT sports steering wheel, the Sport Chrono package and a surround sound system ex works.
Bentley unveiled its exclusive and strictly limited Bacalar online in the first quarter of 2020. The two-seater is produced by Bentley Mulliner, a specialist customization company whose roots date back to the 16th century. Just 12 of these distinctive vehicles are being created. Designed, built and handcrafted to customers’ individual wishes, all of the vehi-cles are already taken. The roofless luxury grand tourer, whose design draws upon the spectacular EXP 100 GT con-cept car from the anniversary year 2019, offers open-air motoring with a powerful double-turbocharged W12 TSI engine producing 485 kW (659 PS). Exquisite materials and smart use of technology round off this exclusive vehicle concept.
The Caddy from Volkswagen Commercial Vehicles excels as a transporter, family van, shuttle and camper van with extraordinary versatility. In a world premiere during the

Key Events 4 Updated Information
reporting period, the brand showed off the fifth generation of the allrounder. For the first time, it is based on the MQB. The MQB brings new technologies to the range: innovative assistance systems such as Travel Assist, Trailer Assist and the lane-change assistant boost safety and convenience. The digital cockpit merges with the 6.5–10-inch infotainment system to create a digital landscape of indicators and con-trols. The online connectivity unit (OCU) with integrated eSIM allows the infotainment systems to access mobile online services and functions from Volkswagen We. The striking, completely revamped sporty exterior boasts more dynamic proportions, LED headlights and an optional 1.4m2 panorama roof above the first and second rows of seats. The new twin-dosing SCR system further reduces the environ-mental impact of the Caddy’s TDI engines. AWA R D S
In January 2020, readers of Auto Bild and Computer Bild magazines voted the Volkswagen Group the winner of the "Connected Car Award 2019" in multiple categories. The award is presented annually in eight categories for the best innovations relating to vehicle connectivity. The Volkswagen Passenger Cars brand impressed in the New Mobility category with the car-sharing platform “WeShare”. The service has launched in Berlin and offers customers a fleet consisting entirely of electric vehicles. ŠKODA won in the mid-range category with the Superb and its integrated access to online services. Porsche scored in the premium-segment category with the Taycan and its voice control system. Volkswagen Commercial Vehicles took first place in the camper van category with the T6.1 California and its online infotainment system. SEAT took the “2019 editors’ award” with its sustain-ability concepts and approaches to urban mobility.
In mid-January 2020, the T-Cross from the Volkswagen Passenger Cars brand took the top five-star rating in the small MPV category in the Euro NCAP crash test. The crash test scrutinizes and evaluates safety aspects of the vehicle: occupant protection, child protection, the safety of vulner-able road users such as cyclists and pedestrians and provision of the latest safety systems.
The Volkswagen Group won multiple categories in the “Best Cars 2019” awards from auto motor und sport maga-zine in February 2020. The Volkswagen Passenger Cars brand came first with three models: the up!, Polo and Golf won the city cars, small cars and compact class category. Porsche took the top spot among the sports cars and convertibles with the 911. Audi’s Q3 Sportback surpassed its competitors in the compact SUV and off-road categories. The Multivan from Volkswagen Commercial Vehicles won first place in the vans category. ŠKODA headed up the compact class category for import vehicles with the Octavia. Readers chose their favorites from 387 models in 11 vehicle categories.
Also in February 2020, the ŠKODA brand won the “Smartbest 2019” award at the European Autobest organization’s gala. The award was for its new digital voice-activated assistant “Laura”. The jury crowned Laura as the innovation of the year in the field of in-car interaction between drivers and artificial intelligence systems. The voice-activated assistant is already available in the Scala, Kamiq and Superb iV models and will also feature in the new Octavia.
In March 2020, the Multivan 6.1 from the Volkswagen Commercial Vehicles brand was named classic of the future in the vans category at the “Motor Klassik Award 2020” presented by Motor Klassik magazine. Over 17,000 readers in total took part in the vote, selecting their favorites in 20 categories.
Also in March 2020, Auto Bild magazine and the market research institute Schwacke set out to find the new cars with the lowest expected depreciation in 13 vehicle classes Ger-many-wide. ŠKODA’s Superb received the “Wertmeister 2020” title in the mid-range category. In the premium-segment category, Audi’s A6 was named the premium-segment vehicle with the best value retention in Germany. Porsche scored in two categories: in the luxury category with the Panamera and the sports car category with the 911. The rankings were based on Schwacke’s market research list, which includes some 50,000 different models of passenger car in Germany.
At the end of March 2020, ŠKODA’s new Octavia won the “Red Dot Award” in the product design category. The fourth generation of the bestseller impressed the expert jury with its exciting design, sculptural elements and elegant, dynamic proportions. The “Red Dot Award” is considered to be a seal of high-quality product design and is one of the world’s most famous design competitions. The international expert jury consists of independent designers, design professors and trade journalists.
A N N I V E R S A R I E S
The seven millionth Octavia rolled off the assembly line in February this year at ŠKODA’s main plant in Mladá Boleslav. As the brand’s bestseller, the Octavia has been instrumental in ŠKODA’s transformation since the mid-1990s from a regional leader into an internationally successful automotive manufacturer.
The legendary VW Bus celebrated its 70th birthday in March 2020. Production of the box-shaped model, originally known as the T1, began at the main Wolfsburg plant in 1950. Initially prized as a transporter and tradesman’s van, it later became the vehicle of choice for hippies and a symbol of Flower Power. Today, the sixth generation of the Transporter is used in many different guises, both by companies and private owners. Over 13 million of the multi-talented vehicles have been sold across all model generations.

Updated Information 5Key Events
PA RT N E R S H I P S
In January 2020, the Volkswagen Group and Microsoft Germany agreed to work together on long-term sustainability and social initiatives for the future. The aim is to promote and jointly implement projects in the context of social responsibility issues, such as sustainability, digital education and training, as well as corporate employee commitment to the common good. Both Volkswagen and Microsoft Germany are already committed to these issues within the framework of their respective social responsibilities. Now, the companies want to cooperate on their social commitments in order to generate synergies and create social added value together.
2 0 2 0 A N N UA L G E N E R A L M E E T I N G P O ST P O N E D
The Annual General Meeting of Volkswagen AG for the 2019 fiscal year, scheduled for May 7, 2020, has been postponed. This was due to the spread of coronavirus and the associated restrictions designed to stem the virus, as well as our efforts to protect the health of our shareholders, employees and service providers. The new date and agenda for the Annual General Meeting will be announced in due course depending on how the pandemic progresses. P L A N N E D F U L L A CQ U I S I T I O N O F A U D I S H A R E S
In the context of restructuring competencies and responsi-bilities at the Volkswagen Group, Volkswagen AG plans to increase its shareholding in AUDI AG from approximately 99.64% at present to 100% by way of a squeeze-out under stock corporation law. To this end, Volkswagen AG submitted a formal request to AUDI AG in February 2020 for a transfer of the shares of the minority shareholders. Under this request, the squeeze-out under stock corporation law is to be resolved by the Annual General Meeting of AUDI AG this year.
AUDI AG will continue to be a stock corporation, compati-ble with the capital market, and codetermination rights of employees will be unaffected. Audi will remain an indepen-dent brand within the Group.
P L A N N E D M E R G E R O F M A N S E W I T H T R ATO N S E
In order to simplify the TRATON GROUP’s corporate structure, TRATON SE (TRATON) plans to merge MAN SE (MAN) with TRATON. In connection with this merger, TRATON is planning a squeeze-out under merger law, in which the shares held by MAN’s minority shareholders will be transferred to TRATON in return for an appropriate cash settlement. To this end, TRATON submitted a formal request to MAN in February 2020 for the share transfer and proposed that the companies commence negotiations on a merger agreement. TRATON
currently holds 94.36% of MAN’s capital stock. The amount of the cash settlement has not yet been determined. As a result of the merger, MAN Truck & Bus SE and Scania AB will become wholly owned direct subsidiaries of TRATON SE. F U L L TA K E O V E R O F N AV I STA R P L A N N E D
At the end of January 2020, TRATON SE submitted a proposal for the acquisition of all ordinary shares outstanding in the US truck maker Navistar International Corporation (Navistar) that are not already owned by TRATON, for a price of USD 35.00 per share (a total of approximately USD 2.9 billion) in cash.
TRATON already holds a 16.8% stake in Navistar. The aim of the transaction is to enhance the ability to meet challenges from new regulations and fast-developing technologies in connectivity, propulsion and autonomous driving.
If accepted, TRATON would become the sole owner of Navistar. The proposal is subject, in particular, to the nego-tiation of a merger agreement between TRATON and Navistar, a satisfactory due diligence process and approval of the merger agreement by the boards of TRATON and Volkswagen AG as well as by the Board of Directors and shareholders’ meeting of Navistar.
S E T T L E M E N T I N M O D E L D E C L A R ATO RY P R O C E E D I N G S
On February 28, 2020, Volkswagen AG and Verbraucher-zentrale Bundesverband e.V. (Federation of Consumer Organi-zations) entered into an out of court settlement to terminate the consumer action for model declaratory judgment. Under the terms of the settlement, Volkswagen AG will offer indi-vidual settlements to consumers who registered claims under the action for model declaratory judgment and meet the settlement criteria. The volume of such settlements amounts to €830 million. Verbraucherzentrale Bundesverband e.V. will withdraw the action for model declaratory judgment. Volks-wagen has so far entered into individual settlements with some 200 thousand customers in an aggregate amount of €626 million.
B OA R D O F M A N A G E M E N T M AT T E R S
Effective April 1, 2020, Markus Duesmann was appointed Chairman of the Board of Management of AUDI AG and as a member of the Volkswagen Group Board of Management. He succeeded Abraham Schot, who left the company by mutual agreement effective March 31, 2020. On the Group Board of Management, Mr. Duesmann will especially be responsible for the Premium brand group and for the Group Research and Development division.

Volkswagen Shares 6 Interim Management Report
The Covid-19 pandemic and its severe negative economic implications shaped developments on the international stock markets during the reporting period, resulting in a histori-cally weak first quarter.
The DAX ended the quarter approximately 25% lower than at the end of 2019. After an initially good start to the new financial year with a record high in February, share prices collapsed with the growing spread of the SARS-CoV-2 virus. However, they recovered slightly at the end of the quarter. This recovery was a result of monetary policy support from central banks and packages from governments all around the world designed to stem the economic consequences.
The prices of Volkswagen AG’s preferred and ordinary shares at the end of the first quarter of 2020 were down markedly on year-end 2019. Investors feared a downturn in the global demand for automobiles as a result of the Covid-19 pandemic. In addition, negative effects arose from the auto-motive industry’s current period of transition that requires large-scale investment. Positive impetus came from the incipient economic recovery in China.
Information and explanations on earnings per share can be found in the notes to the interim consolidated financial statements. Additional Volkswagen share data, plus corporate news, reports and presentations can be downloaded from our website at www.volkswagenag.com/en/InvestorRelations.html. VO L K SWA G E N K E Y S H A R E F I G U R E S A N D M A R K E T I N D I C E S
F R O M J A N UA RY 1 TO M A R C H 3 1 , 2 0 2 0
60
70
80
90
100
110
D J F M A M J J A S O N D
Volkswagen ordinary share –29.9%Volkswagen preferred share –39.4%
DAX –25.0%EURO STOXX Automobiles & Parts –37.5%
60
70
80
90
100
110
P R I C E D E V E L O P M E N T F R O M D E C E M B E R 2 0 1 9 T O M A R C H 2 0 2 0Index based on month-end prices: December 31, 2019 = 100
Volkswagen Shares
High Low Closing
Ordinary share Price (€) 183.10 101.50 121.40
Date Jan. 10 Mar. 18 Mar. 31
Preferred share Price (€) 185.52 87.20 106.84
Date Jan. 10 Mar. 18 Mar. 31
DAX Price 13,789 8,442 9,936
Date Feb. 19 Mar. 18 Mar. 31
ESTX Auto & Parts Price 496 255 304
Date Jan. 10 Mar. 18 Mar. 31

Interim Management Report 7Business Development
G E N E R A L E CO N O M I C D E V E LO P M E N T
The global spread of the SARS-CoV-2 coronavirus, the asso-ciated restrictions, and the resulting downturn in demand and supply meant that growth in the world economy was negative in the first quarter of 2020. The average rate of expansion of gross domestic product (GDP) was far below the previous year’s level in both the advanced economies and the emerging markets. At country level, however, performance depended on the extent to which the negative impacts of the global Covid-19 pandemic were already materializing in the reporting period. The governments and central banks of affected countries responded in some cases with substantial fiscal and monetary policy measures. This meant cuts in the already relatively low interest rates. There was a marked fall in prices for energy resources, while other commodity prices remained, on average, relatively stable year-on-year. Curren-cies in some emerging markets depreciated noticeably over the first quarter. Global trade in goods declined further in the reporting period.
As a whole, the economies of Western Europe recorded falling growth from January to March 2020. This trend was seen in nearly all countries in Northern and Southern Europe. The impact of national measures to contain the pandemic, including border closures and spatial/physical distancing, caused deep cuts. In some regions, the measures severely restricted everyday life and also had grave economic conse-quences.
Germany recorded a negative growth rate over the reporting period. The labor market was in a favorable situation at the start of the year, but many companies introduced short-time working throughout the course of the first quarter. Both business and consumer sentiment deteriorated increasingly.
The economies of Central Europe achieved somewhat lower growth rates in the first three months of 2020 compared to the first quarter of the prior year. In Eastern Europe, GDP growth was slightly higher. This was due in particular to the economic development in Russia, the region’s largest econ-omy.
Following a downturn that began in 2018, Turkey’s recovery continued in the reporting period. South Africa’s GDP growth was slightly positive amid persistent structural deficits and political challenges.
Growth in the US economy weakened in the first quarter of 2020. Meanwhile, the US Federal Reserve cut interest rates twice, alongside other measures to support the economy. The weekly number of people filing new claims for unemploy-ment benefits in the second half of March rose by several million. To strengthen the economy in light of the antici-pated negative impact of the Covid-19 pandemic, the US government agreed a rescue package worth approximately USD 2 trillion at the end of March. In Canada, momentum slowed down compared to the same period of 2019, while the Mexican economy stagnated.
Between January and March 2020, economic growth in Brazil kept the same gradual pace it had seen in preceding quarters, although the situation in South America’s largest economy remained tense. The economic downturn in Argentina continued amid high inflation and sharp currency depreciation.
Economic output in China, which was exposed to the negative effects of the Covid-19 pandemic much earlier than other economies, fell in the reporting period. India continued to record a relatively high but declining pace of growth. Japan recorded a negative GDP growth compared to the same period of the previous year due to the adverse impact of the Covid-19 pandemic.
Business Development

Business Development 8 Interim Management Report
T R E N D S I N T H E M A R K E T S F O R PA S S E N G E R C A R S A N D L I G H T CO M M E R C I A L V E H I C L E S
Global demand for passenger cars fell substantially year-on-year from January to March 2020 as a result of the Covid-19 pandemic (–23.3%). The slump affected all sales regions, with above-average losses recorded particularly in the overall markets of Asia-Pacific and Western Europe. There was a com-paratively smaller decline in Central and Eastern Europe, Middle East, Africa and in North and South America.
Global demand for light commercial vehicles decreased substantially from January to March 2020 compared to the prior year.
In Western Europe, demand for passenger cars during the reporting period fell sharply short of the previous year. New vehicle registrations declined at similar levels in all major individual markets. The volume of the passenger car markets in Italy, France, the United Kingdom and Spain fell by around a third in the first three months of 2020. Italy has so far been worst hit by the spread of the SARS-CoV-2 virus, the negative effects of which started to be felt in Western Europe in the last third of the first quarter.
The volume of new registrations of light commercial vehicles in Western Europe dropped substantially below the prior-year figure.
New passenger car registrations in Germany in the first three months of 2020 did not match the high level seen in the equivalent period of the previous year. Demand here decreased by approximately one fifth, a trend amplified by the spread of the SARS-CoV-2 virus and the associated restrictions and prohibitions.
Demand for light commercial vehicles in Germany in the reporting period was markedly lower than in the same period of 2019. In the Central and Eastern Europe region, sales of passenger cars in the reporting period were distinctly below the pre-vious year’s level. Developments in the individual markets were mixed. While declines were registered in the EU coun-tries of Central Europe, the Russian passenger car market was still relatively stable in the reporting period and matched its prior-year figure.
The volume of light commercial vehicles registered in Central and Eastern Europe decreased markedly compared to the previous year, whereby the number of vehicles sold in Russia between January and March 2020 was down moder-ately on the previous year.
Marked catch-up effects were recorded on the passenger car market in Turkey. The volume of demand for passenger cars in the period from January to March 2020 was up by more than 40% on the very low prior-year level. In South Africa, due to the crisis, the number of passenger cars sold was distinctly below the already very weak results of the pre-vious year.
In North America, too, sales of passenger cars and light com-mercial vehicles (up to 6.35 tonnes) declined in the reporting period compared to the prior year, with first effects of the Covid-19 pandemic becoming noticeable. The market volume in the USA remained markedly short of the prior-year level. The decline affected both the passenger car segment and light commercial vehicles such as SUVs and pickup models. In the Canadian automotive market, the downward trend that
D J F M A M J J A S O N D
90
95
100
105
90
95
100
105
EUR to GBPEUR to USDEUR to CNY
EUR to JPY
E X C H A N G E R A T E M O V E M E N T S F R O M D E C E M B E R 2 0 1 9 T O M A R C H 2 0 2 0Index based on month-end prices: as of December 31, 2019 = 100

Interim Management Report 9Business Development
began in 2018 continued at the start of the reporting year. The number of vehicles sold in Mexico also fell short of the comparable prior-year figure. In the markets of the South America region, new registrations for passenger cars and light commercial vehicles decreased markedly in the first three months of 2020. In this region, too, the automotive markets felt the first effects of the spread of the coronavirus. In Brazil, the recovery in demand for cars stalled; the number of new registrations was down distinctly on the prior-year quarter. In the Argentinian market, the deterioration in the macroeconomic situation since mid-2018 was compounded by the recent spread of the SARS-CoV-2 virus, with a negative impact on the demand for passenger cars and light commercial vehicles. Sales figures fell very sharply in the first quarter of 2020. In the Asia-Pacific region the whole of the first quarter of 2020 was impacted by the negative effects of the spread of the SARS-CoV-2 coronavirus. The number of new passenger cars registered in the reporting period was down almost a third on the prior-year level. This was due primarily to the devel-opment of the Chinese passenger car market, where the volume of demand fell dramatically short of the previous year as a result of the Covid-19 pandemic. Growth rates in this market have now been negative since mid-2018. Fol-lowing extremely high losses in February, the first signs of a recovery in the market as a whole were evident in March. In the Indian passenger car market, sales in the opening quarter of the year 2020 also fell significantly compared with a year earlier. In Japan, vehicle demand in the first three months of 2020 was down markedly on the previous year due not only to the Covid-19 pandemic, but also to the increase in VAT as of October 1, 2019.
There was a sharp year-on-year decline in demand for light commercial vehicles in the Asia-Pacific region. Regis-tration volumes in China, the region’s dominant market and the largest market worldwide, fell very sharply year-on-year. The number of new vehicle registrations in India saw a sharp decrease versus the prior year, while in Thailand the number was substantially below the level seen previous year.
T R E N D S I N T H E M A R K E T S F O R C O M M E R C I A L V E H I C L E S
Owing to the Covid-19 pandemic and limited availability of market data for the Commercial Vehicles Business Area, reliable registration data is so far only available for January and February 2020. These figures do not show the negative effects arising from the spread of the SARS-CoV-2 coronavirus that impacted the commercial vehicles markets that are relevant for Volkswagen in March.
In the markets that are relevant for the Volkswagen Group, global demand for mid-sized and heavy trucks with a gross weight of more than six tonnes was markedly lower
between January and February 2020 than in the prior-year period and will continue to deteriorate in March as a conse-quence of the pandemic.
Demand in the 27 EU states excluding Malta, but including the United Kingdom, Norway and Switzerland (EU27+3), fell significantly short of the 2019 level in January and February 2020, in line with our previous expectations. Demand in Russia was up significantly year-on-year, fueled mainly by a favor-able euro/ruble exchange rate and government spending. Turkey saw new vehicle registrations double, albeit starting from a very low level in the prior-year period. By contrast, the South African market registered a noticeable downturn.
Overall, new vehicle registrations in South America were down slightly on the figure for the first two months of 2019. In Brazil, the region’s largest market, demand for trucks was also slightly below that of the prior-year period, due in particular to weaker seasonal demand caused by holidays.
In the period from January to February 2020, demand for buses in the EU27+3 region fell slightly short of the previous year’s level due to large orders placed in 2019. The Italian and British markets in particular registered a substantial decrease, though this was almost entirely compensated for by an increase in France and Germany. The Mexican market recorded a substantial drop in vehicle registrations. Demand in Brazil was markedly down on the prior-year level owing among other things to seasonally subdued demand attribut-able to holidays.
T R E N D S I N T H E M A R K E T S F O R P O W E R E N G I N E E R I N G
The markets for power engineering are subject to differing regional and economic factors. Consequently, their business growth trends are mostly independent of each other.
The global impact of the Covid-19 pandemic and asso-ciated uncertainty meant that order activity in the marine market was markedly lower in the first quarter of 2020 than in the same period of the previous year. In merchant shipping, the tanker market temporarily saw a somewhat more positive development, influenced by low oil prices. The difficult liquidity situation resulted in a decline in demand for cruise ships and passenger ferries. The special market for government vessels, which is driven by state investment, continued on a stable trajectory. In the offshore sector, the existing overcapacity continued to curb investment in offshore oil production. Low oil prices also negatively affected this sector.
The market for power generation declined slightly in the first quarter of 2020 compared with the same period of the previous year. This trend was further compounded by the spread of SARS-CoV-2 and its impact on the global economic system, which led to strong pressure on prices overall. The trend away from oil-fired power plants toward dual-fuel and gas-fired power plants continued. Demand for energy solu-
Business Development 10 Interim Management Report
tions remained high, with a strong trend towards greater flexibility and decentralized availability.
The market for turbomachinery deteriorated slightly compared with the first quarter of the previous year. Demand for turbo compressors in the raw materials, oil, gas and processing industry proved resistant to the economic turbu-lence caused by the spread of the coronavirus. Although an upturn was registered towards the end of the first quarter of 2020, demand for turbo compressors fell slightly in the first three months of 2020 compared with the prior-year period. In the renewable energy industry, demand for steam turbines for power generation saw further year-on-year growth in the first three months of 2020. Demand for gas turbines for decentralized, industrial combined heat and power installa-tions in the power output categories of the new gas turbine range recorded slight growth in the first quarter of 2020. There was further market potential from the combination of gas turbines and gas engines. The Covid-19 pandemic has delayed many projects in individual regions.
The marine and power plant after-sales business for diesel engines performed well and benefited from regulatory changes in key sales markets.
The after-sales market for turbomachinery in the first quarter of 2020 was markedly weaker than in the previous year due to Covid-19.
T R E N D S I N T H E M A R K E T S F O R F I N A N C I A L S E R V I C E S
Demand for automotive financial services was buoyant in the first three months of 2020 due, among other things, to the persistently low key interest rates in the main currency areas. At the same time, the Covid-19 pandemic put pressure on the demand for financial services in nearly all regions.
Overall, the European passenger car market recorded a substantial fall in the demand for new vehicles from January to March 2020. The proportion of new lease and financing contracts increased, though the absolute number of contracts declined. Sales of used vehicles in Europe were also lower, while a slight increase in lease and financing contracts for used vehicles was recorded. There was an increased demand for after-sales products such as servicing, maintenance and spare parts agreements in the first three months of 2020. Demand for automotive-related insurance, by contrast, saw a decline.
In Germany, additions to loan-financed or leased new vehicles were lifted further year-on-year in the reporting period. There was greater demand for after-sales products from private customers, and the call for integrated mobility solutions remained high in the business customers segment.
In South Africa, demand for financing and insurance prod-ucts fell slightly.
The demand for financial services remained on a high level overall in the US and Canadian markets in the first quarter of 2020; however, the Covid-19 pandemic did lead to a decrease in March. In Mexico, there was a slight year-on-year decline in demand for lease and financing contracts. By contrast, the insurance business recorded a sharp increase in demand.
In Brazil, the consumer credit business was in line with the positive trend seen in 2019. Nearly half of new vehicle sales were covered by financial services products in the reporting period. In the Argentinian market, the high interest rate level resulting from the economic crisis posed a chal-lenge for sales of financing and leasing products. Business in both markets dropped markedly as a result of the Covid-19 pandemic towards the end of the quarter.
Demand for automotive financial services across the Asia-Pacific region was mixed in the first three months of 2020. In China, the spread of the coronavirus markedly increased the pressure on the already tense passenger car market, thus having a direct impact on the new contracts for automotive-related financial services. Throughout March, the relaxation of restrictions on registrations led to an increase in the num-ber of contracts signed, although the overall figure remained below the previous year’s level. In Japan, the demand for automotive financial services continued to be robust, partic-ularly due to the attractive financing offers; however, due to a declining automotive market, new contracts decreased year-on-year. The continued weakness of the banking market led to a dip in demand for financial services in India, too.
The demand for financial services in the Commercial Vehicles Business Area varied from region to region. A decline in lease and financing contracts was seen in Europe, accom-panied by an increasing penetration rate for financial prod-ucts. In Brazil, the truck and bus business and the related financial services market recorded growth.
VO L K SWA G E N G R O U P D E L I V E R I E S
The Volkswagen Group delivered 2,006,044 vehicles to cus-tomers worldwide from January to March 2020. The decrease of 23.0% or 599,516 units year-on-year was due almost exclusively to the Covid-19 pandemic and the measures taken worldwide to curb its spread. Sales figures for both passenger cars and commercial vehicles declined as a result of the fall in demand. The chart on page 13 shows the trend in deliveries worldwide by month compared with the previous year. In the following, we report separately on deliveries in the Passenger Cars Business Area and Commercial Vehicles Business Area.

Interim Management Report 11Business Development
VO L K SWA G E N G R O U P D E L I V E R I E S
F R O M J A N UA RY 1 TO M A R C H 3 1 1
2020 2019 %
Passenger Cars 1,960,054 2,548,397 –23.1
Commercial Vehicles 45,990 57,163 –19.5
Total 2,006,044 2,605,560 –23.0
1 Prior-year deliveries have been updated to reflect subsequent statistical trends. The figures include the Chinese joint ventures.
G LO B A L D E L I V E R I E S B Y T H E PA S S E N G E R C A R S B U S I N E S S A R E A
Global demand for the Volkswagen Group’s passenger cars and light commercial vehicles fell by 23.1% year-on-year to 1,960,054 units in the reporting period as a consequence of the debilitating market conditions arising from the uncer-tainty and the measures taken worldwide to tackle the Covid-19 pandemic. The pandemic led to delays and also had different geographical effects on our deliveries to customers. Bentley and Bugatti were the only Volkswagen Group brands that did not fall short of their prior-year figures. We registered declining demand year-on-year in nearly all regions. Exceptions were recorded in the Middle East region and in some individual markets such as Russia, Brazil and Japan. Our passenger car market share in an overall market worldwide that is experiencing a substantial downturn was 12.3 (12.3)%.
The table on the next page provides an overview of pas-senger car and light commercial vehicle deliveries to custom-ers by market in the reporting period. Sales trends in the individual markets are described in the following sections.
Deliveries in Europe/Other markets
In Western Europe, the Volkswagen Group delivered 748.281 vehicles to customers in the first three months of this year in a much weaker overall market. This was 19.9% fewer than in the same period of 2019. The increasing spread of the SARS-CoV-2 virus and the measures taken to contain it sent demand for the Group’s vehicles into a tailspin during the first quarter. Demand for Group vehicles declined at similar levels in all major individual markets. The Group models with the highest volume of demand were the Golf, Polo, T-Roc and Tiguan from the Volkswagen Passenger Cars brand. In addition, the T-Cross and Passat models from Volks-wagen Passenger Cars, the Q3 Sportback, Q7 and e-tron from Audi, the Scala and Kamiq from ŠKODA, the Mii electric and Tarraco from SEAT as well as the Porsche Cayenne Coupé and Porsche Taycan, all of which had been introduced as new or successor models over the course of the previous year, were very popular with customers. The up!, T-Roc Cabriolet and Golf saloon models from the Volkswagen Passenger Cars brand, the Audi A5 Sportback, and ŠKODA’s Citigoe iV and
Superb iV were successfully launched on the market as new or successor models during the reporting period. The Volks-wagen Group’s share of the passenger car market in Western Europe rose to 24.4 (22.1)%.
In Germany, demand for vehicles from the Volkswagen Group was down 15.3% year-on-year between January and March 2020 in a significantly weaker overall market. Like the overall market in Western Europe, the decrease was attribut-able to the spread of the SARS-CoV-2 virus and the contain-ment measures taken. There was an upturn in demand for a number of vehicles including the Golf Estate and Tiguan Allspace models from the Volkswagen Passenger Cars brand and the Arona and Leon ST from SEAT. The T-Cross and Passat models from Volkswagen Passenger Cars, the Audi Q3 Sport-back, Q7 and e-tron, the ŠKODA Scala and Kamiq, the Mii electric and the Tarraco from SEAT as well as the Porsche Cayenne Coupé and Porsche Taycan, all of which had been introduced as new or successor models over the course of the previous year, were also in high demand from customers. Nine Group models led the Kraftfahrt-Bundesamt (KBA – Ger-man Federal Motor Transport Authority) registration statis-tics in their respective segments: the Polo, Golf, T-Roc, Tiguan, Touran, Passat, Audi A6, Porsche 911 and Caddy. After the first three months of 2020, the Golf was still the most popular passenger car in Germany in terms of registrations.
In the Central and Eastern Europe region, the number of vehicles delivered to customers in the reporting period fell by 10.9%, a less sharp decline than in Western Europe due to the rise in deliveries in Russia, particularly in March. Demand developed encouragingly for the Vento and T-Cross models from Volkswagen Passenger Cars, for the Audi Q7, for the ŠKODA models Scala, Kamiq, Karoq and Kodiaq, and for the SEAT Arona and Porsche Cayenne Coupé, among others. The Volkswagen Group’s share of the passenger car market in the Central and Eastern Europe region amounted to 19.7 (20.3)%.
In Turkey, the Volkswagen Group benefited from the catch-up effects in the overall market and increased the number of vehicles handed over to customers between January and March of this year by 72.0% compared with the prior-year period. In the distinctly weaker South African market, the number of Group models sold fell by 2.0%. The Polo from Volkswagen Passenger Cars continued to be the most frequently sold Group model there.
Deliveries in North America
In North America, demand for Volkswagen Group models fell by 12.9% year-on-year in the reporting period, mirroring the trend in the market as a whole. As this region did not experience the effects of the Covid-19 pandemic until somewhat later, deliveries actually rose in the months of January and February. The Group’s share of the market in this region amounted to 4.6 (4.5)%. The Tiguan Allspace and Jetta from the Volkswagen Passenger Cars brand were the most in-demand Group models in North America.

Business Development 12 Interim Management Report
In the considerably weaker US market, the Volkswagen Group delivered 13.5% fewer vehicles to customers between January and March 2020 than in the same period of the previous year. The biggest increases of all Group models were recorded by the Golf Estate from Volkswagen Passenger Cars and by the Q3, A5 Sportback and e-tron from Audi. The Atlas Cross Sport from Volkswagen Passenger Cars, the Audi Q7 and the Porsche Cayenne Coupé were successfully launched in the reporting period.
In Canada, the number of deliveries to Volkswagen Group customers fell by 22.7% year-on-year. The market as a whole
also declined during this period. The Tiguan Allspace and Jetta models from Volkswagen Passenger Cars were par-ticularly popular.
In a declining overall market in Mexico, we delivered 6.0% fewer vehicles to customers in the first three months of this year than in the prior-year period. The Group models with the highest volume of demand were the Vento, Jetta and Tiguan Allspace from the Volkswagen Passenger Cars brand.
PA S S E N G E R C A R D E L I V E R I E S TO C U STO M E R S B Y M A R K E T F R O M J A N UA RY 1 TO M A R C H 3 1 1
D E LI V E R I E S ( UN I T S) C H A N G E
2020 2019 (%) Europe/Other markets 983,547 1,198,133 – 17.9Western Europe 748,281 934,714 – 19.9
of which: Germany 276,988 326,993 – 15.3France 45,042 71,535 – 37.0United Kingdom 118,429 158,355 – 25.2Italy 61,264 81,873 – 25.2Spain 60,223 79,810 – 24.5
Central and Eastern Europe 159,147 178,619 – 10.9of which: Czech Republic 28,018 32,823 – 14.6
Russia 51,733 46,523 + 11.2Poland 30,360 43,503 – 30.2
Other Markets 76,119 84,800 – 10.2
of which: Turkey 25,177 14,640 + 72.0South Africa 21,646 22,092 – 2.0
North America 188,096 215,905 – 12.9of which: USA 129,797 149,985 – 13.5
Canada 17,002 22,001 – 22.7Mexico 41,297 43,919 – 6.0
South America 114,282 119,308 – 4.2of which: Brazil 87,746 84,032 + 4.4
Argentina 14,655 22,054 – 33.5Asia-Pacific 674,129 1,015,051 – 33.6
of which: China 612,737 945,305 – 35.2India 5,451 14,255 – 61.8Japan 19,927 19,709 + 1.1
Worldwide 1,960,054 2,548,397 – 23.1Volkswagen Passenger Cars 1,091,507 1,456,384 – 25.1Audi 352,993 447,247 – 21.1ŠKODA 232,885 307,617 – 24.3SEAT 130,316 151,612 – 14.0Bentley 2,395 2,268 + 5.6Lamborghini 1,944 1,992 – 2.4Porsche 53,125 55,700 – 4.6Bugatti 20 20 + 0.0Volkswagen Commercial Vehicles 94,869 125,557 – 24.4
1 Prior-year deliveries have been updated to reflect subsequent statistical trends. The figures include the Chinese joint ventures.

Interim Management Report 13Business Development
Deliveries in South America
In the South American passenger car and light commercial vehicles markets, which saw a marked decline overall, the number of Group models delivered to customers in the first quarter of 2020 was down by 4.2% year-on-year. As this region did not experience the effects of the Covid-19 pan-demic until somewhat later, deliveries actually rose in the months of January and February. The Gol and Polo from the Volkswagen Passenger Cars brand were the group models in greatest demand. Launched on the market in the previous year, the T-Cross from Volkswagen Passenger Cars was also very popular with customers. The Group’s share of the market in South America expanded to 13.3 (11.8)%.
The recovery of the Brazilian market was interrupted by the outbreak of the Covid-19 pandemic. Here, however, the Volkswagen Group increased the number of vehicles sold to customers by 4.4% year-on-year based on the positive trend in the first two months of the reporting period. This was attributable in particular to the success of the new T-Cross from Volkswagen Passenger Cars launched in the previous year. Demand also developed encouragingly for the Gol, Saveiro and Tiguan Allspace from the Volkswagen Passenger Cars brand.
In Argentina, the number of vehicles delivered to Volks-wagen Group customers fell short of the prior-year figure (–33.5%) in the first three months of this year amid a very sharp and persistent contraction in the overall market. The Gol and T-Cross from Volkswagen Passenger Cars and the Amarok from Volkswagen Commercial Vehicles saw the highest demand of all Group models.
Deliveries in the Asia-Pacific region
From January to March 2020, the Volkswagen Group saw demand taper off in the overall market of the Asia-Pacific region that was contracting very sharply, due primarily to the Covid-19 pandemic, and handed over 33.6% fewer vehicles to customers than in the year before. The Group’s share of the passenger car market in this region was at 11.3 (11.7)%.
In China, the Volkswagen Group delivered 35.2% fewer vehicles to customers year-on-year in an overall market that had been drastically weakened in particular by the spread of the SARS-CoV-2 coronavirus throughout the first quarter of 2020. Following extremely high declines in volumes in Febru-ary, the first signs of a recovery were recorded during the month of March. The T-Cross, Sagitar and Teramont X from the Volkswagen Passenger Cars brand, the VA3 and VS5 from the JETTA brand, the Audi Q8, the ŠKODA Kamiq GT and the Porsche Cayenne Coupé, all of which had been introduced as new or successor models over the course of the previous year, were in especially high demand. In addition, the Tayron and the Arteon from the Volkswagen Passenger Cars brand, the Audi Q2L and Q2L e-tron and the Porsche Panamera saw an encouraging trend in demand. The Passat from Volkswagen Passenger Cars, the VS7 from the JETTA brand, the Audi Q7 and the ŠKODA Rapid were successfully launched on the mar-ket as new or successor models during the reporting period.
On the Indian passenger car market, which registered a significant decline, the Volkswagen Group saw 61.8% less demand in the first three months of this year than in the prior-year period. Of the Group’s models, the ŠKODA Rapid was the most popular there.
In Japan, the number of Group models delivered to customers rose slightly by 1.1% year-on-year from January to March 2020, while the overall market was markedly weaker. The Group model to record the strongest demand was the T-Cross from the Volkswagen brand.
500
600
700
800
900
1,000
1,100
J F M A M J J A S O N D
500
600
700
800
900
1,000
1,100
2020201920202019
V O L K S W A G E N G R O U P D E L I V E R I E S B Y M O N T HVehicles in thousands

Business Development 14 Interim Management Report
CO M M E R C I A L V E H I C L E D E L I V E R I E S
In the first three months of 2020, the Volkswagen Group handed over 19.5% fewer commercial vehicles to customers worldwide than in the previous year. We delivered a total of 45,990 commercial vehicles to customers. Trucks accounted for 38,532 units (–22.7%) and buses for 4,030 units (–4.3%). A total of 3,428 (3,122) vehicles from the MAN TGE van series were delivered. The decline in the truck business was due to a slump in our core markets, which was exacerbated further in March 2020 by the uncertainty generated by the Covid-19 pandemic.
In the 27 EU states excluding Malta, but including the United Kingdom, Norway and Switzerland (EU27+3), sales were down by 30.1% on the same period of the previous year to a total of 25,401 units, of which 20,784 were trucks and 1,304 were buses. Here, the MAN brand delivered 3,313 light commercial vehicles.
In Russia, sales fell by 9.7% year-on-year to 1,525 units, including 1,404 trucks and 121 buses.
Between January and March 2020, deliveries in Turkey increased to 455 (142) vehicles. Trucks accounted for 402 units
and buses for 23 units, while 30 vehicles from the MAN TGE van series were sold. In South Africa, deliveries of Volkswagen Group commercial vehicles decreased by 26.8% year-on-year to a total of 676 units; of this figure 603 were trucks and 73 were buses.
Sales in North America declined in the first quarter of 2020 to 537 vehicles (–29.1%), which were delivered exclu-sively to customers in Mexico; this included 320 trucks and 217 buses.
Deliveries in South America rose to a total of 12,694 vehi-cles (+4.5%), of which 10,865 were trucks and 1,829 were buses. Following continued improvement in the economic climate in Brazil in the first quarter of 2020, we were able to increase our sales here by 5.7%. Of the units delivered, 9,649 were trucks and 1,348 were buses.
In the Asia-Pacific region, the Volkswagen Group sold 2,972 vehicles to customers in the reporting period; among these, 2,653 were trucks and 315 were buses. Overall, this was 2.1% less than in the previous year.
CO M M E R C I A L V E H I C L E D E L I V E R I E S TO C U STO M E R S B Y M A R K E T F R O M J A N UA RY 1 TO M A R C H 3 1 1
D E LI V E R I E S ( UN I T S) C H A N G E
2020 2019 (%)
Europe/Other markets 29,787 41,220 – 27.7
of which: EU27+3 25,401 36,339 – 30.1
of which: Germany 7,398 10,166 – 27.2
Russia 1,525 1,688 – 9.7
Turkey 455 142 x
South Africa 676 923 – 26.8
North America 537 757 – 29.1
of which: Mexico 537 757 – 29.1
South America 12,694 12,151 +4.5
of which: Brazil 10,997 10,404 +5.7
Asia-Pacific 2,972 3,035 – 2.1
Worldwide 45,990 57,163 – 19.5
Scania 18,184 23,576 – 22.9
MAN 27,806 33,587 – 17.2
1 Prior-year deliveries have been updated to reflect subsequent statistical trends.

Interim Management Report 15Business Development
D E L I V E R I E S I N T H E P O W E R E N G I N E E R I N G S E G M E N T
Orders in the Power Engineering segment are usually part of major investment projects. Lead times range from just under one year to several years, and partial deliveries as construc-tion progresses are common. Accordingly, there is a time lag between incoming orders and sales revenue from the new construction business.
In the period from January to March 2020, sales revenue in the Power Engineering segment was largely driven by Engines & Marine Systems and Turbomachinery, which together generated more than two-thirds of overall sales revenue.
VO L K SWA G E N G R O U P F I N A N C I A L S E R V I C E S
The Financial Services Division includes the Volkswagen Group’s dealer and customer financing, leasing, banking and insurance activities, fleet management and mobility offerings. The division comprises Volkswagen Financial Services and the financial services activities of Scania and Porsche Holding Salzburg.
The Financial Services Division’s products and services were popular in the period from January to March 2020, though the Covid-19 pandemic weighed on demand. The number of new financing, leasing, service and insurance con-tracts signed worldwide decreased by 2.0% to 2.1 million. As the Group’s deliveries fell out of proportion to the contracts signed, the ratio of leased and financed vehicles to Group deliveries (penetration rate) in the Financial Services Divi-sion’s markets in the reporting period increased to 39.8 (33.8)%. As of March 31, 2020, the total number of contracts was 23.7 million, 0.3% higher than at the end of 2019.
In Europe/Other Markets, the number of new contracts signed in the first three months of 2020 was on a level with the previous year at 1.6 (1.6) million. At the end of March 2020, the total number of contracts was 17.4 million, down 0.9% on December 31, 2019. The customer financing/leasing area accounted for 7.6 million of these contracts (–1.6%).
In North America, the number of new contracts signed in the reporting period was comparable with the number recorded in the prior-year period at 221 (221) thousand. At 3.2 (3.1) million, the number of contracts as of March 31, 2020 was up on the figure at year-end 2019. The customer financing/leasing area recorded 1.9 (1.9) million contracts.
A total of 75 (62) thousand new contracts were concluded in South America in the first quarter of 2020. At 723 (703) thou-sand, the total number of contracts at the end of March 2020 exceeded the figure on December 31, 2019. The contracts mainly related to the customer financing/leasing area.
In Asia-Pacific, which was the first region to be affected by the Covid-19 pandemic, the number of new contracts signed fell by 13.8% year-on-year to 199 thousand units between
January and March 2020. The total number of contracts amounted to 2.5 million at the end of the reporting period, 3.8% more than at the end of 2019. The customer finan-cing/leasing area accounted for 1.8 million contracts (+4.2%).
S A L E S TO T H E D E A L E R O R G A N I Z AT I O N
The Volkswagen Group’s unit sales to the dealer organization declined by 25.0% year-on-year in the first three months of 2020 to 1,937,191 vehicles (including the Chinese joint ventures). The main reason for the decline was the negative impact of the Covid-19 pandemic. Arising uncertainty in connection with this and national measures introduced to contain the pandemic, such as mobility restrictions and closing stores, were accompanied by a fall in customer demand. Falls in demand were recorded especially in China and Western Europe. Unit sales outside Germany declined by 26.3% compared to the period from January to March 2019. In Germany, unit sales fell by 16.7% year-on-year. Vehicles sold in Germany as a proportion of overall sales increased to 14.6 (13.2)%. P R O D U C T I O N
Between January and March 2020, the Volkswagen Group’s production fell by 24.8% year-on-year to a total of 1,996,957 vehicles due to the measures taken to stem the spread of the SARS-CoV-2 virus. The impact of national measures to contain the pandemic led to a disruption of the supply chains and consequently to production stoppages in the Volkswagen Group. This resulted in a decline in production, particularly at the locations in China and somewhat later in Europe toward the end of the first quarter of 2020. Production in Germany fell by 18.2% to 453,282 units. Production abroad decreased by 26.5% year-on-year to a total of 1,543,675 vehicles. The proportion of vehicles produced in Germany increased to 22.7 (20.9)%. I N V E N TO R I E S
Global inventories at Group companies and in the dealer organization were lower on March 31, 2020 than at year-end 2019, and also below the corresponding prior-year figure. E M P L OY E E S
The Volkswagen Group had 641,912 active employees on March 31, 2020. A further 10,303 employees were in the passive phase of their partial retirement. In addition, there were 17,796 young people in vocational traineeships. At the end of the first quarter of 2020, the Volkswagen Group had a total of 670,011 employees worldwide. This was roughly on a level with the figure at year-end 2019. At 296,520, the number of employees in Germany was also almost on a level with the end of 2019.

Results of Operations, Financial Position and Net Assets 16 Interim Management Report
R E S U LT S O F O P E R AT I O N S O F T H E G R O U P
The Volkswagen Group generated sales revenue of €55.1 bil-lion in the first quarter of 2020, a decline of 8.3% compared with the previous year. The main adverse factor was a decline in volumes due to the Covid-19 pandemic. In addition, changes in exchange rates had a negative effect, while mix effects, better price positioning and the business perfor-mance in the Financial Services Division made a positive contribution. The Volkswagen Group generated 80.1 (79.7)% of its sales revenue abroad. Gross profit on sales decreased to €9.2 (11.7) billion; the gross margin stood at 16.8 (19.5)%.
The Volkswagen Group’s operating profit for the period from January to March 2020 amounted to €0.9 billion, down €3.0 billion on the prior-year period, in which special items of €–1.0 billion from the diesel issue weighed on profit. The operating return on sales decreased to 1.6 (6.4)%. The main reason for the decline was the negative impact of the spread of the Covid-19 pandemic: in addition to lower unit sales because of the fall in customer demand, turbulence in the commodity and capital markets meant that the fair value measurement of commodity hedges and the measurement of receivables and liabilities denominated in foreign currencies had a negative effect.
The financial result decreased €0.4 billion year-on-year to €–0.2 billion. Here, too, the spread of the SARS-CoV-2 corona-virus had an negative impact overall. The interest expenses included in the financial result were down markedly for measurement-related reasons caused by a change in discount rates applied in the measurement of liabilities, while changes in share prices weighed on net income from securities and funds. The share of the result of equity-accounted invest-ments was markedly lower than in the previous year. The decline was primarily due to lower profit generated by the Chinese joint ventures, which were affected by the Covid-19 pandemic during the entire first quarter of 2020.
The Volkswagen Group’s profit before taxes decreased by €3.4 billion to €0.7 billion in the reporting period. Profit after tax amounted to €0.5 (3.1) billion.
Results of operations in the Automotive Division
The Automotive Division’s sales revenue amounted to €44.7 billion in the period from January to March 2020, down 12.1% on the previous year; the main reason for the decline was a fall in volumes due to the Covid-19 pandemic. In addition, changes in exchange rates had a negative effect, while mix effects and better price positioning made a positive contribution. Sales revenue was down significantly in both
the Passenger Cars and Commercial Vehicles business areas. Sales revenue increased in the Power Engineering Business Area; due to the nature of the business, there is sometimes a significant time lag between incoming orders and revenue recognition. As our Chinese joint ventures are accounted for using the equity method, the Group’s business performance in the Chinese passenger car market is reflected in consolidated sales revenue primarily by deliveries of vehicles and vehicle parts.
The downturn in volumes led to a decrease in cost of sales, although its ratio to sales revenue rose year-on-year. A rise in depreciation and amortization charges due to the large capex volume was set against higher capitalized development costs. Total research and development costs as a percentage of the Automotive Division’s sales revenue (research and development ratio or R&D ratio) in the period from January to March 2020 increased to 8.0 (6.9)% compared to the prior-year period,due in part to the decline in sales revenue.
Distribution expenses were down in the first quarter of 2020, while their ratio to sales revenue increased slightly. There was a rise in administrative expenses and their ratio to sales revenue in the reporting period. The other operating result was down on the prior-year period at €–1.1 (–0.4) bil-lion. This was mainly attributable to the negative effects of the fair value measurement of derivatives used in commod-ity hedges to which hedge accounting is not applied and to the measurement of receivables and liabilities denominated in foreign currencies; these factors reduced the operating result by around €1.3 billion (previous year: gain of €0.2 bil-lion). In the prior-year period, this item had included special items in connection with the diesel issue in an amount of €–1.0 billion.
In the first three months of 2020, the Automotive Divi-sion’s operating profit amounted to €0.2 billion, down €3.0 billion compared with the same period of 2019. It was negatively affected by the Covid-19 pandemic, which impacted on unit sales, the fair value measurement of certain derivatives and the measurement of receivables and liabilities denominated in foreign currencies. Higher costs also weighed on the operating profit. The operating return on sales in the Automotive Division was 0.4 (6.2, or 8.2 before special items in the previous year)%. In essence, the business performance of our Chinese joint ventures is reflected in our operating profit only through deliveries of vehicles and vehicle parts and through license revenue, as the profit recorded by the joint venture companies is accounted for in the financial result using the equity method.
Results of Operations, Financial Position and Net Assets

Interim Management Report 17Results of Operations, Financial Position and Net Assets
1 before special items
R E S U LT S O F O P E R AT I O N S I N T H E PA S S E N G E R C A R S , CO M M E R C I A L
V E H I C L E S A N D P O W E R E N G I N E E R I N G B U S I N E S S A R E A S F R O M
J A N UA RY 1 TO M A R C H 3 1
€ million 2020 2019
Passenger Cars
Sales revenue 38,165 43,581
Operating result 120 2,803
Operating return on sales (%) 0.3 6.4
Commercial Vehicles
Sales revenue 5,564 6,305
Operating result 121 420
Operating return on sales (%) 2.2 6.7
Power Engineering
Sales revenue 922 891
Operating result –44 –56
Operating return on sales (%) –4.7 –6.3
Results of operations in the Financial Services Division
The Financial Services Division generated sales revenue of €10.4 billion in the period from January to March 2020, up 12.7% on the previous year. Because of the Financial Services Division’s business model, the Covid-19 pandemic was not yet seen to have a significant negative impact on sales revenue in the first quarter of 2020.
Cost of sales rose by €1.0 billion to €8.5 billion due to volume effects. When taken together, there was a slight rise in distribution and administrative expenses and the other
operating result, due to risk costs and exchange rate effects, while their ratio to sales revenue remained virtually unchanged.
The Financial Services Division’s operating profit was up slightly on the previous year at €0.7 (0.7) billion. The oper-ating return on sales amounted to 6.8 (7.6)%.
F I N A N C I A L P O S I T I O N O F T H E G R O U P
Due to earnings-related factors, the Volkswagen Group recorded gross cash flow of €7.4 billion in the first quarter of 2020, a decline of €3.0 billion compared with the previous year. The change in working capital amounted to €–5.6 (–7.6) billion. The reason for the change compared with the prior-year period is firstly the dividend receivable from the Chinese joint venture SAIC VOLKSWAGEN, which was already recognized in the previous year. Secondly, it reflects the impact of the Covid-19 pandemic, which is responsible, among other things, for a smaller increase in receivables, lower provisions and higher inventories due to falling demand, a smaller rise in liabilities because of disrupted production supplies and a decline in receivables in the financial services business as a result of the collapse in demand. Cash outflows attributable to the diesel issue increased year-on-year. Cash flows from operating activities were down by €1.0 billion to €1.9 billion.
Investing activities attributable to operating activities increased to €4.1 (3.4) billion.
Financing activities accounted for total cash inflows of €7.5 (–7.4) billion in the reporting period; their purpose was, among other things, to boost gross liquidity. Financing activities primarily include the issuance and redemption of bonds and changes in other financial liabilities. An amount of €3.3 billion was drawn down on Volkswagen AG’s syndi-
Q1 Q2 Q3 Q4
0
1,500
3,000
4,500
6,000
0
1,500
3,000
4,500
6,000
2020201920202019
O P E R A T I N G P R O F I T B Y Q U A R T E RVolkswagen Group in € million
1

Results of Operations, Financial Position and Net Assets 18 Interim Management Report
cated credit line of €10.0 billion in the reporting period. In the previous year, this item had included the acquisition of MAN shares tendered as a result of the termination of the control and profit and loss transfer agreement.
At the end of the reporting period, the Volkswagen Group’s cash and cash equivalents reported in the cash flow state-ment amounted to €26.9 (19.7) billion.
On March 31, 2020, the Volkswagen Group’s net liquidity stood at €–149.3 billion, compared with €–148.0 billion at the end of 2019.
Financial position of the Automotive Division
The Automotive Division’s gross cash flow decreased to €4.9 (8.1) billion in the first quarter of 2020 due to the pandemic-related decline in profit. The change in working capital amounted to €–3.4 (–2.7) billion. The Covid-19 pan-demic was responsible for, among other things, a smaller increase in receivables, lower provisions and higher inven-tories due to falling demand and a smaller rise in liabilities because of disrupted production supplies. The dividends receivable from the Chinese joint venture SAIC VOLKSWAGEN were recognized in the previous year. The cash outflows attributable to the diesel issue were higher than in the prior-year period. Cash flows from operating activities decreased by €3.8 billion to €1.5 billion.
The Automotive Division’s investing activities attributable to operating activities amounted to €4.1 billion in the period from January to March 2020, up €0.7 billion on the prior-year period. Investments in property, plant and equipment, invest-ment property and intangible assets, excluding capitalized development costs (capex) increased slightly by €0.1 billion to €2.1 billion. The increase of the ratio of capex to sales revenue to 4.7 (4.0)% was attributable to the pandemic-related fall in sales revenue. Capex was invested primarily in our pro-duction facilities and in models to be launched in 2019 and 2020, as well as in the ecological focus of our model range, the electrification and digitalization of our products and in our modular toolkits. Additions to capitalized development costs climbed by €0.4 billion to €1.6 billion in the reporting period. The rise is due to product impairment tests, which have had to be performed at brand level since the end of 2019. Strategic investments in a number of companies led to a €0.2 billion increase in the “Acquisition and disposal of equity investments” item to €0.5 billion.
The Automotive Division’s net cash flow went down by €4.5 billion to €–2.5 billion.
Financing activities relate primarily to the issuance and redemption of bonds and changes in other financial lia-bilities; the total cash inflow in this item was €5.7 billion in the first quarter of 2020. In the prior-year period, there had been a cash outflow of €6.1 billion due, among other things, to the acquisition of MAN shares tendered as a result of the termination of the control and profit and loss transfer agreement with MAN SE.
F I N A N C I A L P O S I T I O N O F T H E PA S S E N G E R C A R S , CO M M E R C I A L
V E H I C L E S A N D P O W E R E N G I N E E R I N G B U S I N E S S A R E A S F R O M
J A N UA RY 1 TO M A R C H 3 1
€ million 2020 2019
Passenger Cars
Gross cash flow 4,421 7,297
Change in working capital –3,081 –1,801
Cash flows from operating activities 1,340 5,496
Cash flows from investing activities attributable to operating activities –3,715 –5,057
Net cash flow –2,375 439
Commercial Vehicles
Gross cash flow 467 776
Change in working capital –326 –894
Cash flows from operating activities 141 –118
Cash flows from investing activities attributable to operating activities –309 1,721
Net cash flow –167 1,602
Power Engineering
Gross cash flow 29 37
Change in working capital 36 –50
Cash flows from operating activities 65 –13
Cash flows from investing activities attributable to operating activities –41 –38
Net cash flow 24 –51
Investments in securities and third-party borrowings were affected mainly by the turbulence in the capital markets from the Covid-19 pandemic, resulting in a negative effect of €0.7 billion as of the reporting date. The Automotive Division’s net liquidity stood at €17.8 billion at the end of March 2020, compared with €21.3 billion at the end of 2019. Financial position of the Financial Services Division
The gross cash flow recorded in the Financial Services Divi-sion was €2.5 (2.3) billion in the first three months of 2020. Given a decrease in funds tied up in working capital caused by the lower business volume in response to the decline in demand following the spread of the coronavirus, the change in working capital amounted to €–2.2 (–4.8) billion. Cash flows from operating activities rose to €0.3 (–2.5) billion.
At €0.1 (0.0) billion, investing activities attributable to operating activities were on a level with the previous year.
The Financial Services Division’s financing activities relate primarily to the issuance and redemption of bonds and other financial liabilities; there was a total cash inflow of €1.8 billion in the period from January to March 2020, com-pared with an outflow of €1.3 billion in the previous year.

Interim Management Report 19Results of Operations, Financial Position and Net Assets
On March 31, 2020, the Financial Services Division’s negative net liquidity, which is common in the industry, stood at €–167.1 billion; the figure on December 31, 2019 was €–169.3 billion. CO N S O L I DAT E D B A L A N C E S H E E T ST R U C T U R E
At the end of the reporting period, the Volkswagen Group had total assets of €491.2 billion; the 0.6% increase is primarily attributable to the boost to gross liquidity, which was set against exchange rate effects. The Group’s equity increased by €2.2 billion to €125.9 billion. The equity ratio was 25.6 (25.3)%. Automotive Division balance sheet structure
The Automotive Division’s intangible assets on March 31, 2020 were almost on a level with the figure on the 2019 balance sheet date. Property, plant and equipment was down because of exchange rate effects. Noncurrent assets declined by a total of 1.1% compared with the end of 2019.
Current assets were up by 6.8%. The inventories included in this item increased by approximately the same percentage; the pandemic caused delivery and production stoppages. Current other receivables and financial assets were higher than at the end of the previous year. The Automotive Division reported a €2.2 billion increase in securities and cash and cash equivalents to €35.5 billion.
The Automotive Division’s equity amounted to €95.1 bil-lion in the first quarter of 2020, €2.3 billion higher than on December 31, 2019. The rise was due mainly to lower actu-arial losses from the measurement of pension provisions, which were offset by negative exchange rate effects. Noncon-trolling interests are primarily held by the noncontrolling interest shareholders of the TRATON GROUP.
Noncurrent liabilities declined to €82.4 billion, down 9.2% compared with the end of December 31, 2019. The decrease in noncurrent financial liabilities included in this item was driven primarily by reclassifications from noncur-rent to current liabilities to reflect shorter remaining matu-rities and by exchange rate effects. The decline in pension provisions was primarily due to the actuarial remeasurement following a change in the discount rate. Noncurrent other lia-bilities were higher than the level recorded on December 31, 2019.
Current liabilities amounted to €73.9 billion at the end of the first quarter of 2020, €10.7 billion higher than on Decem-ber 31, 2019. Current financial liabilities rose to €2.9 (–7.3) bil-lion. The reasons included reclassifications from noncurrent to current liabilities and measures to boost gross liquidity. The figures for the Automotive Division also contain the elimination of intragroup transactions between the Automo-tive and Financial Services divisions. As the current financial liabilities for the primary Automotive Division were lower than the loans granted to the Financial Services Division at
B A L A N C E S H E E T ST R U C T U R E O F T H E PA S S E N G E R C A R S ,
CO M M E R C I A L V E H I C L E S A N D P O W E R E N G I N E E R I N G B U S I N E S S
A R E A S
€ million March 31, 2020 Dec. 31, 2019
Passenger Cars
Noncurrent assets 125,540 126,387
Current assets 83,570 75,459
Total assets 209,110 201,846
Equity 78,484 75,773
Noncurrent liabilities 71,121 78,679
Current liabilities 59,506 47,394
Commercial Vehicles
Noncurrent assets 24,370 25,143
Current assets 11,591 13,420
Total assets 35,960 38,563
Equity 13,732 14,115
Noncurrent liabilities 10,595 11,367
Current liabilities 11,633 13,081
Power Engineering
Noncurrent assets 2,122 2,206
Current assets 4,234 4,202
Total assets 6,357 6,408
Equity 2,837 2,885
Noncurrent liabilities 717 777
Current liabilities 2,803 2,746
the end of 2019, a negative amount was disclosed. Current other liabilities were up compared with the end of 2019, primarily due to the effects arising from the measurement of derivatives.
The Automotive Division’s total assets stood at €251.4 bil-lion on March 31, 2020, 1.9% more than at the end of 2019. Financial Services Division balance sheet structure
Total assets in the Financial Services Division amounted to €239.7 billion at the end of March 2020, a decline of 0.6% over December 31, 2019.
Noncurrent assets were down by a total of 0.8% compared with the end of 2019; the property, plant and equipment included in this item was virtually unchanged. Lease assets were up, while noncurrent financial services receivables decreased because volumes and exchange rates were affected by the Covid-19 pandemic.
Overall, current assets were at almost the same level as at the end of 2019. Both current other receivables and financial assets declined, as did current financial services receivables.

Results of Operations, Financial Position and Net Assets 20 Interim Management Report
Cash and cash equivalents in the Financial Services Division
stood at €8.0 billion on March 31, 2020, an increase of
€1.7 billion compared with December 31, 2019.
At the end of the first quarter, the Financial Services
Division accounted for around 48.8 (49.4)% of the Volkswagen
Group’s assets.
The Financial Services Division’s equity was almost
unchanged at €30.8 (30.9) billion; the profits generated had a
positive effect, which was offset by negative exchange rate
factors. The equity ratio was 12.9 (12.8)%.
Noncurrent liabilities were 5.6% lower, mainly because of
a fall in noncurrent financial liabilities.
In contrast, current liabilities were 4.2% higher than at the
end of 2019 because of a rise in current financial liabilities.
Deposits from the direct banking business were lower
than on December 31, 2019, at €32.0 (32.5) billion.
R E P O RT O N E X P E C T E D D E V E L O P M E N T S, R I S KS A N D
O P P O RT U N I T I E S
The global spread of the SARS-CoV-2 coronavirus is bringing
enormous disruption to all areas of everyday life and the
economy. This is also combined with turbulence on the
commodity and capital markets. The consequences partic-
ularly for the further development of individual economies
and the world economy as a whole cannot reliably be
predicted at the current time. Despite this, we expect
economic recovery to commence in the course of 2020.
All areas of the Volkswagen Group are affected by the
Covid-19 pandemic, especially sales due to a fall in customer
demand, production and the supply chains. There are risks
arising in particular from a sustained fall in demand and
increasing intensity of competition, which could be
mitigated by government economic programs. We also
envisage challenges, especially associated with restarting
production, specifically with regard to stable supply chains
and protecting the health of our staff. We have put in place
increased hygiene and protective measures to ensure plants
can operate. The Volkswagen Group Board of Management
expects a negative impact on business operations at all
locations worldwide. As a result, we will not fulfill the initial
expectations for all the Group’s core performance indicators
in fiscal year 2020.
We expect the Volkswagen Group’s deliveries to custom-
ers, sales revenue and operating result to be below the
previous year’s figures. In the Automotive Division, the R&D
ratio and the ratio of capex to sales revenue in 2020 will
probably exceed the previous year’s levels despite counter-
acting measures due to lower demand and therefore falling
sales revenues. In view of the lower customer demand,
further payouts in relation to the diesel issue and cash
outflows from mergers & acquisitions, we expect net cash
flow for 2020 to be below the prior-year figure. As a result, net
liquidity in the Automotive Division will also fall short of the
previous year’s level. We expect lower return on investment
(ROI) than in the previous year due to earnings-related factors
and do not expect to achieve our defined minimum required
rate of return on invested capital of 9%.
The Outlook for fiscal year 2020 can be found on page 22.

Interim Management Report 21Results of Operations, Financial Position and Net Assets
Diesel issue
1. Criminal and administrative proceedings worldwide (excluding the USA/Canada) In the criminal proceedings regarding alleged market manip-ulation relating to capital market disclosure obligations in connection with the diesel issue, the Braunschweig Regional Court has named Volkswagen AG as a collateral participant. 2. Product-related lawsuits worldwide (excluding the USA/ Canada) In April 2020, the court in Australia approved the class action settlement that the parties had agreed to.
On February 28, 2020, Volkswagen AG and Verbraucher-zentrale Bundesverband e.V. (Federation of Consumer Organi-zations) entered into an out of court settlement to terminate the consumer action for model declaratory judgment. Under the terms of the settlement, Volkswagen AG will offer indi-vidual settlements to consumers who registered claims under the action for model declaratory judgment and meet the settlement criteria. The volume of such settlements amounts to €830 million. Verbraucherzentrale Bundesverband e.V. will withdraw the action for model declaratory judgment. Volkswagen has so far entered into individual settlements with some 200 thousand customers in an aggre-gate amount of €626 million.
In April 2020, the High Court in England and Wales ruled in the group litigation that the switch logic in the EA 189 engine constituted an unlawful defeat device; the court believed that it was also bound by the findings of the Kraft-fahrtbundesamt (German Federal Motor Transport Author-ity) in this respect. Volkswagen AG disagrees with the High Court's legal position on these preliminary issues and is considering filing an ap-peal against this decision. The question of liability on the part of Volkswagen AG was not a matter addressed by the decision and will be dealt with at a later stage of the proceedings.
3. Proceedings in the USA/Canada In February 2020, the Montana State Court dismissed certain of the environmental claims asserted by the Montana Attor-ney General, but allowed other claims to proceed. Volkswagen has asked the Montana Supreme Court to review this decision.
Additional important legal cases
In the tax litigation between the Brazilian tax authorities and MAN Latin America, the amount at risk remains unchanged at 3.1 billion BRL. Solely due to exchange rate fluctuations, the risk in euros as disclosed in the notes under contingent liabil-ities has declined from €0.7 billion to €0.5 billion.
In March 2020, the US District Court for the Northern Dis-trict of California dismissed two amended class action com-plaints brought by purchasers of German luxury vehicles alleging that, since the 1990s, several automobile manufac-turers, including Volkswagen AG and other Group compa-nies, conspired to unlawfully increase the prices of German luxury vehicles in violation of US antitrust and consumer protection law. The court held that the plaintiffs have not stated a claim for relief because the allegations in the com-plaints do not plausibly support that the alleged agreements unreasonably restrained competition in violation of US law. The court granted plaintiffs leave to file amended complaints with respect to a limited subset of plaintiffs’ original claims.
In February 2020, the US District Court for the Northern District of California granted final approval of a class action settlement resolving civil claims relating to approximately 98 thousand Volkswagen, Audi, Porsche and Bentley vehicles with automatic transmissions. Beyond this, there were no significant changes in the reporting period compared with the disclosures on the Volks-wagen Group’s expected development in fiscal year 2020 contained in the combined management report in the 2019 Annual Report, specifically in the chapters “Report on Expected Developments” and “Report on Risks and Oppor-tunities” including the section “Legal risks”. In particular, based on the information as it exists and has been estab-lished, there continue to be no conclusive findings or assess-ments available to the Board of Management of Volks-wagen AG regarding the described facts that would suggest that a different assessment of the associated risks should have been made.
This report contains forward-looking statements on the business development of theVolkswagen Group. These statements are based on assumptions relating to thedevelopment of the economic and legal environment in individual countries and economicregions, and in particular for the automotive industry, which we have made on the basis ofthe information available to us and which we consider to be realistic at the time of goingto press. The estimates given entail a degree of risk, and actual developments may differfrom those forecast. Any changes in significant parameters relating to our key salesmarkets, or any significant shifts in exchange rates or raw materials relevant to the
Volkswagen Group, will have a corresponding effect on the development of our business.The same applies should the actual effects of the Covid-19 pandemic differ from thescenario assumed in this report. In addition, expected business development may vary ifthe assessments of the factors influencing sustainable value enhancement, as well as risksand opportunities presented in the 2019 Annual Report develop in a way other than weare currently expecting, or additional risks and opportunities or other factors emerge thataffect the development of our business.

Outlook 22 Interim Management Report
The Volkswagen Group Board of Management anticipates a negative growth rate in the world economy in 2020 as a result of the spread of the SARS-CoV-2 coronavirus. We also continue to believe that risks will arise from protectionist tendencies, turbulence in the financial markets and struc-tural deficits in individual countries. In addition, growth prospects will be negatively impacted by continuing geopoli-tical tensions and conflicts. We expect both the advanced economies and the emerging markets to experience a marked decline in economic performance. Despite this, we expect economic recovery to commence in the course of 2020.
In response to the Covid-19 pandemic, we have developed scenarios for the development of the passenger car markets in individual regions in 2020 which, for example, also take account of the trends currently being experienced in China. The scenarios reflect the different timings of the spread of the Covid-19 pandemic in the various geographic regions. In all, we expect the volume of global demand for new vehicles in 2020 to be between 15 and 20% lower than it was the previous year. In Western Europe, we anticipate a fall of up to 20% in the volume of new passenger car registrations in 2020 compared to the prior year. This assumes a very sharp decline in the second quarter followed by a swift recovery in the third quarter of 2020 and a fourth quarter that almost reaches the previous year’s figures. We have assumed the same trend for the passenger car markets in Central and Eastern Europe, but expect the year-on-year fall in the number of sales in 2020 to be somewhat less sharp here. The volume of demand in the markets for passenger cars and light commercial vehicles (up to 6.35 tonnes) in North America in 2020 is likely to be 25 to 30% lower than in the prior year. We anticipate a dramatic decline in the second quarter, followed by slow market recovery in the remaining quarters of 2020. We expect to see new registrations of passenger cars and light commercial vehicles in the South American markets fall by up to 30% in 2020 compared with the previous year. After a dramatic fall in the second quarter and a rapid recovery in the third quarter, the fourth quarter could match the previous year’s figures. The passenger car markets in the Asia-Pacific region are likely to be between 10 and 15% below the prior-year level in 2020. In China, we expect a recovery in the second quarter followed in the remaining quarters of 2020 by continuous catch-up effects compared to the previous year.
Trends in the markets for light commercial vehicles in the individual regions will also be mixed in 2020; on the whole, we anticipate a marked fall in demand due to Covid-19.
In the markets relevant for the Commercial Vehicles Busi-ness Area, we expect a substantial year-on-year fall in 2020 of new registrations for both mid-sized and heavy trucks with a gross weight of more than six tonnes and for buses.
In our view, automotive financial services will again be very important for vehicle sales worldwide in 2020.
Our brand diversity, our presence in all major world markets, our broad and selectively expanded product range, and our technologies and services put us in a good com-petitive position worldwide. As part of the transformation of our core business, we are positioning our Group brands with an even stronger focus on their individual characteristics, and are optimizing the vehicle and drive portfolio. The focus is primarily on our vehicle fleet’s carbon footprint and on the most attractive and fastest-growing market segments. In addition, we are working to leverage the advantages of our multibrand Group even more effectively with the ongoing development of new technologies and the enhancement of our toolkits.
We anticipate that deliveries to Volkswagen Group cus-tomers will be significantly down on the previous year in 2020 due to the impact of the Covid-19 pandemic.
Challenges will also arise particularly from the increasing intensity of competition, volatile commodity and foreign exchange markets and more stringent emissions-related requirements.
We expect the sales revenue of the Volkswagen Group and its divisions to fall significantly below the previous year’s level in 2020 as a result of the Covid-19 pandemic. We anticipate a severe year-on-year decline in the operating result for the Volkswagen Group and its Passenger Cars and Commercial Vehicles Business Areas. In the Power Engineering Business Area and in the Financial Services Division, we expect the pandemic to have less of an impact on the operating result in 2020 due to their business models. For the Power Engineering Business Area, we still anticipate a lower operating loss than that of the previous year. For the Financial Services Division we forecast a distinct fall in the operating result compared to the prior year. Overall, we expect the Volkswagen Group’s operating result for 2020 to be in positive territory.
Outlook

Brands and Business Fields 23
S A L E S R E V E N U E A N D O P E R AT I N G P R O F I T B Y
B R A N D A N D B U S I N E S S F I E L D
The Volkswagen Group and its brands were substantially
affected by the consequences of the Covid-19 pandemic in
the first quarter of 2020. The Group’s sales revenue declined
to €55.1 (60.0) billion. Operating profit fell to €0.9 (4.8) billion
(prior-year figure before special items of €–1.0 billion).
In the first three months of the year, the Volkswagen
Passenger Cars brand sold 765 (910) thousand vehicles, a
decline of 16.0%. Sales of the Gol and Passat models increased,
thus bucking the trend, and the T-Cross was also very popu-
lar. Sales revenue stood at €19.0 billion, a decline of 11.9%
compared with the previous year. Operating profit decreased
to €481 (921) million (prior-year figure before special items);
here, lower sales incentives and better price positioning were
unable to compensate for falling volumes as a result of the
Covid-19 pandemic, cost increases and a deterioration in the
mix.
Unit sales by the Audi brand fell to 268 (305) thousand
vehicles globally in the reporting period. The Chinese joint
venture FAW-Volkswagen sold a further 97 (130) thousand
Audi vehicles. The Q3 and e-tron in particular saw increasing
demand. Sales revenue declined to €12.5 (13.8) billion. Oper-
ating profit fell to €15 million (€1.1 billion). Lower fixed and
development costs were unable to compensate for the decrease
in volumes, the impact of the measurement of commodity
hedges and negative exchange rate effects. The financial key
performance indicators for the Audi brand include the
Lamborghini and Ducati brands. Ducati sold 10,171 (13,806)
motorcycles in the period from January to March 2020.
The ŠKODA brand sold 237 thousand vehicles in the
reporting period, 13.7% fewer than in the previous year. The
Scala and Kamiq models were in high demand. Sales revenue
amounted to €4.8 (4.9) billion. At €307 million, operating profit
was €103 million lower than in the previous year. Positive
mix effects failed to make up for the impact of lower vol-
umes, exchange rate effects and emissions-related expenses.
Unit sales by the SEAT brand stood at 140 thousand
vehicles in the first three months of 2020. This was 20.6%
lower than a year earlier. This figure includes the A1 manu-
factured for Audi. The SUV models Arona, Ateca and Tarraco
were especially popular. At €2.6 billion, sales revenue fell
16.2% short of the previous year’s comparative figure. At
€–48 (89) million, the operating result declined, primarily due
to volume effects.
The Bentley brand recorded unit sales of 3,302 (2,584)
vehicles in the reporting period. Sales revenue climbed to
€620 (456) million. Operating profit improved to €56 (49) mil-
lion due to volume and mix effects.
Brands and Business Fields
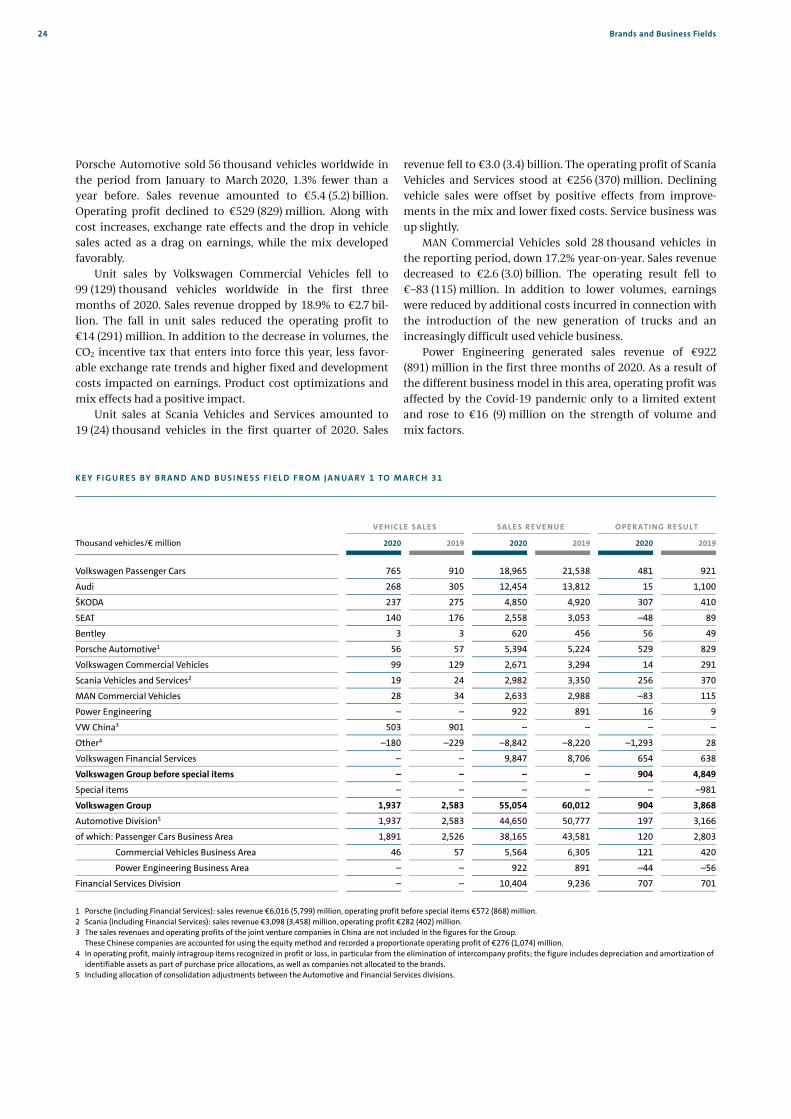
24 Brands and Business Fields
Porsche Automotive sold 56 thousand vehicles worldwide in the period from January to March 2020, 1.3% fewer than a year before. Sales revenue amounted to €5.4 (5.2) billion. Operating profit declined to €529 (829) million. Along with cost increases, exchange rate effects and the drop in vehicle sales acted as a drag on earnings, while the mix developed favorably.
Unit sales by Volkswagen Commercial Vehicles fell to 99 (129) thousand vehicles worldwide in the first three months of 2020. Sales revenue dropped by 18.9% to €2.7 bil-lion. The fall in unit sales reduced the operating profit to €14 (291) million. In addition to the decrease in volumes, the CO2 incentive tax that enters into force this year, less favor-able exchange rate trends and higher fixed and development costs impacted on earnings. Product cost optimizations and mix effects had a positive impact.
Unit sales at Scania Vehicles and Services amounted to 19 (24) thousand vehicles in the first quarter of 2020. Sales
revenue fell to €3.0 (3.4) billion. The operating profit of Scania Vehicles and Services stood at €256 (370) million. Declining vehicle sales were offset by positive effects from improve-ments in the mix and lower fixed costs. Service business was up slightly.
MAN Commercial Vehicles sold 28 thousand vehicles in the reporting period, down 17.2% year-on-year. Sales revenue decreased to €2.6 (3.0) billion. The operating result fell to €–83 (115) million. In addition to lower volumes, earnings were reduced by additional costs incurred in connection with the introduction of the new generation of trucks and an increasingly difficult used vehicle business.
Power Engineering generated sales revenue of €922 (891) million in the first three months of 2020. As a result of the different business model in this area, operating profit was affected by the Covid-19 pandemic only to a limited extent and rose to €16 (9) million on the strength of volume and mix factors.
K E Y F I G U R E S B Y B R A N D A N D B U S I N E S S F I E L D F R O M J A N UA RY 1 TO M A R C H 3 1
V E H I C LE SA LE S S A L E S R E V E N U E O P E R A T I N G R E S U LT
Thousand vehicles/€ million 2020 2019 2020 2019 2020 2019
Volkswagen Passenger Cars 765 910 18,965 21,538 481 921
Audi 268 305 12,454 13,812 15 1,100
ŠKODA 237 275 4,850 4,920 307 410
SEAT 140 176 2,558 3,053 –48 89
Bentley 3 3 620 456 56 49
Porsche Automotive1 56 57 5,394 5,224 529 829
Volkswagen Commercial Vehicles 99 129 2,671 3,294 14 291
Scania Vehicles and Services2 19 24 2,982 3,350 256 370
MAN Commercial Vehicles 28 34 2,633 2,988 –83 115
Power Engineering – – 922 891 16 9
VW China3 503 901 – – – –
Other4 –180 –229 –8,842 –8,220 –1,293 28
Volkswagen Financial Services – – 9,847 8,706 654 638
Volkswagen Group before special items – – – – 904 4,849
Special items – – – – – –981
Volkswagen Group 1,937 2,583 55,054 60,012 904 3,868
Automotive Division5 1,937 2,583 44,650 50,777 197 3,166
of which: Passenger Cars Business Area 1,891 2,526 38,165 43,581 120 2,803
Commercial Vehicles Business Area 46 57 5,564 6,305 121 420
Power Engineering Business Area – – 922 891 –44 –56
Financial Services Division – – 10,404 9,236 707 701
1 Porsche (including Financial Services): sales revenue €6,016 (5,799) million, operating profit before special items €572 (868) million. 2 Scania (including Financial Services): sales revenue €3,098 (3,458) million, operating profit €282 (402) million. 3 The sales revenues and operating profits of the joint venture companies in China are not included in the figures for the Group.
These Chinese companies are accounted for using the equity method and recorded a proportionate operating profit of €276 (1,074) million. 4 In operating profit, mainly intragroup items recognized in profit or loss, in particular from the elimination of intercompany profits; the figure includes depreciation and amortization of
identifiable assets as part of purchase price allocations, as well as companies not allocated to the brands. 5 Including allocation of consolidation adjustments between the Automotive and Financial Services divisions.
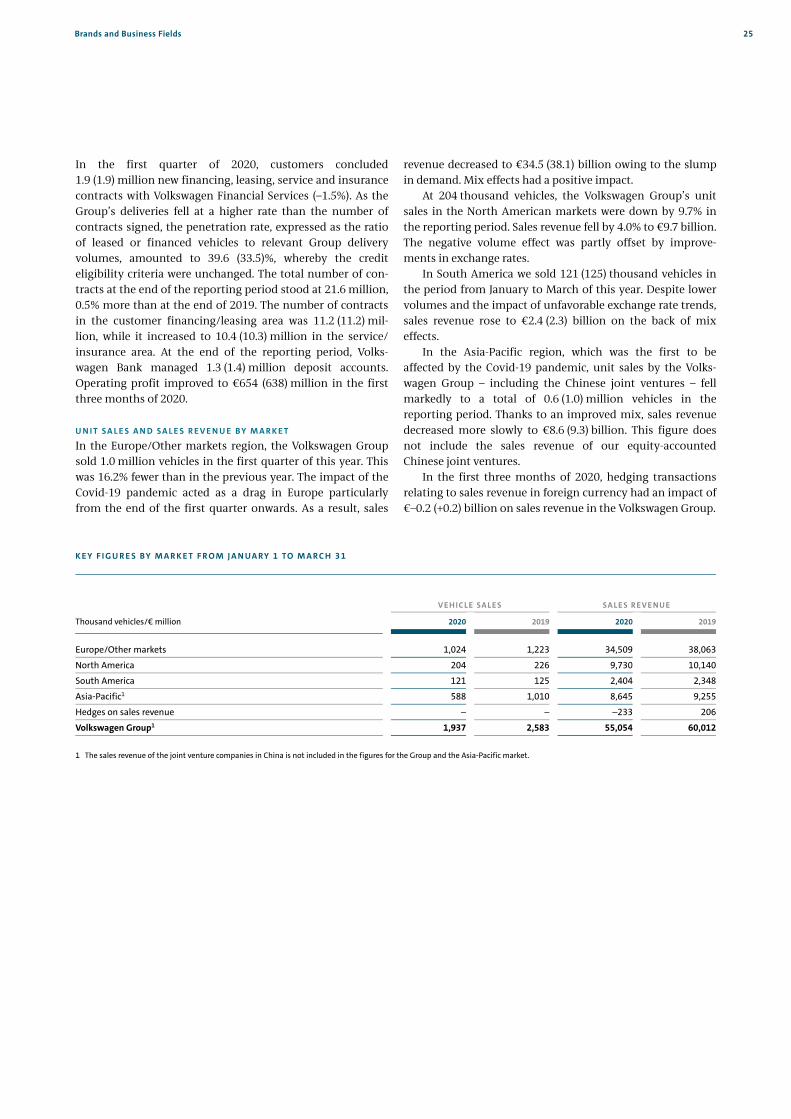
Brands and Business Fields 25
In the first quarter of 2020, customers concluded 1.9 (1.9) million new financing, leasing, service and insurance contracts with Volkswagen Financial Services (–1.5%). As the Group’s deliveries fell at a higher rate than the number of contracts signed, the penetration rate, expressed as the ratio of leased or financed vehicles to relevant Group delivery volumes, amounted to 39.6 (33.5)%, whereby the credit eligibility criteria were unchanged. The total number of con-tracts at the end of the reporting period stood at 21.6 million, 0.5% more than at the end of 2019. The number of contracts in the customer financing/leasing area was 11.2 (11.2) mil-lion, while it increased to 10.4 (10.3) million in the service/ insurance area. At the end of the reporting period, Volks-wagen Bank managed 1.3 (1.4) million deposit accounts. Operating profit improved to €654 (638) million in the first three months of 2020. U N I T S A L E S A N D S A L E S R E V E N U E B Y M A R K E T
In the Europe/Other markets region, the Volkswagen Group sold 1.0 million vehicles in the first quarter of this year. This was 16.2% fewer than in the previous year. The impact of the Covid-19 pandemic acted as a drag in Europe particularly from the end of the first quarter onwards. As a result, sales
revenue decreased to €34.5 (38.1) billion owing to the slump in demand. Mix effects had a positive impact.
At 204 thousand vehicles, the Volkswagen Group’s unit sales in the North American markets were down by 9.7% in the reporting period. Sales revenue fell by 4.0% to €9.7 billion. The negative volume effect was partly offset by improve-ments in exchange rates.
In South America we sold 121 (125) thousand vehicles in the period from January to March of this year. Despite lower volumes and the impact of unfavorable exchange rate trends, sales revenue rose to €2.4 (2.3) billion on the back of mix effects.
In the Asia-Pacific region, which was the first to be affected by the Covid-19 pandemic, unit sales by the Volks-wagen Group – including the Chinese joint ventures – fell markedly to a total of 0.6 (1.0) million vehicles in the reporting period. Thanks to an improved mix, sales revenue decreased more slowly to €8.6 (9.3) billion. This figure does not include the sales revenue of our equity-accounted Chinese joint ventures.
In the first three months of 2020, hedging transactions relating to sales revenue in foreign currency had an impact of €–0.2 (+0.2) billion on sales revenue in the Volkswagen Group.
K E Y F I G U R E S B Y M A R K E T F R O M J A N UA RY 1 TO M A R C H 3 1
V E H I C LE SA LE S S A L E S R E V E N U E
Thousand vehicles/€ million 2020 2019 2020 2019
Europe/Other markets 1,024 1,223 34,509 38,063
North America 204 226 9,730 10,140
South America 121 125 2,404 2,348
Asia-Pacific1 588 1,010 8,645 9,255
Hedges on sales revenue – – –233 206
Volkswagen Group1 1,937 2,583 55,054 60,012
1 The sales revenue of the joint venture companies in China is not included in the figures for the Group and the Asia-Pacific market.

26

Interim Consolidated Financial Statements (Condensed) 27Income Statement
Interim Consolidated Financial Statements (Condensed)
Income Statement for the Period January 1 to March 31
V O L K S W A G E N G R OU P D I V I S I ON S
A U T OM O T I V E ¹ F I N A N C I A L SE R V I C E S
€ million 2020 2019 2020 2019 2020 2019
Sales revenue 55,054 60,012 44,650 50,777 10,404 9,236Cost of sales –45,824 –48,324 –37,293 –40,805 –8,531 –7,519Gross result 9,231 11,688 7,357 9,971 1,874 1,717Distribution expenses –4,472 –4,941 –4,148 –4,559 –324 –383Administrative expenses –2,445 –2,271 –1,886 –1,809 –559 –463Other operating income/expense –1,409 –608 –1,125 –437 –284 –171Operating result 904 3,868 197 3,166 707 701Share of the result of equity-accounted investments 129 808 111 799 17 9Interest result and other financial result –351 –605 –343 –629 –8 24Financial result –222 203 –232 169 9 34Earnings before tax 682 4,071 –34 3,336 716 735Income tax expense –165 –1,018 56 –833 –221 –185Earnings after tax 517 3,053 22 2,503 495 550of which attributable to Noncontrolling interests –6 7 –24 –8 18 15 Volkswagen AG hybrid capital investors 117 134 117 134 – – Volkswagen AG shareholders 405 2,912 –71 2,377 477 535 Basic/diluted earnings per ordinary share in €² 0.78 5.78 Basic/diluted earnings per preferred share in €² 0.84 5.84
1 Including allocation of consolidation adjustments between the Automotive and Financial Services divisions. 2 Explanatory information on earnings per share is presented in the “Earnings per share” section.

Statement of Comprehensive Income 28 Interim Consolidated Financial Statements (Condensed)
Statement of Comprehensive Income for the Period January 1 to March 31
€ million 2020 2019
Earnings after tax 517 3,053
Pension plan remeasurements recognized in other comprehensive income Pension plan remeasurements recognized in other comprehensive income, before tax 4,888 –4,086Deferred taxes relating to pension plan remeasurements recognized in other comprehensive income –1,443 1,200
Pension plan remeasurements recognized in other comprehensive income, net of tax 3,445 –2,886Fair value valuation of other participations and securities (equity instruments) that will not be reclassified to profit or loss, net of tax –22 23Share of other comprehensive income of equity-accounted investments that will not be reclassified to profit or loss, net of tax –3 12Items that will not be reclassified to profit or loss 3,419 –2,851
Exchange differences on translating foreign operations Unrealized currency translation gains/losses –1,791 860Transferred to profit or loss – –Exchange differences on translating foreign operations, before tax –1,791 860Deferred taxes relating to exchange differences on translating foreign operations 1 12
Exchange differences on translating foreign operations, net of tax –1,790 872Hedging Fair value changes recognized in other comprehensive income (OCI I) 1,026 –1,820Transferred to profit or loss (OCI I) –336 –209Cash flow hedges (OCI I), before tax 690 –2,029Deferred taxes relating to cash flow hedges (OCI I) –241 593
Cash flow hedges (OCI I), net of tax 450 –1,436Fair value changes recognized in other comprehensive income (OCI II) –579 –518Transferred to profit or loss (OCI II) 341 235Cash flow hedges (OCI II), before tax –238 –283Deferred taxes relating to cash flow hedges (OCI II) 88 85
Cash flow hedges (OCI II), net of tax –150 –198Fair value valuation of receivables and securities (debt instruments) that may be reclassified to profit or loss Fair value changes recognized in other comprehensive income –8 24Transferred to profit or loss 0 0Fair value valuation of receivables and securities (debt instruments) that may be reclassified to profit or loss, before tax –8 24Deferred taxes relating to fair value valuation of receivables and securities (debt instruments) recognized in other comprehensive income 2 –7
Fair value valuation of receivables and securities (debt instruments) that may be reclassified to profit or loss, net of tax –6 17Share of other comprehensive income of equity-accounted investments that may be reclassified to profit or loss, net of tax –5 198Items that may be reclassified to profit or loss –1,502 –547
Other comprehensive income, before tax 3,511 –5,281Deferred taxes relating to other comprehensive income –1,593 1,883
Other comprehensive income, net of tax 1,918 –3,398Total comprehensive income 2,435 –345of which attributable to
Noncontrolling interests –58 6Volkswagen AG hybrid capital investors 117 134Volkswagen AG shareholders 2,376 –485

Interim Consolidated Financial Statements (Condensed) 29Balance Sheet
Balance Sheet as of March 31, 2020 and December 31, 2019
V O L K S W A G E N G R OU P D I V I S I ON S
A U T OM O T I V E ¹ F I N A N C I A L SE R V I C E S
€ million 2020 2019 2020 2019 2020 2019
Assets Noncurrent assets 297,752 300,608 152,032 153,736 145,719 146,873Intangible assets 66,019 66,214 65,832 66,010 188 204Property, plant and equipment 64,507 66,152 63,390 65,043 1,117 1,110Lease assets 49,910 48,938 1,748 2,084 48,162 46,853Financial services receivables 84,254 86,973 –417 –390 84,671 87,363Investments, equity-accounted investments and other equity investments, other receivables and financial assets 33,061 32,331 21,479 20,989 11,582 11,342Current assets 193,399 187,463 99,395 93,081 94,004 94,382Inventories 48,877 46,742 44,110 41,898 4,767 4,844Financial services receivables 57,028 58,615 –628 –640 57,656 59,255Other receivables and financial assets 39,698 38,620 19,564 17,803 20,134 20,817Marketable securities 18,468 16,769 14,987 13,546 3,481 3,223Cash, cash equivalents and time deposits 28,449 25,923 20,483 19,679 7,966 6,243Assets held for sale 879 795 879 795 – –Total assets 491,151 488,071 251,427 246,816 239,724 241,255 Equity and Liabilities Equity 125,886 123,651 95,053 92,774 30,833 30,877
Equity attributable to Volkswagen AG shareholders 111,495 109,117 81,307 78,872 30,188 30,246
Equity attributable to Volkswagen AG hybrid capital investors 12,576 12,663 12,576 12,663 – –Equity attributable to Volkswagen AG shareholders and hybrid capital investors 124,071 121,781 93,883 91,535 30,188 30,246Noncontrolling interests 1,815 1,870 1,170 1,239 645 631Noncurrent liabilities 182,212 196,497 82,432 90,822 99,780 105,675Financial liabilities 103,139 113,556 13,123 17,592 90,015 95,965Provisions for pensions 36,666 41,389 35,992 40,631 674 759Other liabilities 42,408 41,551 33,317 32,600 9,091 8,951Current liabilities 183,053 167,924 73,942 63,220 109,111 104,703Financial liabilities 103,334 87,912 2,946 –7,312 100,388 95,224Trade payables 22,035 22,745 19,382 19,603 2,653 3,142Other liabilities 57,327 56,896 51,258 50,559 6,070 6,337Liabilities associated with assets held for sale 356 370 356 370 – –Total equity and liabilities 491,151 488,071 251,427 246,816 239,724 241,255
1 Including allocation of consolidation adjustments between the Automotive and Financial Services divisions, primarily intragroup loans.

Statement of Changes in Equity 30 Interim Consolidated Financial Statements (Condensed)
Statement of Changes in Equity
O T H E R R E S E R V E S
€ million Subscribed capital Capital reserve Retained earningsCurrency
translation reserve
Balance at Jan. 1, 2019 1,283 14,551 91,105 –3,576Earnings after tax – – 2,912 –Other comprehensive income, net of tax – – –2,885 872Total comprehensive income – – 27 872Disposal of equity instruments – – – –Capital increases/Capital decreases – – – –Dividends payment – – – –Capital transactions involving a change in ownership interest – – 401 29Other changes – – 28 –Balance at Mar. 31, 2019 1,283 14,551 91,561 –2,675 Balance at Jan. 1, 2020 1,283 14,551 96,929 –2,824Earnings after tax – – 405 –Other comprehensive income, net of tax – – 3,429 –1,723Total comprehensive income – – 3,835 –1,723Disposal of equity instruments – – – –Capital increases/Capital decreases – – – –Dividends payment – – – –Capital transactions involving a change in ownership interest – – – –Other changes – – 2 –Balance at Mar. 31, 2020 1,283 14,551 100,765 –4,547

Interim Consolidated Financial Statements (Condensed) 31Statement of Changes in Equity
H E D G I N G
Cash flowhedges (OCI I)
Deferred costs of hedging
(OCI II)Equity and debt
instruments
Equity-accounted
investments
Equityattributable to
Volkswagen AGhybrid capital
investors
Equityattributable to
Volkswagen AGshareholders and
hybrid capitalinvestors
Equityattributable tononcontrolling
interests Total equity
1,790 –629 –230 228 12,596 117,117 225 117,342– – – – 134 3,046 7 3,053
–1,436 –198 40 210 – –3,397 –1 –3,398–1,436 –198 40 210 134 –351 6 –345
– – – – – – – –– – – – – – – –– – – – –204 –204 – –2040 0 0 –3 – 429 255 684– – – – – 28 2 30
354 –827 –190 435 12,525 117,019 489 117,507
95 –977 –235 295 12,663 121,781 1,870 123,651– – – – 117 523 –6 517
453 –150 –28 –10 – 1,970 –52 1,918453 –150 –28 –10 117 2,493 –58 2,435
– – – – – – – –– – – – – – – –– – – – –204 –204 – –204– – – – – – – –– – – – – 2 3 5
548 –1,127 –263 285 12,576 124,071 1,815 125,886

Cash flow statement 32 Interim Consolidated Financial Statements (Condensed)
Cash flow statement for the Period January 1 to March 31
VOLKSWAGEN GROUP DIVISIONS AUTOMOTIVE¹ F INANCIAL SERVICES
€ million 2020 2019 2020 2019 2020 2019
Cash and cash equivalents at beginning of period 24,329 28,113 18,098 23,354 6,231 4,759Earnings before tax 682 4,071 –34 3,336 716 735Income taxes paid –875 –796 –722 –460 –154 –337Depreciation and amortization expense² 6,438 5,925 4,188 3,935 2,250 1,990Change in pension provisions 164 –6 162 –10 2 4Share of the result of equity-accounted investments –124 1,159 –107 1,168 –17 –9Other noncash income/expense and reclassifications³ 1,162 66 1,429 140 –267 –75Gross cash flow 7,446 10,418 4,917 8,110 2,530 2,308Change in working capital –5,553 –7,569 –3,371 –2,745 –2,182 –4,824
Change in inventories –3,314 –3,301 –3,270 –3,349 –44 48Change in receivables –96 –4,017 –358 –3,605 262 –413Change in liabilities 1,153 4,123 1,347 2,994 –194 1,129Change in other provisions –1,153 1,463 –1,208 1,476 55 –13Change in lease assets (excluding depreciation) –3,325 –2,769 105 –269 –3,430 –2,500Change in financial services receivables 1,182 –3,067 13 7 1,169 –3,075
Cash flows from operating activities 1,894 2,849 1,546 5,364 348 –2,515Cash flows from investing activities attributable to operating activities –4,129 –3,414 –4,064 –3,375 –65 –39of which: Investments in intangible assets (excluding capitalized development costs), property, plant and equipment, and investment property –2,126 –2,059 –2,087 –2,008 –39 –51
capitalized development costs –1,564 –1,147 –1,564 –1,147 – –acquisition and disposal of equity investments –549 –276 –511 –274 –38 –1
Net cash flow4 –2,236 –565 –2,518 1,990 283 –2,555 Change in investments in securities, loans and time deposits –2,459 –782 –2,115 –5,308 –344 4,526
Cash flows from investing activities –6,588 –4,196 –6,179 –8,682 –409 4,487Cash flows from financing activities 7,527 –7,399 5,677 –6,085 1,850 –1,314
of which: capital transactions with noncontrolling interests – –19 – –19 – –capital contributions/capital redemptions – – – 2 – –2MAN noncontrolling interest shareholders: compensation payments and acquisition of shares tendered – –1,063 – –1,063 – –
Effect of exchange rate changes on cash and cash equivalents –267 372 –204 324 –63 48Change of loss allowance within cash & cash equivalents –1 1 –1 1 0 0Net change in cash and cash equivalents 2,565 –8,373 840 –9,079 1,725 706 Cash and cash equivalents at Mar. 315 26,894 19,740 18,938 14,275 7,956 5,465Securities, loans and time deposits 30,325 28,999 14,928 14,030 15,397 14,970Gross liquidity 57,219 48,739 33,866 28,305 23,354 20,435Total third-party borrowings –206,482 –192,793 –16,078 –12,314 –190,404 –180,479Net liquidity at Mar. 316 –149,263 –144,054 17,787 15,991 –167,050 –160,044
For information purposes: at Jan. 1 –148,040 –134,735 21,276 19,368 –169,316 –154,103
1 Including allocation of consolidation adjustments between the Automotive and Financial Services divisions. 2 Net of impairment reversals. 3 These relate mainly to the fair value measurement of financial instruments and the reclassification of gains/losses on disposal of noncurrent assets and equity investments to
investing activities. 4 Net cash flow: cash flows from operating activities, net of cash flows from investing activities attributable to operating activities (investing activities excluding change in investments
in securities, loans and time deposits). 5 Cash and cash equivalents comprise cash at banks, checks, cash-in-hand and call deposits. 6 The total of cash, cash equivalents, securities, loans to affiliates and joint ventures as well as time deposits net of third-party borrowings (noncurrent and current financial liabilities).
Explanatory notes on the cash flow statement are presented in the section relating to the cash flow statement.

Interim Consolidated Financial Statements (Condensed) 33Notes to the Consolidated Financial Statements
Accounting in accordance with International Financial Reporting Standards (IFRSs)
In accordance with Regulation No. 1606/2002 of the European Parliament and of the Council, Volkswagen AG prepared its consolidated financial statements for 2019 in compliance with the International Financial Reporting Standards (IFRSs), as adopted by the European Union. These interim consolidated financial statements for the period ended March 31, 2020 were therefore also prepared in accordance with IAS 34 (Interim Financial Reporting) and are condensed in scope compared with the consolidated financial statements.
All figures shown are rounded, so minor discrepancies may arise from addition of these amounts. In addition to the reportable segments, the Automotive and Financial Services divisions are presented in the
condensed interim group financial report for explanatory purposes alongside the income statement, balance sheet and cash flow statement for the Volkswagen Group. This supplemental presentation is not required by IFRSs. Eliminations of intragroup transactions between the Automotive and Financial Services divisions are allocated to the Automotive Division.
The accompanying interim consolidated financial statements were reviewed by auditors in accordance with section 115 of the Wertpapierhandelsgesetz (WpHG – German Securities Trading Act).
Accounting policies
Volkswagen AG has applied all accounting pronouncements adopted by the EU and effective for periods beginning on or after January 1, 2020. OT H E R ACCO U N T I N G P O L I C I E S
A discount rate of 1.7% (December 31, 2019: 1.1%) was applied to German pension provisions in the accompanying interim consolidated financial statements.
The income tax expense for the interim consolidated financial statements was calculated on the basis of the average annual tax rate that is expected for the entire fiscal year, in accordance with IAS 34 (Interim Financial Reporting).
In other respects, the same accounting policies and consolidation methods that were used for the 2019 consolidated financial statements are generally applied to the preparation of the interim consolidated financial statements and the measurement of the prior-year comparatives. A detailed description of the policies and methods applied is published in the “Accounting policies” section of the notes to the 2019 consolidated financial statements.
In addition, details of the effects of new standards can be found in the “New and amended IFRSs not applied” section. The 2019 consolidated financial statements can also be accessed on the Internet at www.volkswagenag.com/en/InvestorRelations.html.
Notes to the Consolidated Financial Statements

Notes to the Consolidated Financial Statements 34 Interim Consolidated Financial Statements (Condensed)
Key events
On September 18, 2015, the US Environmental Protection Agency (EPA) publicly announced in a “Notice of Violation” that irregularities in relation to nitrogen oxide (NOX) emissions had been discovered in emissions tests on certain vehicles of Volkswagen Group with type 2.0 l diesel engines in the USA. This was followed by further reports on the scope of the diesel issue. Detailed information can be found in the “Key events” section of the 2019 consolidated financial statements.
There was no need to recognize any special items in connection with the diesel issue in the first three months of 2020.
Based on the information as it exists and has been established, there continue to be no conclusive findings or assessments available to the Board of Management of Volkswagen AG that would suggest that a different assessment of the associated risks should have been made.
Further information on the litigation in connection with the diesel issue can be found in the “Litigation” section. The Covid-19 pandemic, which caused a global decline in demand and, to some extent, continuing production stoppages, adversely affected the financial position and performance of the Volkswagen Group in the first quarter.
Last year's impairment tests of intangible assets, especially goodwill, and of property, plant and equipment were reviewed as of March 31, 2020 to verify the carrying amounts of these assets. Since Volkswagen currently assumes that the pandemic is a temporary event that will not have any lasting negative impact on the Group’s long-term business performance, a number of different scenarios have been drawn up for 2020 for comparison with the most recently approved plans. Please refer to our comments in the interim management report for information on the developments expected in the global automotive markets. Furthermore, the weighted average cost of capital (WACC) has been adjusted to March 31, 2020 and individual parameters for financial assets have also been adjusted. Overall, the review has not led to any material additional impairment losses on assets.
Due to the turbulence in the commodity and capital markets, the treatment of derivatives to which hedge accounting is not applied and the measurement of receivables and liabilities denominated in foreign currencies led to the recognition of expenses of €1.3 billion (previous year: income of €0.2 billion) in the other operating result.
Basis of consolidation
In addition to Volkswagen AG, which is domiciled in Wolfsburg and entered in the commercial register at the Braunschweig Local Court under No. HRB 100484, the consolidated financial statements comprise all significant German and non-German subsidiaries, including structured entities, that are controlled directly or indirectly by Volkswagen AG. This is the case if Volkswagen AG obtains power over the potential subsidiaries directly or indirectly from voting rights or similar rights, is exposed or has rights to, positive or negative variable returns from its involvement with the subsidiaries, and is able to influence those returns. Aside from the companies mentioned on pages 209 to 210 of the Volkswagen Group’s 2019 consolidated financial statements, the following consolidated German subsidiaries with the legal form of a corporation or partnership meet the criteria set out in section 264(3) or section 264b of the Handelsgesetzbuch (HGB – German Commercial Code) due to their inclusion in the consolidated financial statements and have as far as possible exercised the option not to publish annual financial statements: Audi München GmbH, Munich, Auto & Service PIA GmbH, Munich, MAHAG Automobilhandel und Service GmbH & Co. oHG, Munich, MAHAG Sportwagen Zentrum Albrechtstraße GmbH, Munich, Schwaba GmbH, Augsburg, and SZM Sportwagen Zentrum München GmbH, Munich.
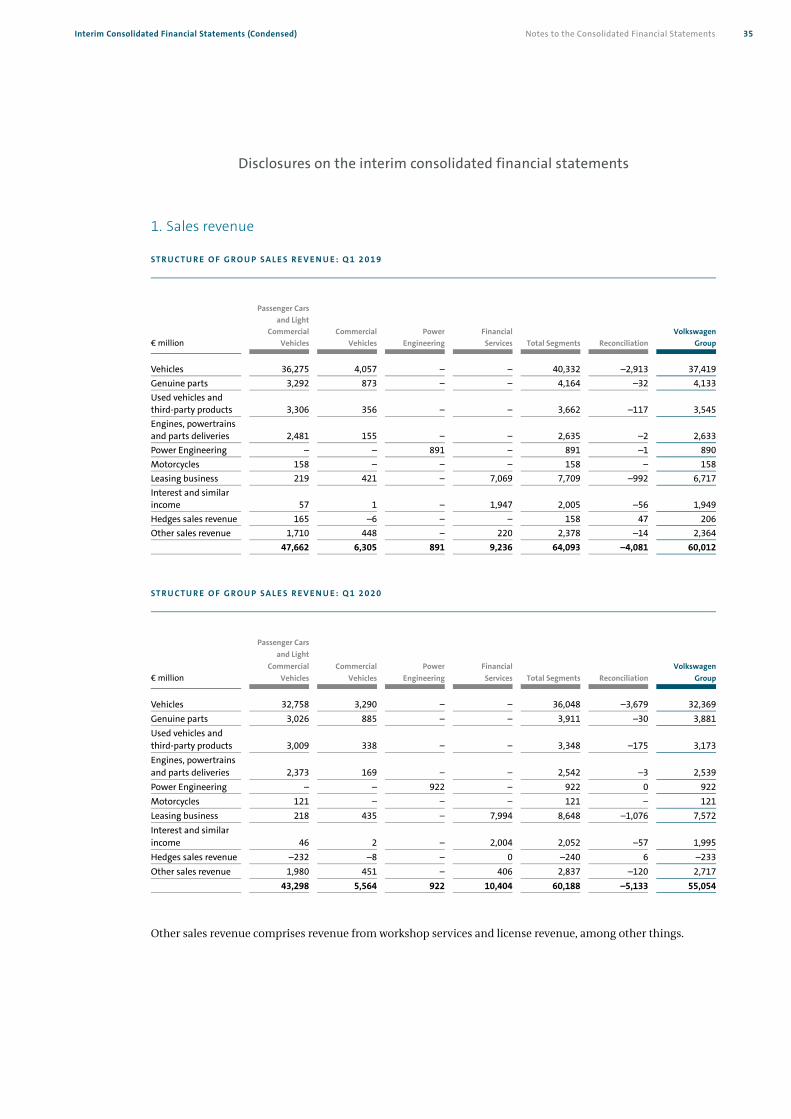
Interim Consolidated Financial Statements (Condensed) 35Notes to the Consolidated Financial Statements
Disclosures on the interim consolidated financial statements
1. Sales revenue
ST R U C T U R E O F G R O U P S A L E S R E V E N U E : Q 1 2 0 1 9
€ million
Passenger Cars and Light
Commercial Vehicles
CommercialVehicles
PowerEngineering
Financial Services Total Segments Reconciliation
Volkswagen Group
Vehicles 36,275 4,057 – – 40,332 –2,913 37,419Genuine parts 3,292 873 – – 4,164 –32 4,133Used vehicles and third-party products 3,306 356 – – 3,662 –117 3,545Engines, powertrains and parts deliveries 2,481 155 – – 2,635 –2 2,633Power Engineering – – 891 – 891 –1 890Motorcycles 158 – – – 158 – 158Leasing business 219 421 – 7,069 7,709 –992 6,717Interest and similar income 57 1 – 1,947 2,005 –56 1,949Hedges sales revenue 165 –6 – – 158 47 206Other sales revenue 1,710 448 – 220 2,378 –14 2,364 47,662 6,305 891 9,236 64,093 –4,081 60,012
ST R U C T U R E O F G R O U P S A L E S R E V E N U E : Q 1 2 0 2 0
€ million
Passenger Cars and Light
Commercial Vehicles
CommercialVehicles
PowerEngineering
Financial Services Total Segments Reconciliation
Volkswagen Group
Vehicles 32,758 3,290 – – 36,048 –3,679 32,369Genuine parts 3,026 885 – – 3,911 –30 3,881Used vehicles and third-party products 3,009 338 – – 3,348 –175 3,173Engines, powertrains and parts deliveries 2,373 169 – – 2,542 –3 2,539Power Engineering – – 922 – 922 0 922Motorcycles 121 – – – 121 – 121Leasing business 218 435 – 7,994 8,648 –1,076 7,572Interest and similar income 46 2 – 2,004 2,052 –57 1,995Hedges sales revenue –232 –8 – 0 –240 6 –233Other sales revenue 1,980 451 – 406 2,837 –120 2,717 43,298 5,564 922 10,404 60,188 –5,133 55,054
Other sales revenue comprises revenue from workshop services and license revenue, among other things.

Notes to the Consolidated Financial Statements 36 Interim Consolidated Financial Statements (Condensed)
2. Cost of sales
Cost of sales includes interest expenses of €635 million (previous year: €674 million) attributable to the financial services business.
In addition to depreciation and amortization expenses, cost of sales also includes impairment losses on intangible assets, items of property, plant and equipment, and lease assets. The impairment losses identified on the basis of updated impairment tests amount to a total of €178 million (previous year: €223 million). The value in use is used as the basis for calculating impairment losses.
3. Research and development costs
Q 1
€ million 2020 2019 %
Total research and development costs 3,563 3,483 2.3of which: capitalized development costs 1,564 1,147 36.4
Capitalization ratio in % 43.9 32.9 Amortization of capitalized development costs 1,103 891 23.9Research and development costs recognized in profit or loss 3,102 3,227 –3.9
4. Earnings per share
Basic earnings per share are calculated by dividing earnings attributable to Volkswagen AG shareholders by the weighted average number of ordinary and preferred shares outstanding during the reporting period. Since there were no transactions in the reporting period that had a dilutive effect on the number of shares, diluted earnings per share are equivalent to basic earnings per share.
In accordance with Article 27(2) No. 3 of the Articles of Association of Volkswagen AG, preferred shares are entitled to a €0.06 higher dividend than ordinary shares.
Q 1
2020 2019
Weighted average number of:
Ordinary shares – basic/diluted Shares 295,089,818 295,089,818
Preferred shares – basic/diluted Shares 206,205,445 206,205,445
Earnings after tax € million 517 3,053
Noncontrolling interests € million –6 7
Earnings attributable to Volkswagen AG hybrid capital investors € million 117 134
Earnings attributable to Volkswagen AG shareholders € million 405 2,912
of which: basic/diluted earnings attributable to ordinary shares € million 231 1,707
of which: basic/diluted earnings attributable to preferred shares € million 174 1,205
Earnings per ordinary share – basic/diluted € 0.78 5.78
Earnings per preferred share – basic/diluted € 0.84 5.84

Interim Consolidated Financial Statements (Condensed) 37Notes to the Consolidated Financial Statements
5. Noncurrent assets
C H A N G E S I N S E L E C T E D N O N C U R R E N T A S S E T S B E T W E E N J A N UA RY 1 A N D M A R C H 3 1 , 2 0 2 0
€ million Carrying amount
at Jan. 1, 2020
Additions/Changes in
consolidatedGroup
Disposals/Other changes
Depreciationand amortization
Carrying amountat Mar. 31, 2020
Intangible assets 66,214 1,651 552 1,293 66,019Property, plant and equipment 66,152 2,410 1,221 2,834 64,507Lease assets 48,938 6,318 3,064 2,281 49,910
6. Inventories
€ million Mar. 31, 2020 Dec. 31, 2019
Raw materials, consumables and supplies 6,915 6,099Work in progress 4,632 4,110Finished goods and purchased merchandise 31,434 30,617Current lease assets 5,663 5,699Prepayments 234 222Hedges on inventories 0 –6 48,877 46,742
There was no requirement to recognize or reverse significant impairment losses on inventories in the reporting period.
7. Current other receivables and financial assets
€ million Mar. 31, 2020 Dec. 31, 2019
Trade receivables 16,845 17,941Miscellaneous other receivables and financial assets 22,853 20,678 39,698 38,620
In the period January 1 to March 31, 2020, impairment losses and reversals of impairment losses on noncurrent and current financial assets reduced operating profit by €266 million (previous year: €195 million).

Notes to the Consolidated Financial Statements 38 Interim Consolidated Financial Statements (Condensed)
8. Equity
The subscribed capital is composed of 295,089,818 no-par value ordinary shares and 206,205,445 no-par value preferred shares, and amounts to €1,283 million (previous year: €1,283 million).
Most of the noncontrolling interests in equity are attributable to the TRATON GROUP.
9. Noncurrent financial liabilities
€ million Mar. 31, 2020 Dec. 31, 2019
Bonds, commercial paper and notes 82,796 88,986Liabilities to banks 10,668 15,337Deposit business 2,365 2,395Lease liabilities 5,069 5,208Other financial liabilities 2,240 1,629 103,139 113,556
10. Current financial liabilities
€ million Mar. 31, 2020 Dec. 31, 2019
Bonds, commercial paper and notes 42,631 37,893Liabilities to banks 28,741 17,337Deposit business 29,732 30,252Lease liabilities 974 1,002Other financial liabilities 1,256 1,429 103,334 87,912

Interim Consolidated Financial Statements (Condensed) 39Notes to the Consolidated Financial Statements
11. Fair value disclosures
Generally, the principles and techniques used for fair value measurement remained unchanged year-on-year. Detailed explanations of the measurement principles and techniques can be found in the “Accounting policies” section of the 2019 consolidated financial statements.
Fair value generally corresponds to the market or quoted market price. If no active market exists, fair value is determined using valuation techniques, such as by discounting the future cash flows at the market interest rate, or by using recognized option pricing models.
Assets and liabilities measured at fair value through profit or loss consist of derivatives to which hedge accounting is not applied. They include primarily commodity futures, currency forwards relating to commodity futures as well as, in certain cases, interest rate swaps, currency swaps and cross-currency interest rate swaps. Moreover, other equity investments (shares representing an ownership interest of less than 20% as a rule) in partnerships (debt instruments), customer financing receivables whose returns contain more than just interest and principal repayments, and financial assets held in special funds controlled by the Volkswagen Group are measured at fair value through profit or loss. Derivative financial instruments to which hedge accounting is applied are measured at fair value either directly in equity or through profit or loss, depending on the underlying hedged item.
Financial assets measured at fair value through other comprehensive income include equity investments (shares representing an ownership interest of less than 20% as a rule) in corporations (equity instruments) and shares for which the Volkswagen Group normally exercises the option of fair value measurement through other comprehensive income, as well as securities (debt instruments) whose cash flows comprise solely payments of interest and principal and that are held under a business model aimed at both collecting contractual cash flows and selling financial assets. For instruments measured through other comprehensive income, changes in fair value are recognized directly in equity, taking deferred taxes into account. Impairment losses on securities (debt instruments) are recognized through profit or loss.
Uniform valuation techniques and inputs are used to measure fair value. The fair value of Level 2 and Level 3 financial instruments is measured in the individual divisions on the basis of Group-wide specifications.
Reconciliation of balance sheet items to classes of financial instruments
The following table shows the reconciliation of the balance sheet items to the relevant classes of financial instruments, broken down by the carrying amount and fair value of the financial instruments.
The fair value of financial instruments measured at amortized cost, such as receivables and liabilities, is calculated by discounting the carrying amount using a market rate of interest for a similar risk and matching maturity. For reasons of materiality, the fair value of current balance sheet items is generally deemed to be their carrying amount.
The risk variables governing the fair value of the receivables are risk-adjusted interest rates.

Notes to the Consolidated Financial Statements 40 Interim Consolidated Financial Statements (Condensed)
R E CO N C I L I AT I O N O F B A L A N C E S H E E T I T E M S TO C L A S S E S O F F I N A N C I A L I N ST R U M E N T S A S O F D E C E M B E R 3 1 , 2 0 1 9
M E A S UR E D A T F A I R V A L UE
M E A S UR E D A T A M O R T I Z E D
C O S T
DERIVATIVE FINANCIAL
INSTRUMENTS WITHIN HEDGE
ACCOUNTING
N O T A LLOC A TE D T O
A M E A S U R E M E N T
C A T E G OR Y
B A LA N C E S H E E T I T E M
A T D E C . 3 1 , 2 0 1 9
€ million Carrying amount Carrying amount Fair value Carrying amount Carrying amount
Noncurrent assets Equity-accounted investments – – – – 8,169 8,169Other equity investments 54 – – – 1,848 1,902Financial services receivables 288 51,404 52,581 – 35,281 86,973Other financial assets 1,012 3,625 3,628 916 – 5,553Tax receivables – – – – 341 341 Current assets Trade receivables 1 17,940 17,940 – – 17,941Financial services receivables 22 39,936 39,936 – 18,656 58,615Other financial assets 1,477 10,120 10,120 619 – 12,216Tax receivables – 9 9 – 1,181 1,190Marketable securities 16,681 88 88 – – 16,769Cash, cash equivalents and time deposits – 25,923 25,923 – – 25,923Assets held for sale 3 158 158 – 634 795 Noncurrent liabilities Noncurrent financial liabilities – 108,348 110,679 – 5,208 113,556Other noncurrent financial liabilities 943 2,549 2,554 1,007 – 4,499 Current liabilities Current financial liabilities – 86,911 86,911 – 1,002 87,912Trade payables – 22,745 22,745 – – 22,745Other current financial liabilities 817 8,614 8,614 1,427 – 10,858Tax payables – 19 19 – 389 408Liabilities associated with assets held for sale – 44 44 – 326 370

Interim Consolidated Financial Statements (Condensed) 41Notes to the Consolidated Financial Statements
R E CO N C I L I AT I O N O F B A L A N C E S H E E T I T E M S TO C L A S S E S O F F I N A N C I A L I N ST R U M E N T S A S O F M A R C H 3 1 , 2 0 2 0
M E A S UR E D A T F A I R V A L UE
M E A S UR E D A T A M O R T I Z E D
C O S T
D E R I V A T I V E F I N A N C I A L
I N S T R UM E N T S W I T H I N H E D G E
A C C O UN T I N G
N O T A L L O C A T E D T O
A M E A S U R E M E N T
C A T E G OR Y
B A LA N C E S H E E T I T E M
A T M A R . 3 1 , 2 0 2 0
€ million Carrying amount Carrying amount Fair value Carrying amount Carrying amount
Noncurrent assets Equity-accounted investments – – – – 8,355 8,355Other equity investments 35 – – – 2,220 2,255Financial services receivables 253 49,689 51,129 – 34,312 84,254Other financial assets 1,551 3,781 3,562 1,732 – 7,064Tax receivables – – – – 357 357 Current assets Trade receivables 2 16,843 16,843 – – 16,845Financial services receivables 20 38,639 38,639 – 18,369 57,028Other financial assets 1,547 9,893 9,893 2,046 – 13,486Tax receivables – 7 7 – 1,428 1,434Marketable securities 18,374 94 94 – – 18,468Cash, cash equivalents and time deposits – 28,449 28,449 – – 28,449Assets held for sale 3 246 246 – 630 879 Noncurrent liabilities Noncurrent financial liabilities – 98,069 94,877 – 5,069 103,139Other noncurrent financial liabilities 1,821 2,450 2,449 1,553 – 5,824 Current liabilities Current financial liabilities – 102,360 102,360 – 974 103,334Trade payables – 22,035 22,035 – – 22,035Other current financial liabilities 1,582 8,840 8,840 1,303 – 11,725Tax payables – 4 4 – 382 386Liabilities associated with assets held for sale – 44 44 – 312 356
The carrying amount of lease receivables was €52.7 billion (previous year: €53.9 billion) and their fair value was €53.3 billion (previous year: €55.0 billion).

Notes to the Consolidated Financial Statements 42 Interim Consolidated Financial Statements (Condensed)
The following tables contain an overview of the financial assets and liabilities measured at fair value:
F I N A N C I A L A S S E T S A N D L I A B I L I T I E S M E A S U R E D AT F A I R VA L U E B Y L E V E L
€ million Dec. 31, 2019 Level 1 Level 2 Level 3
Noncurrent assets Other equity investments 54 43 0 11Financial services receivables 288 – – 288Other financial assets 1,012 – 595 417
Current assets Trade receivables 1 – – 1Financial services receivables 22 – – 22Other financial assets 1,477 – 1,304 173Marketable securities 16,681 16,681 – –Assets held for sale 3 – – 3
Noncurrent liabilities Other noncurrent financial liabilities 943 – 425 518
Current liabilities Other current financial liabilities 817 – 570 247
€ million Mar. 31, 2020 Level 1 Level 2 Level 3
Noncurrent assets Other equity investments 35 22 0 12Financial services receivables 253 – – 253Other financial assets 1,551 – 1,223 328
Current assets Trade receivables 2 – – 2Financial services receivables 20 – – 20Other financial assets 1,547 – 1,366 181Marketable securities 18,374 18,374 – –Assets held for sale 3 – – 3
Noncurrent liabilities Other noncurrent financial liabilities 1,821 – 816 1,005
Current liabilities Other current financial liabilities 1,582 – 1,325 257
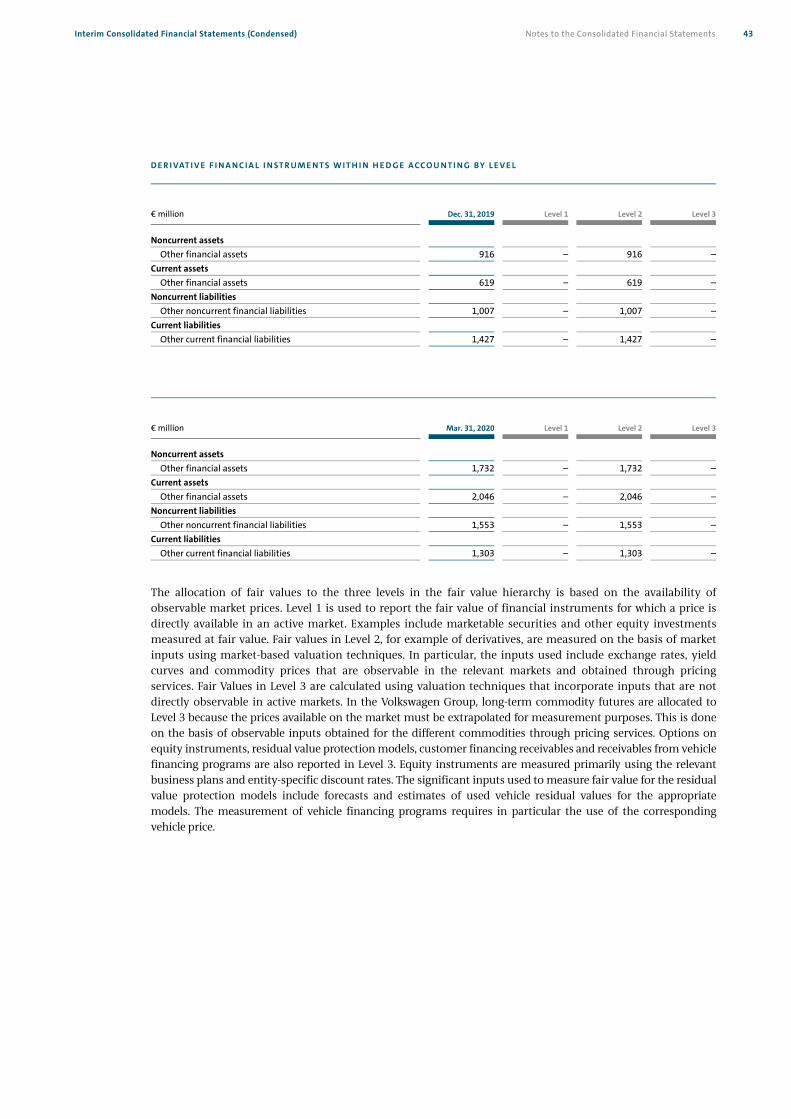
Interim Consolidated Financial Statements (Condensed) 43Notes to the Consolidated Financial Statements
D E R I VAT I V E F I N A N C I A L I N ST R U M E N T S W I T H I N H E D G E A CC O U N T I N G B Y L E V E L
€ million Dec. 31, 2019 Level 1 Level 2 Level 3
Noncurrent assets Other financial assets 916 – 916 –
Current assets Other financial assets 619 – 619 –
Noncurrent liabilities Other noncurrent financial liabilities 1,007 – 1,007 –
Current liabilities Other current financial liabilities 1,427 – 1,427 –
€ million Mar. 31, 2020 Level 1 Level 2 Level 3
Noncurrent assets Other financial assets 1,732 – 1,732 –
Current assets Other financial assets 2,046 – 2,046 –
Noncurrent liabilities Other noncurrent financial liabilities 1,553 – 1,553 –
Current liabilities Other current financial liabilities 1,303 – 1,303 –
The allocation of fair values to the three levels in the fair value hierarchy is based on the availability of observable market prices. Level 1 is used to report the fair value of financial instruments for which a price is directly available in an active market. Examples include marketable securities and other equity investments measured at fair value. Fair values in Level 2, for example of derivatives, are measured on the basis of market inputs using market-based valuation techniques. In particular, the inputs used include exchange rates, yield curves and commodity prices that are observable in the relevant markets and obtained through pricing services. Fair Values in Level 3 are calculated using valuation techniques that incorporate inputs that are not directly observable in active markets. In the Volkswagen Group, long-term commodity futures are allocated to Level 3 because the prices available on the market must be extrapolated for measurement purposes. This is done on the basis of observable inputs obtained for the different commodities through pricing services. Options on equity instruments, residual value protection models, customer financing receivables and receivables from vehicle financing programs are also reported in Level 3. Equity instruments are measured primarily using the relevant business plans and entity-specific discount rates. The significant inputs used to measure fair value for the residual value protection models include forecasts and estimates of used vehicle residual values for the appropriate models. The measurement of vehicle financing programs requires in particular the use of the corresponding vehicle price.

Notes to the Consolidated Financial Statements 44 Interim Consolidated Financial Statements (Condensed)
The table below provides a summary of changes in level 3 balance sheet items measured at fair value: C H A N G E S I N B A L A N C E S H E E T I T E M S M E A S U R E D AT F A I R VA L U E B A S E D O N L E V E L 3
€ million Financial assets
measured at fair valueFinancial liabilities
measured at fair value
Balance at Jan. 1, 2019 990 816
Foreign exchange differences 24 8
Total comprehensive income 44 2
recognized in profit or loss 36 2
recognized in other comprehensive income 8 –
Additions (purchases) 35 1
Sales and settlements –69 –32
Transfers into Level 2 –5 –4
Balance at Mar. 31, 2019 1,016 790
Total gains or losses recognized in profit or loss 36 –2
Net other operating expense/income 40 –2
of which attributable to assets/liabilities held at the reporting date 42 5
Financial result –4 0
of which attributable to assets/liabilities held at the reporting date 4 –
€ million Financial assets
measured at fair valueFinancial liabilities
measured at fair value Assets held for sale
Balance at Jan. 1, 2020 913 765 3
Foreign exchange differences –22 –7 –
Total comprehensive income –81 564 –
recognized in profit or loss –81 564 –
recognized in other comprehensive income – – –
Additions (purchases) 4 – –
Sales and settlements –14 –34 –
Transfers into Level 2 –2 –26 –
Balance at Mar. 31, 2020 796 1,262 3
Total gains or losses recognized in profit or loss –81 –564 –
Net other operating expense/income –79 –564 –
of which attributable to assets/liabilities held at the reporting date –81 –539 –
Financial result –2 – –
of which attributable to assets/liabilities held at the reporting date – – –

Interim Consolidated Financial Statements (Condensed) 45Notes to the Consolidated Financial Statements
The transfers between the levels of the fair value hierarchy are reported at the respective reporting dates. The transfers out of Level 3 into Level 2 comprise commodity futures for which observable quoted prices are now available for measurement purposes due to the decline in their remaining maturities; consequently, no further extrapolation is required. There were no transfers between other levels of the fair value hierarchy.
Commodity prices are the key risk variable for the fair value of commodity futures. Sensitivity analyses are used to present the effect of changes in commodity prices on earnings after tax and equity.
If commodity prices for commodity futures classified as Level 3 had been 10% higher (lower) as of March 31, 2020, earnings after tax would have been €136 million (previous year: €60 million) higher (lower). The equity is not affected.
The key risk variable for measuring options on equity instruments held by the Company is the relevant enterprise value. Sensitivity analyses are used to present the effect of changes in risk variables on earnings after tax.
If the assumed enterprise values at March 31, 2020 had been 10% higher, earnings after tax would have been €3 million (previous year: €2 million) higher. If the assumed enterprise values at March 31, 2020 had been 10% lower, earnings after tax would have been €3 million (previous year: €2 million) lower.
Residual value risks result from hedging agreements with dealers under which earnings effects caused by market-related fluctuations in residual values that arise from buy-back obligations under leases are borne in part by the Volkswagen Group.
The key risk variable influencing the fair value of the options relating to residual value risks is used car prices. Sensitivity analyses are used to quantify the effects of changes in used car prices on earnings after tax.
If the prices of the used cars covered by the residual value protection model had been 10% higher as of March 31, 2020, earnings after tax would have been €347 million (previous year: €328 million) higher. If the prices of the used cars covered by the residual value protection model had been 10% lower as of March 31, 2020, earnings after tax would have been €367 million (previous year: €354 million) lower.
If the risk-adjusted interest rates applied to receivables measured at fair value had been 100 basis points higher as of March 31, 2020, earnings after tax would have been €3 million (previous year: €2 million) lower. If the risk-adjusted interest rates as of March 31, 2020 had been 100 basis points lower, earnings after tax would have been €3 million (previous year: €2 million) higher.
If the corresponding vehicle price used in the vehicle financing programs had been 10% higher as of March 31, 2020, earnings after tax would have been €4 million (previous year: €7 million) higher. If the corresponding vehicle prices used in the vehicle financing programs had been 10% lower as of March 31, 2020, earnings after tax would have been €4 million (previous year: €7 million) lower.
If the result of operations of equity investments measured at fair value had been 10% better as of March 31, 2020, the equity would have been €0.2 million (previous year: €3 million) higher. If the result of operations of equity investments measured at fair value had been 10% worse, the equity would have been €0.2 million (previous year: €3 million) lower.

Notes to the Consolidated Financial Statements 46 Interim Consolidated Financial Statements (Condensed)
12. Cash flow statement
The cash flow statement presents the cash inflows and outflows in the Volkswagen Group and in the Automotive and Financial Services divisions. Cash and cash equivalents comprise cash at banks, checks, cash-in-hand and call deposits.
€ million Mar. 31, 2020 Mar. 31, 2019
Cash, cash equivalents and time deposits as reported in the balance sheet 28,449 22,256Held for sale 117 –Time deposits –1,672 –2,516Cash and cash equivalents as reported in the cash flow statement 26,894 19,740
Cash inflows and outflows from financing activities are presented in the following table:
Q 1
€ million 2020 2019
Capital contributions – –Dividends paid –204 –204Capital transactions with noncontrolling interest shareholders – –19Proceeds from issuance of bonds 6,306 6,808Repayments of bonds –4,726 –6,405Changes in other financial liabilities 6,469 –7,381Repayments of lease liabilities –318 –197 7,527 –7,399
13. Segment reporting
Segments are identified on the basis of the Volkswagen Group’s internal management and reporting. In line with the Group’s multibrand strategy, each of its brands (operating segments) is managed by its own board of management. The Group targets and requirements laid down by the Board of Management of Volkswagen AG must be complied with. Segment reporting comprises four reportable segments: Passenger Cars and Light Commercial Vehicles, Commercial Vehicles, Power Engineering and Financial Services.
The activities of the Passenger Cars and Light Commercial Vehicles segment cover the development of vehicles and engines, the production and sale of passenger cars and light commercial vehicles, and the corresponding genuine parts business. In the Passenger Cars and Light Commercial Vehicles reporting segment, the individual brands are being combined into a single reportable segment, in particular as a response to the high degree of technological and economic interlinking in the production network. Furthermore, there is collaboration within key areas such as procurement, research and development or treasury.
The Commercial Vehicles segment primarily comprises the development, production and sale of trucks and buses, the corresponding genuine parts business and related services. Just as in the case of the car brands, there is collaboration within the areas procurement, development and sales. The aim is to achieve further forms of interlinking.
The activities of the Power Engineering segment consist of the development and production of large-bore diesel engines, turbo compressors, industrial turbines and chemical reactor systems, as well as the production of gear units, propulsion components and testing systems.
The activities of the Financial Services segment comprise dealer and customer financing, leasing, banking and insurance activities, fleet management and mobility services. In this segment, combinations occur especially while taking into account the comparability of the type of services as well as the regulatory situation.
Purchase price allocation for companies acquired is allocated directly to the corresponding segments.

Interim Consolidated Financial Statements (Condensed) 47Notes to the Consolidated Financial Statements
At Volkswagen, segment profit or loss is measured on the basis of the operating result. The reconciliation contains activities and other operations that by definition do not constitute segments. It
also includes the unallocated Group financing activities. Consolidation adjustments between the segments are also contained in the reconciliation.
As a matter of principle, business relationships between the companies within the segments of the Volks-wagen Group are transacted at arm’s length prices. R E P O RT I N G S E G M E N T S : Q 1 2 0 1 9
€ million
Passenger Carsand Light
CommercialVehicles
CommercialVehicles
Power Engineering
FinancialServices
Totalsegments
Reconciliation
VolkswagenGroup
Sales revenue from external customers 44,546 6,047 890 8,447 59,930 83 60,012Intersegment sales revenue 3,116 258 1 788 4,163 –4,163 –Total sales revenue 47,662 6,305 891 9,236 64,093 –4,081 60,012Segment result (operating result) 3,086 420 –56 701 4,151 –283 3,868
R E P O RT I N G S E G M E N T S : Q 1 2 0 2 0
€ million
Passenger Carsand Light
CommercialVehicles
CommercialVehicles
Power Engineering
FinancialServices
Totalsegments
Reconciliation
VolkswagenGroup
Sales revenue from external customers 39,240 5,308 922 9,477 54,948 106 55,054Intersegment sales revenue 4,058 255 0 927 5,240 –5,240 –Total sales revenue 43,298 5,564 922 10,404 60,188 –5,133 55,054Segment result (operating result) 1,391 121 –44 707 2,175 –1,271 904
R E CO N C I L I AT I O N
Q 1
€ million 2020 2019
Segment result (operating result) 2,175 4,151Unallocated activities –25 –20Group financing 2 –16Consolidation/Holding company function¹ –1,248 –248
Operating result 904 3,868Financial result –222 203Consolidated earnings before tax 682 4,071
1 The change compared with the previous year is mainly due to the measurement of derivatives to which hedge accounting is not applied (see disclosure under “Key events”).

Notes to the Consolidated Financial Statements 48 Interim Consolidated Financial Statements (Condensed)
14. Related party disclosures
Porsche SE holds the majority of the voting rights in Volkswagen AG. The creation of rights of appointment for the State of Lower Saxony was resolved at the Extraordinary
General Meeting of Volkswagen AG on December 3, 2009. This means that, even though it holds the majority of voting rights of Volkswagen AG, Porsche SE cannot appoint the majority of the members of Volkswagen AG’s Supervisory Board for as long as the State of Lower Saxony holds at least 15% of Volkswagen AG’s ordinary shares. However, Porsche SE is therefore classified as a related party as defined by IAS 24.
S U P P L I E S A N D SE R V IC E S
R E N D E R E D S U P P L I E S A N D SE R V IC E S
R E C E I V E D Q 1 Q 1
€ million 2 0 2 0 2 0 1 9 2 0 2 0 2 0 1 9
Porsche SE and its majority interests 1 0 0 1Supervisory Board members 1 0 0 0Unconsolidated subsidiaries 352 325 304 384Joint ventures and their majority interests 3,081 3,505 126 122Associates and their majority interests 35 38 193 147State of Lower Saxony, its majority interests and joint ventures 1 1 2 1
R E C E I V A B LE S F R OM
L I A BI L I T I E S ( I N C L UD I N G O B L I G A T I ON S )
T O
€ million Mar. 31, 2020 Dec. 31, 2019 Mar. 31, 2020 Dec. 31, 2019
Porsche SE and its majority interests 4 4 0 0Supervisory Board members 0 0 164 170Unconsolidated subsidiaries 1,345 1,497 1,489 1,667Joint ventures and their majority interests 11,899 12,953 2,493 2,683Associates and their majority interests 364 326 942 1,063State of Lower Saxony, its majority interests and joint ventures 1 1 1 0
The tables above do not contain the dividend payments (net of withholding tax) of €15 million (previous year: €572 million) received from joint ventures and associates.
Receivables from joint ventures are primarily attributable to loans granted in an amount of €7,771 million (December 31, 2019: €8,290 million) as well as trade receivables in an amount of €3,840 million (December 31, 2019: €4,375 million). Receivables from non-consolidated subsidiaries also result from loans granted in an amount of €896 million (December 31, 2019: €938 million) as well as trade receivables in an amount of €166 million (December 31, 2019: €188 million).
Transactions with related parties are conducted on an arm’s length basis. Some of these transactions also include reservation of title clauses.
Obligations to members of the Supervisory Board relate primarily to interest-bearing bank balances of Supervisory Board members that were invested at standard market terms and conditions at Volkswagen Group companies.
In addition, the Volkswagen Group has furnished guarantees to external banks on behalf of related parties in the amount of €335 million (December 31, 2019: €322 million).
Impairment losses of €118 million (previous year: €53 million) were recognized on the outstanding related party receivables. In the first quarter of the year, expenses of €82 million (previous year: €0 million) were incurred in this context.
In the first three months, the Volkswagen Group made capital contributions of €62 million (previous year: €115 million) at related parties.

Interim Consolidated Financial Statements (Condensed) 49Notes to the Consolidated Financial Statements
15. Litigation
Diesel issue
1. Criminal and administrative proceedings worldwide (excluding the USA/Canada) In the criminal proceedings regarding alleged market manipulation relating to capital market disclosure obligations in connection with the diesel issue, the Braunschweig Regional Court has named Volkswagen AG as a collateral participant. 2. Product-related lawsuits worldwide (excluding the USA/Canada) In April 2020, the court in Australia approved the class action settlement that the parties had agreed to.
On February 28, 2020, Volkswagen AG and Verbraucherzentrale Bundesverband e.V. (Federation of Consumer Organizations) entered into an out of court settlement to terminate the consumer action for model declaratory judgment. Under the terms of the settlement, Volkswagen AG will offer individual settlements to consumers who registered claims under the action for model declaratory judgment and meet the settlement criteria. The volume of such settlements amounts to €830 million. Verbraucherzentrale Bundesverband e.V. will withdraw the action for model declaratory judgment. Volkswagen has so far entered into individual settlements with some 200 thousand customers in an aggregate amount of €626 million.
In April 2020, the High Court in England and Wales ruled in the group litigation that the switch logic in the EA 189 engine constituted an unlawful defeat device; the court believed that it was also bound by the findings of the Kraftfahrtbundesamt (German Federal Motor Transport Authority) in this respect. Volkswagen AG disagrees with the High Court's legal position on these preliminary issues and is considering filing an appeal against this decision. The question of liability on the part of Volkswagen AG was not a matter addressed by the decision and will be dealt with at a later stage of the proceedings.
3. Proceedings in the USA/Canada In February 2020, the Montana State Court dismissed certain of the environmental claims asserted by the Montana Attorney General, but allowed other claims to proceed. Volkswagen has asked the Montana Supreme Court to review this decision. Additional important legal cases
In the tax litigation between the Brazilian tax authorities and MAN Latin America, the amount at risk remains unchanged at BRL 3.1 billion. Solely due to exchange rate fluctuations, the risk in euros as disclosed in the notes under contingent liabilities has declined from €0.7 billion to €0.5 billion.
In March 2020, the US District Court for the Northern District of California dismissed two amended class action complaints brought by purchasers of German luxury vehicles alleging that, since the 1990s, several automobile manufacturers, including Volkswagen AG and other Group companies, conspired to unlawfully increase the prices of German luxury vehicles in violation of US antitrust and consumer protection law. The court held that the plaintiffs have not stated a claim for relief because the allegations in the complaints do not plausibly support that the alleged agreements unreasonably restrained competition in violation of US law. The court granted plaintiffs leave to file amended complaints with respect to a limited subset of plaintiffs’ original claims.
In February 2020, the US District Court for the Northern District of California granted final approval of a class action settlement resolving civil claims relating to approximately 98 thousand Volkswagen, Audi, Porsche and Bentley vehicles with automatic transmissions.
Beyond this, there were no significant changes in the reporting period compared with the disclosures on the Volkswagen Group’s expected development in fiscal year 2020 contained in the combined management report in the 2019 Annual Report, specifically in the chapters “Report on Expected Developments” and “Report on Risks and Opportunities” including the section “Legal risks”. In particular, based on the information as it exists and has been established, there continue to be no conclusive findings or assessments available to the Board of Management of Volkswagen AG regarding the described facts that would suggest that a different assessment of the associated risks should have been made.

Notes to the Consolidated Financial Statements 50 Interim Consolidated Financial Statements (Condensed)
16. Contingent liabilities
Compared with the 2019 consolidated financial statements, contingent liabilities declined by €0.7 billion to €8.2 billion, mainly due to currency translation effects.
17. Other financial obligations
At €19.8 billion, other financial liabilities remained virtually unchanged compared with the 2019 consolidated financial statements.

Interim Consolidated Financial Statements (Condensed) Notes to the Consolidated Financial Statements 51
Significant events after the balance sheet date
There were no further events with a significant effect on net assets, financial position and results of operations after the end of the first three months of 2020. Wolfsburg, April 29, 2020 Volkswagen Aktiengesellschaft The Board of Management

Review Report 52 Interim Consolidated Financial Statements (Condensed)
On completion of our review, we issued the following unqualified review report dated March 31, 2020. This report was originally prepared in German. In case of ambiguities the German version takes precedence: To VOLKSWAGEN AKTIENGESELLSCHAFT, Wolfsburg We have reviewed the condensed consolidated interim financial statements - comprising the condensed income statement and condensed statement of comprehensive income, condensed balance sheet, statement of changes in equity, condensed statement of cash flows and selected explanatory notes - and the interim group management report of VOLKSWAGEN AKTIENGESELLSCHAFT, Wolfsburg, for the period from January 1 to March 31, 2020, which are part of the quarterly financial report pursuant to § (Article) 115 WpHG ("Wertpapierhandelsgesetz": German Securities Trading Act). The preparation of the condensed consolidated interim financial statements in accordance with the IFRS applicable to interim financial reporting as adopted by the EU and of the interim group management report in accordance with the provisions of the German Securities Trading Act applicable to interim group management reports is the responsibility of the parent Company's Board of Management. Our responsibility is to issue a review report on the condensed consolidated interim financial statements and on the interim group management report based on our review.
We conducted our review of the condensed consolidated interim financial statements and the interim group management report in accordance with German generally accepted standards for the review of financial statements promulgated by the Institut der Wirtschaftsprüfer (Institute of Public Auditors in Germany) (IDW). Those standards require that we plan and perform the review so that we can preclude through critical evaluation, with moderate assurance, that the condensed consolidated interim financial statements have not been prepared, in all material respects, in accordance with the IFRS applicable to interim financial reporting as adopted by the EU and that the interim group management report has not been prepared, in all material respects, in accordance with the provisions of the German Securities Trading Act applicable to interim group management reports. A review is limited primarily to inquiries of company personnel and analytical procedures and therefore does not provide the assurance attainable in a financial statement audit. Since, in accordance with our engagement, we have not performed a financial statement audit, we cannot express an audit opinion.
Review Report

Interim Consolidated Financial Statements (Condensed) Review Report 53
Based on our review, no matters have come to our attention that cause us to presume that the condensed consolidated interim financial statements have not been prepared, in all material respects, in accordance with the IFRS applicable to interim financial reporting as adopted by the EU nor that the interim group management report has not been prepared, in all material respects, in accordance with the provisions of the German Securities Trading Act applicable to interim group management reports.
We draw attention to the updated information provided in section “Key events” of the notes to the condensed consolidated interim financial statements and in chapter “Report on Expected Developments, Risks and Opportunities” of the interim group management report with regard to the Diesel Issue, which in addition to the explanations of allegations made and claims filed essentially refer to the information provided and statements made in the 2019 consolidated financial statements and in the group management report as at December 31, 2019.
Based on the results of the various measures taken to investigate the issue presented so far, which underlie these condensed consolidated interim financial statements and interim group management report, there is still no evidence that members of the Company’s Board of Management were aware of the deliberate manipulation of engine management software before summer 2015. Nevertheless, should as a result of the ongoing investigation new knowledge be obtained showing that members of the Board of Management were informed earlier about the Diesel Issue, this could eventually have an impact on the condensed interim financial statements and interim group management report as well as on the annual and consolidated financial statements and on the group management report for the financial year 2019 and prior years.
The provisions for warranties and legal risks recorded so far are based on the presented state of knowledge. Due to the inevitable uncertainties associated with the current and expected litigation it cannot be excluded that a future assessment of the risks may be different.
Our opinions on the condensed consolidated interim financial statements and on the interim group management report are not modified in respect of this matter. Hanover, April 29, 2020
PricewaterhouseCoopers GmbH Wirtschaftsprüfungsgesellschaft
Harald Kayser Frank Hübner Wirtschaftsprüfer Wirtschaftsprüfer (German Public Auditor) (German Public Auditor)

54
Selected terms at a glance
Capitalization ratio
The capitalization ratio is defined as the ratio of
capitalized development costs to total research
and development costs in the Automotive
Division. It shows the proportion of primary
research and development costs subject to
capitalization.
Driving Cycles
Levels of fuel consumption and exhaust gas
emissions for vehicles registered in Europe
were previously measured on a chassis dyna-
mometer with the help of the “New European
Driving Cycle (NEDC)”. Since fall 2017, the
existing test procedure for emissions and fuel
consumption used in the EU is being gradually
replaced by the Worldwide Harmonized Light-
Duty Vehicles Test Procedure (WLTP). This
applies for new vehicle types and all new
vehicles. The aim of this new test cycle is to
state CO2 emissions and fuel consumption in a
more practice-oriented manner. A further
important European regulation is the Real
Driving Emissions (RDE) for passenger cars and
light commercial vehicles, which also monitors
emissions using portable emission measuring
technology in real road traffic.
Equity ratio
The equity ratio measures the percentage of
total assets attributable to shareholders’ equity
as of a reporting date. This ratio indicates the
stability and financial strength of the company
and shows the degree of financial indepen-
dence.
Gross margin
Gross margin is the percentage of sales revenue
attributable to gross profit in a period. Gross
margin provides information on profitability
net of cost of sales.
Hybrid notes
Hybrid notes issued by Volkswagen are
classified in their entirety as equity. The issuer
has call options at defined dates during their
perpetual maturities. They pay a fixed coupon
until the first possible call date, followed by a
variable rate depending on their terms and
conditions.
Net cash flow
Net cash flow in the Automotive Division
represents the excess funds from operating
activities available for dividend payments, for
example. It is calculated as cash flows from
operating activities less cash flows from
investing activities attributable to operating
activities.
Net liquidity
Net liquidity in the Automotive Division is the
total of cash, cash equivalents, securities, loans
and time deposits not financed by third-party
borrowings. To safeguard our business activ-
ities, we have formulated the strategic target
that net liquidity in the Automotive Division
should amount to approximately 10 % of the
consolidated sales revenue.
Operating result
Sales revenue, which does not include the
figures for our equity-accounted Chinese joint
ventures, reflects our market success in finan-
cial terms. Following adjustment for our use of
resources, the operating result reflects the
Company’s actual business activity and docu-
ments the economic success of our core busi-
ness.
Operating return on sales
The operating return on sales is the ratio of the
operating result to sales revenue.
Ratio of capex to sales revenue
The ratio of capex (investments in property,
plant and equipment, investment property and
intangible assets, excluding capitalized develop-
ment costs) to sales revenue in the Automotive
Division reflects both our innovative power and
our future competitiveness. It shows our capital
expenditure – largely for modernizing and
expanding our product range and for environ-
mentally friendly drivetrains, as well as for
adjusting the production capacity and improving
production processes – in relation to the Auto-
motive Division’s sales revenue.
Research and development ratio
The research and development ratio (R&D ratio)
in the Automotive Division shows total research
and development costs in relation to sales
revenue. Research and development costs
comprise a range of expenses, from futurology
through to the development of marketable
products. Particular emphasis is placed on the
environmentally friendly orientation of our
product portfolio. The R&D ratio underscores
the efforts made to ensure the Company’s
future viability: the goal of competitive profit-
ability geared to sustainable growth.
Return on sales before tax
The return on sales is the ratio of profit before
tax to sales revenue in a period, expressed as a
percentage. It shows the level of profit gener-
ated for each unit of sales revenue. The return
on sales provides information on the profit-
ability of all business activities before
deducting income tax expense.
Glossary
P U B L I S H E D B Y
Volkswagen AG Group Financial Publications Letterbox 1848 2 38436 Wolfsburg Germany Phone + 49 (0) 5361 9 0 Fax + 49 (0) 5361 9 28282 I N V E STO R R E L AT I O N S
Volkswagen AG Investor Relations Letterbox 1849 38436 Wolfsburg Germany Phone + 49 (0) 5361 9 0 Fax + 49 (0) 5361 9 30411 E-Mail [email protected] Internet www.volkswagenag.com/en/InvestorRelations.html F I N A N C I A L C A L E N DA R July 30, 2020 Half-Yearly Financial Report 2020 October 29, 2020 Interim Report January – September 2020
This Interim Report is also available on the Internet, in German and English, at: www.volkswagenag.com/en/InvestorRelations.html 058.809.596.20
Contact Information

www.volkswagenag.com
20
20