1 virtual reality over wireless networks: quality-of-service model … · quality-of-service model...
TRANSCRIPT

arX
iv:1
703.
0420
9v2
[cs
.IT
] 2
0 Ju
n 20
18
Virtual Reality over Wireless Networks: Quality-of-ServiceModel and Learning-Based Resource Management
Mingzhe Chen∗, Walid Saad†, and Changchuan Yin∗∗Beijing Laboratory of Advanced Information Network, Beijing University of Posts and Telecommunications, Beijing, China 100876,
Emails: [email protected], [email protected].†Wireless@VT, Bradley Department of Electrical and Computer Engineering, Virginia Tech, Blacksburg, VA, USA, Email: [email protected].
Abstract—In this paper, the problem of resource managementis studied for a network of wireless virtual reality (VR) userscommunicating over small cell networks (SCNs). In order tocapture the VR users’ quality-of-service (QoS) in SCNs, a novelVR model, based on multi-attribute utility theory, is proposed.This model jointly accounts for VR metrics such as trackingaccuracy, processing delay, and transmission delay. In this model,the small base stations (SBSs) act as the VR control centers thatcollect the tracking information from VR users over the cellularuplink. Once this information is collected, the SBSs will then sendthe three-dimensional images and accompanying audio to theVR users over the downlink. Therefore, the resource allocationproblem in VR wireless networks must jointly consider boththe uplink and downlink. This problem is then formulated as anoncooperative game and a distributed algorithm based on themachine learning framework of echo state networks (ESNs) isproposed to find the solution of this game. The proposed ESNalgorithm enables the SBSs to predict the VR QoS of eachSBS and is guaranteed to converge to a mixed-strategy Nashequilibrium. The analytical result shows that each user’s VRQoS jointly depends on both VR tracking accuracy and wirelessresource allocation. Simulation results show that the proposedalgorithm yields significant gains, in terms of VR QoS utility,that reach up to 22.2% and 37.5%, respectively, compared to Q-learning and a baseline proportional fair algorithm. The resultsalso show that the proposed algorithm has a faster convergencetime than Q-learning and can guarantee low delays for VRservices.
I. INTRODUCTION
Virtual reality (VR) services will enable users to experienceand interact with virtual and immersive environments througha first-person view [2]. For instance, individuals can use a VRdevice to walk around in a fully immersive world and travelto any destination, within the confines of their own home.Compared to a static high definition (HD) video, a VR video isgenerated based on the users’ movement such as head and eyemovements. Therefore, generating a VR video requires track-ing information related to the users’ interactions with the VRenvironment. In consequence, the tracking accuracy and thedelay of tracking information transmission will significantlyaffect the creation and transmission of VR videos hence affect-ing the users’ experience. Such tracking delay does not exist
This work was supported in part by the National Natural ScienceFoundation of China under Grant 61671086 and Grant 61629101, the 111Project under Grant B17007, the Director Funds of Beijing Key Laboratoryof Network System Architecture and Convergence under Grant 2017BKL-NSAC-ZJ-04, the Beijing Natural Science Foundation under Grant L172032,the BUPT Excellent Ph.D. Students Foundation, and in part by the U.S.National Science Foundation under Grant CNS-1460316.
A preliminary version of this work was published in the IEEE GLOBECOMconference [1].
for regular HD videos and, thus, constitutes a fundamentaldifference between VR and HD videos. If VR devices suchas HTC Vive [3] rely on wired connections to a VR controlcenter, such as a computer, for processing their information,then the users will be significantly restricted in the type ofactions that they can take and the VR applications that they canexperience. To enable truly immersive VR applications, onemust deploy VR systems [4] over wireless cellular networks.In particular, VR systems can use the wireless connectivityof small cell networks (SCNs) [4] in which small cell basestations (SBSs) can act as VR control centers that directlyconnect to the VR devices over wireless links, collect thetracking1 information from the VR devices, and send theVR images to the VR devices over wireless links. However,operating VR devices over SCNs faces many challenges interms of tracking, low delay (typically less than 20 ms), andhigh data rate (typically over 25 Mbps) [4].
A. Related Work
The existing literature has studied a number of problemsrelated to VR such as in [2], [4]–[13]. The authors in [2] and[4] provided qualitative surveys that motivate the deploymentof VR over wireless systems, but these works do not provideany mathematically rigorous modeling. In [5]. the authorsproposed a distortion-aware concurrent multipath data transferalgorithm to minimize the end-to-end video distortion. Thework in [6] deveploped a modeling-based approach to optimizethe high frame rate video transmission over wireless networks.However, the works in [5] and [6] only consider the videocontent transmission which cannot be directly applied to theVR content transmission since the VR contents are generatedbased on the users’ tracking information. In [7], the authorsproposed a streaming scheme that delivers only the visibleportion of a 360◦ video based on head movement prediction.Meanwhile, the authors in [8] developed an algorithm forgenerating high-quality stereo panoramas. The work in [9] pro-posed a real-time solution that uses a single commodity RGB-D camera to track hand manipulation. In [10], a reinforcementlearning algorithm is proposed to guide a user’s movementwithin a VR immersive environment. The authors in [11]proposed an approach based on the three-dimensional (3D)heat maps to address the delay challenges. The work in [12]designed several experiments for quantifying the performance
1Here, tracking pertains to the fact that the immersive VR applications mustcontinuously collect a very accurate localization of each user including thepositions, orientation, and eye movement (i.e., gaze tracking).

of tile-based 360◦ video streaming over a real cellular network.In [13], the authors performed a WiFi experiment for wirelessVR for a single user within a single room. However, beyondthe survey in [4], which motivated the use of VR over wirelessand the WiFi experiment for a single VR user in [13], themajority of existing VR works in [2], [7]–[12] focus on VRsystems that are deployed over wired networks and, as such,they do not capture any challenges of deploying VR overwireless SCNs. Moreover, most of these existing works [2],[4], [7]–[13] focus only on improving a single VR quality-of-service (QoS) metric such as tracking or generation of 3Dimages. Indeed, this prior art does not develop any VR-specificmodel that can capture all factors of VR QoS and, hence,these existing works fall short in addressing the challenges ofoptimizing VR QoS for wireless users.
B. Main Contributions
The main contribution of this paper is a novel frameworkfor enabling wireless cellular networks to integrate VR appli-cations and services. To our best knowledge, this is the first
work that develops a comprehensive framework for analyzing
the performance of VR services over cellular networks. Ourmain contribution include:
• We propose a novel VR model based on multi-attribute
utility theory [14], to jointly capture the tracking ac-curacy, transmission delay, and processing delay thuseffectively quantifying the VR QoS for all wireless users.In this VR model, the tracking information is transmittedfrom the VR users to the SBSs over the cellular uplinkwhile the VR images are transmitted in the downlink fromthe SBSs to their users.
• We analyze resource (resource blocks) allocation jointly
over the uplink and downlink. We formulate the problemas a noncooperative game in which the players are theSBSs. Each player seeks to find an optimal spectrumallocation scheme to optimize a utility function thatcaptures the VR QoS.
• To solve this VR resource management game, we proposea learning algorithm based on echo state networks (ESNs)[15] that can predict the VR QoS value resulting fromresource allocation and reach a mixed-strategy Nash equi-librium (NE). Compared to existing learning algorithms[16]–[18], the proposed algorithm has lower complexity,requires less information due to its neural network nature,and is guaranteed to converge to a mixed-strategy NE.One unique feature of this algorithm is that, after training,it can use the stored ESN information to effectively findan optimal converging path to a mixed-strategy NE.
• We perform fundamental analysis on the gains and trade-offs that stem from changing the number of uplink anddownlink resource blocks for each user. This analyticalresult shows that, in order to improve the VR QoS ofeach user, we can improve the tracking system or increasethe number of the resource blocks allocated to each useraccording to each user’s specific state.
SBS
T acking information
Transmission VR entertainment
transmission
Sensor
Uplink subcarrier
Downlink subcarrier
Fig. 1. A network of immersive VR application.
• Simulation results show that the proposed algorithm canyield, respectively, 22.2% and 37.5% gains in terms ofVR QoS utility compared to Q-learning and proportionalfair algorithm. The results also show that the proposedalgorithm significantly improves the convergence time ofup to 24.2% compared to Q-learning.
The rest of this paper is organized as follows. The problemis formulated in Section II. The resource allocation algorithmis proposed in Section III. In Section IV, simulation results areanalyzed. Finally, conclusions are drawn in Section V.
II. SYSTEM MODEL AND PROBLEM FORMULATION
Consider the downlink transmission of a cloud-based smallcell network (SCN)2 servicing a set U of V wireless VRusers via a set B of B SBSs [20]. Here, we focus onentertainment VR application such as watching immersivevideos and playing immersive games [7]. VR allows usersto be immersed in a virtual environment within which theycan experience a 3D and high-resolution 360◦ vision with 3Dsurround stereo. In particular, immersive VR will provide a360◦ panoramic image for each eye of a VR user. Comparedto a conventional 120◦ image, a 360◦ panoramic image enablesa VR user to have a surrounded vision without any deadspots. However, a 360◦ VR image needs more pixels than atraditional two-dimensional image, and, hence, VR transmis-sion will require more stringent data rate [4] and delay (lessthan 20 ms) requirements than traditional multimedia services.Moreover, for an HD video, we only need to consider thevideo transmission delay as part of the QoS. In contrast, for aVR video, we need to jointly consider the video transmissiondelay, tracking information transmission delay, and the delayof generating the VR videos based on the tracking information.Note that, for VR applications, the transmission delay andprocessing delay will directly determine how each VR videois transmitted and, thus, they are a key determinant of the VRvideo quality.
The SBSs adopt an orthogonal frequency division multipleaccess (OFDMA) technique and transmit over a set of uplinkresource blocks Su and a set of downlink resource blocks Sd,as shown in Fig. 1. The uplink resource blocks are used to
2Since next-generation cellular networks will all rely on a small cellarchitecture [19], we consider SCNs as the basis for our analysis. However,the proposed VR model and algorithm can also be used for any other type ofcellular networks.

TABLE ILIST OF NOTATIONS
Notation Description Notation DescriptionV Number of users Sd, Su Number of downlink and uplink resource blocksB Number of SBSs Sd,Su Sets of downlink and uplink resource blocks
W in Input weight matrix DTij Transmission delay between user i and SBS j
PB Transmit power of SBSs dij Distance between user i and SBS jAj Set of SBS j’s actions cij Data rate of user i associated with SBS j
aj One action of SBS j sdij , s
uij Resource allocation vector
aji Action i of SBS j dj Downlink resource allocation of SBS jW out Output weight matrix uj Average utility function of SBS jNw Number of reservoir units uj Utility function of SBS jKi Tracking accuracy γK Maximal tracking inaccuracyDi Total delay of user i vj Uplink resource allocation of SBS jχ Vector of user’s localization Ui (Di,Ki) Total utility function of user i’s VR QoSλ Learning rate Ui (Di |Ki ) Conditional utility function of user i’s VR QoSDP
i Processing delay of user i Vj Number of users associated with SBS jW Reservoir weight matrix |Aj | Number of SBS j’s actionsµj Reservoir state of SBS j a−j Actions of all SBSs other than SBS j
A Data size of tracking vector L Maximum Data size of each VR image
transmit the data that is collected by the VR sensors placed ata VR user’s headset or near the VR user while the downlinkresource blocks are used to transmit the image displayed oneach user’s VR device. We define the coverage of each SBSas a circular area of radius rB and we assume that each SBSwill only allocate resource blocks to the users located in itscoverage range. Table I provides a summary of the notationsused hereinafter.
A. VR Model
For our VR model, we consider delay and tracking accuracyas the main VR QoS metrics of interest. Based on the accuratelocalization of each user, the SBS can build the immersive andvirtual environment for each user. Among the components ofthe VR QoS, a delay metric can be defined to capture two keyVR service requirements: high data rate and low delay. Next,we will explicitly discuss all the components of the consideredVR QoS metrics.
1) Tracking Model: For any VR QoS metric, trackingconsists of position tracking and orientation tracking [7].VR tracking directly affects the construction of the users’virtual environment since the SBSs need to use each user’slocalization information to construct the virtual environment.Hereinafter, we use the term “localization information” torepresent the information related to the user’s location andorientation. The localization data of each user is used asthe primary component of tracking [4]. The tracking vectorof each user i is χi = [χi1, χi2, χi3, χi4, χi5, χi6], where[χi1, χi2, χi3] represents the position of each VR user while[χi4, χi5, χi6] represents the orientation of each user. Here,we note that the position and orientation of each user aredetermined by the SBS via the information collected by thesensors. For each VR user i, the tracking accuracy Ki
(
suij
)
can be given by:
Ki
(
suij
)
= 1−
∥
∥χi
(
γui
(
suij
))
− χRi
∥
∥
maxsuij
∥
∥χi
(
γui
(
suij
))
− χRi
∥
∥
, (1)
where χi
(
γui
(
suij
))
is the tracking vector transmitted fromthe VR headset to the SBS over wireless links that depends
on the signal-to-interference-plus-noise (SINR) ratio. suij =
[
suij1, . . . , s
uijSu
]
represents the vector of uplink resource
blocks that SBS j allocates to user i with suijk ∈ {1, 0}. Here,
the uplink (downlink) resource blocks are equally divided intoSu (Sd) groups. Hereinafter, the term resource block refers toone of those groups. su
ijk = 1 indicates that resource block
k is allocated to user i. γui
(
suij
)
=[
γ(
suij1
)
, . . . , γ(
suijSu
)]
represents the SINR of SBS j with resource blocks suij where
γ(
suijk
)
=PUhk
ij
σ2+∑
l∈Uk,l 6=i
PUhkil
is the SINR between user i and
SBS j over resource block k. Here, Uk is the set of users thatuse uplink resource block k. PU is the transmit power of useri (assumed to be equal for all users), σ2 is the variance of theGaussian noise and hk
ij,τ = gkij,τd−βij is the path loss between
user i and SBS j over resource block k with gkij,τ being theRayleigh fading parameter, dij the distance between user i
and SBS j, and β the path loss exponent. In χi
(
γui
(
suij,τ
))
,the resource block vector su
ij determines the uplink SINR ofthe tracking vector’s transmission. The tracking vector will besubject to bit errors and, hence, it will depend on the SINRand the resource block vector su
ij .∥
∥χi
(
γui
(
suij
))
− χRi
∥
∥
represents the wireless tracking inaccuracy. χRi is obtained
from the users’ force feedback and transmitted via a dedicatedwireless channel. Force feedback [21] represents the feedbackthat the users send to the SBSs whenever they are not satisfiedwith the displayed VR image. χR
i is only transmitted fromthe users to the SBSs when the users feel uncomfortablein the environment. Since χR
i is not transmitted every timeslot, the SBSs can use orthogonal resource blocks over adedicated channel to transmit χR
i . Thus, χRi is generally much
more accurate than χi
(
γui
(
suij
))
. Note that, (1) is based onnormalized root mean square errors [22], which is a popularmeasure of the difference between two datasets. From (1), wecan see that, when the SINR increases, the bit error rate willdecrease and, hence,
∥
∥χi
(
γui
(
suij
))
− χRi
∥
∥ decreases and thetracking accuracy improves.
2) Delay: Next, we define the delay component that con-sists of the transmission delay and processing (and computing)

delay. The transmission delay of each user i will be:
DTij
(
sdij , s
uij
)
=L
cij(
sdij
) +A
cij(
suij
) , (2)
where L is the maximum size of VR image that each SBSneeds to transmit to its users, A is the size of the trackingvector that each user needs to transmit to the associated SBS,
and cij(
sdij
)
=Sd∑
k=1
sdijkBRlog2
(
1 + γ(
sdijk
))
is the down-
link rate of user i. cij(
suij
)
=Su∑
k=1
suijkBRlog2
(
1+γ(
suijk
))
is the uplink rate of user i. sdij =
[
sdij1, . . . , s
dijSd
]
is thevector of resource blocks that SBS j allocates to user i withsdijk ∈ {0, 1}. sd
ijk = 1 indicates that resource block k is
allocated to user i. γ(
sdijk
)
=PBhk
ij
σ2+∑
l∈Bk,l 6=j
PBhkil
is the signal-
to-interference-plus-noise ratio between user i and SBS j overresource block k with Bk being the set of the SBSs thatuse downlink resource block k. BR is the bandwidth of eachresource block, PB is the transmit power of SBS j (assumedto be equal for all SBSs).
In the VR QoS, the processing delay primarily stems fromthe tracking accuracy. To properly capture the processingdelay, we define a vector l
(
χi
(
γui
(
suij
)))
that representsa VR image of user i constructed by the tracking vectorχi
(
γui
(
suij
))
. l(
χi
(
γui
(
suij
)))
will be typically generatedbefore the SBSs receive the force feedback tracking vector χR
i ,as the VR system will use the historical tracking informationto predict the future tracking vector. When the SBSs receiveχR
i , they must construct l(
χRi
)
based on χRi . The simplest
way of constructing the VR image l(
χRi
)
is to correct itfrom l
(
χi
(
γui
(
suij
)))
to l(
χRi
)
. The processing delay willthen represent the time that an SBS must spend to change theVR image from l
(
χi
(
γui
(
suij
)))
to l(
χRi
)
. The bits that theSBSs use to change the VR image from l
(
χi
(
γui
(
suij
)))
tol(
χRi
)
can be calculated by using the motion search algorithm[23]. The motion search algorithm can find the different pixelsbetween l
(
χi
(
γui
(
suij
)))
and l(
χRi
)
and, hence, an SBS candirectly replace those different pixels [23]. In our model, theVR sensors can accurately collect the VR users’ movement[24]. Moreover, if the SBSs receive accurate tracking data,they can accurately extract each user’s location and orientation.Hence, the tracking accuracy depends only on the data errorthat is caused by the uplink transmission over the wirelesslink. To compute the processing delay, we first assume thatthe total amount of computational resources available at eachSBS is M which is equally allocated to the associated users.M represents the number of bits that can be processed by eachSBS which is determined by each SBS’s central processingunit (CPU). Then, the processing delay can be given by:
DPi
(
Ki
(
suij
))
=υ(
l(
χi
(
γui
(
suij
)))
, l(
χRi
))
M/Nj
, (3)
where 0 ≤ υ(
l(
χi
(
γui
(
suij
)))
, l(
χRi
))
≤ L represents thenumber of bits that must be changed when SBS j transforms
the VR image from l(
χi
(
γui
(
suij
)))
to l(
χRi
)
. v (·) dependson the image size, the number of bits used to store a pixel,and the content of the VR image and is the result of themotion search algorithm. Here, we adopt the motion searchalgorithm of [25] to determine υ
(
l(
χi
(
γui
(
suij
)))
, l(
χRi
))
.When the SINR χi
(
γui
(
suij
))
of user i increases, thebit errors in χi
(
γui
(
suij
))
will decrease. In consequence,υ(
l(
χi
(
γui
(
suij
)))
, l(
χRi
))
will decrease and, hence, theprocessing delay decreases. Here, the SINR χi
(
γui
(
suij
))
of user i depends on the resource blocks suij allocated to
user i. When the deviation between l(
χi
(
γui
(
suij
)))
andl(
χRi
)
increases, more data is needed to correct the image.υ(
l(
χi
(
γui
(
suij
)))
, l(
χRi
))
≤ L is a constraint that capturesthe maximum number of bits that must be corrected. Nj isthe number of the users associated with SBS j and M
Njis the
computation resources allocated to any user i’s VR session.From (3), we can see that the processing delay depends onthe tracking accuracy, the number of the users associated withSBS j, and the resource blocks allocated to user i. The totaldelay of each user i will hence be:
Di
(
sdij , s
uij
)
= DPi
(
Ki
(
suij
))
+DTi
(
sdij , s
uij
)
. (4)
B. Utility Function Model
Next, we use the framework multi-attribute utility theory[14] to define a utility function that can effectively captureVR delay and tracking. Using multi-attribute utility theory,we construct a total utility function that jointly considers thedelay and tracking of the VR QoS. Conventional techniquesfor defining a utility function, such as by directly summing updelay and tracking are only valid under the assumption thatdelay and tracking are independent and that their relationshipis linear [26, Chapters 2 and 3]. However, for VR, therelationship between the delay and tracking is not necessarilylinear nor independent. Therefore, we use multi-attribute utilitytheory [14] to define the utility function. The defined utilityfunction can assign to each delay and tracking components ofthe VR QoS a unique utility value without any constraints.
In order to construct the total utility function, we firstdefine a conditional utility function for the delay componentof the VR QoS [14]. In the total utility function, bothtracking and delay will contribute to the utility value. Incontrast, in the conditional utility function of delay, only delaycontributes to the utility function and the tracking value isassumed to be given. The method that uses a conditionalutility function to derive the total utility function is anal-ogous to the approach used in probability theory to derivea joint probability distribution from conditional probabilitydistributions [27]. For VR, the total utility function of user i isgiven by Ui
(
Di
(
sdij , s
uij
)
,Ki
(
suij
))
. The conditional utilityfunction of delay, Ui
(
Di
(
sdij , s
uij
) ∣
∣Ki
(
suij
))
, represents thetotal utility function given a certain value of the trackingaccuracy. Based on [14], the conditional utility function of

delay for user i can be given by:
Ui
(
Di
(
sdij , s
uij
) ∣
∣Ki
(
suij
))
=
Dmax,i(Ki(suij))−Di(sd
ij ,Ki(suij))
Dmax,i(Ki(suij))−γD
, Di
(
sdij ,Ki
(
suij
))
≥ γD,
1, Di
(
sdij ,Ki
(
suij
))
< γD,
(5)where γD is the maximal tolerable delay for each VR user(maximum supported by the VR system being used) andDmax,i
(
suij
)
= maxsdij
(
Di
(
sdij , s
uij
))
is the maximum delay
of VR user i given suij . Here, Ui
(
Dmax,i
(
suij
)∣
∣Ki
(
suij
))
=0
and Ui
(
γD∣
∣Ki
(
suij
))
= 1. From (5), we can see that, whenDi
(
sdij , s
uij
)
< γD, the conditional utility value will remain1. This is due to the fact that, when delay Di
(
sdij , s
uij
)
reaches the delay requirement γD, the utility value will reachits maximum of 1. Since delay and tracking are both domi-nant components, we can construct the total utility function,Ui
(
Di
(
sdij , s
uij
)
,Ki
(
suij
))
, that jointly considers the delayand tracking based on [14]. Here, a dominant component
represents the component that will minimize the total utilityfunction regardless of the value of other components. For VRQoS, delay and tracking are both dominant components. Forexample, the VR QoS will be minimized when the value ofthe delay function is at a minimum regardless of the value oftracking accuracy. The use of dominant components such asdelay and tracking will simplify the formulation of the totalutility function [14]. Therefore, the total utility function oftracking and delay will be [14]:
Ui
(
Di
(
sdij , s
uij
)
,Ki
(
suij
)
)
=Ui
(
Di
(
sdij , s
uij
)
∣
∣Ki
(
suij
)
)
Ui
(
Ki
(
suij
))
,
(a)=
1−
∥
∥χi
(
γui
(
suij
))
− χRi
∥
∥
maxs
uij
∥
∥χi
(
γui
(
suij
))
−χRi
∥
∥
Dmax,i
(
Ki
(
suij
))
−Di
(
sdij ,Ki
(
suij
))
Dmax,i
(
Ki
(
suij
))
− γD.
(6)
where Ui
(
Ki
(
suij
))
is the utility function of tracking accu-racy. (a) is obtained by substituting (1) and (5) into (6). From(6), we can see that, the vector of resource blocks allocatedto user i for data transmission, sd
ij , and the resource blocksallocated to user i for obtaining the tracking information,suij , jointly determine the value of the total utility function.
Moreover, this total utility function can assign a unique valueto each tracking and delay component of the VR QoS.
C. Problem Formulation
Our goal is to develop an effective resource allocationscheme that allocates resource blocks so as to maximize theusers’ VR QoS. This maximization jointly considers the cou-pled problems of user association, uplink resource allocation,and downlink resource allocation. This optimization problemcan formalized as follows:
maxs
dij ,s
uij ,Uj
T∑
t=1
∑
j∈B
∑
i∈Uj
Uit
(
Di
(
sdij , s
uij
)
,Ki
(
suij
))
(7)
s. t. |Uj | 6 Vj , ∀j ∈ B, (7a)
sdij,k ∈ {0, 1} , ∀i ∈ U , ∀j ∈ B, (7b)
suij,k ∈ {0, 1} , ∀i ∈ U , ∀j ∈ B, (7c)
where Uj is the set of the VR users associated with SBS j, |Uj |is the number of the VR users associated with SBS j, Vj is thenumber of the VR users located in the coverage of SBS j. Uit
is the utility value of user i at time t. (1a) indicates that thenumber of VR users associated with SBS j must not exceedthe number of VR users located in the coverage of SBS j. (1b)and (1c) indicate that each downlink resource block sd
ij,k oruplink resource block su
ij,k can be allocated to one VR user.In (7), the VR QoS of each SBS depends not only on its
resource allocation scheme but also on the resource allocationdecisions of other SBSs. Consequently, the use of centralizedoptimization for such a complex problem is not possibleas it is largely intractable and yields significant overhead.To overcome this challenge, we formulate a noncooperative
game G =[
B, {Aj}j∈B , {uj}j∈B
]
between the SBSs that
can be implemented in a distributed way. Each player j
has a set Aj ={
aj1, . . . ,aj|Aj |
}
of |Aj | actions. In thisgame, each action of SBS j, aj = (dj ,vj) consists of: (i)
downlink resource allocation vector, dj =[
sd1j , . . . , s
dVjj
]
.
sdij =
[
sij1, . . . , sijSd
]
represents the vector of downlinkresource blocks that SBS j allocates to user i and sijk ∈ {1, 0}
withVj∑
i=1
sdijk = 1. sijk = 1 indicating that channel k is
allocated to user i and sijk = 0 otherwise. Vj is the number ofall users in the coverage area of SBS j, and (ii) uplink resource
allocation vector, vj =[
su1j , . . . , s
uVjj
]
withVj∑
i=1
suijk = 1.
a = (a1,a2, . . . ,aB) ∈ A, represents the action profile of allplayers and A =
∏
j∈B Aj .To maximize the VR QoS of each user, the utility function
of each SBS j can be given by:
uj (aj ,a−j) =
Vj∑
i=1
Ui
(
Di
(
sdij , s
uij
)
,Ki
(
suij
))
, (8)
where aj ∈ Aj is an action of SBS j and a−j denotes theaction profile of all SBSs other than SBS j. Let πj,ai
=
limT→∞
1T
T∑
t=11{aj=aji}= Pr (aj = aji) be the probability that
SBS j uses action aji. Hence, πj =[
πj,aj1, . . . , πj,aj|An|
]
will be a probability distribution for SBS j. We assume thatthe VR transmission is analyzed during a period that consistsof T time slots. Therefore, the average value of the utilityfunction can be given by:
uj (aj ,a−j) = limT→∞
1
T
T∑
t=1
uj (aj ,a−j)
=∑
a∈A
(
uj (aj ,a−j)∏
k∈B
πk,ak
)
. (9)
To solve the proposed resource allocation game, we use theconcept of a mixed-strategy NE, formally [28]:

Definition 1. (mixed-strategy Nash Equilibrium): A mixedstrategy profile π∗ = (π∗
1, . . . ,π∗B) =
(
π∗j ,π
∗−j
)
is a mixed-
strategy Nash equilibrium if, ∀j ∈ B and πj , we have:
uj
(
π∗j ,π
∗−j
)
≥ uj
(
πj ,π∗−j
)
, (10)
where uj (πj ,π−j) =∑
a∈Auj (a)
∏
k∈B
πk,akis the expected
utility of SBS j selecting the mixed strategy πj .
The mixed-strategy NE for the SBSs represents a solutionat which each SBS j can maximize the average VR QoS forits users, given the actions of its opponents.
III. ECHO STATE NETWORKS FOR SELF-ORGANIZING
RESOURCE ALLOCATION
Next, we introduce a learning algorithm used to solve theVR game and find its NE. Since we consider both uplink anddownlink resource allocation, the number of actions will bemuch larger than conventional resource allocation scenariosthat typically consider only uplink or downlink resourceallocation. Therefore, as the number of actions significantlyincreases, by using traditional game-theoretic algorithms suchas fictitious play [29], each SBS may not be able to collectall of the information used to calculate the average utilityfunction. Moreover, using such conventional game-theoreticand learning techniques, the SBSs will typically need to re-runthe entire steps of the algorithm to reach a mixed-strategy NEas the states of the users and network vary. Hence, the delayduring the convergence process of such algorithms may not beable to satisfy the QoS requirement of a dynamic VR network.To satisfy the QoS requirement for the VR transmission ofeach SBS, we propose a learning algorithm based on thepowerful framework of echo state networks (ESN) [30]. Theproposed ESN-based learning algorithm enables each SBS topredict the value of VR QoS that results from each actionand, hence, can reach a mixed-strategy NE without having totraverse all actions. Since the proposed algorithm can store thepast ESN information, then, it can find an optimal convergencepath from the initial state to a mixed-strategy NE. Comparedto our work in [31] that is based on two echo state networkschemes, the proposed algorithm relies on only one echo statenetwork, which reduces complexity. Next, we introduce thecomponents of an ESN-based learning algorithm and, then,we introduce its update process.
A. ESN Components
The proposed ESN-based learning algorithm consists of fivecomponents: a) agents, b) inputs, c) ESN model d), actions,and e) output, defined as follows.• Agent: The agents in our ESN are the SBSs in the set B.• Actions: Each action aj of SBS j jointly considers the
uplink and downlink resource blocks, which is given by:
aj = (dj ,vj) =[
sd1j · · ·s
dVjj
, su1j · · ·s
uVjj
]T. (11)
In order to guarantee that any action always has a non-zero probability to be chosen, the ε-greedy exploration [32]is adopted. This mechanism is responsible for selecting the
actions that each SBS will perform during the learning processwhile harmonizing the tradeoff between exploitation and ex-ploration. Therefore, the probability with which SBS j choosesaction i will be given by:
πj,aj =
1− ε+ ε
|Aj |, arg max
aj∈Aj
uj(aj) ,
ε
|Aj |, otherwise,
(12)
where uτ,j (aj) =∑
a−j∈A−j
uj (aj ,a−j)π−j,a−jis the expected
utility of an SBS j with respect to the actions of its opponents,A−j =
∏
k 6=j,k∈B Ak is the set of actions other than theaction of SBS j and π−j,a−j
=∏
k∈B,k 6=j,
πk,ak. uτ,j (aj) is
the marginal probability distribution over the action set of SBSj. uτ,j (aj) is the average utility function over all SBSs otherthan SBS j while uj (aj ,a−j) is the average utility value overall SBSs. From (12), we can see that each SBS will assign thehighest probability, 1 − ε+ ε
|Aj |, to the action that results in
the maximum utility value, uτ,j . For other actions, the SBSwill assign the probability ε
|Aj |. The value of ε determines the
convergence speed. In this case, as each SBS maximizes theutility uτ,j , the average utility uj reaches maximum. Note that,(12) is used to find the optimal action for each SBS duringthe training stage. After training, the SBSs will directly selectthe optimal action that can maximize uj . To capture the gainthat stems from the change of the number of resource blocksallocated to each user i, we state the following result:
Theorem 1. The gain of user i’s VR QoS due to the changeof the number of resource blocks allocated to user i is:i) The gain of user i that stems from the change of the numberof uplink resource blocks allocated to user i, ∆U u
i , is:
∆U ui =
Lmaxsdij
(cij(sd)) −L
cij(sdij)
Ki
(
suij +∆su
ij
)
maxsdij
(
DTij
(
sd, suij +∆su
ij
))
+DPi
(
suij +∆su
ij
)
− γD
−
L
maxs
dij
(cij (sd))−
L
cij(
sdij
)
Ki
(
suij
)
maxsdij
(
DTij
(
sd, suij
))
+DPi
(
suij
)
−γD,
(13)
ii) The gain of user i that stems from the change of numberof downlink resource blocks allocated to user i, ∆U d
i , is:
∆U di =
Ki(suij)L
(Dmax,i(suij)−γi,D)cij(sd
ij), cij
(
∆sdij
)
≫ cij(
sdij
)
,
Ki(suij)Lcij(∆s
dij)
(Dmax,i(suij)−γi,D)cij(sd
ij), cij
(
∆sdij
)
≪ cij(
sdij
)
,
Ki(suij)L
(Dmax,i(suij)−γi,D)
×cij(∆s
dij)
cij(sdij)
2
+cij(sdij)cij(∆s
dij)
, else.
(14)
Proof. See Appendix A.
From Theorem 1, we can see that the tracking accuracy, Ki,and the number of uplink resource blocks allocated to user i,will directly affect the VR QoS gain of user i. Therefore, in

order to improve the VR QoS of each user, we can eitherimprove the tracking system or increase the number of theresource blocks allocated to each user according to each user’sspecific state. Moreover, the gain due to increasing the numberof downlink resource blocks depends on the values of datarates cij
(
∆sdij
)
and cij(
sdij
)
. Hence, the proposed learningalgorithm needs to choose the optimal resource allocationscheme to maximize the VR users’ QoS.• Input: The ESN input is a vector xτ,j = [x1, · · · , xB ]
T
where xj represents the index of the probability distributionthat SBS j uses at time τ . xτ,j is then used to estimate thevalue of uj that captures the average VR QoS of SBS j.• ESN Model: For each SBS j, the ESN model is a learning
architecture that can find the relationship between the inputxτ,j and output yτ,j , thus building the function between theSBS’s probability distribution and the utility value. Mathemat-ically, the ESN model consists of the output weight matrixW out
j ∈ R|Aj |×(Nw+B) and the dynamic reservoir containing
the input weight matrix W inj ∈ R
Nw×B , and the recurrent
matrix W j =
w11 0 0
0. . . 0
0 0 wNwNw
with Nw being the
number of the dynamic reservoir units. To guarantee that theESN algorithm can predict the utility values, Nw must belarger than the size of the input vector xτ,j [22]. Here, thedynamic reservoir is used to store historical ESN informationthat includes input, reservoir state, and output. Note thatthe historical ESN information can be used to find a fastconverging process from the initial state to the mixed-strategyNE. Here, the number of actions for each SBS determines theoutput weight matrix and recurrent matrix of each ESN. Next,we derive the number of the actions of each SBS j, |Aj |.
Proposition 1. Given the number of the downlink and uplinkresource blocks, Sd and Su, as well as the users located inthe coverage of SBS j, Vj , the number of actions for eachSBS j, |Aj |, is given by:
|Aj | =
(
Sd − 1|N (Vj)| − 1
)
∑
n∈N (Vj)
Vj−1∏
i=1
(
ni
Su −∑i−1
k=1 ni
)
,
where
(
x
y
)
= x(x−1)···(x−y+1)y(y−1)···1 and N (Vj) =
{
n|Vj∑
i=1
ni = Sd, ni > 0
}
with |N (Vj)| being the number of
elements in N (Vj).
Proof. See Appendix B.
Based on Proposition 1, we can determine the matrix sizefor both W out
j and W j . From Proposition 1, we can seethat, as the number of users increases, the number of actionsincreases. Moreover, the increasing number of resource blockswill also increase the number of actions. From Proposition 1,we can also see that the number of actions in the uplink ismuch larger than the number of actions in the downlink. This
TABLE IIESN-BASED LEARNING ALGORITHM FOR RESOURCE ALLOCATION
Inputs: Mixed strategy xτ,j
Initialize: W inj , W j , W out
j , and yj = 0.for each time τ do.
(a) Estimate the value of the utility function based on (16).if τ = 1
(b) Set the mixed strategy πτ,j uniformly.else
(c) Set the mixed strategy πτ,j based on (12).end if
(d) Broadcast the index of the mixed strategy to other SBSs.(e) Receive the index of the mixed strategy as input xτ,j .(f) Perform an action based on πτ,j and calculate the actual
utility value.(e) Update the dynamic reservoir state based on (15).(g) Update the output weight matrix based on (17).
end for
is due to the fact that, in the uplink, the interference of eachuser changes as the resource blocks allocated to each uservary. However, in the downlink, the actions will not affect theinterference of each user.• Output: The output of the ESN-based learning al-
gorithm at time t is a vector of utility values yτ,j =[
yτ,j1, yτ,j2, . . . , yτ,j|Aj |
]
. Here, yτ,ji represents the estimatedvalue of utility uτ,j (aji).
B. ESN-Based Learning Algorithm for Resource Allocation
We now present the proposed ESN-based learning algorithmto find a mixed strategy NE. The proposed learning algorithmcan find an optimal convergence path from any initial stateto a mixed-strategy NE. In particular, the proposed algorithmenables each SBS to reach a mixed-strategy NE by traversingminimum number of strategies after training. In order to findthe optimal convergence path, the proposed algorithm muststore the past ESN information that consists of input, reservoirstates, and output. The past ESN information from time 0 upuntil time τ is stored by the dynamic reservoir state µτ,j . Thedynamic reservoir state of SBS j at time τ is:
µτ,j = f(
W jµτ−1,j +W inj xτ,j
)
, (15)
where f(x) = ex−e−x
ex+e−x is the tanh function. From (15), wecan see that the dynamic reservoir state consists of the pastdynamic reservoir states and the mixed strategy at time τ .Thus, the dynamic reservoir state actually stores the mixedstrategy from time 0 to time τ . Based on the dynamic reservoirstate, the proposed ESN algorithm will combine with theoutput weight matrix to estimate the value of conditional utilityvalue. The estimation of the utility value can be given by:
yτ,j = W outτ,j
[
µτ,j
xτ,j
]
, (16)
where W outτ,j is the output weight matrix at time slot τ . To
enable the ESN to use reservoir state µτ,j to predict the utilityvalue, uτ,ji, due to action aji, we must train the output matrixW out
j using a linear gradient descent approach, which is:
W outτ+1,ji = W out
τ,ji+λ(
uτ,ji − yτ,ji
(
xjτ,j ,aji
))
µTτ,j, (17)
where W outτ,ji is row i of W out
τ,j , λ is the learning rate, anduτ,ji is the actual utility value. Here, yτ,ji is the estimation ofthe utility value uτ,ji. Table II summarizes our algorithm.
C. Convergence of the ESN-Based Learning Algorithm
Now, we analyze the convergence of the proposed ESN-based learning algorithm.
Theorem 2. The proposed ESN-based learning algorithmconverges to the utility value, uj , if any following conditionsis satisfied:i) λ is a constant and min
W inji,xτ,j ,x
′τ,j
W inji
(
xτ,j − x′τ ′,j
)
≥ 2,
where W inji represents the row i of W in
j .ii) λ satisfies the Robbins-Monro conditions [33] (λ (t) >
0,∑∞
t=0 λ (t) = +∞,∑∞
t=0 λ2 (t) < +∞).
Proof. See Appendix C.
From Theorem 2, we can see that the convergence ofthe proposed algorithm depends on the values of the inputweight matrix W in
ji and the input xτ,j . These values alsoaffect the capacity of the ESN’s memory. Here, the memoryof a ESN represents the ability that an ESN can store thepast ESN information. Therefore, the proposed algorithm ofSBS j can converge to the conditional utility function uj
by choosing appropriate W inji and xτ,j . Indeed, the proposed
learning algorithm can converge to uj even when W inji and
xτ,j are generated randomly. This is due to the fact that theprobability of uτ,j = u′
τ ′,j is particularly small since uτ,j
has a larger number of elements (i.e. more than 500). Here,we note that, compared to our work in [31] that uses twoecho state networks to guarantee convergence, the proposedESN algorithm uses only one echo state network and is stillguaranteed to converge as shown in Theorem 2. Moreover,this new proof of convergence, we can invoke our result in thefact that the algorithm will reach a mixed NE follows directlyfrom [31, Theorem 2] to guarantee that the convergence pointwill be a mixed NE, as follows.
Corollary 1. The ESN-based learning algorithm of each SBSj converges to a mixed-strategy Nash equilibrium, with themixed strategy probability π∗
j , ∀j ∈ B.
Based on (12), each SBS will assign the highest proba-bility to the action that results in the maximum value ofuj,max = max
aj∈Aj
uτ,j(aj). Therefore, when each SBS j reaches
the optimal mixed strategy π∗j and the ESN reaches the
maximal utility uj , the maximum value of the average utility
uj can be given by(
1− ε+ ε|Aj |
)
uj,max. Since the mixed-
strategy NE depends on the utility values that are not unique,then, the resulting mixed-strategy NE is not unique. Whilecharacterizing all possible NEs is challenging analytically, inour simulations in Section IV, we will analyze the performanceof different NEs.
D. Implementation and Complexity
The proposed algorithm can be implemented in a distributedway. At the initial state, the reservoir and output of the
ESN will be zero. During each iteration, the output andreservoir of the ESN will be updated based on (15)-(16).Based on the ESN’s output, each SBS will update its mixedstrategy and broadcast the index of this mixed strategy toother SBSs. Compared to the size of VR content and trackinginformation, the size of the index of the strategy is very small(it can be represented with less than 16 bits). Therefore, theseinteractions between SBSs are independent of the networksize and, hence, they incur no notable overhead. The resultingmixed-strategy NE depends on the utility value resulting fromeach action of each SBS.
The objective of our game is to find the equilibrium mixedstrategy for each SBS. Hence, the complexity of the proposedalgorithm depends on the number of mixed strategies. Basedon (12), we can see that the number of mixed strategies isequal to the number of actions. Since the worst-case for eachSBS is to traverse all actions, the worst-case complexity ofthe proposed algorithm is O(|A1|× · · ·× |AB|). However, theworst-case complexity pertains to a rather unlikely scenarioin which all SBSs choose their optimal probability strategiesafter traversing all other mixed strategies during each periodτ and, hence, the probability of occurrence of the worst-
case scenario is(
1− ε|A1|
)|A1|−1
×· · ·×(
1− ε|AB |
)|AB |−13.
Therefore, the proposed algorithm will converge faster than
the worst-case with probability 1−(
1− ε|A1|
)|A1|−1
× · · · ×(
1− ε|AB |
)|AB |−1
. Moreover, as the number of SBSs in-creases, based on Proposition 1, the number of actions for eachSBS significantly decreases. Thus, the worst-case complexityof the proposed algorithm will also decrease. In addition, ourESN-based learning algorithm can use the past informationto predict the value of utility uj and, hence, each SBS canobtain the VR QoS of each SBS without implementing all ofits possible actions, which will also reduce the complexity ofthe proposed algorithm. During the convergence process, theproposed algorithm needs to harmonize the tradeoff betweenexploration and exploitation. Exploration is used to enableeach SBS to explore actions so as to find a better solution.Exploitation refers to the case in which each SBS will usethe current optimal action at this iteration. This tradeoff iscontrolled by the ε-greedy exploration specificed in (12). If weincrease the probability of exploration, the proposed algorithmwill use more actions and, hence, the number of iterationsthat the proposed algorithm requires to reach a mixed-strategyNE will decrease. However, increasing the probability ofexploration may reduce the VR QoS of each user when theselected action is worse than the current optimal action.
3 Based on (12), for each SBS, the probability that the optimal action is
not selected at each iteration is
(
1− ε
|Aj |
)
and hence, the probability that
the optimal action is selected at the last iteration is
(
1− ε
|Aj |
)|Aj |−1
.
Therefore, the probability of all SBSs select their optimal action at last
iteration is(
1− ε|A1|
)|A1|−1× · · · ×
(
1− ε|AB |
)|AB |−1.

TABLE IIISYSTEM PARAMETERS
Parameter Value Parameter Value Parameter ValueF 1000 PB 20 dBm υ 5B 4 Su 5 Sd 5Nw 1000 σ2 -95 dBm rB 25 mNv 6 λ 0.03 A 100 kB
Fig. 2. Total VR QoS utility of each user vs. the tracking and delay utilities.Here, total VR QoS utility refers to (6).
IV. SIMULATION RESULTS AND ANALYSIS
For our simulations, we consider an SCN deployed withina circular area with radius r = 100 m. U = 25 users andB = 4 SBSs are uniformly distributed in this SCN area.The HTC Vive VR device is considered in our simulationsand, hence, the number of pixels for a panoramic image is1920 × 1080 and each pixel is stored in 16 bits [34]. Theflashed rate which represents the update rate of a VR image,is 60 images per second and the factor of compression is150 [4]. Since two panoramic images consist of one VRimage (one panoramic image per eye), the rate requirementfor wireless VR transmission will be 25.32 Mbit/s4. Thebandwidth of each resource block is set to 10×180 kHz [35].We use a standard H.264/AVC video codec. The VR videois encoded at 60 frames per second and the encoding rate ofeach VR video is 4 Mbps. The detailed simulation parametersare listed in Table III. For comparison purposes, we use threebaselines: a) Proportional fair algorithm in [36] that allocatesthe resource blocks based on the number of the resourceblocks needed to maximize each user’s utility value, b) Q-learning algorithm in [37] that has considered the historicalutility value to estimate the future utility value, and c) Optimalheuristic search algorithm. Note that, in order to compare withthe proportional fair algorithm, all SBSs choose the actionwith highest probability among the mixed strategy when theproposed algorithm reaches a mixed-strategy NE. This is usedfor all results in which we compare to proportional fair. Here,the users’ localization data is measured from actual wired HTCVive VR devices and the wireless transmission is simulated, inorder to compute the tracking accuracy. All statistical resultsare averaged over a large number of independent runs.
4Here, for each second, each SBS needs to transmit 1920×1080×16×60×2 = 3, 981, 312, 000 bits = 3796.875 Mbits to each user. Since the factorof compression is 150, the rate requirement is 3796.875.75/150 = 25.3125Mbit/s.
Fig. 3. Total VR QoS utility of each user vs. the tracking and delay utilities.Here, total VR QoS utility refers to (6).
Fig. 2 shows how each user’s VR QoS utility varies as thetracking and delay utilities change. In Fig. 2, different colorsindicate different total VR QoS utilities. From Fig. 2, we cansee that, when the delay (tracking) utility is 0, the total VRQoS utility will be 0 regardless of the tracking (delay) value.Thus, both tracking accuracy and delay will affect the VR QoS.In Fig. 2, we can also see that only when both tracking anddelay utilities are 1, the total VR QoS utility is maximized.This is due to the fact that the multi-attribute utility theorymodel assigns to each tracking and delay components of theVR QoS a unique value. Clearly, it is clear that, the proposedtotal utility function can effectively capture the VR QoS.
Fig. 3 shows how each user’s total utility changes asfunction of the tracking accuracy and the bandwidth of eachdownlink resource block group (Fig. 3 uses a similar colorlegend as Fig. 2). From Fig. 3, we can see that whenthe bandwidth of downlink resource block group (trackingaccuracy) is 0, the total VR QoS utility is 0 regardless of thetracking accuracy (bandwidth of a downlink resource blockgroup). This is due to the fact that the VR QoS depends onboth delay and tracking. This corresponds to a scenario inwhich SBS j has enough downlink bandwidth to send a VRimage to the user while the tracking information is inaccurate.In this case, SBS j cannot construct the accurate VR imagedue to the inaccuracy of user’s localization and, hence, theVR QoS of this user will be 0. Fig. 3 also shows that, whenthe tracking accuracy is 1 and the bandwidth of a downlinkresource block group is over 4 MHz, the total VR QoS utilitywill be maximized. This verifies the result of Theorem 1.
In Fig. 4, we show how the average delay utility for eachuser varies as the number of SBSs increases. From Figs. 4(a)and 4(b), we can see that, as the number of SBSs increases,the average delay utility for each serviced user increases andthe transmission delay of each user decreases. This is due tothe fact that as the number of SBSs increases, the number ofusers located in each SBS’s coverage decreases and, hence,the average delay utility increases. However, as the numberof SBSs keeps increasing, the average delay utility increasesslowly. This stems from the fact that the interference from theSBSs to the users increases as the number of SBSs continuesto increase. Fig. 4(b) also shows that the proposed algorithm

1 2 3 4 5 6
Number of SBSs
0.6
0.65
0.7
0.75
0.8
0.85
0.9
0.95
Ave
rage
del
ay u
tility
of e
ach
serv
iced
use
r ESN-based learning algorithmOptimal heuristic search algorithmQ-learning algorithmProportional fair algorithm
(a) Average delay utility of each serviced user
1 2 3 4 5 6
Number of SBSs
10
12
14
16
18
20
22
24
26
28
Ave
rage
del
ay o
f eac
h se
rvic
ed u
ser
(ms) ESN-based learning algorithm
Optimal heuristic search algorithmQ-learning algorithmProportional fair algorithm
(b) Average delay of each serviced user
Fig. 4. Delay for each serviced user vs. the number of SBSs.
1 2 3 4 5 6
Number of SBSs
0
2
4
6
8
10
12
14
Ave
rage
del
ay o
f eac
h se
rvic
ed u
ser
(ms)
Uplink transmission delayProcessing delayDownlink transmission delay
Fig. 5. Delay for each serviced user vs. the number of SBSs.
achieves up to 19.6% gain in terms of average delay comparedto the Q-learning algorithm for the case with 6 SBSs. In Fig.4(b), we can also see that the proposed ESN-based learningalgorithm enables the wireless VR transmission to meet typicaldelay requirement of VR applications that consists of both thetransmission delay and processing delay (typically 20 ms [38]).These gains stem from the fact that the proposed algorithmuses the past ESN information stored at the ESN model tofind a better solution for the proposed game.
Fig. 5 shows how the transmission and processing delayschange as the number of the SBSs varies. From Fig. 5, wecan see that all delay components of each user decrease asthe number of SBSs increases. This is due to the fact that,
15 20 25 30 35
Number of users
10
12
14
16
18
20
22
24
26
28
30
32
Ave
rage
del
ay o
f eac
h se
rvic
ed u
ser
(ms) ESN-based learning algorithm
Optimal heuristic search algorithmQ-learning algorithmProportional fair algorithm
Fig. 6. Average delay for each serviced user as the number of users varies.
0.05 1 5 10 15 20 25 30 50 100
Delay (ms)
0
0.1
0.2
0.3
0.4
0.5
0.6
0.7
0.8
0.9
1
CD
F
ESN-based learningOptimal heuristic searchQ-learning algorithmProportional fair
Fig. 7. CDFs of the delay resulting from the different algorithms.
as the number of SBSs increases, the users will have moreSBS choices and the distances from the SBSs to the usersdecrease, and, hence, the SINR and the potential resources(resource blocks) allocated to each user will increase.
In Fig. 6, we show how the average delay for each serviceduser changes as the number of VR users varies. From Fig.6, we can see that, as the number of VR users increases, theaverage delay of each VR user increases. This is due to the factthat, as the number of users increases, the number of resourceblocks that is allocated to each VR user decreases. Fig. 6 alsoshows that the deviation between the proposed algorithm andQ-learning increases as the number of VR users increases.This is due to the fact that, as the number of users increases,the number of the users associated with each SBS increases.In consequence, the number of actions for each SBS increasesand, hence, the SBSs need to record more QoS values resultingfrom these actions. Compared to Q-learning that uses a matrixto record the QoS values, the proposed algorithm uses anESN to approximate the function of QoS values and, hence,the proposed algorithm can record more QoS utility valuescompared to Q-learning. Fig. 6 also shows that the proposedalgorithm can yield 29.8% gain of the average delay comparedto proportional fair algorithm. This gain stems from the factthat the proposed algorithm can find the relationship betweenresource block allocation strategies and utility values so as tomaximize the utility values.
Fig. 7 shows the cumulative distribution function (CDF) forthe total delay resulting from all of the considered schemes.
1 2 3 4 5 6
Number of SBSs
2
3
4
5
6
7
8
9
Ave
rage
VR
QoS
util
ity fo
r al
l use
rs ESN-based learning algorithmQ-learning algorithm
(a) Average total VR QoS utility for all users.
1 2 3 4 5 6
Number of SBSs
2
3
4
5
6
7
8
9
10
11
12
Tot
al V
R Q
oS u
tility
for
all u
sers
ESN-based learning algorithmOptimal heuristic search algorithmQ-learning algorithmProportional fair algorithm
(b) Total VR QoS utility for all users
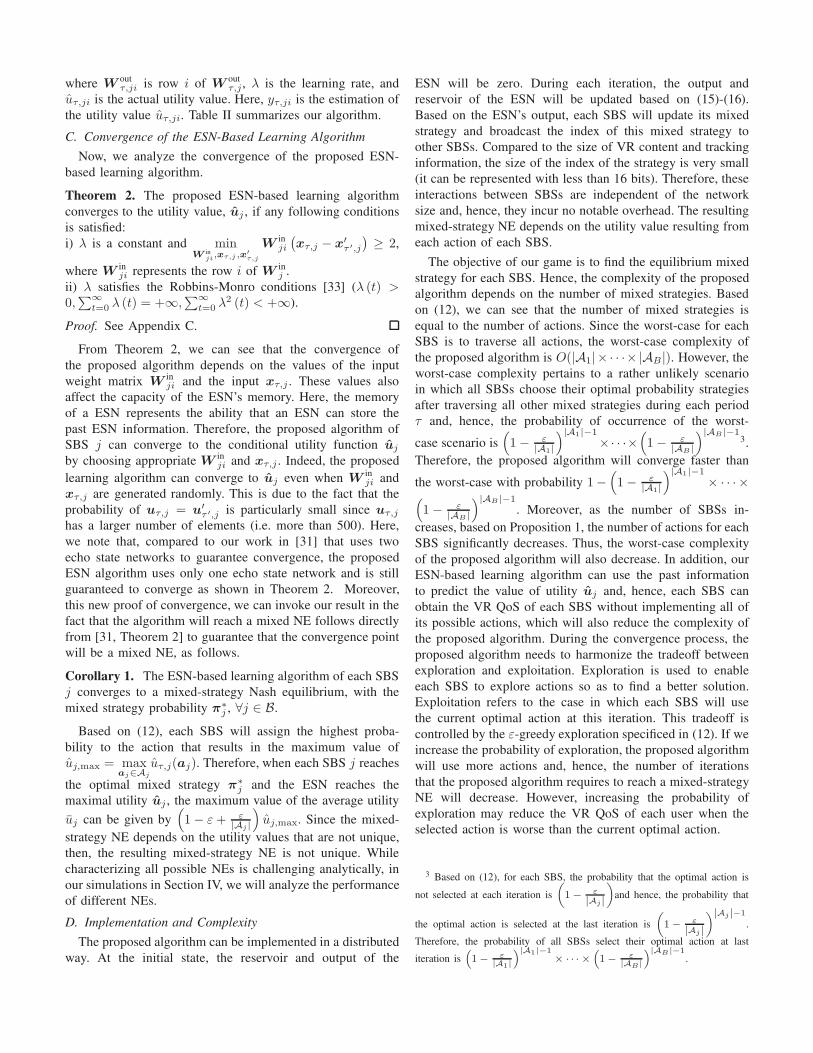
Fig. 8. VR QoS for all users vs. the number of SBSs. Here, total VR QoSutility refers to (8). The proportional fair algorithm and optimal heuristicsearch do not use mixed strategies and, hence, they are not shown in Fig.8(a).
In Fig. 7, we can see that, the delay of 100% of usersresulting from all of the considered algorithms will be above0.05 ms. This is due to the fact that, the delay requirementof each user is higher than 0.05 ms and, hence, when theuser’s delay requirement is satisfied, the SBSs will allocatethe resource blocks to other users. Fig. 7 also shows thatthe proposed approach improves the CDF of up to 25% and50% gains at a delay of 20 ms compared to Q-learning andproportional fair algorithm. These gains stem from the fact thatthe proposed algorithm can estimate the VR QoS resultingfrom each SBS’s actions accurately and, hence, can find abetter solution compared to Q-learning and proportional fairalgorithms. Fig. 7 also shows that there exists a delay variancefor users who achieve the 20 ms delay target. If needed, thenetwork can reduce this variance by adjusting the size of theresource blocks.
Fig. 8 shows how the VR QoS for all users changes as thenumber of SBSs varies. From Figs. 8(a) and 8(b), we can seethat both total utility values and average total utility values (atthe mixed-strategy NE) of all considered algorithms increaseas the number of SBSs increases. This is due to the fact that,as the number of SBSs increases, the number of users locatedwithin the coverage of each SBS increases and the distancesfrom the SBSs to their associated users decrease. Fig. 8(a)
10 15 20 25 30 35
Number of users
3
4
5
6
7
8
9
10
11
12
13
Tot
al V
R Q
oS u
tility
for
all u
sers
ESN-based learning algorithmOptimal heuristic search algorithmQ-learning algorithmProportional fair algorithm
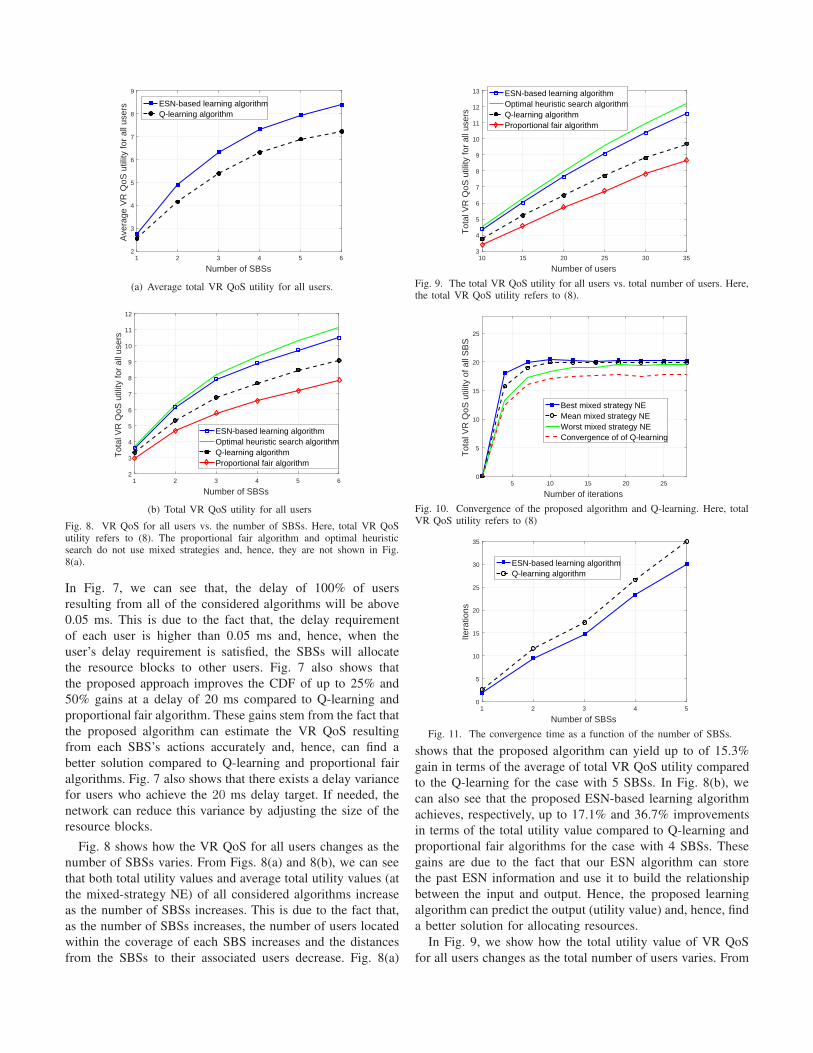
Fig. 9. The total VR QoS utility for all users vs. total number of users. Here,the total VR QoS utility refers to (8).
5 10 15 20 25
Number of iterations
0
5
10
15
20
25
Tot
al V
R Q
oS u
tility
of a
ll S
BS
Best mixed strategy NEMean mixed strategy NEWorst mixed strategy NEConvergence of of Q-learning
Fig. 10. Convergence of the proposed algorithm and Q-learning. Here, totalVR QoS utility refers to (8)
1 2 3 4 5
Number of SBSs
0
5
10
15
20
25
30
35
Itera
tions
ESN-based learning algorithmQ-learning algorithm
Fig. 11. The convergence time as a function of the number of SBSs.
shows that the proposed algorithm can yield up to of 15.3%gain in terms of the average of total VR QoS utility comparedto the Q-learning for the case with 5 SBSs. In Fig. 8(b), wecan also see that the proposed ESN-based learning algorithmachieves, respectively, up to 17.1% and 36.7% improvementsin terms of the total utility value compared to Q-learning andproportional fair algorithms for the case with 4 SBSs. Thesegains are due to the fact that our ESN algorithm can storethe past ESN information and use it to build the relationshipbetween the input and output. Hence, the proposed learningalgorithm can predict the output (utility value) and, hence, finda better solution for allocating resources.
In Fig. 9, we show how the total utility value of VR QoSfor all users changes as the total number of users varies. From

-25 -20 -15 -10 -5 0 5 10 15 20 25-25
-20
-15
-10
-5
0
5
10
15
20
25
CoverageSBSUsers
-25 -20 -15 -10 -5 0 5 10 15 20 25-25
-20
-15
-10
-5
0
5
10
15
20
25
CoverageSBSUsers
(a) Optimal action of the ESN-based algorithm for the users over downlink and uplink
-25 -20 -15 -10 -5 0 5 10 15 20 25-25
-20
-15
-10
-5
0
5
10
15
20
25
CoverageSBSUsers
-25 -20 -15 -10 -5 0 5 10 15 20 25-25
-20
-15
-10
-5
0
5
10
15
20
25
CoverageSBSUsers
(b) Optimal action of proportional fair algorithm for the users over downlink and uplink
Fig. 12. Optimal actions resulting from the different algorithms (Each black arrow represents the downlink resource blocks while each color arrow representsan group of uplink resource blocks).
Fig. 9, we can see that, as the number of users increases, thetotal utility values of all considered algorithms increase. Thisis due to the fact that, in all algorithms, each SBS has a limitedcoverage area and, hence, the number of users located in eachSBS’s coverage increases with the network size. Moreover,since each SBS has a limited number of resource blocks, thenumber of users that can associate with each SBS is alsobounded. In particular, as the number of users located withinthe coverage of a given SBS exceeds the maximal number ofusers that each SBS can provide service, the SBS will onlyservice the users that can maximize the total utility value. TheVR QoS of the remaining users will be 0. In this case, the totalutility value will also increase with the number of the users.From Fig. 9, we can also see that the proposed algorithmachieves, respectively, up to 22.2% and 37.5% gains in termsof the total utility value of VR QoS compared to Q-learningand proportional fair algorithms for the case with 35 users.
Fig. 10 shows the number of iterations needed till con-vergence for both Q-learning and the proposed ESN-basedlearning approach with different mixed-strategy NEs and Q-learning. In this figure, we can see that, as time elapses, thetotal VR QoS utilities for both the proposed algorithm and Q-learning increase until convergence to their final values. Fig. 10also shows that the proposed algorithm for best mixed strategyNE needs 19 iterations to reach convergence while Q-learningneeds 25 iterations to reach convergence. Hence, the proposedalgorithm achieves 24.2% gain in terms of the number of
the iterations needed to reach convergence compared to Q-learning. This is because the ESN in the proposed algorithmcan store the SBSs’ action strategies and its correspondingtotal utility values. Fig. 10 also shows that, different mixed-strategy NEs will result in different total utility values ofall SBSs. However, the total utility values achieved by thesemixed-strategy NEs are very close to each other. Moreover,Fig. 10 also shows that the worst mixed-strategy NE resultingfrom the proposed algorithm can still achieve 14% gain of thetotal utility value compared to Q-learning. Hence, regardlessof the reached NE, the total utility value of the proposedalgorithm will be higher than the utility value achieved byQ-learning.
In Fig. 11, we show how the convergence time changesas the number of SBSs varies. In this figure, we can seethat as the number of the SBSs increases, the convergencetime of both algorithms increases. Indeed, as the number ofSBSs increases, the proposed ESN algorithm will require moretime to accurately calculate the VR QoS utility. From Fig.11, we can also see that as the number of SBSs increases,the difference in the convergence time between the proposedalgorithm and Q-learning increases. This stems from the factthat as the number of SBSs increases, the number of actions foreach SBS decreases and, hence, the number of output weightmatrix used to predict the VR QoS utility for each actiondecreases.
Fig. 12 shows the optimal actions resulting from the pro-
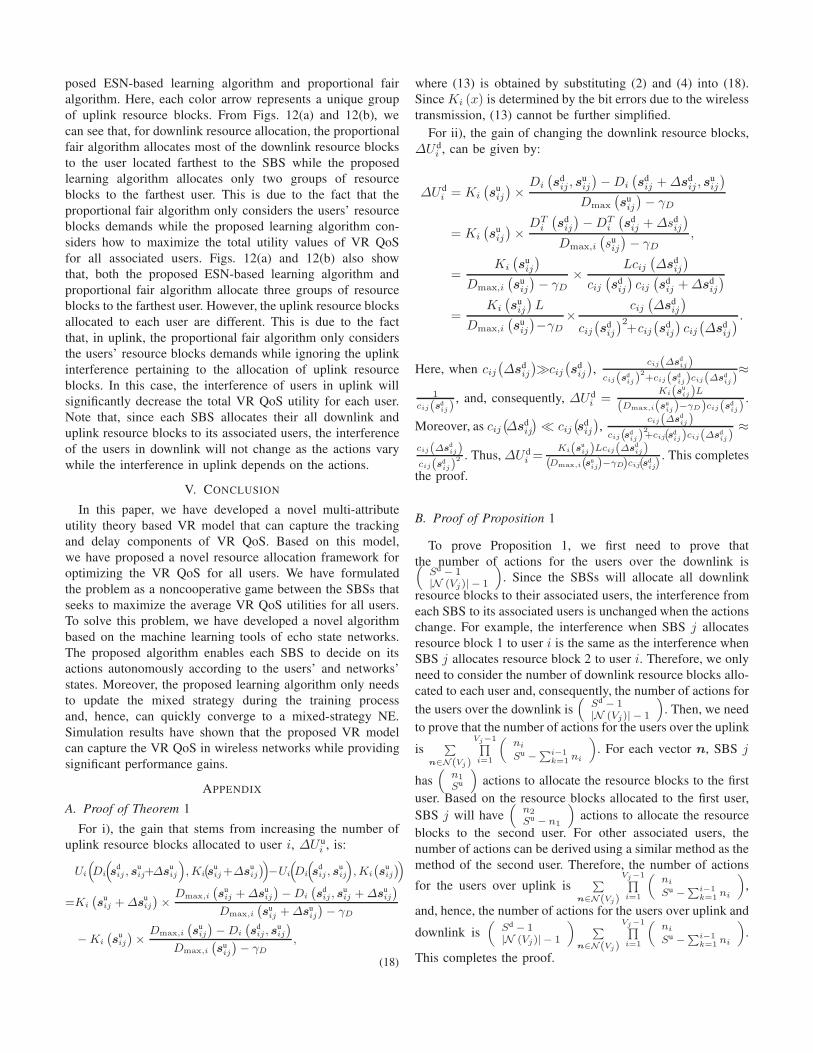
posed ESN-based learning algorithm and proportional fairalgorithm. Here, each color arrow represents a unique groupof uplink resource blocks. From Figs. 12(a) and 12(b), wecan see that, for downlink resource allocation, the proportionalfair algorithm allocates most of the downlink resource blocksto the user located farthest to the SBS while the proposedlearning algorithm allocates only two groups of resourceblocks to the farthest user. This is due to the fact that theproportional fair algorithm only considers the users’ resourceblocks demands while the proposed learning algorithm con-siders how to maximize the total utility values of VR QoSfor all associated users. Figs. 12(a) and 12(b) also showthat, both the proposed ESN-based learning algorithm andproportional fair algorithm allocate three groups of resourceblocks to the farthest user. However, the uplink resource blocksallocated to each user are different. This is due to the factthat, in uplink, the proportional fair algorithm only considersthe users’ resource blocks demands while ignoring the uplinkinterference pertaining to the allocation of uplink resourceblocks. In this case, the interference of users in uplink willsignificantly decrease the total VR QoS utility for each user.Note that, since each SBS allocates their all downlink anduplink resource blocks to its associated users, the interferenceof the users in downlink will not change as the actions varywhile the interference in uplink depends on the actions.
V. CONCLUSION
In this paper, we have developed a novel multi-attributeutility theory based VR model that can capture the trackingand delay components of VR QoS. Based on this model,we have proposed a novel resource allocation framework foroptimizing the VR QoS for all users. We have formulatedthe problem as a noncooperative game between the SBSs thatseeks to maximize the average VR QoS utilities for all users.To solve this problem, we have developed a novel algorithmbased on the machine learning tools of echo state networks.The proposed algorithm enables each SBS to decide on itsactions autonomously according to the users’ and networks’states. Moreover, the proposed learning algorithm only needsto update the mixed strategy during the training processand, hence, can quickly converge to a mixed-strategy NE.Simulation results have shown that the proposed VR modelcan capture the VR QoS in wireless networks while providingsignificant performance gains.
APPENDIX
A. Proof of Theorem 1
For i), the gain that stems from increasing the number ofuplink resource blocks allocated to user i, ∆U u
i , is:
Ui
(
Di
(
sdij , s
uij+∆s
uij
)
,Ki
(
suij+∆s
uij
)
)
−Ui
(
Di
(
sdij , s
uij
)
,Ki
(
suij
)
)
=Ki
(
suij +∆s
uij
)
×Dmax,i
(
suij +∆s
uij
)
−Di
(
sdij , s
uij +∆s
uij
)
Dmax,i
(
suij +∆s
uij
)
− γD
−Ki
(
suij
)
×Dmax,i
(
suij
)
−Di
(
sdij , s
uij
)
Dmax,i
(
suij
)
− γD,
(18)
where (13) is obtained by substituting (2) and (4) into (18).Since Ki (x) is determined by the bit errors due to the wirelesstransmission, (13) cannot be further simplified.
For ii), the gain of changing the downlink resource blocks,∆U d
i , can be given by:
∆U di = Ki
(
suij
)
×Di
(
sdij , s
uij
)
−Di
(
sdij +∆sd
ij , suij
)
Dmax
(
suij
)
− γD
= Ki
(
suij
)
×DT
i
(
sdij
)
−DTi
(
sdij +∆sd
ij
)
Dmax,i
(
suij
)
− γD,
=Ki
(
suij
)
Dmax,i
(
suij
)
− γD×
Lcij(
∆sdij
)
cij(
sdij
)
cij(
sdij +∆sd
ij
)
=Ki
(
suij
)
L
Dmax,i
(
suij
)
−γD×
cij(
∆sdij
)
cij(
sdij
)2+cij
(
sdij
)
cij(
∆sdij
)
.
Here, when cij(
∆sdij
)
≫cij(
sdij
)
,cij(∆s
dij)
cij(sdij)
2+cij(sd
ij)cij(∆sdij)
≈
1
cij(sdij)
, and, consequently, ∆U di =
Ki(suij)L
(Dmax,i(suij)−γD)cij(sd
ij).
Moreover, as cij(
∆sdij
)
≪ cij(
sdij
)
,cij(∆s
dij)
cij(sdij)
2+cij(sd
ij)cij(∆sdij)
≈
cij(∆sdij)
cij(sdij)
2 . Thus, ∆U di =
Ki(suij)Lcij(∆s
dij)
(Dmax,i(suij)−γD)cij(sd
ij). This completes
the proof.
B. Proof of Proposition 1
To prove Proposition 1, we first need to prove thatthe number of actions for the users over the downlink is(
Sd − 1|N (Vj)| − 1
)
. Since the SBSs will allocate all downlink
resource blocks to their associated users, the interference fromeach SBS to its associated users is unchanged when the actionschange. For example, the interference when SBS j allocatesresource block 1 to user i is the same as the interference whenSBS j allocates resource block 2 to user i. Therefore, we onlyneed to consider the number of downlink resource blocks allo-cated to each user and, consequently, the number of actions for
the users over the downlink is(
Sd − 1|N (Vj)| − 1
)
. Then, we need
to prove that the number of actions for the users over the uplink
is∑
n∈N(Vj)
Vj−1∏
i=1
(
ni
Su −∑i−1
k=1 ni
)
. For each vector n, SBS j
has(
n1
Su
)
actions to allocate the resource blocks to the first
user. Based on the resource blocks allocated to the first user,SBS j will have
(
n2
Su − n1
)
actions to allocate the resourceblocks to the second user. For other associated users, thenumber of actions can be derived using a similar method as themethod of the second user. Therefore, the number of actions
for the users over uplink is∑
n∈N(Vj)
Vj−1∏
i=1
(
ni
Su −∑i−1
k=1 ni
)
,
and, hence, the number of actions for the users over uplink and
downlink is(
Sd − 1|N (Vj)| − 1
)
∑
n∈N(Vj)
Vj−1∏
i=1
(
ni
Su −∑i−1
k=1 ni
)
.
This completes the proof.

C. Proof of Theorem 2
In order to prove this theorem, we first need to prove thatthe ESN-based learning algorithm converges to a constantvalue. Here, we do not know the exact value to which theproposed algorithm converges. Hence, our purpose is to provethat the proposed algorithm cannot diverge. Then, we derivethe exact value to which the ESN converges. For i), based on[33, Theorem 8], the conditions of convergence for an ESNare: a) The ESN is k-step unambiguous and b) The ESN-basedlearning process is k order Markov decision process (MDP).Here, the definition of k-step unambiguous can be given by:
Definition 2. Given an ESN with initial state µ0,j , weassume that the input sequence x0,j , . . . ,xτ,j results in aninternal state µτ,j , and the input sequence x′
0,j, . . . ,x′τ ′,j
results in an internal state µ′τ ′,j . If µτ,j = µ′
τ ′,j implies thatxτ−i,j = x′
τ ′−i,j , for all i = 0, . . . , τ , then the ESN is k-stepunambiguous.
Here, uτ,j = u′τ ′,j can be rewritten as:
uτ,j − u′τ ′,j = W j
(
µτ−1,j − µ′τ ′−1,j
)
+W inj
(
xτ,j − x′τ ′,j
)
=
w11
(
µτ−1,j1 − µ′τ ′−1,j1
)
...wNwNw
(
µτ−1,jNw− µ′
τ ′−1,jNw
)
−
W inj1
(
xτ,j − x′τ ′,j
)
...W in
jNw(xτ,j − x′
τ ′,j)
,
where µτ−1,jk is element k of µτ−1,j and µ′τ ′−1,jk element k
of µ′τ ′−1,j . Since the tanh function in (15) ranges from -1 to 1,
the maximum value of(
µτ−1,jk − µ′τ ′−1,jk
)
is 2. As wkk ∈
(−1, 1) , k = 1, . . . , Nw, maxk
wkk
(
µτ−1,jk − µ′τ−1,jk
)
< 2.
In this case, if W injk (xτ,j − x′
τ,j) ≥ 2, then µτ,j−µ′τ ′,j 6= 0.
Therefore, if µτ,j − µ′τ ′,j = 0, then µτ−1,j = µ′
τ ′−1,j andxτ,j = x′
τ ′,j . In this case, an ESN is k-step unambiguouswhen W in
ji (xτ,j − x′τ,j) ≥ 2. Since the dynamic reservoir
can only store limited ESN information [30], the dynamicreservoir state µτ,j only depends on the finite past reservoirstates, i.e., µτ−1,j, . . . ,µτ−k,j . Moreover, the number ofreservoir states and actions in the proposed algorithm is finite.Therefore, the proposed ESN-based algorithm is a k orderMDP and, hence, condition 2) is satisfied. For case 2), ifthe learning rate of the proposed algorithm satisfies Robbins-Monro conditions and the proposed algorithm is a k orderMDP, the proposed algorithm will satisfy the conditions in[31, Theorem 1] and, hence, converges to a region. For bothcases i) and ii), based on [31, Theorem 1], the proposed ESN-based learning algorithm will converge to the utility value, uj .This completes the proof.
REFERENCES
[1] M. Chen, W. Saad, and C. Yin, “Resource management for wirelessvirtual reality: Machine learning meets multi-attribute utility,” in Proc.of IEEE Global Communications Conference (GLOBECOM), Singapore,Dec. 2017.
[2] P. Rosedale, “Virtual reality: The next disruptor: A new kind ofworldwide communication,” IEEE Consumer Electronics Magazine, vol.6, no. 1, pp. 48–50, Jan. 2017.
[3] HTC, “HTC Vive,” https://www.vive.com/us/.[4] E. Bastug, M. Bennis, M. Médard, and M. Debbah, “Towards inter-
connected virtual reality: Opportunities, challenges and enablers,” IEEE
Communications Magazine, vol. 55, no. 6, pp. 110–117, June 2017.[5] J. Wu, B. Cheng, C. Yuen, Y. Shang, and J. Chen, “Distortion-aware
concurrent multipath transfer for mobile video streaming in heteroge-neous wireless networks,” IEEE Transactions on Mobile Computing,vol. 14, no. 4, pp. 688–701, April 2015.
[6] J. Wu, C. Yuen, N. M. Cheung, J. Chen, and C. W. Chen, “Modelingand optimization of high frame rate video transmission over wirelessnetworks,” IEEE Transactions on Wireless Communications, vol. 15,no. 4, pp. 2713–2726, April 2016.
[7] F. Qian, L. Ji, B. Han, and V. Gopalakrishnan, “Optimizing 360 videodelivery over cellular networks,” in Proc. of All Things Cellular (ATC)Workshop on Operations, Applications and Challenges, New York, USA,Oct. 2016.
[8] C. Richardt, Y. Pritch, H. Zimmer, and A. Sorkine-Hornung,“Megastereo: Constructing high-resolution stereo panoramas,” in Proc.
of the IEEE Conference on Computer Vision and Pattern Recognition,Portland, OR, USA, June 2013.
[9] S. Sridhar, F. Mueller, M. Zollhöfer, D. Casas, A. Oulasvirta, andC. Theobalt, “Real-time joint tracking of a hand manipulating an objectfrom RGB-D input,” in Proc. of European Conference on Computer
Vision, Amsterdam, Netherlands, Oct. 2016.[10] A. Rovira and M. Slater, “Reinforcement learning as a tool to
make people move to a specific location in immersive virtual reality,”International Journal of Human-Computer Studies, vol. 98, pp. 89–94,Feb. 2017.
[11] T. Pfeiffer and C. Memili, “Model-based real-time visualization ofrealistic three-dimensional heat maps for mobile eye tracking and eyetracking in virtual reality,” in Proc. of the Ninth Biennial ACM
Symposium on Eye Tracking Research & Applications, Charleston, SouthCarolina, Mar. 2016.
[12] W. C. Lo, C. L. Fan, S. C. Yen, and C. H. Hsu, “Performancemeasurements of 360◦ video streaming to head-mounted displays overlive 4G cellular networks,” in Proc. of Asia-Pacific Network Operations
and Management Symposium (APNOMS), Seoul, South Korea, Sept.2017.
[13] O. Abari, D. Bharadia, A. Duffield, and D. Katabi, “Cutting the cordin virtual reality,” in Proc. of the ACM Workshop on Hot Topics in
Networks, Atlanta, GA, USA, Nov. 2016.[14] A. E. Abbas, “Constructing multiattribute utility functions for decision
analysis,” INFORMS Tutorials in Operations Research, pp. 62–98, Oct.2010.
[15] M. Chen, M. Mozaffari, W. Saad, C. Yin, M. Debbah, and C. S. Hong,“Caching in the sky: Proactive deployment of cache-enabled unmannedaerial vehicles for optimized quality-of-experience,” IEEE Journal on
Selected Areas on Communications (JSAC), vol. 35, no. 5, pp. 1046–1061, May 2017.
[16] S. B. Chekroun, E. Sabir, A. Kobbane, H. Tembine, E. H. Bouyakhf,and K. Ibrahimi, “A distributed open-close access for small-cellnetworks: A random matrix game analysis,” in Proc. of International
Wireless Communications and Mobile Computing Conference (IWCMC),Dubrovnik, Croatia, 2015.
[17] M. Bennis, S. Guruacharya, and D. Niyato, “Distributed learningstrategies for interference mitigation in femtocell networks,” in Proc. of
IEEE Global Communications Conference (GLOBECOM), Kathmandu,Nepal, Dec. 2011.
[18] Q. Zhu, W. Saad, Z. Han, H. V. Poor, and T. Basar, “Eavesdroppingand jamming in next-generation wireless networks: A game-theoreticapproach,” in Proc. of Military Communications Conference, Baltimore,MD, USA, 2011, pp. 119–124.
[19] J. G. Andrews, S. Buzzi, W. Choi, S. V. Hanly, A. Lozano, A. C. K.Soong, and J. C. Zhang, “What will 5G be?,” IEEE Journal on Selected
Areas in Communications, vol. 32, no. 6, pp. 1065–1082, June 2014.[20] M. Mozaffari, W. Saad, M. Bennis, and M. Debbah, “Unmanned aerial
vehicle with underlaid device-to-device communications: Performanceand tradeoffs,” IEEE Transactions on Wireless Communications, vol.15, no. 6, pp. 3949–3963, June 2016.
[21] G. C. Burdea and P. Coiffet, Virtual Reality Technology, John Wiley &Sons, 2003.

[22] M. Lukosevicius, A Practical Guide to Applying Echo State Networks,Springer Berlin Heidelberg, 2012.
[23] J. F. Yang, S. C. Chang, and C. Y. Chen, “Computation reduction formotion search in low rate video coders,” IEEE Transactions on Circuits
and Systems for Video Technology, vol. 12, no. 10, pp. 948–951, Oct.2002.
[24] “HTC Vive install support,” https://support.steampowered.com/kb_article.php?ref=2001-UXCM-4439.[25] L. Wei, J. Cai, C. H. Foh, and B. He, “QoS-aware resource allocation
for video transcoding in clouds,” IEEE Transactions on Circuits and
Systems for Video Technology, vol. 27, no. 1, pp. 49–61, 2017.[26] D. C. Montgomery, E. A. Peck, and G. G. Vining, Introduction to Linear
Regression Analysis, John Wiley & Sons, 2015.[27] A. M Mood, “Introduction to the theory of statistics.,” 1950.[28] Z. Han, D. Niyato, W. Saad, T. Basar, and A. Hjørungnes, Game
Theory in Wireless and Communication Networks: Theory, Models, andApplications, Cambridge University Press, 2012.
[29] G. Bacci, S. Lasaulce, W. Saad, and L. Sanguinetti, “Game theoryfor networks: A tutorial on game-theoretic tools for emerging signalprocessing applications,” IEEE Signal Processing Magazine, vol. 33,no. 1, pp. 94–119, Jan. 2016.
[30] M. Chen, U. Challita, W. Saad, C. Yin, and M. Debbah, “Machinelearning for wireless networks with artificial intelligence: A tutorialon neural networks,” available online: arxiv.org/abs/1710.02913, Oct.2017.
[31] M. Chen, W. Saad, and C. Yin, “Echo state networks for self-organizingresource allocation in LTE-U with uplink-downlink decoupling,” IEEETransactions on Wireless Communications, vol. 16, no. 1, January 2017.
[32] R. Sutton and A. Barto, Reinforcement Learning: An Introduction, MITPress, 1998.
[33] I. Szita, V. Gyenes, and A. Lorincz, “Reinforcement learning with echostate networks,” Lecture Notes in Computer Science, vol. 4131, pp.830–839, 2006.
[34] Oculus, “Mobile VR media overview,”https://developer3.oculus.com/documentation/mobilesdk/latest/concepts/mobile-media-overview/.
[35] M. Bennis, S. M. Perlaza, P. Blasco, Z. Han, and H.V. Poor, “Self-organization in small cell networks: A reinforcement learning approach,”IEEE Transactions on Wireless Communications, vol. 12, no. 7, pp.3202–3212, June 2013.
[36] F. Kelly, “Charging and rate control for elastic traffic,” European
Transactions on Telecommunications, vol. 8, no. 1, pp. 33–37, 1997.[37] M. Bennis and D. Niyato, “A Q-learning based approach to interference
avoidance in self-organized femtocell networks,” in Proc. of IEEE
Global Commun. Conference (GLOBECOM) Workshop on Femtocell
Networks, Miami, FL, USA, Dec. 2010.[38] M. Abrash, “What VR could, should, and
almost certainly will be within two years,”https://media.steampowered.com/apps/abrashblog/Abrash%20Dev%20Days%202014.pdf.