1 when are blups bad ed stanek umass- amherst julio singer usp- brazil george reedumass- worc....
Post on 20-Dec-2015
213 views
TRANSCRIPT

1
When are BLUPs Bad
Ed Stanek UMass- Amherst
Julio Singer USP- BrazilGeorge Reed UMass- Worc.
Wenjun Li UMass- Worc.

2
Outline
•Description of the Problem–Examples
•Basic Models & Ideas
•Approaches
•Results
•Conclusions/Further Research

3
Problem: Estimate/Predict Cluster Latent Value
Example: 11 Middle Schools 8-16 Classrooms/School
Question: How much bullying occurs at school?
Example: 166 School Districts 6-18 Schools/District
Question: Does the District have a sun-protection policy for students?
Example: 25,000 Members in an HMO 30 Days/Member before Cholesterol
measure Question: What is a Patient’s Ave Sat fat intake (g)?

4
Description of the Problem
Clustered Finite Population (cluster=group of subjects)
Schools, Clinics, Hospitals, Cities, Neighborhoods, Physician Practices, Families, Litters, States, Studies…
Data is available only on some clusters
Observational studies, multi-stage samples, group-randomized trials
For selected clusters, response is observed on a subset of subjects (possibly with response error).
How to Best Estimate/Predict the Cluster’s Latent Value?

5
Basic Models & Ideas
Simple Response Error Model for a Subject:
School:
Student:
where
stk st stkY y W
1,...,s N1,...,t M
0stkE W

6
Combining terms, the Response Error Model:
becomes
where
ith school effect
jth student effect
kth response error
stk s st stkY W
*ijk i ij ijkY B E W
1
N
i is ss
B U
1 1
N Ms
ij is jt sts t
E U U
*
1 1
N Ms
ijk is jt stks t
W U U W

7
Model Properties
Over Schools
Over Students
The Latent Value of the School in the ith position:
2var iB
*ijk i ij ijkY B E W
1
0iE B
2
0ijE E
1
N
i is ss
B U
2var ij eE

8
Approaches to Estimate/Predict Latent Value
1. Fixed Models
2. Mixed Models
3. Super-population Models
4. Random Permutation Models

9
1. Fixed Effect Models:(Random Sample of Students)
Latent Cluster Mean:
(i.e. School “s”)
OLS Estimate:
s
1
1 m
s sjkj
Y Ym
sjk s sj sjkY E W

10
2. Mixed Models
To predict
Solution:
BLUP= where
*ijk i ij ijkY B E W
var B G
var E R
var Σ ZB E ZGZ R
11 1̂ XΣ X XΣ Y
Y X ZB E
iB
1ˆ ̂ B GZ Σ Y X
ˆˆ i iB Y k Y Y 2
2 2 /ek
m

11
3. Super-population Models
Super-population Finite Population (Realization)
Latent Value Latent Value
*ijk i ij ijkY B E W st s sty
1
1 M
s stt
yM
1 1
1 m M
i ij ijj j m
B Y YM

12
Breaking Up the Latent Value Parameter
where
1 11
m M
sj sjj j m
i
Y Y
B m M mM m M m
1 i iI iIIB f Y f Y
mf
M
1 1
1 m M
i ij ijj j m
B Y YM

13
Superpopulation Model Prediction Approach
(Scott and Smith, 1969)
Sample:
Remainder:
BLUP:
,1
1 n
i I ijj
Y Yn
,1
1 N
i II ijj n
Y YN n
, ,1i i I i IIB fY f Y
,ˆ 1 i i IIf y f Y
,ˆi II iY y k y y
2
2 2 /ek
m

14
4. Random Permutation Model Predictors
Finite Population:
2-Stage Permutation:
To Predict :
BLUP
where
*ijk i ij ijkY B E W
st s sty
, ,1i i I i IIB fY f Y
*,
ˆ 1 i i IIf y f Y
* *,
ˆi II iY y k y y
*2*
*2 2 /ek
m
2*2 2 e
M

15
Approaches
1. Fixed:
2. Mixed:
3. Superpop.
4. RP Model * 1i if y f y k y y
*2*
*2 2 /ek
m
2*2 2 e
M
1i if y f y k y y
iy k y y
iy
*2*
*2 2 /ek
m

16
If variance components are known, then the RP Model Predictor is “best”-
(i.e. has small expected MSE)
How much better depends on:
Sampling fraction:
Cluster-intra-class correlation:
Unit- Reliability:
2
2 2
e
s
=m
fM
2
2 2 e
e R
t

17
Figure 1a. Percent Increase in Expected MSE for Mixed Model (──) and Scott and Smith Model (- - - ) Predictors Relative to the Random Permutation Model Predictors of the Latent Value of a Realized Sample
PSU
f=0.1 ρ(s)=0.1
0%
20%
40%
60%
80%
100%
0 0.2 0.4 0.6 0.8 1
Unit Intra-Class Correlation (ρ(t))
Per
cen
t In
crea
se
in E
MS
E

18
Figure 1b. Percent Increase in Expected MSE for Mixed Model (──) and Scott and Smith Model (- - - ) Predictors Relative to the Random Permutation Model Predictors of the Latent Value of a Realized Sample
PSU
f=0.5 ρ(s)=0.1
0%
20%
40%
60%
80%
100%
0 0.2 0.4 0.6 0.8 1
Unit Intra-Class Correlation (ρ(t))
Per
cen
t In
crea
se
in E
MS
E

19
Figure 1c. Percent Increase in Expected MSE for Mixed Model (──) and Scott and Smith Model (- - - ) Predictors Relative to the Random Permutation Model Predictors of the Latent Value of a Realized Sample
PSU
f=0.9 ρ(s)=0.1
0%
20%
40%
60%
80%
100%
0 0.2 0.4 0.6 0.8 1
Unit Intra-Class Correlation (ρ(t))
Per
cen
t In
crea
se
in E
MS
E

20
What happens when variances must be estimated?
Are BLUPs still best?
Not always.

21
Simulation Study:Two-stage finite population sampling
Settings: N, M, n, m
Variance Components:
Distribution of Clusters: normal, uniform, beta, gamma
Unit Variance Prop Cluster Mean: yes/no
2 2 2, , , ,e Rs t

22
Simulation Results (No response Error)
N=3
N=5
N=10
N=25
N=50
N=100
N=500
N=1000
23
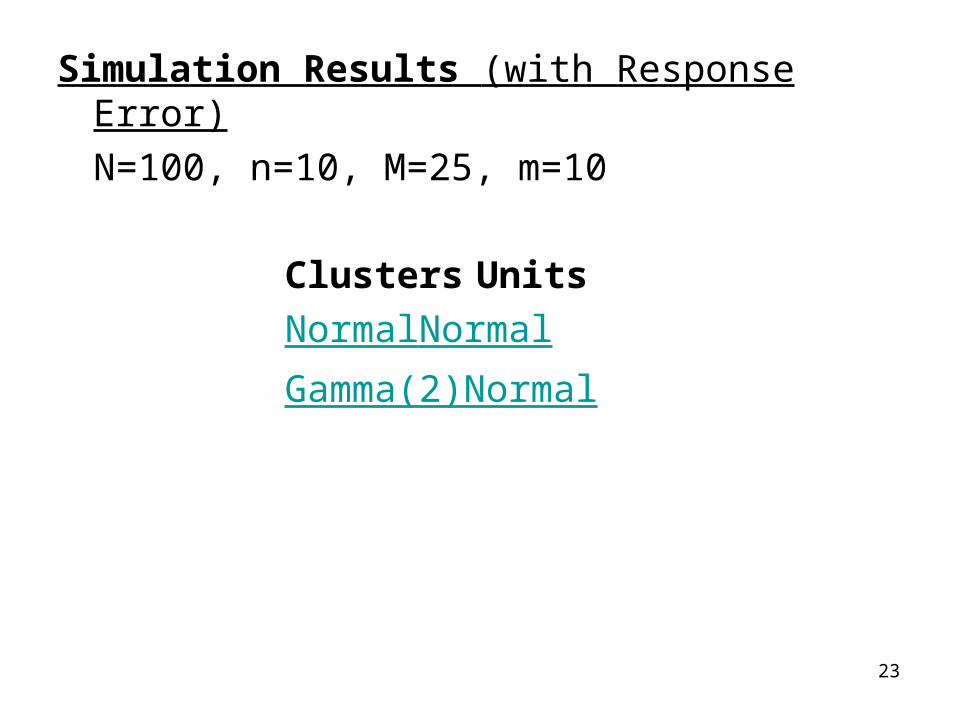
Simulation Results (with Response Error)
N=100, n=10, M=25, m=10
Clusters Units
NormalNormal
Gamma(2)Normal

24
Summary and Conclusions
eBLUPs can have higher MSE than the Cluster Ave Small #s of sample clusters (n<5)
RP predictors (while theoretically best), may be worse than MM empirical predictors, or Super-population predictors.
Properties don’t seem to depend on distributions.
Simulations are limited- fall short of providing guidelines

25
Thanks