10- 1 mcgraw hill/irwin copyright © 2009 by the mcgraw-hill companies, inc. all rights reserved...
TRANSCRIPT

10- 1
McGraw Hill/Irwin Copyright © 2009 by The McGraw-Hill Companies, Inc. All rights reserved
Fundamentals of Corporate
Finance
Sixth Edition
Richard A. Brealey
Stewart C. Myers
Alan J. Marcus
Slides by
Matthew Will
Chapter 9
McGraw Hill/Irwin Copyright © 2009 by The McGraw-Hill Companies, Inc. All rights reserved
Project Analysis

10- 2
Topics Covered
How Firms Organize the Investment Process Some “What If” Questions
Sensitivity Analysis Scenario Analysis
Break Even Analysis Real Options and the Value of Flexibility
10- 3
Capital Budgeting Process
Capital Budget - The list of planned investment projects.
The Decision Process
1. Develop and rank all investment projects = The Capital Budget
2. Authorize projects based on:• Outlays required by law or company policy
• Maintenance or cost reduction
• Capacity expansion in existing business
• Investment for new products

10- 4
Capital Budgeting Process
Capital Budgeting Problems Ensuring that forecasts are consistent Eliminating conflicts of interest Reducing forecast bias Sorting the wheat from the chaff - Selection
criteria (NPV and others)

10- 5
How To Handle Uncertainty
Sensitivity Analysis - Analysis of the effects on project profitability of changes in sales, costs, etc.
Scenario Analysis - Project analysis given a particular combination of assumptions.
Simulation Analysis - Estimation of the probabilities of different possible outcomes.
Break Even Analysis - Analysis of the level of sales at which the company breaks even.
10- 6
Sensitivity Analysis
Example
Given the expected cash flow forecasts listed on the next slide, determine the NPV of the project given changes in the cash flow components using an 8% cost of capital. Assume that all variables remain constant, except the one you are changing.
10- 7
Sensitivity Analysis
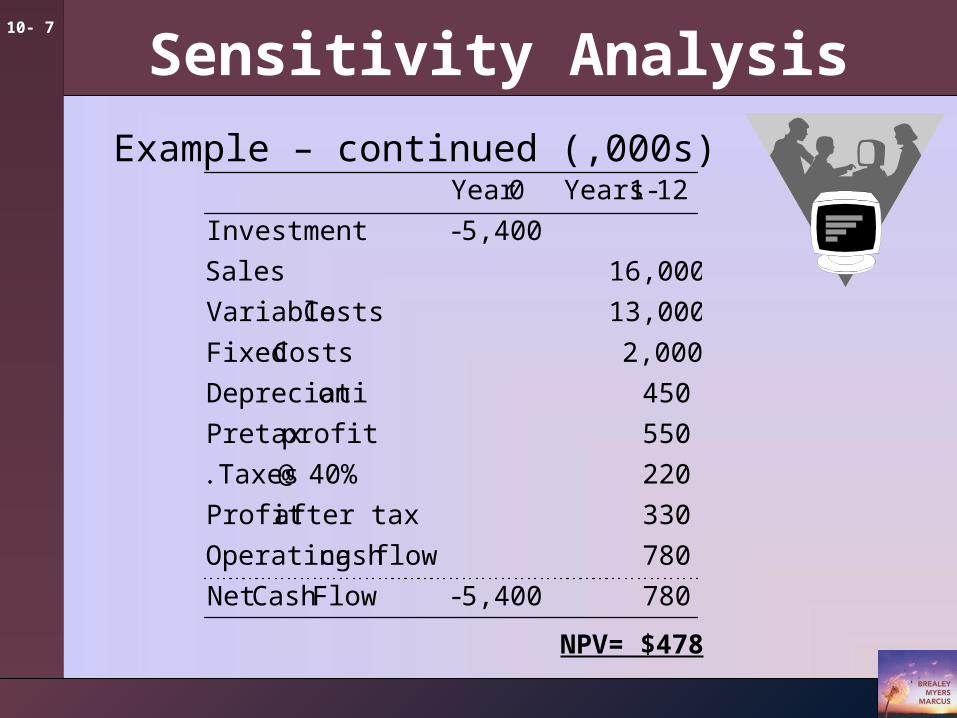
7805,400-FlowCash Net
780flowcash Operating
330after taxProfit
22040% @ .Taxes
550profitPretax
450onDepreciati
2,000Costs Fixed
13,000Costs Variable
16,000Sales
5,400-Investment
12-1 Years0Year
Example – continued (,000s)
NPV= $478
10- 8
Sensitivity Analysis
Example - continued
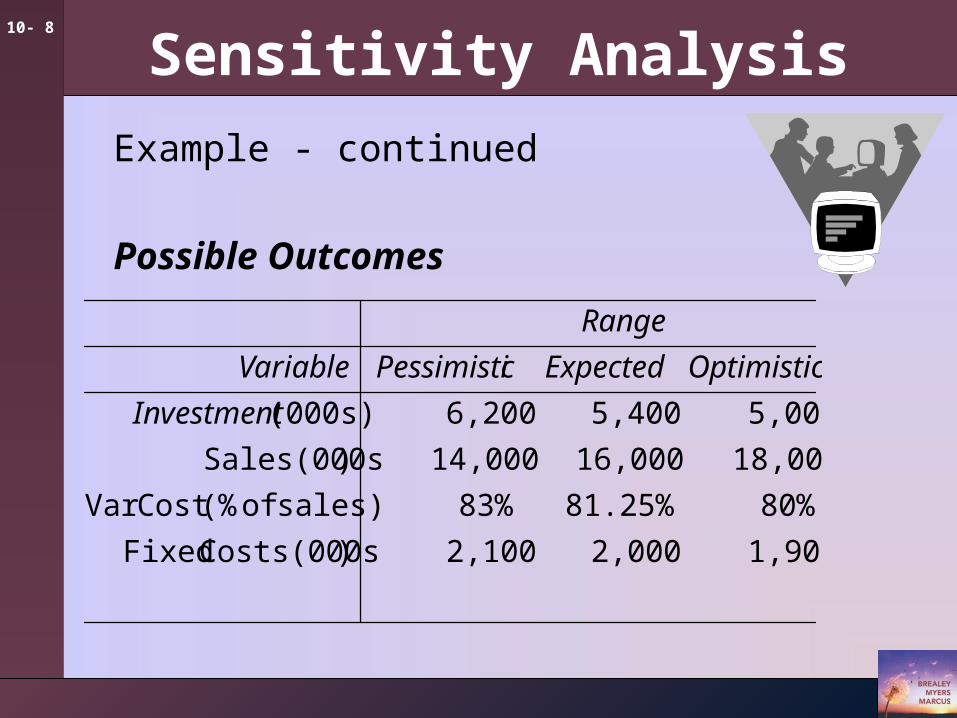
Possible Outcomes
1,9002,0002,100)Costs(000s Fixed
80%81.25%83%sales) of (%Cost Var
18,00016,00014,000)Sales(000s
5,0005,4006,200(000s)Investment
OptimisticExpectedcPessimistiVariable
Range
10- 9
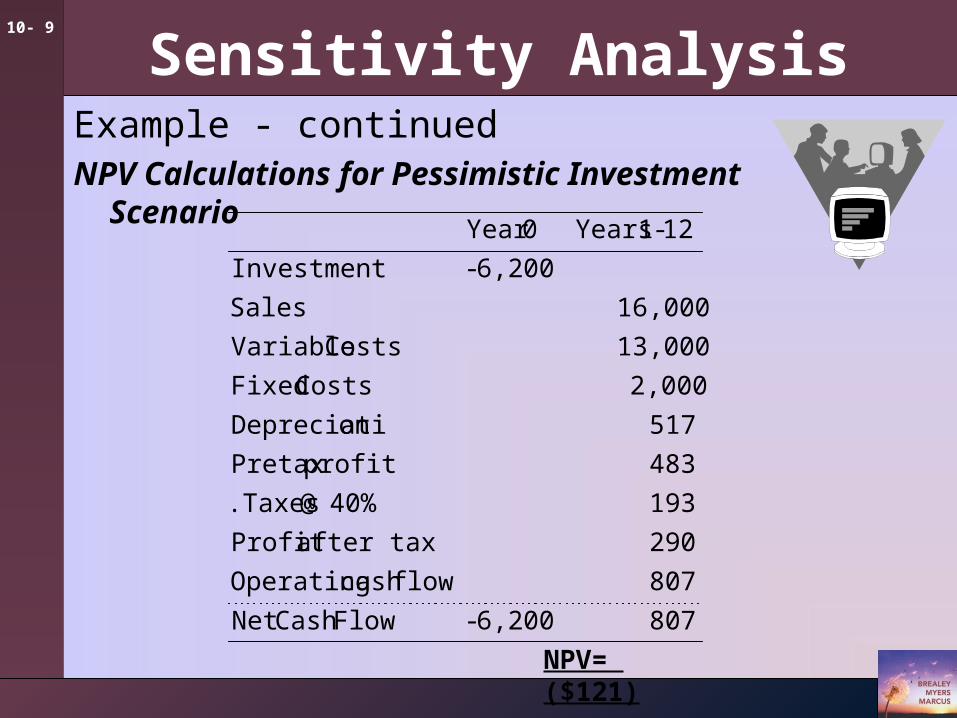
Sensitivity AnalysisExample - continuedNPV Calculations for Pessimistic Investment Scenario
8076,200-FlowCash Net
807flowcash Operating
290after taxProfit
19340% @ .Taxes
483profitPretax
517onDepreciati
2,000Costs Fixed
13,000Costs Variable
16,000Sales
6,200-Investment
12-1 Years0Year
NPV= ($121)
10- 10
Sensitivity Analysis
Example - continued
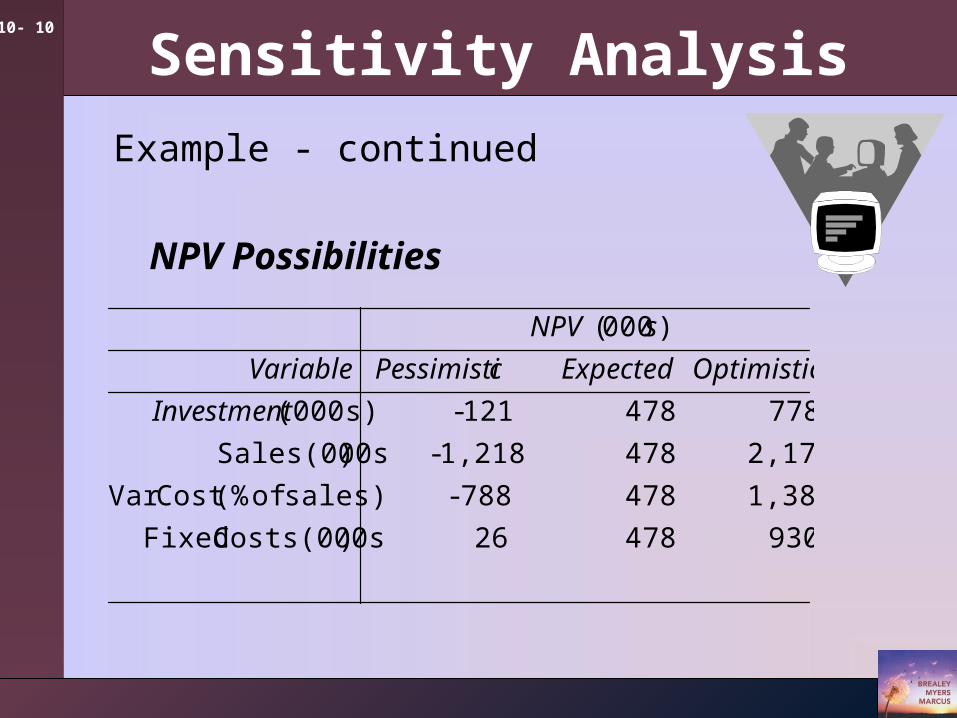
NPV Possibilities
93047826)Costs(000s Fixed
1,382478788-sales) of (%Cost Var
2,1744781,218-)Sales(000s
778478121-(000s)
)000(
Investment
OptimisticExpectedcPessimistiVariable
sNPV

10- 11
Scenario Analysis
Example - continued
Cash Flows (years 1-12)
2,018,000-478,000NPV
3,382,0005,878,000flowscash of luePresent va
448,000780,0007)(4 operations from flow8.Cash
1,200-330,000after taxProfit 7.
800-220,0006.Taxes
2,000-550,0004)-3-2-(1profit Pretax 5.
450,000450,000onDepreciati 4.
2,000,0002,000,000costs 3.Fixed
11,152,00013,000,000costs Variable 2.
000,600,13000,000,16Sales 1.
Scenario. Store CompetingCase. Base

10- 12
Break Even Analysis
Example
Given the forecasted data on the next slide, determine the number of planes that the company must produce in order to break even, on an NPV basis. The company’s cost of capital is 10%.
10- 13
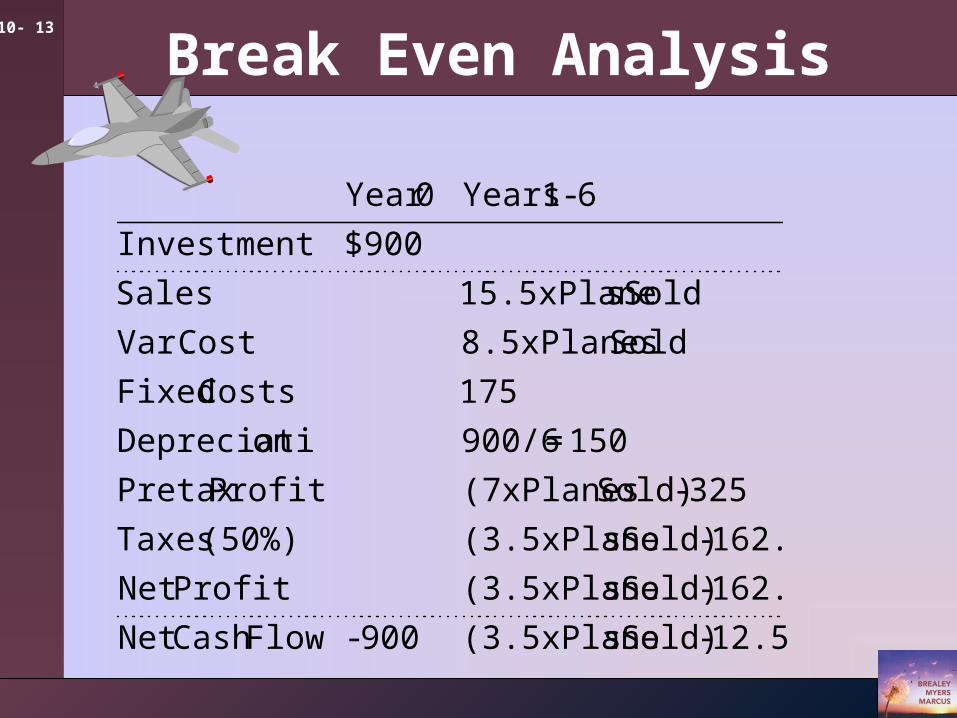
Break Even Analysis
12.5-Sold) s(3.5xPlane900-FlowCash Net
162.5-Sold) s(3.5xPlaneProfitNet
162.5-Sold) s(3.5xPlane(50%) Taxes
325-Sold) (7xPlanesProfitPretax
150=900/6onDepreciati
175Costs Fixed
Sold 8.5xPlanesCost Var.
Sold s15.5xPlaneSales
$900Investment
6-1 Years0Year
10- 14
Break Even Analysis
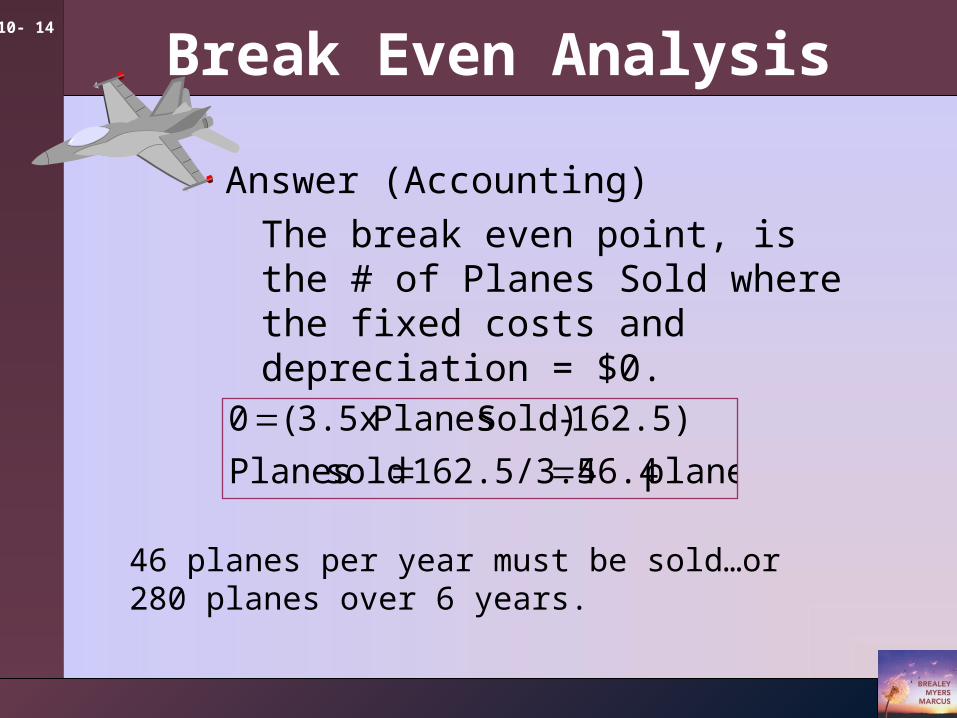
Answer (Accounting)
The break even point, is the # of Planes Sold where the fixed costs and depreciation = $0.
planes 46.4162.5/3.5 sold Planes
162.5)-Sold) Planes x 3.5 (0
46 planes per year must be sold…or 280 planes over 6 years.
10- 15
Break Even Analysis
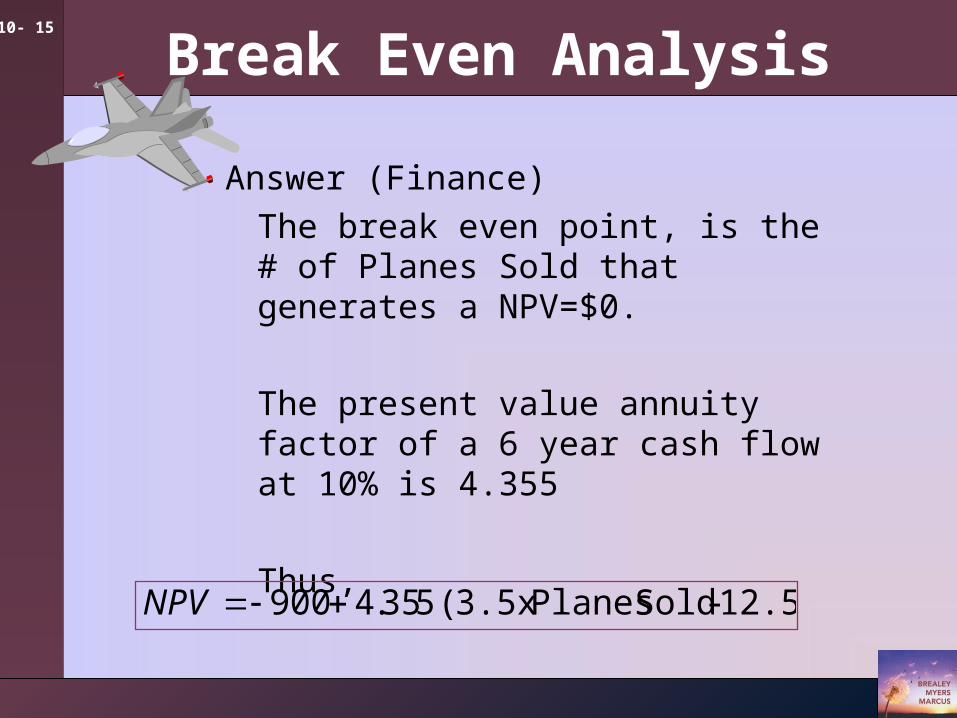
Answer (Finance)
The break even point, is the # of Planes Sold that generates a NPV=$0.
The present value annuity factor of a 6 year cash flow at 10% is 4.355
Thus,
12.5)-Sold Planes x 3.5 ( 535.4900 NPV
10- 16
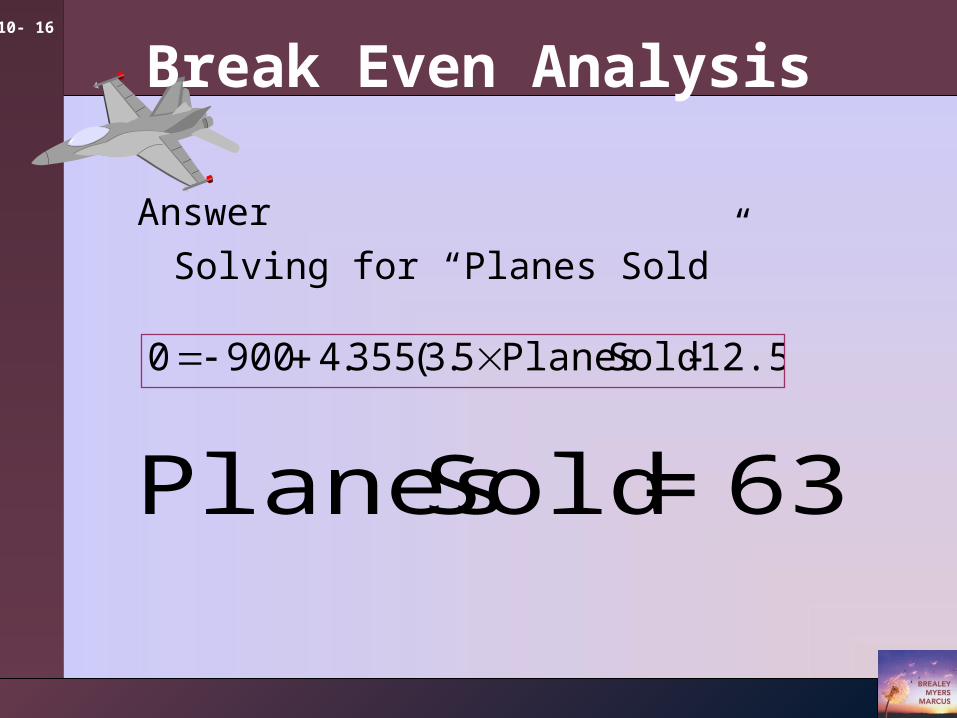
Answer
Solving for “Planes Sold”
12.5)-Sold Planes5.3( 355.49000
63=Sold Planes
Break Even Analysis
10- 17
Operating Leverage
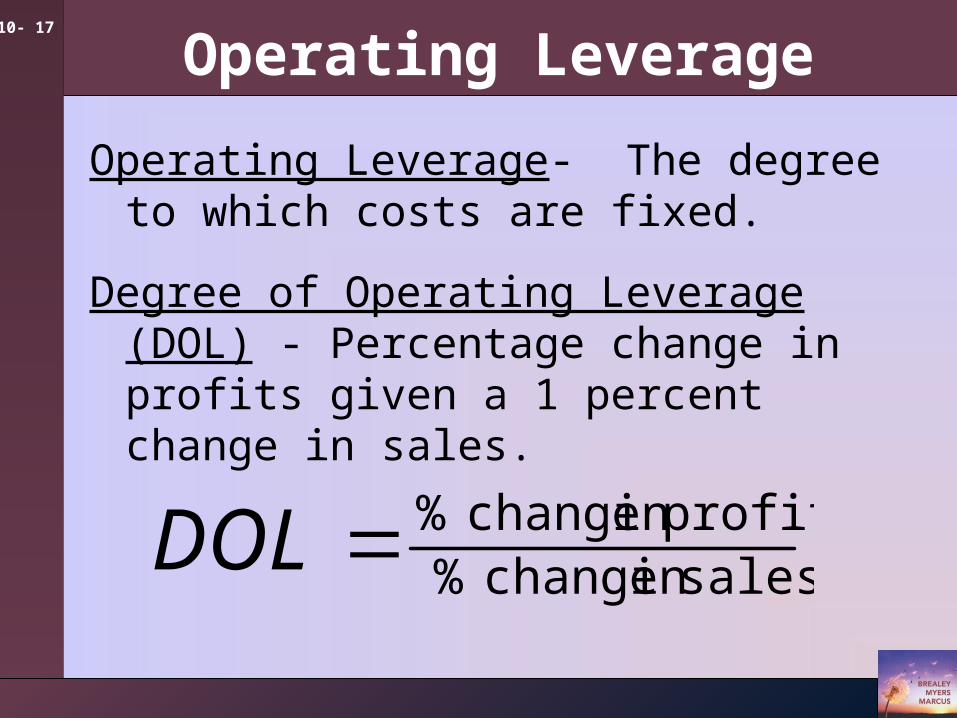
Operating Leverage- The degree to which costs are fixed.
Degree of Operating Leverage (DOL) - Percentage change in profits given a 1 percent change in sales.
salesin change %profitsin change %DOL
10- 18
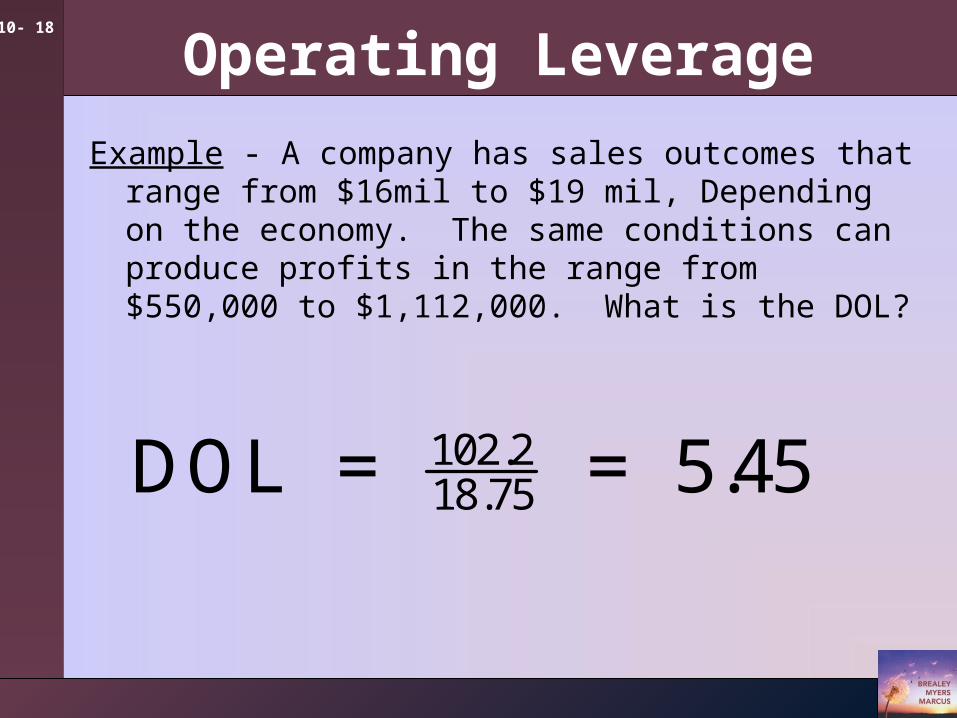
Operating Leverage
Example - A company has sales outcomes that range from $16mil to $19 mil, Depending on the economy. The same conditions can produce profits in the range from $550,000 to $1,112,000. What is the DOL?
DOL = = 5.45102.218.75
10- 19
Flexibility & Real Options
Decision Trees - Diagram of sequential decisions and possible outcomes.
Decision trees help companies determine their Options by showing the various choices and outcomes.
The Option to avoid a loss or produce extra profit has value.
The ability to create an Option thus has value that can be bought or sold.

10- 20
Decision Trees
NPV=0
Don’t test
Test (Invest $200,000)
Success
Failure
Pursue project NPV=$2million
Stop project
NPV=0
10- 21
Real Options
1. Option to expand
2. Option to abandon
3. Timing option
4. Flexible production facilities

10- 22
Web Resources