10-1 mcgraw-hill/irwin operations management, seventh edition, by william j. stevenson copyright ©...
TRANSCRIPT

10-1
McGraw-Hill/IrwinOperations Management, Seventh Edition, by William J. StevensonCopyright © 2002 by The McGraw-Hill Companies, Inc. All rights reserved.
Quality Control
Chapter 10
Quality Control
10-2
McGraw-Hill/IrwinOperations Management, Seventh Edition, by William J. StevensonCopyright © 2002 by The McGraw-Hill Companies, Inc. All rights reserved.
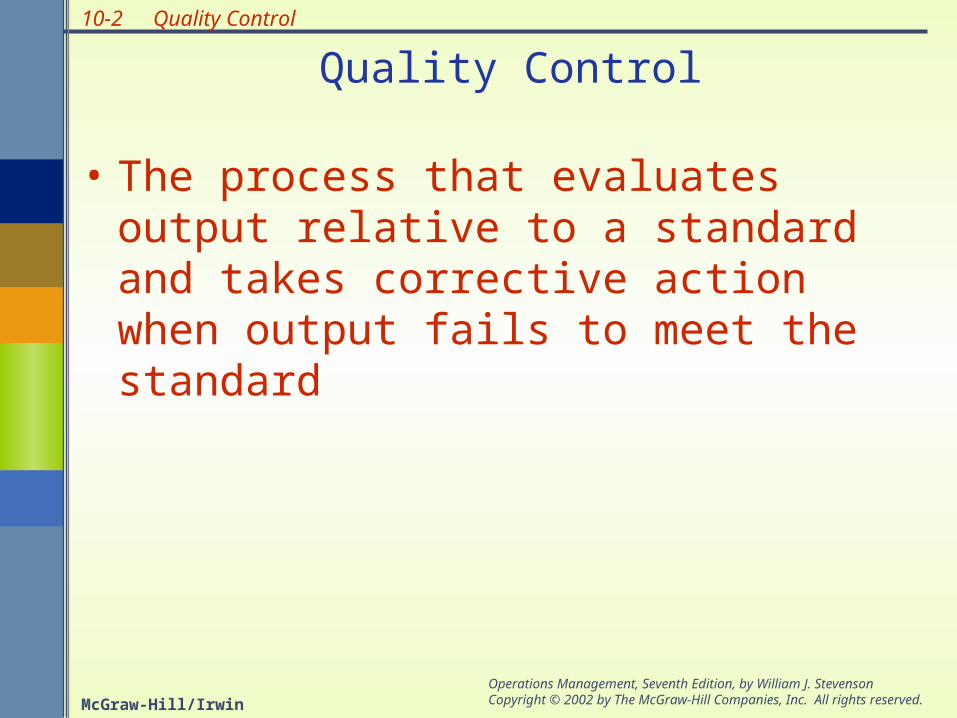
Quality Control
Quality Control
• The process that evaluates output relative to a standard and takes corrective action when output fails to meet the standard

10-3
McGraw-Hill/IrwinOperations Management, Seventh Edition, by William J. StevensonCopyright © 2002 by The McGraw-Hill Companies, Inc. All rights reserved.
Quality Control
Phases of Quality Assurance
Acceptancesampling
Processcontrol
Continuousimprovement
Inspectionbefore/afterproduction
Correctiveaction duringproduction
Quality builtinto theprocess
The leastprogressive
The mostprogressive
Figure 10-1

10-4
McGraw-Hill/IrwinOperations Management, Seventh Edition, by William J. StevensonCopyright © 2002 by The McGraw-Hill Companies, Inc. All rights reserved.
Quality Control
Inspection
• How Much/How Often
• Where/When
• Centralized vs. On-site
Inputs Transformation Outputs
Acceptancesampling
Processcontrol
Acceptancesampling
Figure 10-2

10-5
McGraw-Hill/IrwinOperations Management, Seventh Edition, by William J. StevensonCopyright © 2002 by The McGraw-Hill Companies, Inc. All rights reserved.
Quality Control
How Much/How Often
• Value of the item
• Cost of passing defects
• Cost of inspection
• Line disruptions due to inspections
• Variability of the process

10-6
McGraw-Hill/IrwinOperations Management, Seventh Edition, by William J. StevensonCopyright © 2002 by The McGraw-Hill Companies, Inc. All rights reserved.
Quality Control
Inspection CostsC
ost
OptimalAmount of Inspection
Cost of inspection
Cost of passingdefectives
Total Cost
Figure 10-3

10-7
McGraw-Hill/IrwinOperations Management, Seventh Edition, by William J. StevensonCopyright © 2002 by The McGraw-Hill Companies, Inc. All rights reserved.
Quality Control
Where to Inspect in the Process
• Raw materials and purchased parts
• Finished products
• Before a costly operation
• Before an irreversible process
• Before a covering process
10-8
McGraw-Hill/IrwinOperations Management, Seventh Edition, by William J. StevensonCopyright © 2002 by The McGraw-Hill Companies, Inc. All rights reserved.
Quality Control
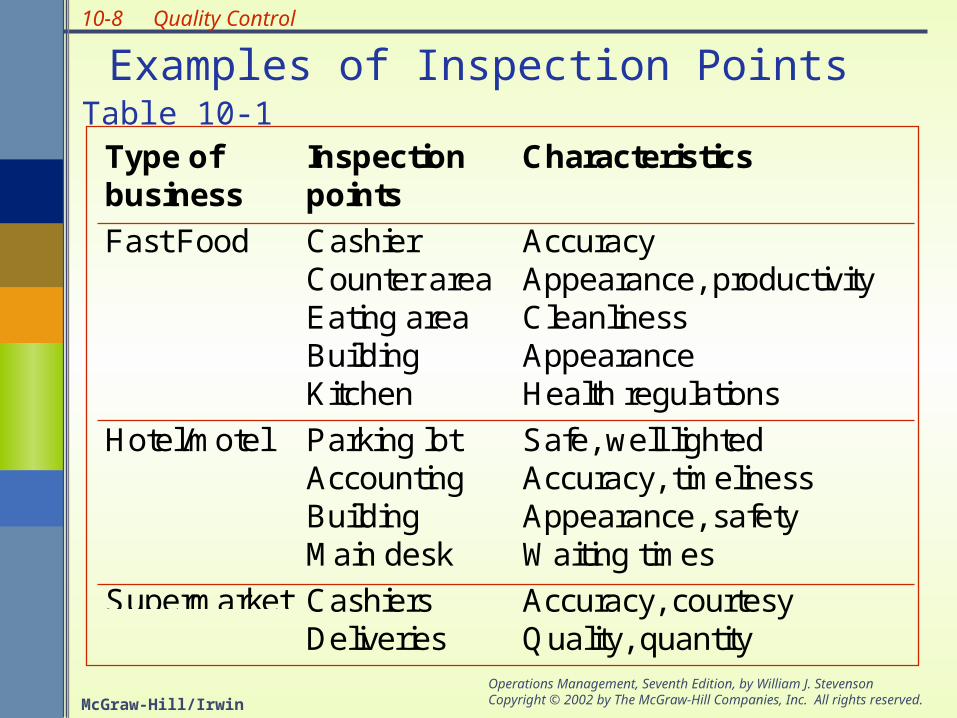
Examples of Inspection Points
Type ofbusiness
Inspectionpoints
Characteristics
Fast Food CashierCounter areaEating areaBuildingKitchen
AccuracyAppearance, productivityCleanlinessAppearanceHealth regulations
Hotel/motel Parking lotAccountingBuildingMain desk
Safe, well lightedAccuracy, timelinessAppearance, safetyWaiting times
Supermarket CashiersDeliveries
Accuracy, courtesyQuality, quantity
Table 10-1

10-9
McGraw-Hill/IrwinOperations Management, Seventh Edition, by William J. StevensonCopyright © 2002 by The McGraw-Hill Companies, Inc. All rights reserved.
Quality Control
Centralized vs. On-site
• Environmental requirements of the inspection equipment
• Are the advantages of centralized inspection enough to offset the disruption caused by moving products to the inspection point

10-10
McGraw-Hill/IrwinOperations Management, Seventh Edition, by William J. StevensonCopyright © 2002 by The McGraw-Hill Companies, Inc. All rights reserved.
Quality Control
• Statistical Process Control: Statistical evaluation of the output of a process during production

10-11
McGraw-Hill/IrwinOperations Management, Seventh Edition, by William J. StevensonCopyright © 2002 by The McGraw-Hill Companies, Inc. All rights reserved.
Quality Control
Statistical Process Control
• The Control Process– Define the characteristic to be controlled– Measure– Compare to a standard– Evaluate– Take corrective action– Evaluate corrective action

10-12
McGraw-Hill/IrwinOperations Management, Seventh Edition, by William J. StevensonCopyright © 2002 by The McGraw-Hill Companies, Inc. All rights reserved.
Quality Control
Statistical Process Control
• Variations and Control– Random variation: Natural variations in the
output of process, created by countless minor factors
– Assignable variation: A variation whose source can be identified
• A process is in control when there are no assignable variations, all variations are random
10-13
McGraw-Hill/IrwinOperations Management, Seventh Edition, by William J. StevensonCopyright © 2002 by The McGraw-Hill Companies, Inc. All rights reserved.
Quality Control
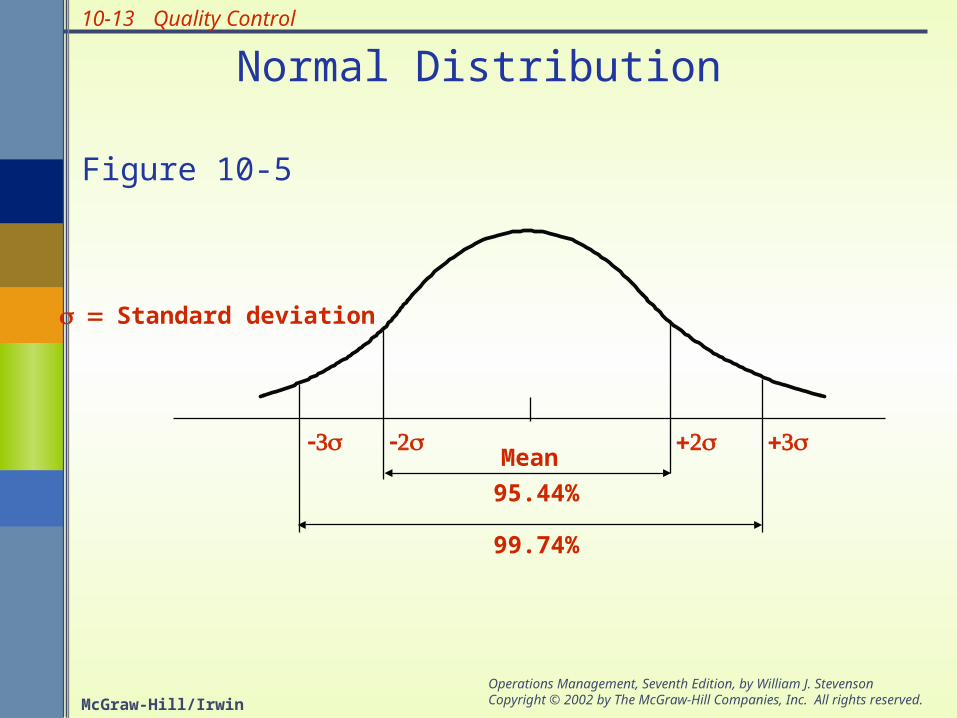
Normal Distribution
Mean
95.44%
99.74%
Standard deviation
Figure 10-5

10-14
McGraw-Hill/IrwinOperations Management, Seventh Edition, by William J. StevensonCopyright © 2002 by The McGraw-Hill Companies, Inc. All rights reserved.
Quality Control
Control Chart
0 1 2 3 4 5 6 7 8 9 10 11 12 13 14 15
UCL
LCL
Sample number
Mean
Out ofcontrol
Normal variationdue to chance
Abnormal variationdue to assignable sources
Abnormal variationdue to assignable sources
Figure 10-8

10-15
McGraw-Hill/IrwinOperations Management, Seventh Edition, by William J. StevensonCopyright © 2002 by The McGraw-Hill Companies, Inc. All rights reserved.
Quality Control
Observations from Sample Distribution
Sample number
UCL
LCL
1 2 3 4
Figure 10-9
10-16
McGraw-Hill/IrwinOperations Management, Seventh Edition, by William J. StevensonCopyright © 2002 by The McGraw-Hill Companies, Inc. All rights reserved.
Quality Control
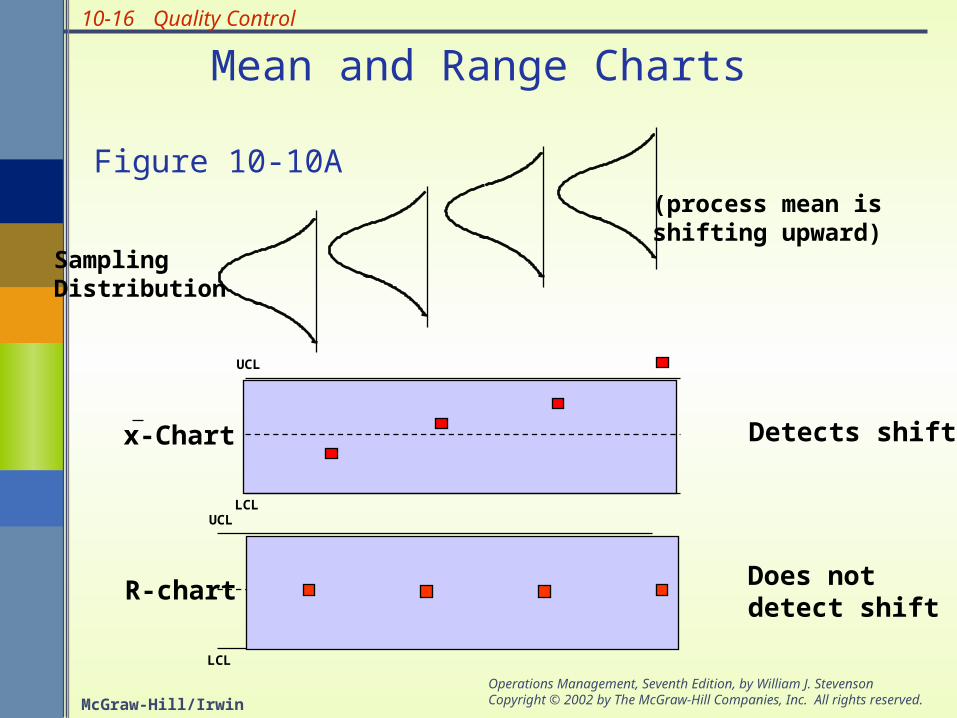
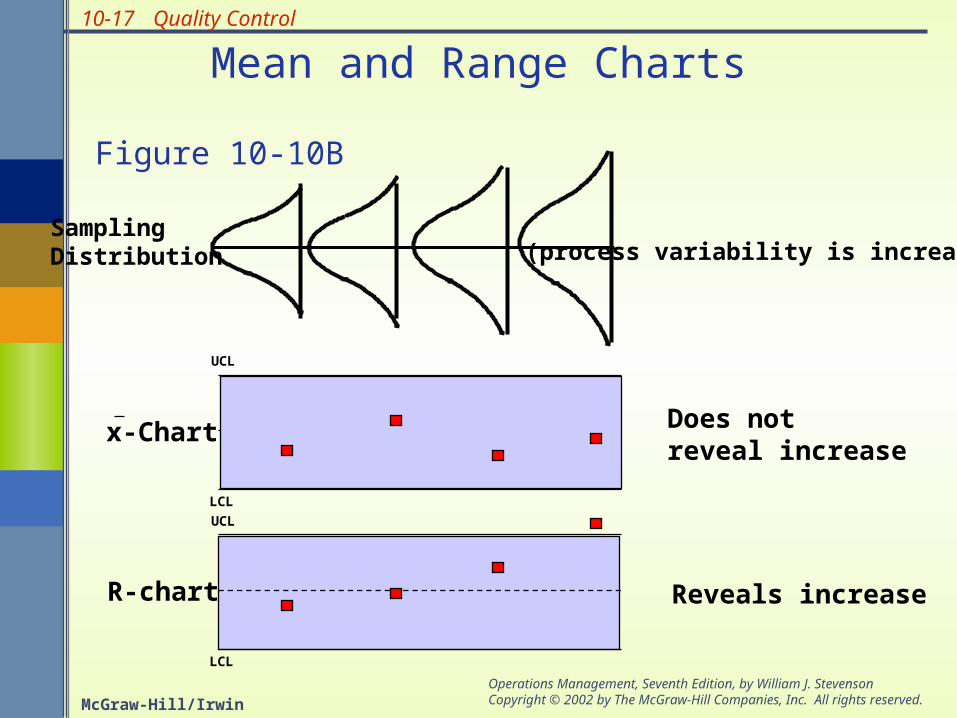
Mean and Range Charts
UCL
LCL
UCL
LCL
R-chart
x-Chart Detects shift
Does notdetect shift
Figure 10-10A(process mean is shifting upward)
SamplingDistribution
10-17
McGraw-Hill/IrwinOperations Management, Seventh Edition, by William J. StevensonCopyright © 2002 by The McGraw-Hill Companies, Inc. All rights reserved.
Quality Control
Mean and Range Charts
UCL
LCL
LCL
R-chart Reveals increase
x-Chart
UCL
Does notreveal increase
Figure 10-10B
(process variability is increasing)SamplingDistribution
10-18
McGraw-Hill/IrwinOperations Management, Seventh Edition, by William J. StevensonCopyright © 2002 by The McGraw-Hill Companies, Inc. All rights reserved.
Quality Control
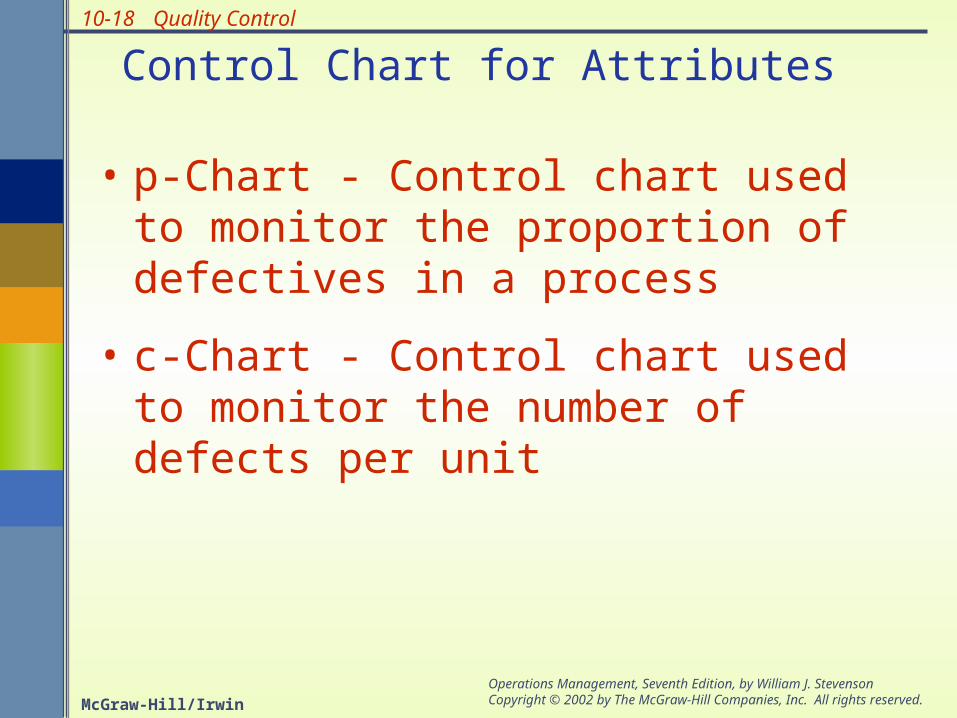
Control Chart for Attributes
• p-Chart - Control chart used to monitor the proportion of defectives in a process
• c-Chart - Control chart used to monitor the number of defects per unit

10-19
McGraw-Hill/IrwinOperations Management, Seventh Edition, by William J. StevensonCopyright © 2002 by The McGraw-Hill Companies, Inc. All rights reserved.
Quality Control
Use of p-Charts
• When observations can be placed into two categories.– Good or bad
– Pass or fail
– Operate or don’t operate
• When the data consists of multiple samples of several observations each
Table 10-3

10-20
McGraw-Hill/IrwinOperations Management, Seventh Edition, by William J. StevensonCopyright © 2002 by The McGraw-Hill Companies, Inc. All rights reserved.
Quality Control
Use of c-Charts
• Use only when the number of occurrences per unit of measure can be counted; non-occurrences cannot be counted.– Scratches, chips, dents, or errors per item– Cracks or faults per unit of distance– Breaks or Tears per unit of area– Bacteria or pollutants per unit of volume– Calls, complaints, failures per unit of time
Table 10-3

10-21
McGraw-Hill/IrwinOperations Management, Seventh Edition, by William J. StevensonCopyright © 2002 by The McGraw-Hill Companies, Inc. All rights reserved.
Quality Control
Counting Above/Below Median Runs (7 runs)
Counting Up/Down Runs (8 runs)
U U D U D U D U U D
B A A B A B B B A A B
Figure 10-11
Figure 10-12
Counting Runs

10-22
McGraw-Hill/IrwinOperations Management, Seventh Edition, by William J. StevensonCopyright © 2002 by The McGraw-Hill Companies, Inc. All rights reserved.
Quality Control
• Tolerances– specifications
• Process variability– Natural variability in a process
• Process capability– Process variability relative to specification
Process Capability

10-23
McGraw-Hill/IrwinOperations Management, Seventh Edition, by William J. StevensonCopyright © 2002 by The McGraw-Hill Companies, Inc. All rights reserved.
Quality Control
Process Capability
LowerSpecification
UpperSpecification
Process variability matches specifications
LowerSpecification
UpperSpecification
Process variability well within specifications
LowerSpecification
UpperSpecification
Process variability exceeds specifications
Figure 10-14

10-24
McGraw-Hill/IrwinOperations Management, Seventh Edition, by William J. StevensonCopyright © 2002 by The McGraw-Hill Companies, Inc. All rights reserved.
Quality Control
Process Capability Ratio
Process capability ratio, Cp =specification width
process width
Upper specification – lower specification6
Cp =

10-25
McGraw-Hill/IrwinOperations Management, Seventh Edition, by William J. StevensonCopyright © 2002 by The McGraw-Hill Companies, Inc. All rights reserved.
Quality Control
Processmean
Lowerspecification
Upperspecification
1350 ppm 1350 ppm
1.7 ppm 1.7 ppm
+/- 3 Sigma
+/- 6 Sigma
3 Sigma and 6 Sigma QualityFigure 10-15