10 2005 fourth quarter review & conference call february 17, 2006 robert mcfarlane evp &...
TRANSCRIPT

1
2005fourth quarter review & conference call
February 17, 2006
Robert McFarlaneEVP & Chief Financial Officer

2 Excellent results despite EBITDA dilution from record gross adds
12%182162Cash Flow (EBITDA less capex)
17%144123Capex
14%326285EBITDA
16%877756Revenue
ChangeQ4-05Q4-04
1 Q4-05 EBITDA normalized to exclude $3M net expense impact of labour disruption
($M)
wireless segment
financial results
15%329285EBITDA (normalized)1

3
subscriber results
Record fourth quarter net additions with stable postpaid and strong prepaid growth
net additions
Q4-04 Q4-05
186K
235K 4.5 M
total wireless subscribers
postpaid81%
prepaid19%
3.7 M
0.9 M
wireless segment
postpaid
prepaid

4
industry subscriber growth
5.1%4.4%Penetration gain
1.8M1.6MNet subscriber additions
32.4MPopulation 32.1M
16.8MCdn wireless market 15.0M
20052004
51.8%46.7%Penetration
Source: Company reports, CWTA
Canadian wireless market growth continues to accelerate
wireless segment
4.1%
1.4M
31.7M
13.4M
2003
42.3%
5
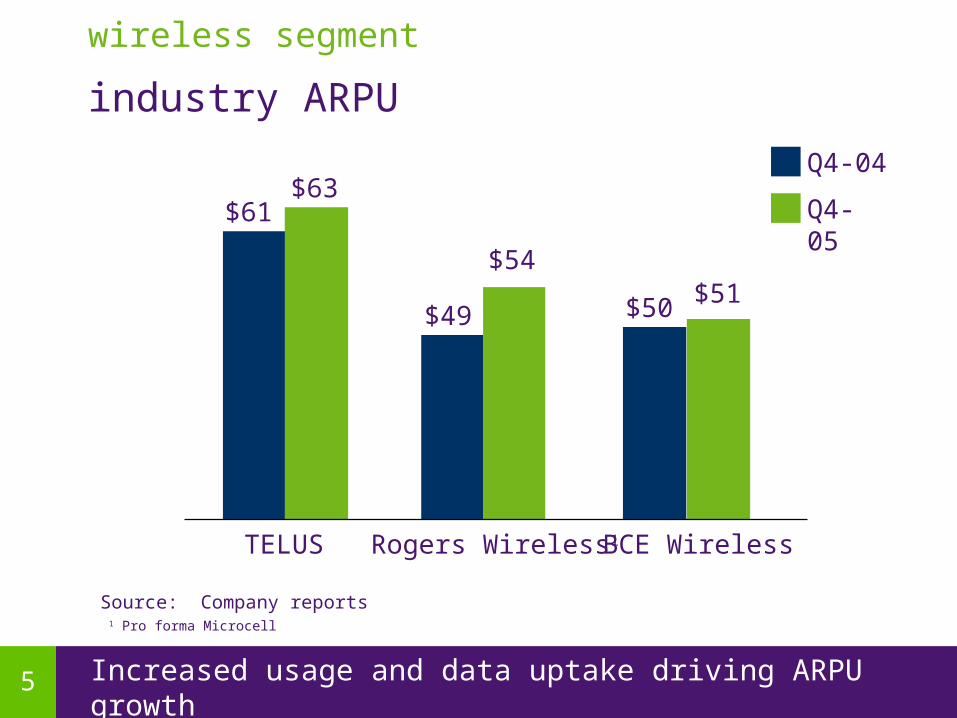
Source: Company reports
TELUS Rogers Wireless1 BCE Wireless
$61
$49 $50
$63
$54$51
Q4-04
Q4-05
1 Pro forma Microcell
Increased usage and data uptake driving ARPU growth
industry ARPU
wireless segment

6 TELUS’ wireless marketing efficiency remains best in Canada
$409 $425$449COA per gross add
1.5% 2.04%1.42%Blended churn
BCE RogersTELUS
profitable growth
wireless segment
$3400 $2600$4400Avg. lifetime revenue per sub
12% 16%10%COA / lifetime revenue
Q4-05
$51 $54$63ARPU

7 North American leader in wireless cash flow yield
31%Cash flow1 yield (total rev.)
12%Capex intensity (total rev.)
44%EBITDA margin (total rev.)
TELUS
wireless cash flow yield
2005
1 EBITDA less capex

8Met or exceeded original wireless targets for revenue, EBITDA and net adds
2005 results comparison to original targets
584KWireless Net Adds
$405MCapex
original 2005 targets1
EBITDA
Revenue
2005 actual results
$1.44B
$3.30B
wireless segment
425 to 475K
$350 to 400M
$1.35 to 1.40B
$3.20 to $3.25B
met or exceeded
1 Provided December 17, 2004

9 Achieved updated wireless guidance across the board
2005 results comparison to guidance
584KWireless Net Adds
$405MCapex
most recent guidance1
EBITDA
Revenue
2005 actual results
$1.44B
$3.30B
wireless segment
>550K
approx. $400M
$1.425 to $1.45B
$3.275 to $3.3B
met or exceeded
1 Updated December 16, 2005
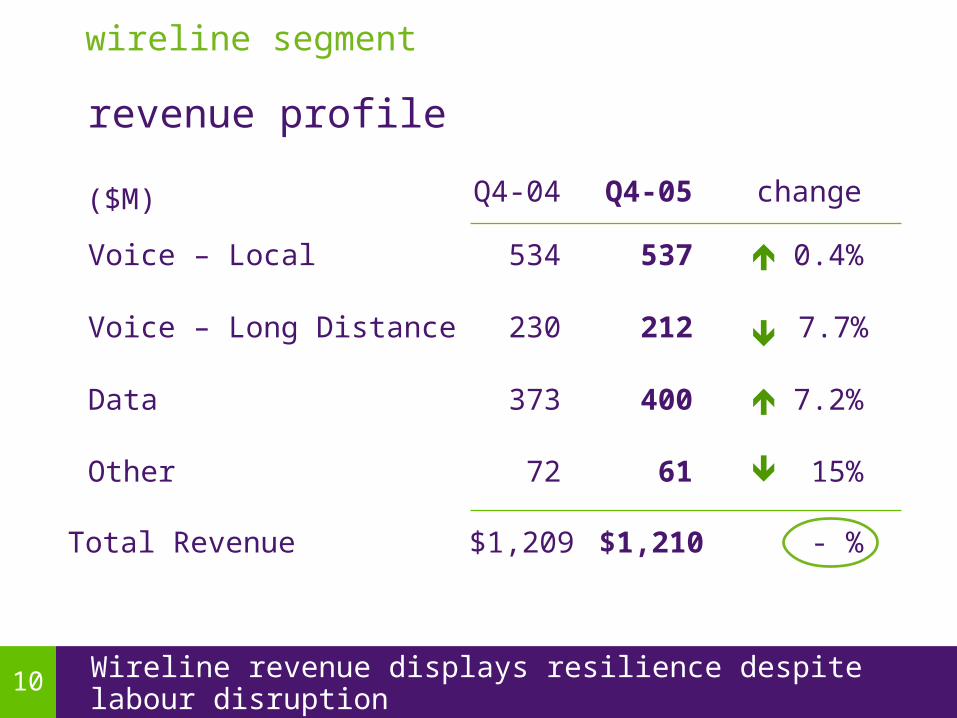
10 Wireline revenue displays resilience despite labour disruption
15%6172Other
7.2%400373Data
7.7%212230Voice – Long Distance
0.4%537534Voice – Local
changeQ4-05Q4-04
Total Revenue $1,209 $1,210
($M)
wireline segment
revenue profile
- %

11EBITDA decline due to labour disruption and higher restructuring costs
32%$179M$261MCash Flow (EBITDA less capex)
4.3%$230M$221MCapex
15%$409M$482MEBITDA
-$1.21B$1.21BRevenue
changeQ4-05Q4-04
financial results
wireline segment
1.6%$494M$502MEBITDA (normalized)1
1 Normalized to exclude $20M & $36M in restructuring charges in Q4-04 and Q4-05, respectively. Q4-05 also normalized to exclude $49M net expense impact of labour disruption

12 Continued revenue and profitability growth in Central Canada
non-ILEC revenue & EBITDA
wireline segment
Q4-04 Q4-05
156165
Q4-04 Q4-05
3.77.1
EBITDArevenue($M)

13
high-speed Internet subscriber growth
High-speed net adds slowed by labour disruption TELUS now has 1M Internet subs with 76% on high-speed
high-speed Internet net additions
Q4-04 Q4-05
35K
27K
1.0M
total Internet subscribers
high-speed 76%
dial-up24%
763K
236K
wireline segment

14
Q4-04
-1.3%
NAL results impacted by labour disruption & increased competition from cable telephony
% of network access lines lost, YoY
network access line results
wireline segment
Q2-05
-1.8%
Q1-05
-1.1%
Q3-05
-2.2%
Q4-05
-2.4%

15 Exceeded original wireline revenue and Non-ILEC EBITDA targets
2005 results comparison to original targets
1 Provided on December 17, 2004
$21MNon-ILEC EBITDA
$1.85BEBITDA
original 2005 targets1
Non-ILEC Revenue
Revenue
2005 actual results
$632M
$4.85B
wireline segment
Capex
High-Speed Net Adds
$914M
73K
$0 to 10M
$1.85 to 1.90B
$600 to $650M
$4.70 to 4.75B
$950 to 1,000M
approx. 100K
met or exceeded

16 Achieved updated wireline guidance
2005 results comparison to guidance
1 Updated on December 16, 2005
$21MNon-ILEC EBITDA
$1.85BEBITDA
most recent guidance1
Non-ILEC Revenue
Revenue
2005 actual results
$632M
$4.85B
wireline segment
Capex
High-Speed Net Adds
$914M
73K
$15 to $20M
$1.84 to $1.865B
$625 to $635M
$4.825 to $4.85B
approx. $900M
> 65K
met or exceeded

17Profitability significantly impacted by labour disruption and one-time debt redemption charge
$374M$343MCapex
42%$0.22$0.38EPS
4.2%$734M$767MEBITDA
6.2%$2.09B$1.96BRevenue
changeQ4-05Q4-04
financial results
TELUS Consolidated
8.9%
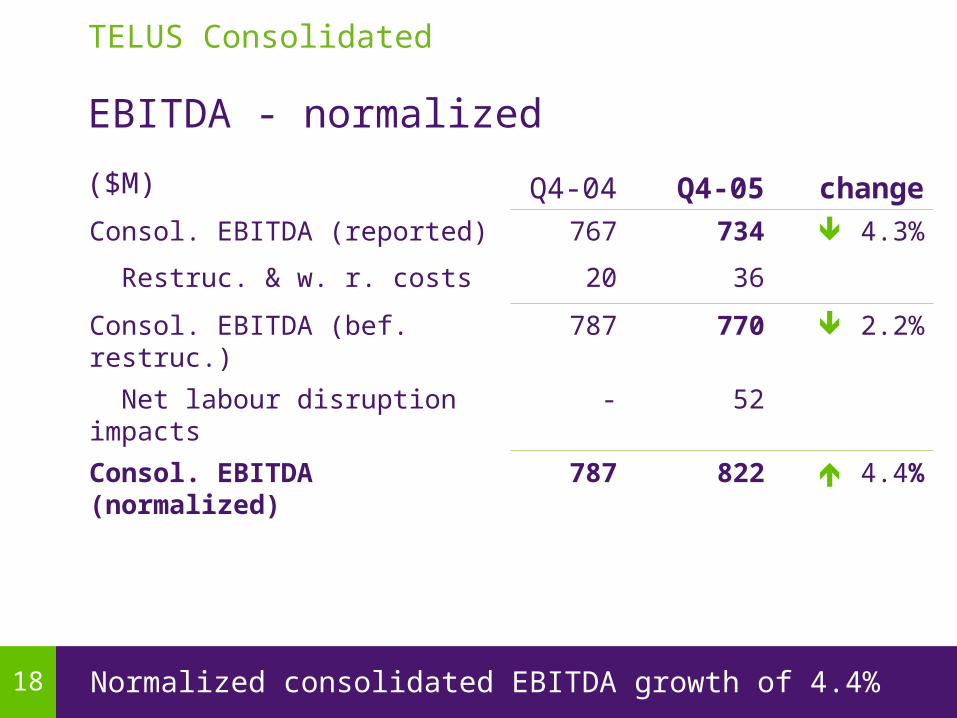
18 Normalized consolidated EBITDA growth of 4.4%
EBITDA - normalized
Q4-04 Q4-05 change
Consol. EBITDA (reported) 767 734 4.3%
Restruc. & w. r. costs 20 36
Consol. EBITDA (bef. restruc.) 787 770 2.2%
Net labour disruption impacts - 52
Consol. EBITDA (normalized) 787 822 4.4%
($M)
TELUS Consolidated

19 Strong normalized EPS growth at 40%
EPS continuity
$0.01(0.07) Tax related matters
42%$0.22$0.38EPS reported
changeQ4-05Q4-04
TELUS Consolidated
$0.10 - Labour disruption impact
$0.07$0.04 Restr. & workforce reduction
EPS normalized $0.33 $0.46 40%
Early bond redemption - $0.06
Other (0.02) -
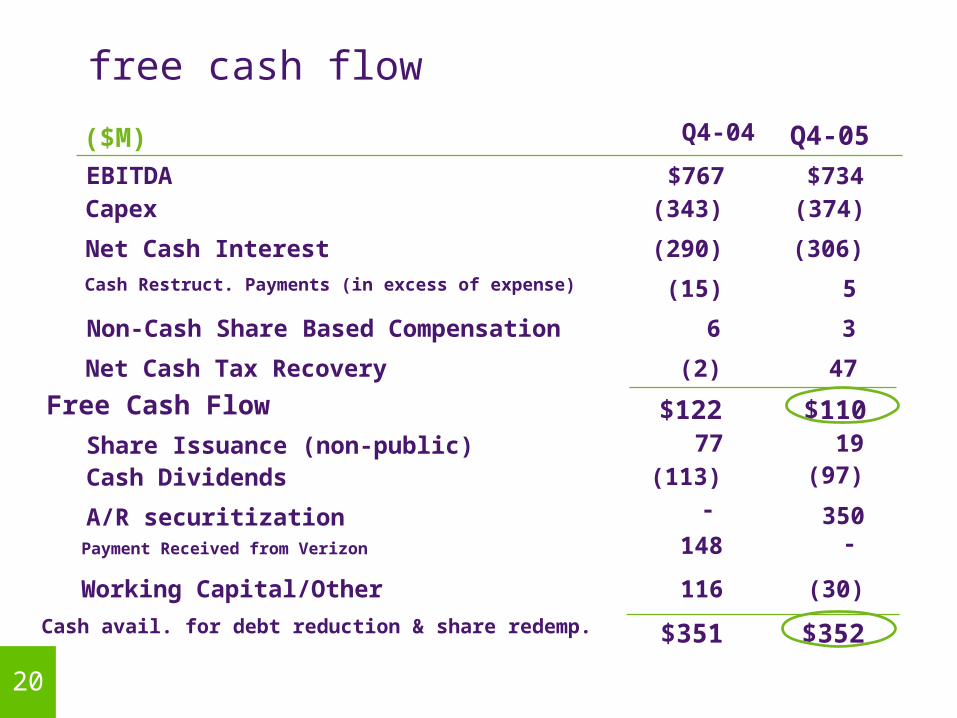
20
$122
(2)
(290)
(343)$767
Q4-04
$110
47
(306)
(374)$734
Q4-05
Free Cash Flow
Net Cash Tax Recovery
Net Cash Interest
CapexEBITDA
($M)
(15) 5Cash Restruct. Payments (in excess of expense)
6 3Non-Cash Share Based Compensation
free cash flow
$351
116
(113)
$352
(30)
(97)
Cash avail. for debt reduction & share redemp.
Working Capital/Other
Cash Dividends
77 19Share Issuance (non-public)
- 350A/R securitization148 -Payment Received from Verizon
21
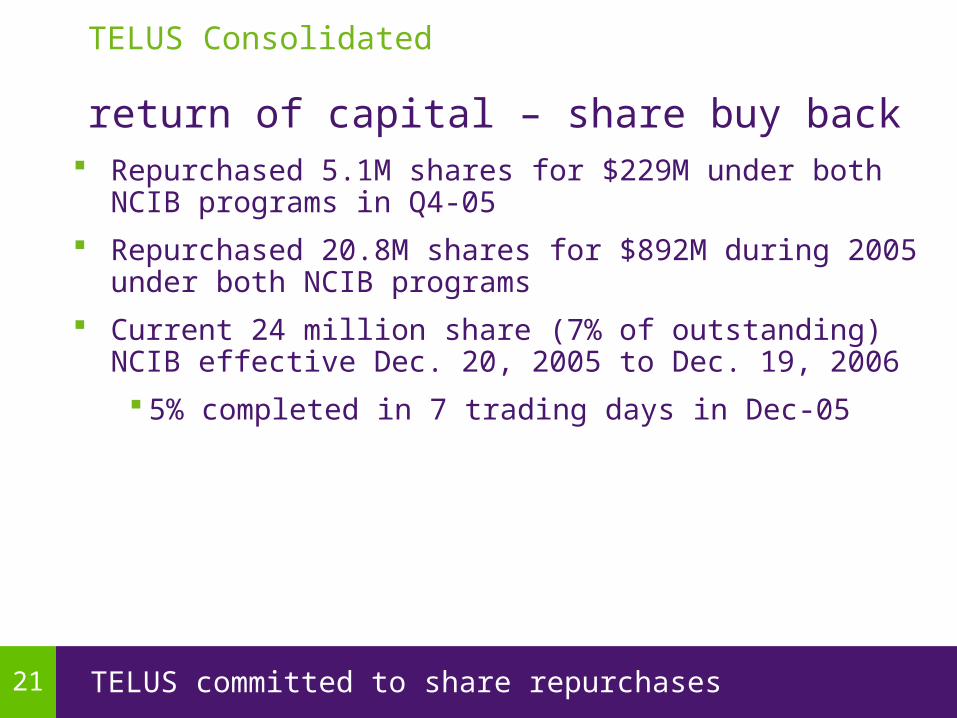
Repurchased 5.1M shares for $229M under both NCIB programs in Q4-05
Repurchased 20.8M shares for $892M during 2005 under both NCIB programs
Current 24 million share (7% of outstanding) NCIB effective Dec. 20, 2005 to Dec. 19, 2006
5% completed in 7 trading days in Dec-05
return of capital – share buy back
TELUS committed to share repurchases
TELUS Consolidated

22
Completed $1.6B early debt redemption of 7.5% Series CA Notes on Dec. 1, 2005
Funded by cash on hand, $350M increase in A/R securitization program and $142M in bank facilities
Incurred $33.5M loss on redemption & settlement of interest rate hedges
Interest savings benefit in Dec-05 and 2006
Previously announced a 38% quarterly dividend increase to 27.5 cents per share, for Jan. 1, 2006 payment
Consistent with dividend payout ratio guideline of 45 to 55% of sustainable net earnings
return of capital – continued
TELUS has strong track record for returning capital to investors
TELUS Consolidated

23 All four rating agencies upgraded TELUS in 2005
credit ratings & financial policy targets
TELUS consolidated
Previous Rating Current Rating Date of Change
Moody’s Baa3 (stable) Baa2 (stable) June 27
S&P BBB (positive) BBB+ (stable) Sept 27
Fitch BBB (positive) BBB+ (stable) Oct 18
DBRS BBB (stable) BBB high (stable) Oct 24
1.7x 1.5 to 2.0xNet Debt : EBITDA
Q4-05Long-term financial policy target
1 Net debt to EBITDA target updated November 10, 2005
target1
Net Debt : Total Cap 45 to 50% 45.7%
Met

24 Original targets challenging as compared to analyst estimates
2005 results versus analyst estimates
1 Analyst consensus estimates for TELUS, as at Nov 30/04, preceding 2005 targets provided Dec 17/042 Provided December 17, 2004
Capex
EPS
EBITDA
Revenue
2005 consensus estimates1
TELUS Consolidated
$1.35B
$1.80
$3.25B
$7.84B
Free Cash Flow $1.20B
2005 original targets2
$1.3 to 1.4B
$1.65 to 1.85
$3.2 to 3.3B
$7.9 to 8.0B
$1.2 to 1.3B
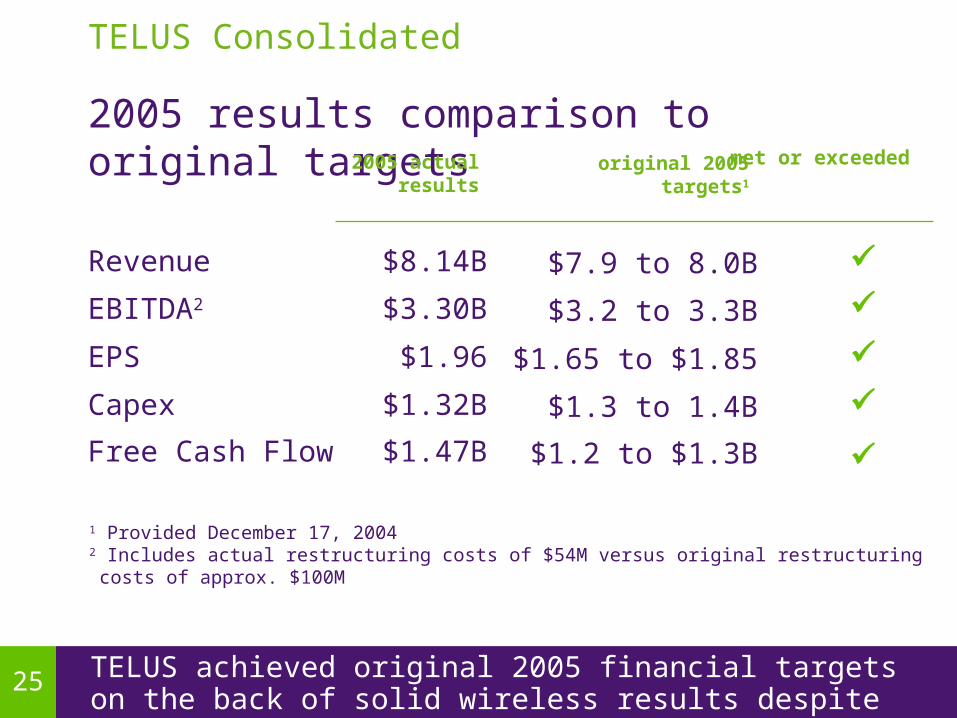
25TELUS achieved original 2005 financial targets on the back of solid wireless results despite labour disruption
2005 results comparison to original targets
1 Provided December 17, 20042 Includes actual restructuring costs of $54M versus original restructuring costs of approx. $100M
$1.47BFree Cash Flow
$1.32BCapex
$1.96EPS
original 2005 targets1
EBITDA2
Revenue
2005 actual results
$3.30B
$8.14B
$1.2 to $1.3B
$1.3 to 1.4B
$1.65 to $1.85
$3.2 to 3.3B
$7.9 to 8.0B
TELUS Consolidated
met or exceeded

26 Consolidated results consistent with December 2005 guidance
2005 results comparison to guidance
1 Updated December 16, 20052 Actual 2005 results include restructuring costs of $54M
$1.47BFree Cash Flow
$1.32BCapex
$1.96EPS
most recent guidance1
EBITDA2
Revenue
2005 actual results
$3.30B
$8.14B
$1.4 to 1.5B
approx. $1.3B
$1.90 to 2.00
$3.275 to 3.325B
$8.10 to 8.15B
TELUS Consolidated
met or exceeded

27
Pension plans – update
Strong investment performance in Q4-05 and lower discount rate for 2006
In aggregate, TELUS pension funds are 98% funded
Approx. $165M in cash contributions expected in 2006 (DB & DC plans)
Discount rate assumption for 2006 lowered to 5.0% (vs. 5.25% guidance on Dec. 16, 2005, and 6.0% in 2005)
TCI defined benefit pension plans ceased accepting new management employees
Lower discount rate offset by strong investment performance
TELUS Consolidated
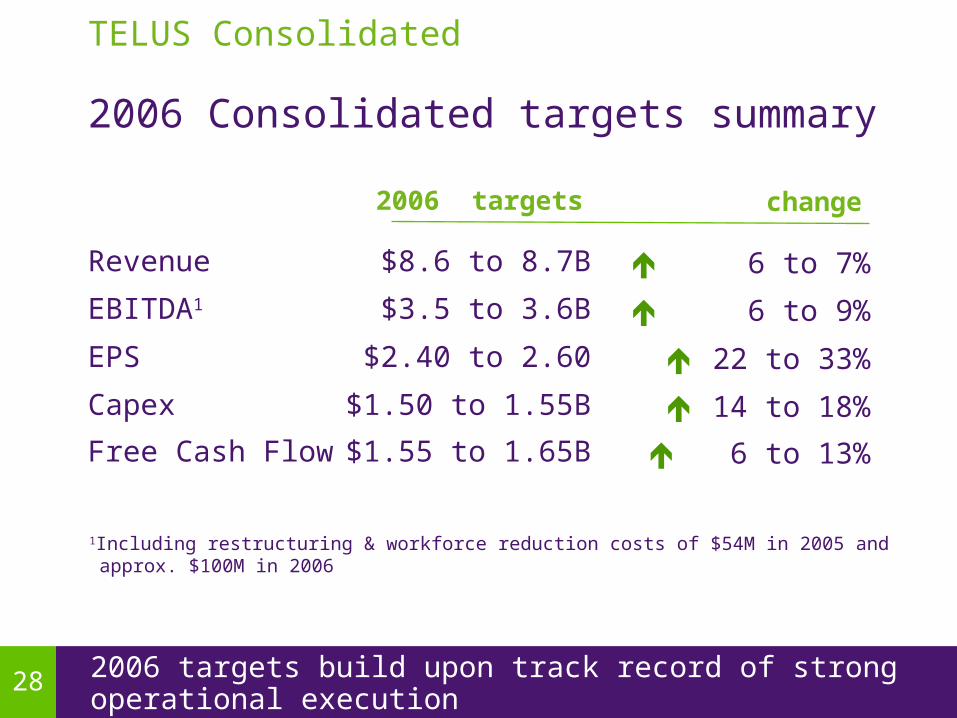
282006 targets build upon track record of strong operational execution
2006 Consolidated targets summary
1Including restructuring & workforce reduction costs of $54M in 2005 and approx. $100M in 2006
$1.55 to 1.65BFree Cash Flow
$1.50 to 1.55BCapex
$2.40 to 2.60EPS
change
EBITDA1
Revenue
2006 targets
$3.5 to 3.6B
$8.6 to 8.7B
TELUS Consolidated
6 to 13%
14 to 18%
22 to 33%
6 to 9%
6 to 7%

29
Solid quarterly and annual consolidated results despite one-time labour disruption impact and increasingly competitive environment
Continued strong profitable wireless growth Reached 5-year collective agreement allowing for
increased flexibility Generating significant cash flow Strong 2006 revenue, earnings and cash flow growth
outlook
Summary
TELUS Consolidated
Continued execution into a future friendly 2006


31
definitions
appendix
TELUS definitions for non-GAAP measures
EBITDA: Earnings, after restructuring and workforce reduction costs, before interest, taxes, depreciation and amortization
Capital intensity: capex divided by total revenue
Cash flow: EBITDA less capex
Free Cash Flow: EBITDA, adding Restructuring and workforce reduction costs, cash interest received and excess of share compensation expense over share compensation payments, subtracting cash interest paid, cash taxes, capital expenditures, and cash restructuring payments