10 30-16 earnings slides - 1 q16 final
TRANSCRIPT
Sysco 1Q16 Earnings ResultsSysco 1Q16 Earnings Results
November 02, 2015
2
Forward-Looking StatementsStatements made in this presentation or in our earnings call for the first quarter of fiscal 2016 that look forward in time or that expressmanagement’s beliefs, expectations or hopes are forward-looking statements within the meaning of the Private Securities LitigationReform Act of 1995. Such forward-looking statements reflect the views of management at the time such statements are made and aresubject to a number of risks, uncertainties, estimates, and assumptions that may cause actual results to differ materially from currentexpectations. These statements include our plans and expectations related to our three-year financial goals, including targets for operatingincome and adjusted ROIC, and the key levers for realizing these goals, expectations regarding food cost inflation and deflation andcurrency translation, expectations regarding share repurchases, and expectations regarding earnings per share. The success of our plansand expectations regarding our operating performance, including expectations regarding our three-year financial goals and earnings pershare, are subject to the general risks associated with our business, including the risks of interruption of supplies due to lack of long-termcontracts, severe weather, crop conditions, work stoppages, intense competition, technology disruptions, dependence on large regionaland national customers, inflation risks, the impact of fuel prices, adverse publicity, and labor issues. Risks and uncertainties also includerisks impacting the economy generally, including the risks that the current general economic conditions will deteriorate, or consumerconfidence in the economy or consumer spending, particularly on food-away-from-home, may decline. Market conditions may notimprove. If sales from our locally managed customers do not grow at the same rate as sales from regional and national customers, ourgross margins may decline. Our ability to meet our long-term strategic objectives depends largely on the success of our various businessinitiatives. There are various risks related to these efforts, including the risk that these efforts may not provide the expected benefits inour anticipated time frame, if at all, and may prove costlier than expected; the risk that the actual costs of any initiatives may be greateror less than currently expected; and the risk of adverse effects to our business, results of operations and liquidity if past and futureundertakings, and the associated changes to our business, do not prove to be cost effective or do not result in the cost savings and otherbenefits at the levels that we anticipate. Our plans related to and the timing of any initiatives are subject to change at any time based onmanagement’s subjective evaluation of our overall business needs. If we are unable to realize the anticipated benefits from our efforts, wecould become cost disadvantaged in the marketplace, and our competitiveness and our profitability could decrease. Capital expendituresmay vary based on changes in business plans and other factors, including risks related to the implementation of various initiatives, thetiming and successful completion of acquisitions, construction schedules and the possibility that other cash requirements could result indelays or cancellations of capital spending. Periods of high inflation, either overall or in certain product categories, can have a negativeimpact on us and our customers, as high food costs can reduce consumer spending in the food-away-from-home market, and maynegatively impact our sales, gross profit, operating income and earnings, and periods of deflation can be difficult to manage effectively.Fluctuations in inflation and deflation, as well as fluctuations in the value of foreign currencies, are beyond our control and subject tobroader market forces. Expanding into international markets presents unique challenges and risks, including compliance with local laws,regulations and customs and the impact of local political and economic conditions, and such expansion efforts may not be successful. Anybusiness that we acquire may not perform as expected, and we may not realize the anticipated benefits of our acquisitions. Expectationsregarding the accounting treatment of any acquisitions may change based on management’s subjective evaluation. Expectations regardingshare repurchases are subject to various factors beyond management’s control, including fluctuations in the stock market, and decisionsregarding share repurchases are subject to change based on management’s subjective evaluation of the Company’s needs. For adiscussion of additional factors impacting Sysco’s business, see the Company’s Annual Report on Form 10-K for the year ended June 27,2015, as filed with the Securities and Exchange Commission, and the Company’s subsequent filings with the SEC. Sysco does notundertake to update its forward-looking statements.

Bill DeLaneyPresident and CEO
Bill DeLaneyPresident and CEO
4
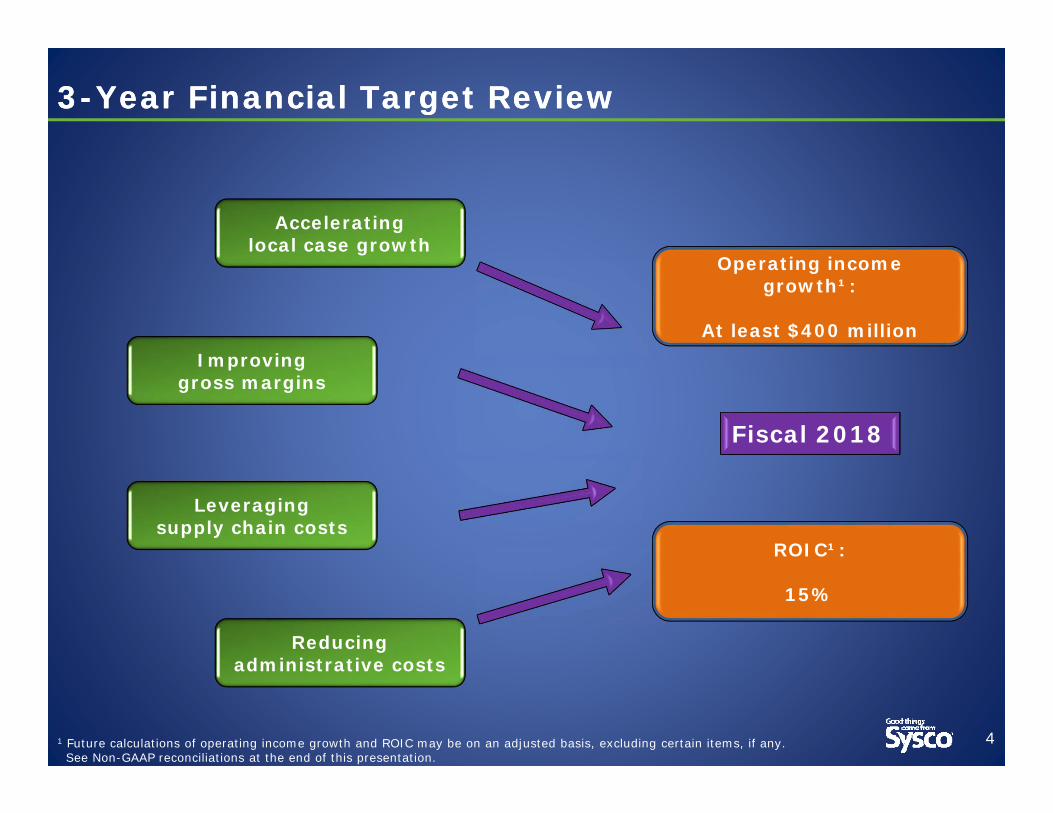
3-Year Financial Target Review3-Year Financial Target Review
Reducing administrative costs
Leveraging supply chain costs
Improving gross margins
Accelerating local case growth
Fiscal 2018
Operating income growth¹:
At least $400 million
ROIC¹:
15%
1 Future calculations of operating income growth and ROIC may be on an adjusted basis, excluding certain items, if any.See Non-GAAP reconciliations at the end of this presentation.
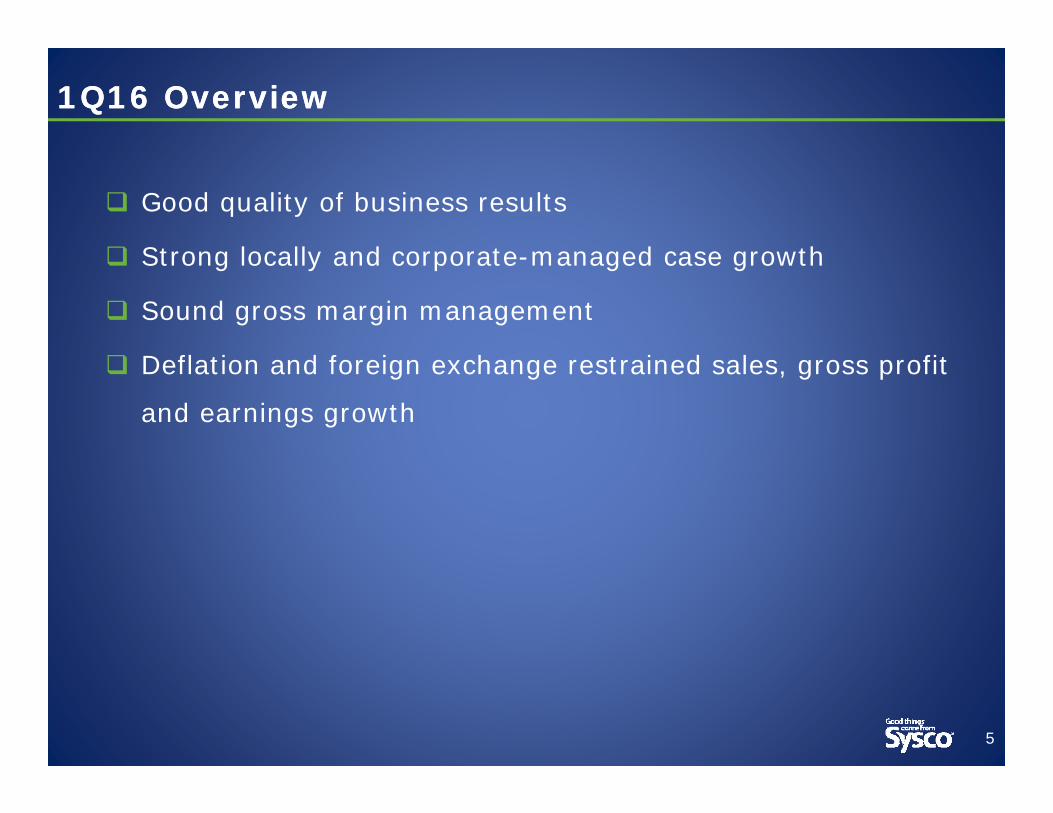
Good quality of business results
Strong locally and corporate-managed case growth
Sound gross margin management
Deflation and foreign exchange restrained sales, gross profit
and earnings growth
5
1Q16 Overview1Q16 Overview

Industry & Economic Trends Are MixedIndustry & Economic Trends Are Mixed
6
101.4
101.6
95
96
97
98
99
100
101
102
103
104
105
Aug-10 Aug-11 Aug-12 Aug-13 Aug-14 Aug-15
National Restaurant Association Restaurant Performance Index
Current Situation Index Expectations Index
89.0
94.5
91.0
103.8
94.6
99.8
90.9
102.6
97.6
80.0
85.0
90.0
95.0
100.0
105.0
110.0
115.0
Sep-14 Dec-14 Mar-15 Jun-15 Sep-15
Consumer Confidence
Pre-recession Level (2006)106
0.9%
2.1%2.7%
3.1%3.4%
2.7% 2.9%
-2%
-1%
0%
1%
2%
3%
4%
DJF'14 MAM'14 JJA'14 SON'14 DJF'15 MAM'15 JJA'15
Spend Traffic
NPD: Restaurant Spend/Traffic% Change vs. Year Ago
5.9%5.6%
5.5%5.3%
5.1%
0
100,000
200,000
300,000
400,000
500,000
3.0%
3.5%
4.0%
4.5%
5.0%
5.5%
6.0%
6.5%
7.0%
Sep-14 Dec-14 Mar-15 Jun-15 Sep-15
U.S. Unemployment RateChange in U.S. Non-Farm Payroll
Unemployment Rate & Non-Farm Payroll

1Q16 Financial Highlights 1Q16 Financial Highlights
71 See Non-GAAP reconciliations at the end of this presentation.
Adjusted1 Reported
$MM, except per share data 1Q16 YOY %
Change 1Q16 YOY %Change
Sales $12,563 0.9% $12,563 0.9%
Gross Profit $2,238 2.3% $2,238 2.3%
Operating Expense $1,732 3.1% $1,745 1.2%
Operating Income $506 -0.5% $493 6.0%
Net Earnings $312 0.9% $244 -12.3%
Diluted EPS $0.52 flat $0.41 -12.8%

8
US Broadline PerformanceUS Broadline Performance
US Broadline performance was the key driver of overall results
2.0% local case growth
1.1% deflation in US Broadline
4.6% gross profit growth
2.7% operating expense growth
6.4% operating income growth
Business Driver HighlightsBusiness Driver Highlights
9
Category management continues to drive benefits
Sysco brand penetration continues to improve
Revenue management pilots promising
Underlying business has good momentum and we are on-track to deliver on our long-term objectives

Joel GradeEVP and CFOJoel Grade
EVP and CFO
1Q16 Financial Highlights 1Q16 Financial Highlights
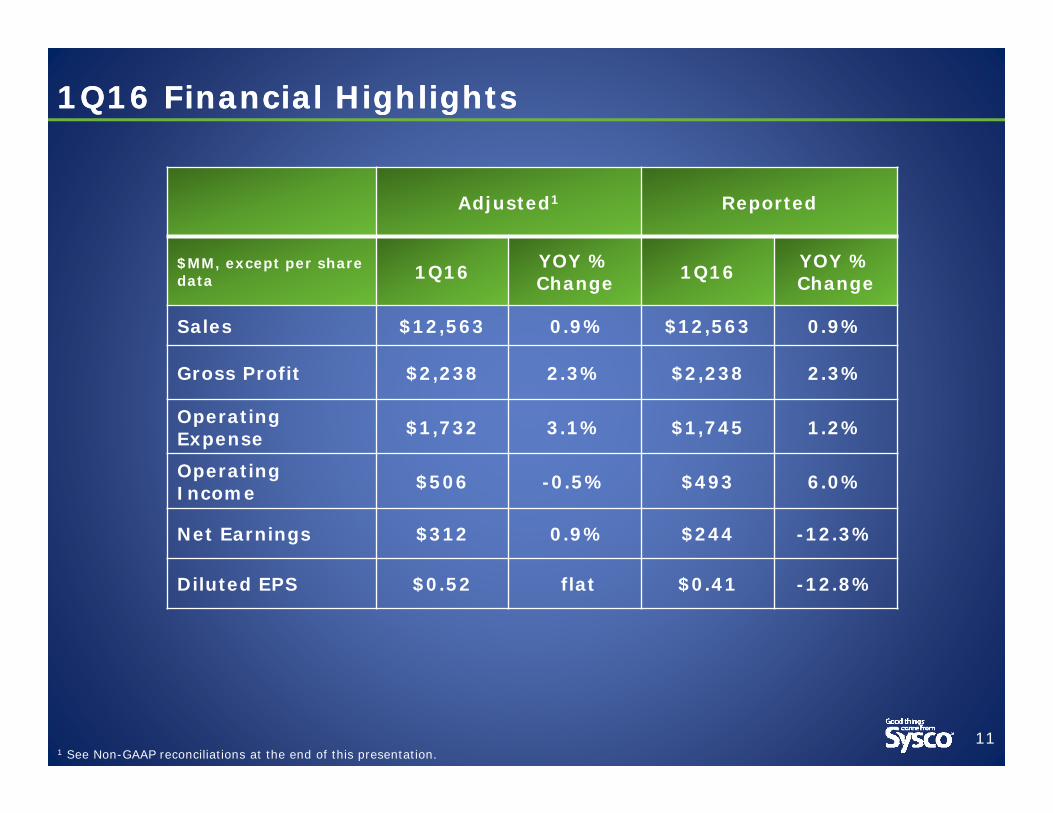
111 See Non-GAAP reconciliations at the end of this presentation.
Adjusted1 Reported
$MM, except per share data 1Q16 YOY %
Change 1Q16 YOY %Change
Sales $12,563 0.9% $12,563 0.9%
Gross Profit $2,238 2.3% $2,238 2.3%
Operating Expense $1,732 3.1% $1,745 1.2%
Operating Income $506 -0.5% $493 6.0%
Net Earnings $312 0.9% $244 -12.3%
Diluted EPS $0.52 flat $0.41 -12.8%

12
1Q16 Sales1Q16 Sales
Sales increased approximately 1% compared to the prior year Deflation of 0.2% vs. inflation of 4.9% in prior year FX Impact was -2.0%
Strong USD vs. CND Total Broadline Case Growth: +3.3%
US Broadline remains strong Corporate-managed remains healthy
2.0%2.5%
3.5%3.1%
3.7%3.4%
1.4% 1.4% 1.5% 1.7%
2.1% 2.0%
0.0%
1.0%
2.0%
3.0%
4.0%
5.0%
4Q14 1Q15 2Q15 3Q15 4Q15 1Q16
US Broadline Case GrowthUSBL
Local
Sales were +3.0% on a constant currency basis
Impact of Inflation on Sales GrowthImpact of Inflation on Sales Growth
13
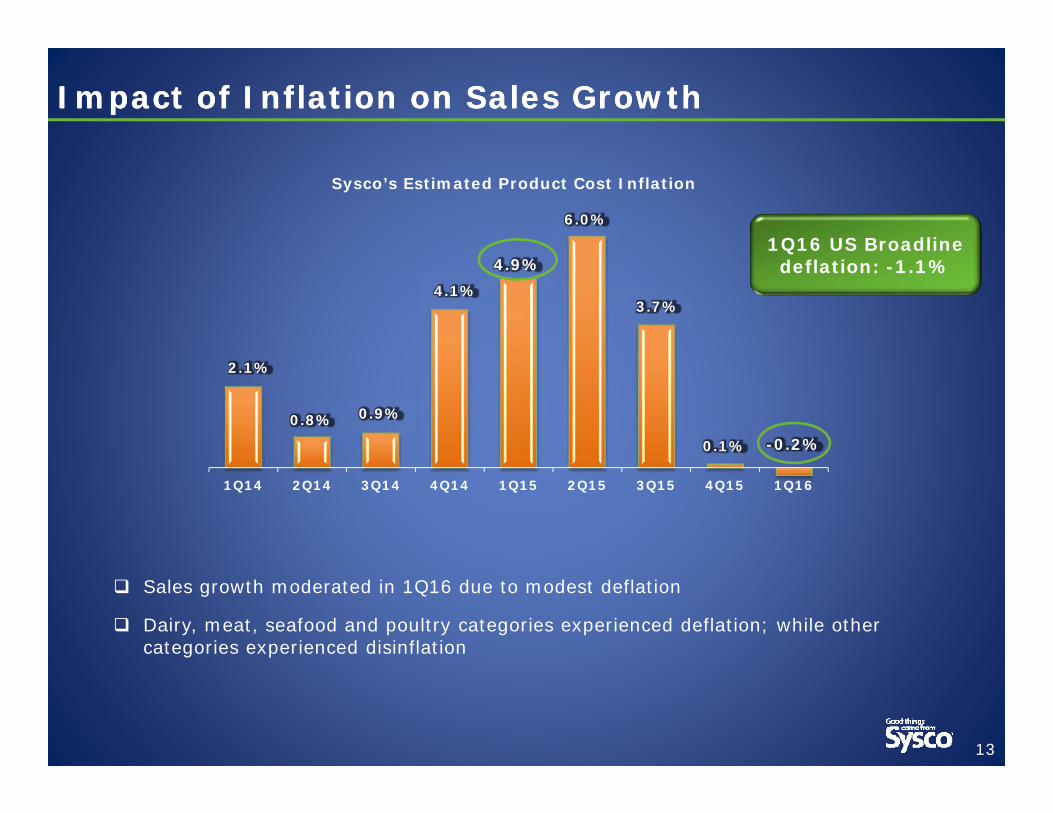
Sales growth moderated in 1Q16 due to modest deflation
Dairy, meat, seafood and poultry categories experienced deflation; while other categories experienced disinflation
2.1%
0.8% 0.9%
4.1%
4.9%
6.0%
3.7%
0.1% -0.2%
1Q14 2Q14 3Q14 4Q14 1Q15 2Q15 3Q15 4Q15 1Q16
Sysco’s Estimated Product Cost Inflation
1Q16 US Broadlinedeflation: -1.1%

Improved Gross Margin Performance in 1Q16Improved Gross Margin Performance in 1Q16
14
Gross margin improvement driven mainly by U.S. Broadline performance Stronger relative mix of
locally-managed sales
Ongoing category management benefits
Improved mix of Sysco-brand
Deflation
1.8%
0.7%
2.7%
4.0%
6.0% 6.1%
3.1% 3.0%2.3%
0.0%
1.0%
2.0%
3.0%
4.0%
5.0%
6.0%
7.0%
1Q14 2Q14 3Q14 4Q14 1Q15 2Q15 3Q15 4Q15 1Q16
YOY % Change in Gross Profit
Gross profits were +4.3% on a constant currency basis
17.81%
17.2%
17.4%
17.6%
17.8%
18.0%
18.2%
18.4%
Q1 Q2 Q3 Q4
Gross Margin Seasonality
FY13 FY14 FY15 FY16

Expenses Related To Certain ItemsExpenses Related To Certain Items
15
($ in millions) 1Q16 Certain Items:
Operating Expense:Severance and Restructuring $3.2US Foods Merger Termination Costs $9.8
Interest Expense:US Foods Merger Termination Costs $94.8
Total Certain Items $107.8
1Q16 Adjusted Operating Expense¹1Q16 Adjusted Operating Expense¹
161 See Non-GAAP reconciliations at the end of this presentation
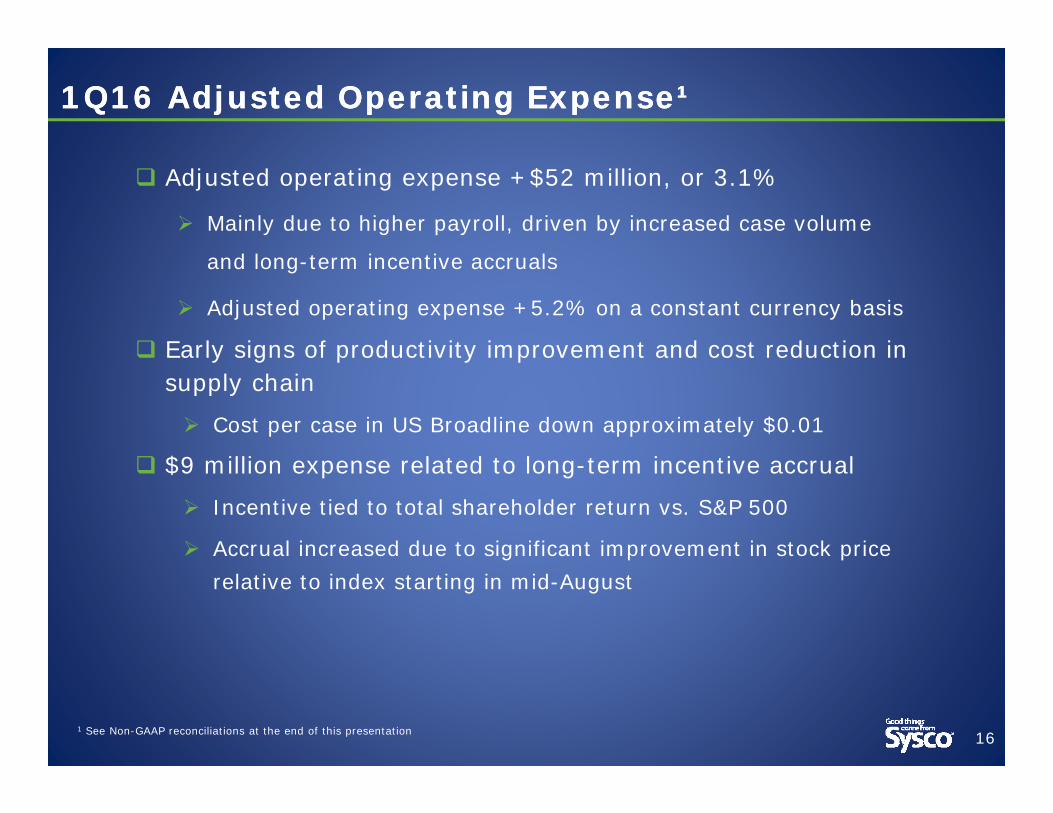
Adjusted operating expense +$52 million, or 3.1%
Mainly due to higher payroll, driven by increased case volume
and long-term incentive accruals
Adjusted operating expense +5.2% on a constant currency basis
Early signs of productivity improvement and cost reduction in supply chain
Cost per case in US Broadline down approximately $0.01
$9 million expense related to long-term incentive accrual
Incentive tied to total shareholder return vs. S&P 500
Accrual increased due to significant improvement in stock price relative to index starting in mid-August

1Q16 Operating Income, Net Income, EPS¹1Q16 Operating Income, Net Income, EPS¹
171 See Non-GAAP reconciliations at the end of this presentation
Adjusted operating income -0.5%
Adjusted net earnings +0.9%
Increase in other income due to the elimination of the non-Sysco portion of the results associated with our Joint Ventures
Adjusted EPS flat at $0.52
Increase in diluted shares negatively impacted EPS by $0.01
Adjusted operating income was +1.2% on a constant currency basis
Adjusted EPS was $0.53 on a constant currency basis

Constant Currency ComparisonsConstant Currency Comparisons
18
Adjusted1 Constant Currency
$M, except per share data 1Q16 YOY %
Change 1Q16 YOY %Change
Sales $12,563 0.9% $12,819 3.0%
Gross Profit $2,238 2.3% $2,282 4.3%
Operating Expense $1,732 3.1% $1,767 5.2%
Operating Income $506 -0.5% $515 1.2%
Net Earnings $312 0.9% $317 2.8%
Diluted EPS $0.52 flat $0.53 1.8%
1 See Non-GAAP reconciliations at the end of this presentation.

19
Cash Flow Performance Cash Flow Performance
1) Capital expenditures are net of proceeds from sales of plant and equipment
($MM) 1Q16 1Q15 $ Chg.
Cash Flow from Operations ($261) $ 63 ($324)
Capital Expenditures, net1 ($120 ) ($ 118) $2
Free Cash Flow ($381) ($ 55) ($326)
Cash Impact of Certain Items ($260) ($41) ($219)
Dividends Paid $179 $ 170 $9
The negative cash impact of certain items on both cash flow from operations and free cash flow was $260 million

Free Cash FlowFree Cash Flow
20
-$100,000
$0
$100,000
$200,000
$300,000
$400,000
$500,000
$600,000
$700,000
Q1 Q2 Q3 Q4
Free Cash Flow Seasonality 2012-2015
2012 2013 2014 2015
Free Cash Flow is seasonal, increasing Sequentially each quarter throughout the fiscal year
1 See Non-GAAP reconciliations at the end of this presentation.
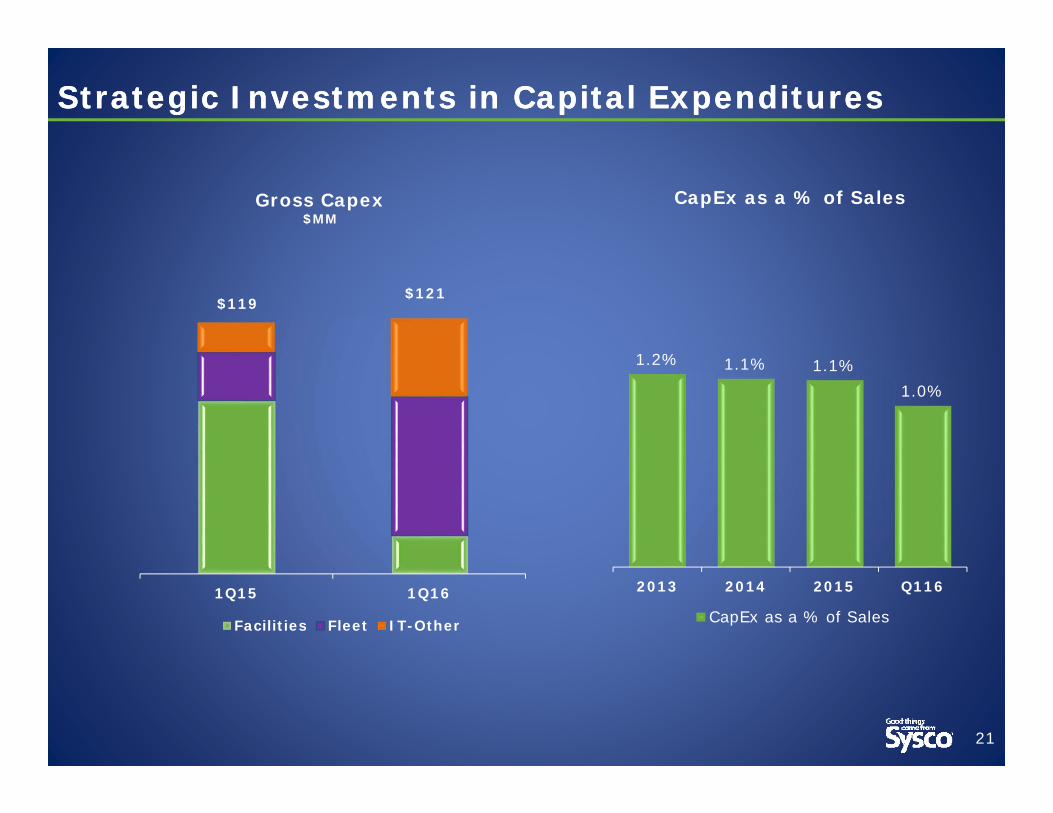
Strategic Investments in Capital Expenditures Strategic Investments in Capital Expenditures
21
1Q15 1Q16
Facilities Fleet IT-Other
$119$121
Gross Capex$MM
1.2% 1.1% 1.1%1.0%
2013 2014 2015 Q116
CapEx as a % of Sales
CapEx as a % of Sales

Bill DeLaneyPresident and CEO
Bill DeLaneyPresident and CEO

Pleased With Our Progress … More Work To DoPleased With Our Progress … More Work To Do
23
Encouraged by quality of business performance
Ramping 3-year plan initiatives – commercial initiatives already
seeing traction
Making strides in developing and refining cost reduction plans
Remain confident that we have the right strategy and people to
achieve our 3-year targets

Non-GAAP ReconciliationsNon-GAAP Reconciliations
Impact of Certain ItemsImpact of Certain Items
26
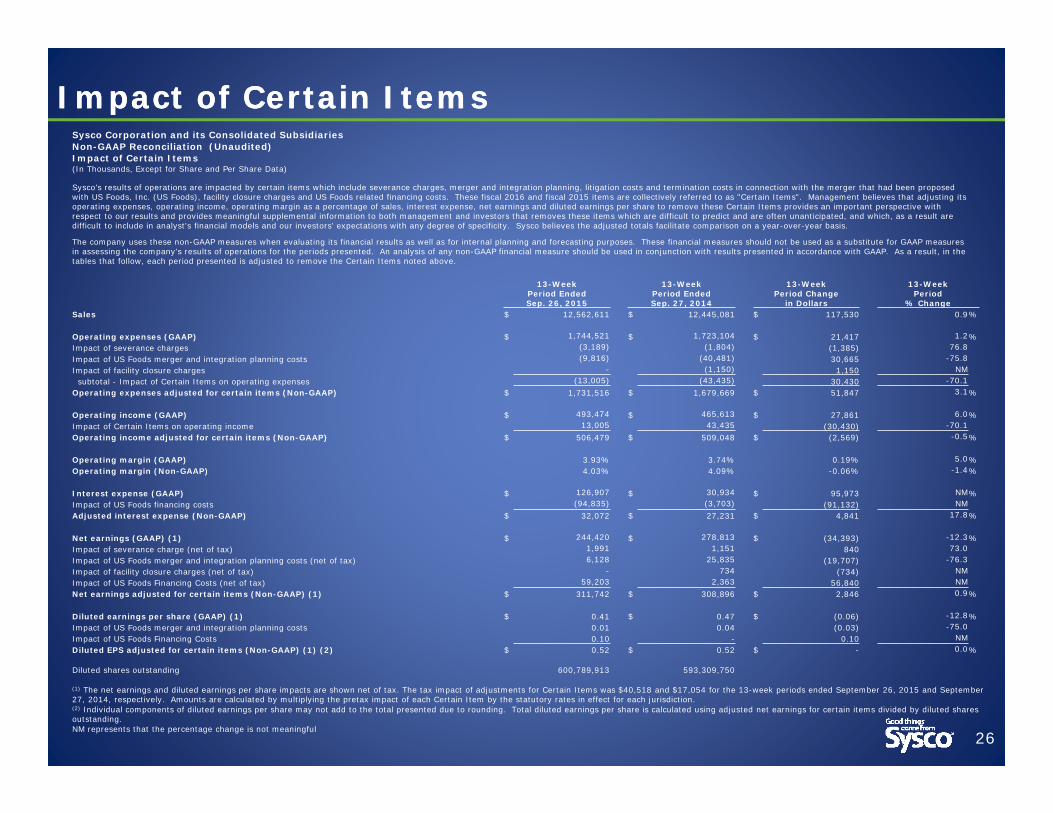
Sysco Corporation and its Consolidated SubsidiariesNon-GAAP Reconciliation (Unaudited)Impact of Certain Items(In Thousands, Except for Share and Per Share Data)
Sysco’s results of operations are impacted by certain items which include severance charges, merger and integration planning, litigation costs and termination costs in connection with the merger that had been proposed with US Foods, Inc. (US Foods), facility closure charges and US Foods related financing costs. These fiscal 2016 and fiscal 2015 items are collectively referred to as "Certain Items". Management believes that adjusting its operating expenses, operating income, operating margin as a percentage of sales, interest expense, net earnings and diluted earnings per share to remove these Certain Items provides an important perspective with respect to our results and provides meaningful supplemental information to both management and investors that removes these items which are difficult to predict and are often unanticipated, and which, as a result are difficult to include in analyst's financial models and our investors' expectations with any degree of specificity. Sysco believes the adjusted totals facilitate comparison on a year-over-year basis.
The company uses these non-GAAP measures when evaluating its financial results as well as for internal planning and forecasting purposes. These financial measures should not be used as a substitute for GAAP measures in assessing the company’s results of operations for the periods presented. An analysis of any non-GAAP financial measure should be used in conjunction with results presented in accordance with GAAP. As a result, in the tables that follow, each period presented is adjusted to remove the Certain Items noted above.
13-Week Period Ended Sep. 26, 2015
13-Week Period Ended Sep. 27, 2014
13-Week Period Change
in Dollars
13-Week Period
% ChangeSales $ 12,562,611 $ 12,445,081 $ 117,530 0.9%
Operating expenses (GAAP) $ 1,744,521 $ 1,723,104 $ 21,417 1.2%Impact of severance charges (3,189) (1,804) (1,385) 76.8Impact of US Foods merger and integration planning costs (9,816) (40,481) 30,665 -75.8Impact of facility closure charges - (1,150) 1,150 NM
subtotal - Impact of Certain Items on operating expenses (13,005) (43,435) 30,430 -70.1Operating expenses adjusted for certain items (Non-GAAP) $ 1,731,516 $ 1,679,669 $ 51,847 3.1%
Operating income (GAAP) $ 493,474 $ 465,613 $ 27,861 6.0%Impact of Certain Items on operating income 13,005 43,435 (30,430) -70.1Operating income adjusted for certain items (Non-GAAP) $ 506,479 $ 509,048 $ (2,569) -0.5%
Operating margin (GAAP) 3.93% 3.74% 0.19% 5.0%Operating margin (Non-GAAP) 4.03% 4.09% -0.06% -1.4%
Interest expense (GAAP) $ 126,907 $ 30,934 $ 95,973 NM%Impact of US Foods financing costs (94,835) (3,703) (91,132) NMAdjusted interest expense (Non-GAAP) $ 32,072 $ 27,231 $ 4,841 17.8%
Net earnings (GAAP) (1) $ 244,420 $ 278,813 $ (34,393) -12.3%Impact of severance charge (net of tax) 1,991 1,151 840 73.0Impact of US Foods merger and integration planning costs (net of tax) 6,128 25,835 (19,707) -76.3Impact of facility closure charges (net of tax) - 734 (734) NMImpact of US Foods Financing Costs (net of tax) 59,203 2,363 56,840 NMNet earnings adjusted for certain items (Non-GAAP) (1) $ 311,742 $ 308,896 $ 2,846 0.9%
Diluted earnings per share (GAAP) (1) $ 0.41 $ 0.47 $ (0.06) -12.8%Impact of US Foods merger and integration planning costs 0.01 0.04 (0.03) -75.0Impact of US Foods Financing Costs 0.10 - 0.10 NMDiluted EPS adjusted for certain items (Non-GAAP) (1) (2) $ 0.52 $ 0.52 $ - 0.0%
Diluted shares outstanding 600,789,913 593,309,750
(1) The net earnings and diluted earnings per share impacts are shown net of tax. The tax impact of adjustments for Certain Items was $40,518 and $17,054 for the 13-week periods ended September 26, 2015 and September 27, 2014, respectively. Amounts are calculated by multiplying the pretax impact of each Certain Item by the statutory rates in effect for each jurisdiction. (2) Individual components of diluted earnings per share may not add to the total presented due to rounding. Total diluted earnings per share is calculated using adjusted net earnings for certain items divided by diluted shares outstanding.NM represents that the percentage change is not meaningful
Free Cash Flow and Adjusted Free Cash FlowFree Cash Flow and Adjusted Free Cash Flow
27
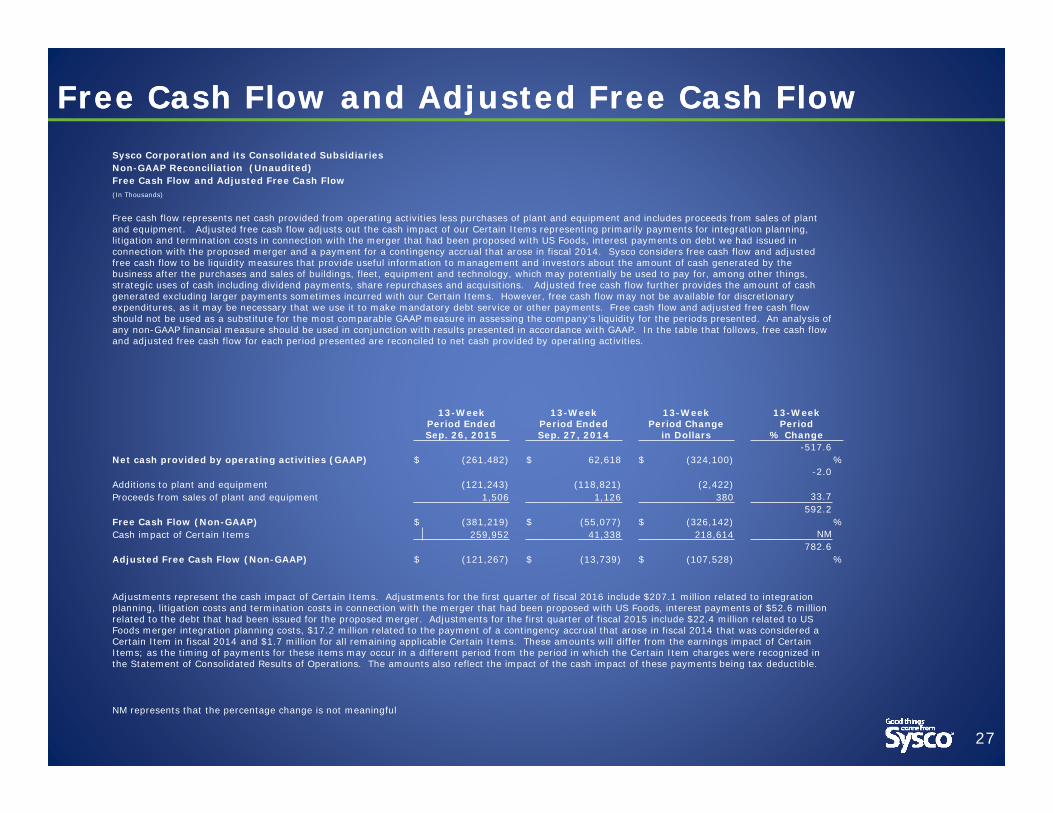
Sysco Corporation and its Consolidated SubsidiariesNon-GAAP Reconciliation (Unaudited)Free Cash Flow and Adjusted Free Cash Flow(In Thousands)
Free cash flow represents net cash provided from operating activities less purchases of plant and equipment and includes proceeds from sales of plant and equipment. Adjusted free cash flow adjusts out the cash impact of our Certain Items representing primarily payments for integration planning, litigation and termination costs in connection with the merger that had been proposed with US Foods, interest payments on debt we had issued in connection with the proposed merger and a payment for a contingency accrual that arose in fiscal 2014. Sysco considers free cash flow and adjusted free cash flow to be liquidity measures that provide useful information to management and investors about the amount of cash generated by the business after the purchases and sales of buildings, fleet, equipment and technology, which may potentially be used to pay for, among other things, strategic uses of cash including dividend payments, share repurchases and acquisitions. Adjusted free cash flow further provides the amount of cash generated excluding larger payments sometimes incurred with our Certain Items. However, free cash flow may not be available for discretionary expenditures, as it may be necessary that we use it to make mandatory debt service or other payments. Free cash flow and adjusted free cash flow should not be used as a substitute for the most comparable GAAP measure in assessing the company’s liquidity for the periods presented. An analysis of any non-GAAP financial measure should be used in conjunction with results presented in accordance with GAAP. In the table that follows, free cash flow and adjusted free cash flow for each period presented are reconciled to net cash provided by operating activities.
13-Week Period Ended Sep. 26, 2015
13-Week Period Ended Sep. 27, 2014
13-Week Period Change
in Dollars
13-Week Period
% Change
Net cash provided by operating activities (GAAP) $ (261,482) $ 62,618 $ (324,100)-517.6
%
Additions to plant and equipment (121,243) (118,821) (2,422)-2.0
Proceeds from sales of plant and equipment 1,506 1,126 380 33.7
Free Cash Flow (Non-GAAP) $ (381,219) $ (55,077) $ (326,142)592.2
%Cash impact of Certain Items 259,952 41,338 218,614 NM
Adjusted Free Cash Flow (Non-GAAP) $ (121,267) $ (13,739) $ (107,528)782.6
%
Adjustments represent the cash impact of Certain Items. Adjustments for the first quarter of fiscal 2016 include $207.1 million related to integration planning, litigation costs and termination costs in connection with the merger that had been proposed with US Foods, interest payments of $52.6 million related to the debt that had been issued for the proposed merger. Adjustments for the first quarter of fiscal 2015 include $22.4 million related to US Foods merger integration planning costs, $17.2 million related to the payment of a contingency accrual that arose in fiscal 2014 that was considered a Certain Item in fiscal 2014 and $1.7 million for all remaining applicable Certain Items. These amounts will differ from the earnings impact of Certain Items; as the timing of payments for these items may occur in a different period from the period in which the Certain Item charges were recognized in the Statement of Consolidated Results of Operations. The amounts also reflect the impact of the cash impact of these payments being tax deductible.
NM represents that the percentage change is not meaningful

ROICROIC
28
Return on Invested Capital (ROIC) Target
We have an ROIC target of 15% that we expect to achieve by fiscal 2018. We cannot predict with certainty when we will achieve these results or whether the calculation of our ROIC in such future period will be on an adjusted basis due to the effect of certain items, which would be excluded from such calculation. Due to these uncertainties, to the extent our future calculation of ROIC is on an adjusted basis excluding certain items, we cannot provide a quantitative reconciliation of this non-GAAP measure to the most directly comparable GAAP measure without unreasonable effort. However, we would expect to calculate adjusted ROIC, if applicable, in the same manner as we have calculated this historically. All components of our adjusted ROIC calculation would be impacted by Certain Items. We calculate adjusted ROIC as adjusted net earnings divided by (i) stockholders’ equity, computed as the average of adjusted stockholders’ equity at the beginning of the year and at the end of each fiscal quarter during the year; and (ii) long-term debt, computed as the average of the long-term debt at the beginning of the year and at the end of each fiscal quarter during the year. Adjusted total invested capital is computed as the sum of (i) adjusted stockholders’ equity, computed as the average of adjusted stockholders’ equity at the beginning of the year and atthe end of each fiscal quarter during the year; and (ii) long-term debt, computed as the average of the long-term debt at the beginning of the year and at the end of each fiscal quarter during the year.
Form of calculation:Net earnings (GAAP)Impact of Certain Items on net earningsAdjusted net earnings (Non-GAAP)
Invested Capital (GAAP)Adjustments to invested capitalAdjusted Invested capital (GAAP)
Return on investment capital (GAAP)Return on investment capital (Non-GAAP)

Constant Currency ImpactConstant Currency Impact
29
Sysco Corporation and its Consolidated SubsidiariesNon-GAAP Reconciliation (Unaudited)Impact of Foreign Currency on Results of Operations Metrics(In Thousands, Except for Share and Per Share Data)
Sysco’s results of operations are impacted by the strengthening U.S. dollar in translating our foreign operations' results into U.S. dollars. This has resulted in a reduction in growth percentages on a year over year basis. Management believes that adjusting its sales, gross profits, operating expenses, operating income, net earnings and diluted earnings per share to remove the impact in changes in foreign currency translation rates provides an important perspective with respect to our results and provides meaningful supplemental information to both management and investors to view our results on a constant currency basis. Sysco believes the adjusted growth rates faciliate comparison on a year-over-year basis. The company uses these non-GAAP measures when evaluating its financial results as well as for internal planning and forecasting purposes. These financial measures should not be used as a substitute for GAAP measures in assessing the company’s results of operations for the periods presented. An analysis of any non-GAAP financial measure should be used in conjunction with results presented in accordance with GAAP. As a result, in the table that follows, the fiscal 2016 period is adjusted to translate results using the same exchange rates as the comparable prior period. Adjusted measures for operating expense, operating income, net earnings and diluted earnings per share are reconciled to GAAP amounts in a separate reconciliation.
Impact on a Constant Currency Basis
13-Week Period Ended Sep. 26, 2015
Foreign Currency
Translation Impact
13-Week Period Ended Sep. 26, 2015 at a Constant
Currency
13-Week Period Ended Sep. 27, 2014
13-Week Period Change
in Dollars
13-Week Period
% ChangeSales $ 12,562,611 $ 256,370 $ 12,818,981 $ 12,445,081 $ 373,900 3.0%Gross profit 2,237,995 44,478 2,282,473 2,188,717 93,756 4.3Adjusted operating expense 1,731,516 35,556 1,767,072 1,679,669 87,403 5.2Adjusted operating income 506,479 8,922 515,401 509,048 6,353 1.2Adjusted net earnings 311,742 5,682 317,424 308,896 8,528 2.8Adjusted diluted earnings per share 0.52 0.01 0.53 0.52 0.01 1.8
Diluted shares outstanding 600,789,913 600,789,913 600,789,913 593,309,750
GAAP AmountsOperating expense $ 1,744,521 $ 1,723,104 $ 21,417 1.2%Operating income 493,474 465,613 27,861 6.0Net earnings 244,420 278,813 (34,393) -12.3Diluted earnings per share 0.52 0.52 - 0.0