01 29-16 earnings slides - 2 q16 final
TRANSCRIPT

Sysco 2Q16 Earnings Results
February 1, 2016

2
Forward-Looking Statements
Statements made in this presentation or in our earnings call for the second quarter of fiscal 2016 that look forward in time or that express management’s beliefs, expectations or hopes are forward-looking statements within the meaning of the Private Securities Litigation Reform Act of 1995. Such forward-looking statements reflect the views of management at the time such statements are made and aresubject to a number of risks, uncertainties, estimates, and assumptions that may cause actual results to differ materially from current expectations. These statements include our plans and expectations related to our three-year financial objectives, including targets for adjusted operating income and adjusted ROIC, and the key levers for realizing these goals, expectations regarding revenue management, expense management and our digital e-commerce strategy, expectations regarding food cost deflation and currency translation, expectations regarding restructuring charges, expectations regarding tax rates, and expectations regarding capital expenditures. The success of our plans and expectations regarding our operating performance, including expectations regarding our three-year financial objectives, are subject to the general risks associated with our business, including the risks of interruption of supplies due to lack of long-term contracts, severe weather, crop conditions, work stoppages, intense competition, technology disruptions, dependence on large regional and national customers, inflation risks, the impact of fuel prices, adverse publicity, and labor issues. Risks and uncertainties also include risks impacting the economy generally, including the risks that the current general economic conditions will deteriorate, or consumer confidence in the economy or consumer spending, particularly on food-away-from-home, may decline. Market conditions maynot improve. If sales from our locally managed customers do not grow at the same rate as sales from regional and national customers, our gross margins may decline. Our ability to meet our long-term strategic objectives depends largely on the success of our various business initiatives, including efforts related to revenue management, expense management, our digital e-commerce strategy and any efforts related to restructuring. There are various risks related to these efforts, including the risk that these efforts may not provide the expected benefits in our anticipated time frame, if at all, and may prove costlier than expected; the risk that the actual costs of any initiatives may be greater or less than currently expected; and the risk of adverse effects to our business, results of operations and liquidity if past and future undertakings, and the associated changes to our business, do not prove to be cost effective or do not result in the cost savings and other benefits at the levels that we anticipate. Our plans related to and the timing of any initiatives are subject to change at any time based on management’s subjective evaluation of our overall business needs. If we are unable to realize the anticipated benefits from our efforts, we could become cost disadvantaged in the marketplace, and our competitiveness and our profitability could decrease. Capital expenditures may vary based on changes in business plans and other factors, including risks related to the implementation of various initiatives, the timing and successful completion of acquisitions, construction schedules and the possibility that other cash requirements could result in delays or cancellations of capital spending. Periods of high inflation, either overall or in certain product categories, can have a negative impact on us and our customers, as high food costs can reduce consumer spending in the food-away-from-home market, and may negatively impact our sales, gross profit, operating income and earnings, and periods of deflation can be difficult to manage effectively. Fluctuations in inflation and deflation, as well as fluctuations in the value of foreign currencies, are beyond our control and subject to broader market forces. Expanding into international markets presents unique challenges and risks, including compliance with local laws, regulations and customs and the impact of local political and economic conditions, and such expansion efforts may not be successful. Any business that we acquire may not perform as expected, and we may not realize the anticipated benefits of our acquisitions. Expectations regarding the accounting treatment of any acquisitions may change based on management’s subjectiveevaluation. Expectations regarding share repurchases are subject to various factors beyond management’s control, including fluctuations in the stock market, and decisions regarding share repurchases are subject to change based on management’s subjective evaluation of the Company’s needs. Expectations regarding tax rates are also subject to various factors beyond management’s control. For a discussion of additional factors impacting Sysco’s business, see the Company’s Annual Report on Form 10-K for the year ended June 27, 2015, as filed with the Securities and Exchange Commission, and the Company’s subsequent filings with the SEC. Sysco does not undertake to update its forward-looking statements.

Bill DeLaneyCEO
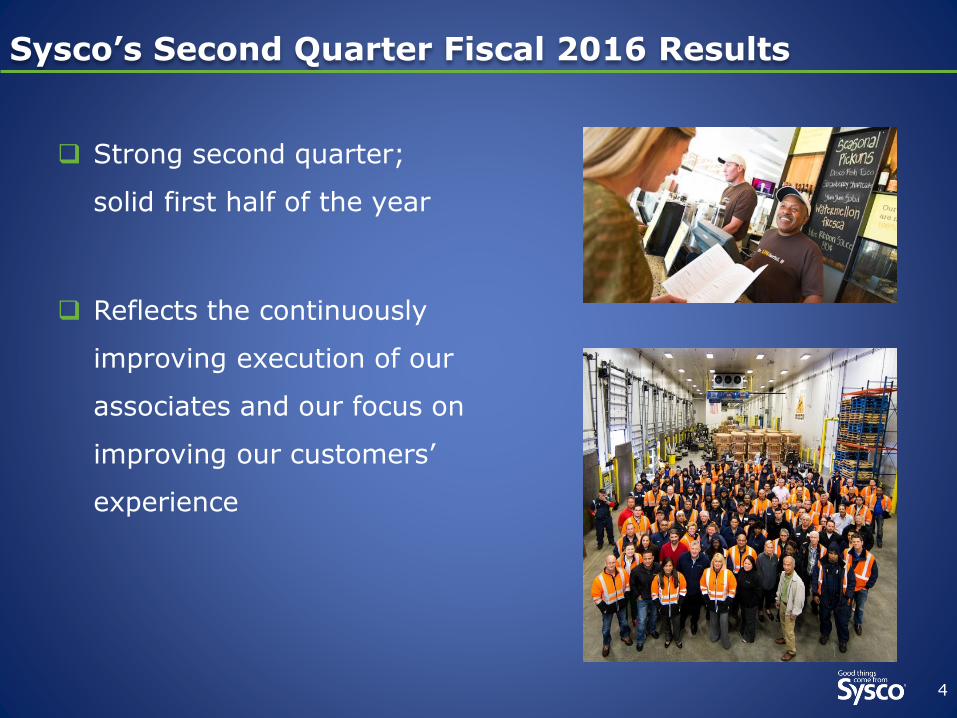
Strong second quarter;
solid first half of the year
Reflects the continuously
improving execution of our
associates and our focus on
improving our customers’
experience
4
Sysco’s Second Quarter Fiscal 2016 Results
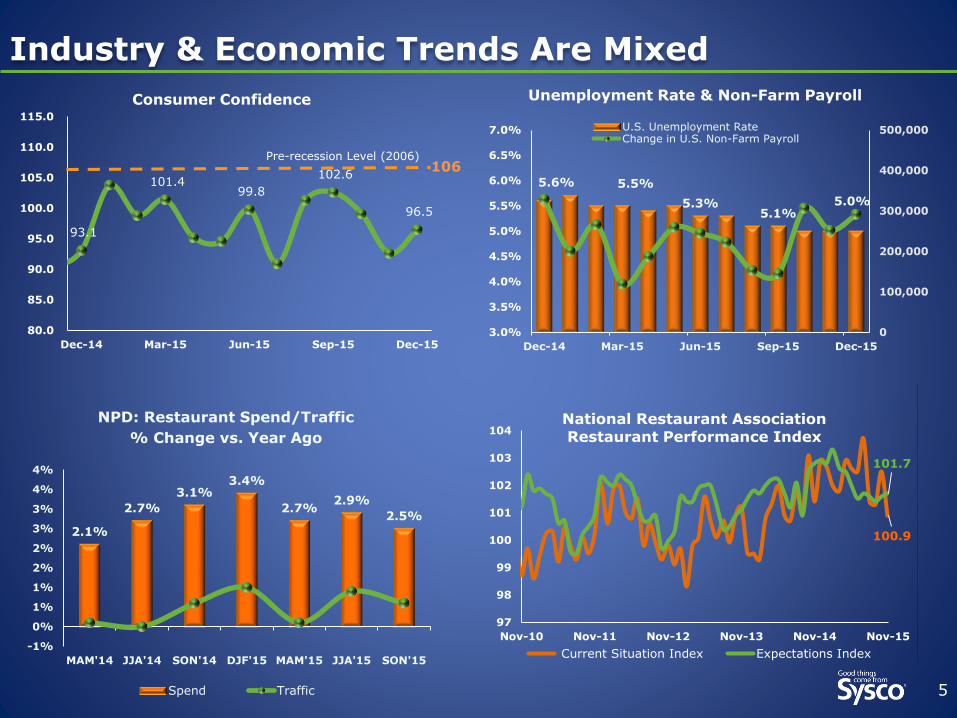
Industry & Economic Trends Are Mixed
5
100.9
101.7
97
98
99
100
101
102
103
104
Nov-10 Nov-11 Nov-12 Nov-13 Nov-14 Nov-15
National Restaurant Association
Restaurant Performance Index
Current Situation Index Expectations Index
93.1
101.4 99.8
102.6
96.5
80.0
85.0
90.0
95.0
100.0
105.0
110.0
115.0
Dec-14 Mar-15 Jun-15 Sep-15 Dec-15
Consumer Confidence
Pre-recession Level (2006)106
2.1%
2.7%
3.1%3.4%
2.7%2.9%
2.5%
-1%
0%
1%
1%
2%
2%
3%
3%
4%
4%
MAM'14 JJA'14 SON'14 DJF'15 MAM'15 JJA'15 SON'15
Spend Traffic
NPD: Restaurant Spend/Traffic
% Change vs. Year Ago
5.6% 5.5%
5.3%5.1%
5.0%
0
100,000
200,000
300,000
400,000
500,000
3.0%
3.5%
4.0%
4.5%
5.0%
5.5%
6.0%
6.5%
7.0%
Dec-14 Mar-15 Jun-15 Sep-15 Dec-15
U.S. Unemployment RateChange in U.S. Non-Farm Payroll
Unemployment Rate & Non-Farm Payroll

Total Broadline case growth +3.4%; local case growth +2.9%
Sales and gross profit adversely impacted by deflation and foreign
exchange
Sales +0.6%
Gross profits +3.4%
Gross margin +50 basis points
Adjusted operating income +10.2%
Solid execution across the business, including U.S. Broadline
Deflation
Accelerated during 2Q16 and into 3Q16
Driven by center of the plate proteins and dairy
Expect deflation to persist at least for remainder of fiscal year
6
2Q16 Results Include 10% Adjusted Operating Income Growth1
1 See Non-GAAP reconciliations at the end of this presentation.
Progress against all 4 key levers for achieving three-year targets
1. Accelerate local case growth
Broadline +2.8%
2. Improve gross margin
Gross margin +36 basis points
3. Leverage supply chain costs
Making solid progress
4. Reduce administrative costs
Gross profit growth modestly exceeded operating expense
growth
7
1H16 Shows Progress Towards Three-Year Plan1
Result: Operating income growth +4% or $38 million
1 See Non-GAAP reconciliations at the end of this presentation.

1H16 Financial Highlights
81 See Non-GAAP reconciliations at the end of this presentation.
Adjusted1 Reported
$MM, except per share data
1H16YOY %Change
1H16YOY %Change
Sales $24,716 0.8% $24,716 0.8%
Gross Profit $4,395 2.8% $4,395 2.8%
Operating Expense
$3,451 2.5% $3,469 -0.7%
Operating Income
$943 4.2% $926 18.6%
Net Earnings $587 6.1% $517 18.3%
Diluted EPS $1.00 7.5% $0.88 20.5%

Sysco is Well Positioned for the Future
9
Improve customer experience
Enhance associate engagement
Achieve our financial objectives
Grow operating income by at least $400M
Grow EPS faster than operating income
Achieve 15% Return on Invested Capital
Strong momentum in the business
Persistent deflationary pressure needs to be
managed
Aggressively reviewing all aspects of business for
incremental cost savings
Well-positioned to achieve 2018 financial
objectives

Tom BenePresident and COO

11
Customer Insights Guide our Improvement Efforts
Better serve customers and shareholders by strengthening
partnerships between business operations, commercial functions
and supply chain
Enhances organizational alignment
Customer insights work driving improvement
Improved processes and tools providing robust information
capabilities
Improve customer retention1
Improve customer penetration2
Accelerate addition of new customers
3

12
US Broadline Delivered Another Strong Quarter
Gross profit growth +5.5%
Gross margin +57 bps
Operating income +9%
2.0%
2.5%
3.5%
3.1%
3.7%
3.4%3.9%
1.4% 1.4%1.5%
1.7%
2.1%2.0%
3.0%
0.0%
1.0%
2.0%
3.0%
4.0%
5.0%
4Q14 1Q15 2Q15 3Q15 4Q15 1Q16 2Q16
US Broadline Case GrowthUSBL Local
13
Marketing Update: Fresh & Local Differentiators
Fresh & Local - educating customers about our capabilities
Drives incremental case and gross profit growth for the category
Example of Differentiation – Partnership with Produce Marketing
Associations to deliver Good Agricultural Practices (GAP) workshop to
more than 800 small farmers since 2011
Helps small, local growers meet our food safety standards
Sysco is one of largest suppliers of Fresh & Local through Broadline, Specialty and FreshPoint

14
Focus on Improving Gross Margins
Managing deflationary environment well
Sysco Brand and Category Management have positive contributions
Category Management - leveraging scale and ability to commit consistent
volumes is a differentiator
Category management continues to deliver incremental benefits to:
Customers
Suppliers
Sysco

15
Customer Experience: Mobile Order Entry
Mobile order-entry platform
The first phase of a platform agnostic digital commerce strategy
Pilots went very well – strong adoption rates
Fully-deployed to all OpCo’s by end of fiscal 2016
Focus will be on customer and MA adoption
Pilots for next phase of digital commerce strategy will soon begin

16
Supply Chain Progress Continues
Solid progress against initiatives
Focus on customer service while driving improved productivity
Continuous improvement mentality
More structured approach to managing expenses
Continued work to be done

Joel GradeEVP and CFO

2Q16 Financial Highlights
181 See Non-GAAP reconciliations at the end of this presentation.
Adjusted1 Reported
$MM, except per share data
2Q16YOY %Change
2Q16YOY %Change
Sales $12,154 0.6% $12,154 0.6%
Gross Profit $2,157 3.4% $2,157 3.4%
Operating Expense
$1,720 1.8% $1,724 -2.6%
Operating Income
$437 10.2% $433 37.1%
Net Earnings $275 12.6% $272 72.4%
Diluted EPS $0.48 17.1% $0.48 77.8%
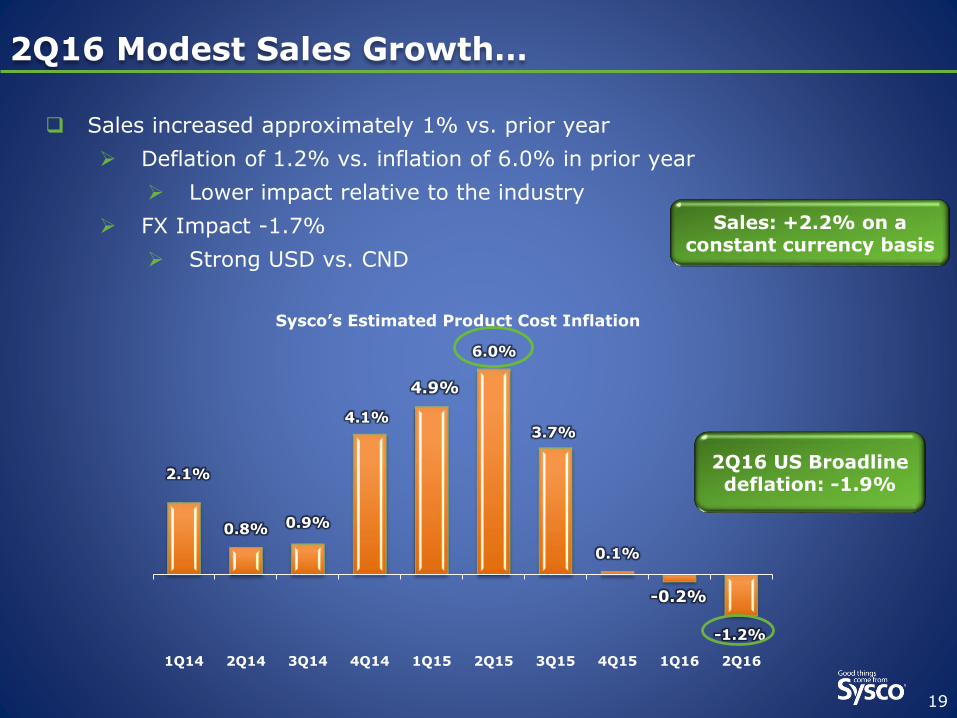
2Q16 Modest Sales Growth…
19
Sales increased approximately 1% vs. prior year
Deflation of 1.2% vs. inflation of 6.0% in prior year
Lower impact relative to the industry
FX Impact -1.7%
Strong USD vs. CND
2.1%
0.8% 0.9%
4.1%
4.9%
6.0%
3.7%
0.1%
-0.2%
-1.2%
1Q14 2Q14 3Q14 4Q14 1Q15 2Q15 3Q15 4Q15 1Q16 2Q16
Sysco’s Estimated Product Cost Inflation
2Q16 US Broadlinedeflation: -1.9%
Sales: +2.2% on a constant currency basis

20
…But Very Solid Case Growth
2.1%
3.7%
3.0%
3.6% 3.7%
3.4%
0.7%1.8%
2.1%2.4% 2.6%
2.9%
-1.0%
0.0%
1.0%
2.0%
3.0%
4.0%
5.0%
1Q15 2Q15 3Q15 4Q15 1Q16 2Q16
Total Broadline Case Growth TBL
Local
Broadline case growth combines US and International operations

Improved Gross Margin Performance in 2Q16
21
Gross margin improvement driven mainly by U.S. Broadline performance
Ongoing category management benefits
Stronger relative mix of locally-managed sales
Improved mix of Sysco-brand in local
Deflation
0.7%
2.7%
4.0%
6.0% 6.1%
3.1% 3.0%2.3%
3.4%
0.0%
1.0%
2.0%
3.0%
4.0%
5.0%
6.0%
7.0%
2Q14 3Q14 4Q14 1Q15 2Q15 3Q15 4Q15 1Q16 2Q16
YOY % Change in Gross Profit
Gross profits were +5.0% on a constant currency basis
17.75%
17.2%
17.4%
17.6%
17.8%
18.0%
18.2%
18.4%
Q1 Q2 Q3 Q4
Gross Margin Seasonality
FY13 FY14 FY15 FY16

2Q16 Adjusted Operating Expense¹
221 See Non-GAAP reconciliations at the end of this presentation
Adjusted operating expense +$31 million, or 1.8%
Drivers were increased case volume and planned business
technology investment
Cost reduction initiatives beginning to contribute
Indirect spending consolidation and reduction
Lower fuel costs
Slower administrative expense growth
US Broadline Cost Per Case down $0.01

2Q16 Operating Income, Net Income, EPS¹
231 See Non-GAAP reconciliations at the end of this presentation
Adjusted operating income +10.2%
Previously disclosed $21 million income
tax expense benefit from favorable
resolution of tax contingencies; +$0.03
per share
Adjusted net earnings +12.2%
Adjusted EPS up 17.1% to $0.48
Adjusted operating income +11.6% on a
constant currency basis
Adjusted EPS $0.49 on a constant currency basis

Constant Currency Comparisons
24
Adjusted1 Constant Currency1
$MM, except per share data
2Q16YOY %Change
2Q16YOY %Change
Sales $12,154 0.6% $12,351 2.2%
Gross Profit $2,157 3.4% $2,190 5.0%
Operating Expense
$1,720 1.8% $1,748 3.5%
Operating Income
$437 10.2% $442 11.6%
Net Earnings $275 12.6% $279 14.0%
Diluted EPS $0.48 17.1% $0.49 19.5%
1 See Non-GAAP reconciliations at the end of this presentation.

25
Cash Flow Performance
1) Capital expenditures are net of proceeds from sales of plant and equipment2) See Non-GAAP reconciliations at the end of this presentation.
($MM) 1H16 1H15 $ Chg.
Cash Flow from Operations $469 $452 $16
Capital Expenditures, net1 ($237 ) ($296) ($59)
Free Cash Flow² $231 $157 $75
Cash Impact of Certain Items ($264) ($102) ($162)
Dividends Paid $348 $341 $7
2Q16 Cash Flow from Operations was $730 million
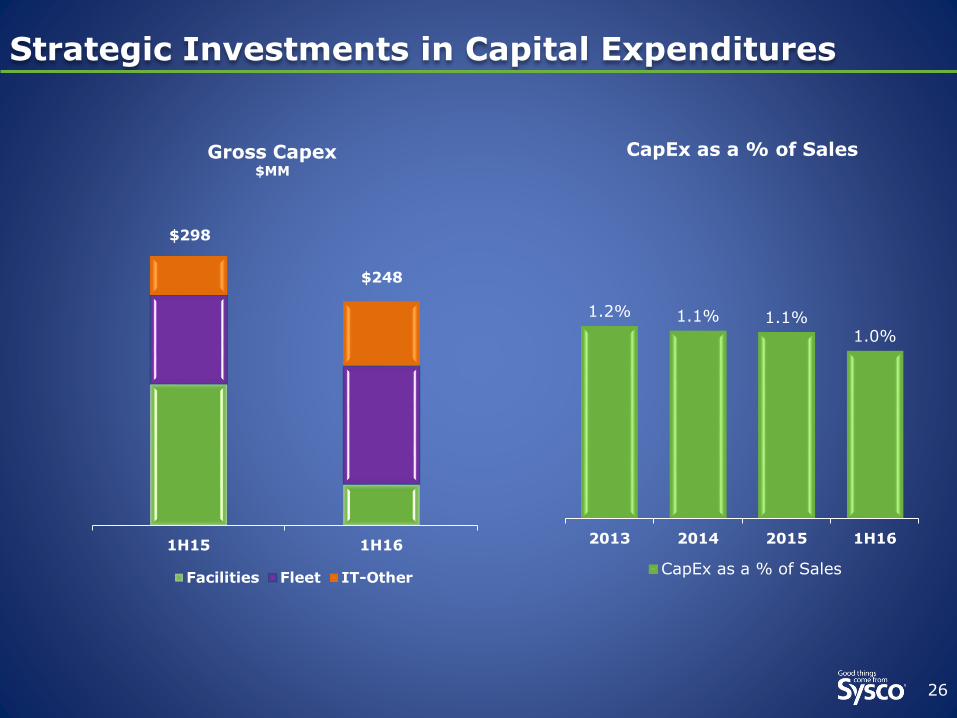
Strategic Investments in Capital Expenditures
26
1H15 1H16
Facilities Fleet IT-Other
$298
$248
Gross Capex$MM
1.2% 1.1% 1.1%1.0%
2013 2014 2015 1H16
CapEx as a % of Sales
CapEx as a % of Sales

Fiscal 2016 Commentary
27
On track to achieve fiscal 2016 plan
Deflation is expected to persist for at least the remainder
of the fiscal year
4Q15 presents a challenging comparison to prior year
Capex expected to be near the low-end of $550-$600
million range
Expect a normalized tax rate of 36-37% over the
remaining 26 weeks

Summary
28
Strong quarter, continued momentum in
underlying business
More work ahead of us to achieve fiscal 2016 and
three-year plan objectives
More rigorous process for expense management in place
Aggressively reviewing all aspects of our business for incremental cost
savings

Non-GAAP Reconciliations

Impact of Certain Items 2Q16
31
Sysco Corporation and its Consolidated Subsidiaries
Impact of Certain Items
Sales $ 12,153,626 $ 12,087,074 $ 66,552 0.6 %
Operating expenses (GAAP) $ 1,724,231 $ 1,769,691 $ (45,460) -2.6 %
Impact of restructuring cost (4,281) (2,790) (1,491) 53.4
Impact of US Foods merger and integration planning costs - (78,019) 78,019 NM
Operating expenses adjusted for certain items (Non-GAAP) $ 1,719,950 $ 1,688,882 $ 31,068 1.8 %
Operating income (GAAP) $ 432,583 $ 315,446 $ 117,137 37.1 %
Impact of restructuring cost 4,281 2,790 1,491 53.4
Impact of US Foods merger and integration planning costs - 78,019 (78,019) NM
Operating income adjusted for certain items (Non-GAAP) $ 436,864 $ 396,255 $ 40,609 10.2 %
Operating margin (GAAP) 3.56% 2.61% 0.95% 36.4 %
Operating margin (Non-GAAP) 3.59% 3.28% 0.32% 9.6 %
Interest expense (GAAP) $ 47,235 $ 77,042 $ (29,807) -38.7 %
Impact of US Foods financing costs - (52,057) 52,057 NM
Adjusted interest expense (Non-GAAP) $ 47,235 $ 24,985 $ 22,250 89.1 %
Net earnings (GAAP) (1) $ 272,399 $ 157,979 $ 114,420 72.4 %
Impact of restructuring cost (net of tax) 2,966 1,819 1,147 63.1
Impact of US Foods merger and integration planning costs (net of tax) - 50,876 (50,876) NM
Impact of US Foods Financing Costs (net of tax) - 33,946 (33,946) NM
Net earnings adjusted for certain items (Non-GAAP) (1) $ 275,365 $ 244,620 $ 30,745 12.6 %
Diluted earnings per share (GAAP) (1) $ 0.48 $ 0.27 $ 0.21 77.8 %
Impact of restructuring cost 0.01 - 0.01 NM
Impact of US Foods merger and integration planning costs - 0.09 (0.09) NM
Impact of US Foods Financing Costs - 0.06 (0.06) NM
Diluted EPS adjusted for certain items (Non-GAAP) (1) (2) $ 0.48 $ 0.41 $ 0.07 17.1 %
Diluted shares outstanding 571,452,124 595,911,680
NM represents that the percentage change is not meaningful
(1) The net earnings and diluted earnings per share impacts are shown net of tax. The tax impact of adjustments for Certain Items was $1,315 and
$46,224 for the 13-week periods ended December 26, 2015 and December 27, 2014, respectively. Amounts are calculated by multiplying the pretax
impact of each Certain Item by the statutory rates in effect for each jurisdiction.
(2) Individual components of diluted earnings per share may not add to the total presented due to rounding. Total diluted earnings per share is calculated
using adjusted net earnings for certain items divided by diluted shares outstanding.
- more -
Non-GAAP Reconciliation (Unaudited)
(In Thousands, Except for Share and Per Share Data)
13-Week
Period Ended
Dec. 26, 2015
13-Week
Period Ended
Dec. 27, 2014
13-Week
Period Change
in Dollars
13-Week
Period
% Change
Sysco’s results of operations are impacted by certain items which include restructuring costs (consisting of severance charges, facility closure charges and
professional fees incurred related to our three-year financial objectives), merger and integration planning, and termination costs in connection with the
merger that had been proposed with US Foods, Inc. (US Foods), and US Foods related financing costs. These fiscal 2016 and fiscal 2015 items are
collectively referred to as "Certain Items". Management believes that adjusting its operating expenses, operating income, operating margin as a percentage
of sales, interest expense, net earnings and diluted earnings per share to remove these Certain Items provides an important perspective with respect to our
results and provides meaningful supplemental information to both management and investors that removes these items which are difficult to predict and are
often unanticipated, and which, as a result are difficult to include in analyst's financial models and our investors' expectations with any degree of
specificity. Sysco believes the adjusted totals facilitate comparison on a year-over-year basis.
The company uses these non-GAAP measures when evaluating its financial results as well as for internal planning and forecasting purposes. These financial
measures should not be used as a substitute for GAAP measures in assessing the company’s results of operations for the periods presented. An analysis of
any non-GAAP financial measure should be used in conjunction with results presented in accordance with GAAP. As a result, in the tables that follow, each
period presented is adjusted to remove the Certain Items noted above.

Impact of Certain Items – 1H16
32
Sysco Corporation and its Consolidated Subsidiaries
Impact of Certain Items
Sales $ 24,716,237 $ 24,532,155 $ 184,082 0.8 %
Operating expenses (GAAP) $ 3,468,752 $ 3,492,795 $ (24,043) -0.7 %
Impact of restructuring cost (7,470) (5,745) (1,725) 30.0
Impact of US Foods merger and integration planning costs (9,816) (118,499) 108,683 -91.7
Operating expenses adjusted for certain items (Non-GAAP) $ 3,451,466 $ 3,368,551 $ 82,915 2.5 %
Operating income (GAAP) $ 926,057 $ 781,059 $ 144,998 18.6 %
Impact of restructuring cost 7,470 5,745 1,725 30.0
Impact of US Foods merger and integration planning costs 9,816 118,499 (108,683) -91.7
Operating income adjusted for certain items (Non-GAAP) $ 943,343 $ 905,303 $ 38,040 4.2 %
Operating margin (GAAP) 3.75% 3.18% 0.56% 17.7 %
Operating margin (Non-GAAP) 3.82% 3.69% 0.13% 3.4 %
Interest expense (GAAP) $ 174,142 $ 107,976 $ 66,166 61.3 %
Impact of US Foods financing costs (94,835) (55,761) (39,074) 70.1
Adjusted interest expense (Non-GAAP) $ 79,307 $ 52,215 $ 27,092 51.9 %
Net earnings (GAAP) (1) $ 516,819 $ 436,792 $ 80,027 18.3 %
Impact of restructuring cost (net of tax) 4,683 3,729 954 25.6
Impact of US Foods merger and integration planning costs (net of tax) 6,154 76,901 (70,747) -92.0
Impact of US Foods Financing Costs (net of tax) 59,452 36,187 23,265 64.3
Net earnings adjusted for certain items (Non-GAAP) (1) $ 587,108 $ 553,609 $ 33,499 6.1 %
Diluted earnings per share (GAAP) (1) $ 0.88 $ 0.73 $ 0.15 20.5 %
Impact of restructuring cost 0.01 - 0.01 NM
Impact of US Foods merger and integration planning costs 0.01 0.13 (0.12) -92.3
Impact of US Foods Financing Costs 0.10 0.06 0.04 66.7
Diluted EPS adjusted for certain items (Non-GAAP) (1) (2) $ 1.00 $ 0.93 $ 0.07 7.5 %
Diluted shares outstanding 586,121,013 594,610,315
NM represents that the percentage change is not meaningful
(1) The net earnings and diluted earnings per share impacts are shown net of tax. The tax impact of adjustments for Certain Items was $41,832 and
$63,189 for the 26-week periods ended December 26, 2015 and December 27, 2014, respectively. Amounts are calculated by multiplying the pretax
impact of each Certain Item by the statutory rates in effect for each jurisdiction.
(2) Individual components of diluted earnings per share may not add to the total presented due to rounding. Total diluted earnings per share is calculated
using adjusted net earnings for certain items divided by diluted shares outstanding.
- more -
Non-GAAP Reconciliation (Unaudited)
(In Thousands, Except for Share and Per Share Data)
26-Week
Period Ended
Dec. 26, 2015
26-Week
Period Ended
Dec. 27, 2014
26-Week
Period Change
in Dollars
26-Week
Period
% Change

Adjusted Cash Flow From Operations
33
Sysco Corporation and its Consolidated Subsidiaries
Adjusted Cash Flows Used in / Provided by Operating Activities
Net cash provided by operating activities (GAAP) $ 468,881 $ 452,438 $ 16,443 3.6 %
Cash impact of Certain Items 263,903 101,668 162,235 NM
Adjusted net cash provided by operating activities
(Non-GAAP) $ 732,784 $ 554,106 $ 178,678 32.2 %
Adjustments represent the cash impact of Certain Items. Adjustments for the first 26 weeks of fiscal 2016 primarily include $207.9
million related to integration planning, litigation costs and termination costs in connection with the merger that had been proposed with
US Foods, interest payments of $55.2 million related to the debt that had been issued for the proposed merger. Adjustments for the
first 26 weeks of fiscal 2015 include $81.2 million related to US Foods merger integration planning costs, $17.2 million related to the
payment of a contingency accrual that arose in fiscal 2014 that was considered a Certain Item in fiscal 2014 and $3.3 million for all
remaining applicable Certain Items. These amounts will differ from the earnings impact of Certain Items; as the timing of payments for
these items may occur in a different period from the period in which the Certain Item charges were recognized in the Statement of
Consolidated Results of Operations. The amounts also reflect the impact of the cash impact of these payments being tax deductible.
NM represents that the percentage change is not meaningful
Non-GAAP Reconciliation (Unaudited)
(In Thousands)
Adjusted cash flows provided by operating activities adjusts out the cash impact of our Certain Items representing primarily payments
for integration planning, litigation and termination costs in connection with the merger that had been proposed with US Foods, interest
payments on debt we had issued in connection with the proposed merger and a payment for a contingency accrual that arose in fiscal
2014. Sysco considers adjusted cash flows provided by operating activities to be liquidity measures that provide useful information to
management and investors about the amount of cash generated excluding larger payments sometimes incurred with our Certain Items.
Adjusted cash flows provided by operating activities should not be used as a substitute for the most comparable GAAP measure in
assessing the company’s liquidity for the periods presented. An analysis of any non-GAAP financial measure should be used in
conjunction with results presented in accordance with GAAP. In the table that follows, cash flows provided by operating activities for
each period presented are reconciled to net cash provided by operating activities.
26-Week
Period Ended
Dec. 26, 2015
26-Week
Period Ended
Dec. 27, 2014
26-Week
Period Change
in Dollars
26-Week
Period
% Change

Free Cash Flow
34
Sysco Corporation and its Consolidated Subsidiaries
Free Cash Flow and Adjusted Free Cash Flow
Net cash provided by operating activities (GAAP) $ 468,881 $ 452,438 $ 16,443 3.6 %
Additions to plant and equipment (248,233) (298,068) 49,835 -16.7
Proceeds from sales of plant and equipment 10,827 2,130 8,697 408.3
Free Cash Flow (Non-GAAP) $ 231,475 $ 156,500 $ 74,975 47.9 %
Cash impact of Certain Items 263,903 101,668 162,235 NM
Adjusted Free Cash Flow (Non-GAAP) $ 495,378 $ 258,168 $ 237,210 91.9 %
NM represents that the percentage change is not meaningful
Adjustments represent the cash impact of Certain Items. Adjustments for the first 26 weeks of fiscal 2016 primarily include $207.9
million related to integration planning, litigation costs and termination costs in connection with the merger that had been proposed with
US Foods, interest payments of $55.2 million related to the debt that had been issued for the proposed merger. Adjustments for the
first 26 weeks of fiscal 2015 include $81.2 million related to US Foods merger integration planning costs, $17.2 million related to the
payment of a contingency accrual that arose in fiscal 2014 that was considered a Certain Item in fiscal 2014 and $3.3 million for all
remaining applicable Certain Items. These amounts will differ from the earnings impact of Certain Items, as the timing of payments for
these items may occur in a different period from the period in which the Certain Item charges were recognized in the Statement of
Consolidated Results of Operations. The amounts also reflect that the cash impact of these payments is tax deductible.
Non-GAAP Reconciliation (Unaudited)
(In Thousands)
Free cash flow represents net cash provided from operating activities less purchases of plant and equipment and includes proceeds
from sales of plant and equipment. Adjusted free cash flow adjusts out the cash impact of our Certain Items representing primarily
payments for integration planning, litigation and termination costs in connection with the merger that had been proposed with US
Foods, interest payments on debt we had issued in connection with the proposed merger and a payment for a contingency accrual that
arose in fiscal 2014. Sysco considers free cash flow and adjusted free cash flow to be liquidity measures that provide useful
information to management and investors about the amount of cash generated by the business after the purchases and sales of
buildings, fleet, equipment and technology, which may potentially be used to pay for, among other things, strategic uses of cash
including dividend payments, share repurchases and acquisitions. Adjusted free cash flow further provides the amount of cash
generated excluding larger payments sometimes incurred with our Certain Items. However, free cash flow may not be available for
discretionary expenditures, as it may be necessary that we use it to make mandatory debt service or other payments. Free cash flow
and adjusted free cash flow should not be used as a substitute for the most comparable GAAP measure in assessing the company’s
liquidity for the periods presented. An analysis of any non-GAAP financial measure should be used in conjunction with results presented
in accordance with GAAP. In the table that follows, free cash flow and adjusted free cash flow for each period presented are
reconciled to net cash provided by operating activities.
26-Week
Period
% Change
26-Week
Period Ended
Dec. 26, 2015
26-Week
Period Ended
Dec. 27, 2014
26-Week
Period Change
in Dollars

ROIC
35
Adjusted Return on Invested Capital (ROIC) Target
Form of calculation:
Net earnings (GAAP)
Impact of Certain Items on net earnings
Adjusted net earnings (Non-GAAP)
Invested Capital (GAAP)
Adjustments to invested capital
Adjusted Invested capital (GAAP)
Return on investment capital (GAAP)
Return on investment capital (Non-GAAP)
We have an ROIC target of 15% that we expect to achieve by fiscal 2018. We cannot predict with certainty
when we will achieve these results or whether the calculation of our ROIC in such future period will be on an
adjusted basis due to the effect of certain items, which would be excluded from such calculation. Due to these
uncertainties, to the extent our future calculation of ROIC is on an adjusted basis excluding certain items, we
cannot provide a quantitative reconciliation of this non-GAAP measure to the most directly comparable GAAP
measure without unreasonable effort. However, we would expect to calculate adjusted ROIC, if applicable, in
the same manner as we have calculated this historically. All components of our adjusted ROIC calculation would
be impacted by Certain Items. We calculate adjusted ROIC as adjusted net earnings divided by (i) stockholders’
equity, computed as the average of adjusted stockholders’ equity at the beginning of the year and at the end
of each fiscal quarter during the year; and (ii) long-term debt, computed as the average of the long-term debt
at the beginning of the year and at the end of each fiscal quarter during the year. Adjusted total invested
capital is computed as the sum of (i) adjusted stockholders’ equity, computed as the average of adjusted
stockholders’ equity at the beginning of the year and at the end of each fiscal quarter during the year; and (ii)
long-term debt, computed as the average of the long-term debt at the beginning of the year and at the end of
each fiscal quarter during the year.

Constant Currency Impact
36
Sysco Corporation and its Consolidated Subsidiaries
Impact of Foreign Currency on Results of Operations Metrics
Sales $ 12,153,626 $ 197,642 $ 12,351,268 $ 12,087,074 $ 264,194 2.2 %
Gross profit 2,156,814 33,346 2,190,160 2,085,137 105,023 5.0
Adjusted operating expense 1,719,950 28,136 1,748,086 1,688,882 59,204 3.5
Adjusted operating income 436,864 5,210 442,074 396,255 45,819 11.6
Adjusted net earnings 275,365 3,610 278,975 244,620 34,355 14.0
Adjusted diluted earnings per share 0.48 0.01 0.49 0.41 0.08 19.5
Diluted shares outstanding 571,452,124 571,452,124 571,452,124 595,911,680
GAAP Amounts
Operating expense $ 1,724,231 $ 1,769,691 $ (45,460) -2.6 %
Operating income 432,583 315,446 117,137 37.1
Net earnings 272,399 157,979 114,420 72.4
Diluted earnings per share 0.48 0.27 0 77.8
Foreign
Currency
Translation
Impact
13-Week
Period Ended
Dec. 26, 2015
at a Constant
Currency
Non-GAAP Reconciliation (Unaudited)
(In Thousands, Except for Share and Per Share Data)
Sysco’s results of operations are impacted by the strengthening U.S. dollar in translating our foreign operations' results into U.S. dollars. This has resulted in a reduction in growth
percentages on a year over year basis. Management believes that adjusting its sales, gross profits, operating expenses, operating income, net earnings and diluted earnings per
share to remove the impact in changes in foreign currency translation rates provides an important perspective with respect to our results and provides meaningful supplemental
information to both management and investors to view our results on a constant currency basis. Sysco believes the adjusted growth rates faciliate comparison on a year-over-
year basis. The company uses these non-GAAP measures when evaluating its financial results as well as for internal planning and forecasting purposes. These financial measures
should not be used as a substitute for GAAP measures in assessing the company’s results of operations for the periods presented. An analysis of any non-GAAP financial measure
should be used in conjunction with results presented in accordance with GAAP. As a result, in the table that follows, the fiscal 2016 period is adjusted to translate results using
the same exchange rates as the comparable prior period. Adjusted measures for operating expense, operating income, net earnings and diluted earnings per share are reconciled
to GAAP amounts in a separate reconciliation.
13-Week
Period Ended
Dec. 26, 2015
13-Week
Period Ended
Dec. 27, 2014
13-Week
Period
Change
in Dollars
13-Week
Period
% Change
Impact on a Constant Currency Basis