1000 ieee transactions on geoscience and remote …€¦ · 1000 ieee transactions on geoscience...
TRANSCRIPT

1000 IEEE TRANSACTIONS ON GEOSCIENCE AND REMOTE SENSING, VOL. 43, NO. 5, MAY 2005
Modeling and Measurement of Rainfall byGround-Based Multispectral Microwave Radiometry
Frank Silvio Marzano, Senior Member, IEEE, Domenico Cimini, Member, IEEE, Piero Ciotti, Member, IEEE,and Randolph Ware
Abstract—The potential of ground-based multispectral mi-crowave radiometers in retrieving rainfall parameters is investi-gated by coupling physically oriented models and retrieval methodswith a large set of experimental data. Measured data come fromrain events that occurred in the USA at Boulder, Colorado, andat the Atmospheric Radiation Measurement (ARM) Program’sSouthern Great Plains (SGP) site in Lamont, OK. Rain cloudmodels are specified to characterize both nonraining clouds,stratiform and convective rainfall. Brightness temperature nu-merical simulations are performed for a set of frequencies from20 to 60 GHz at zenith angle, representing the channels currentlydeployed on a commercially available ground-based radiometricsystem. Results are illustrated in terms of comparisons betweenmeasurements and model data in order to show that the observedradiometric signatures can be attributed to rainfall scatteringand absorption. A new statistical inversion algorithm, trained bysynthetic data and based on principal component analysis is alsodeveloped to classify the meteorological background, to identify therain regime, and to retrieve rain rate from passive radiometric ob-servations. Rain rate estimate comparisons with simultaneous raingauge data and rain effect mitigation methods are also discussed.
Index Terms—Atmospheric retrieval, ground-based remotesensing, microwave radiometry, radiative transfer, rainfall.
I. INTRODUCTION
GROUND-BASED microwave radiometry has been mainlyinvestigated for estimating temperature, water vapor and
cloud liquid profiles in the absence of precipitation [1], [2].The increasing use of multifrequency radiometers in ground-based meteorological and receiving stations has raised the ques-tion of their potential for retrieving rainfall parameters [3]–[8].This feature is even more appealing if the ground-based mi-crowave radiometer can be equipped by automatic scanning inorder to cover a large atmospheric volume in a manner similarto radar systems. Indeed, synergetic use of radiometric rain re-trieval methods with weather radar systems is another importantapplication, especially with constrained path-attenuation miti-gation techniques [8].
Manuscript received May 128, 2004; revised September 10, 2004. This workwas supported in part by the Ministry of Education and Research (MIUR), inpart by the RISK-AWARE Project of the INTERREG-IIB CADSES EuropeanCommission, in part by the Italian Space Agency (ASI), and in part by theGNDCI-CNR Project.
F. S. Marzano, D. Cimini, and P. Ciotti are with the Center of ExcellenceCETEMPS, University of L’Aquila, 67040 L’Aquila, Italy (e-mail: [email protected]; [email protected]; [email protected]).
R. Ware is with the Radiometrics Corporation, Boulder, CO 80301 USA andalso with University Corporation for Atmospheric Research, Boulder, CO 80305USA (e-mail: [email protected]).
Digital Object Identifier 10.1109/TGRS.2004.839595
Ground-based microwave radiometry as compared to radarhas the advantage of lower procurement and maintenance costs,with the disadvantage that the rain product is not range-re-solved. On the other hand, rainfall retrieval by satellite-basedmicrowave radiometry is limited by its relatively coarse spatialresolution as well as beam filling effects and a relatively lowsensitivity over land, but has the advantage of global coverage[9]. Finally, rain gauges make a point measurement of rainfallat ground level. Indeed, the extreme variability of precipitationin time and space lends difficulty to its accurate retrieval sinceall known methods have their strengths and weaknesses for me-teorological and hydro-geological applications. In a synergeticapproach ground-based microwave radiometry is a potentiallyuseful complementary tool [6]–[8].
The exploitation of ground-based microwave radiometryraises both modeling and experimental issues. From a modelingpoint of view, the approach to rainfall signature characterizationrequires a thorough insight into the electromagnetic interactionbetween the microwave radiation and the scattering mediumsince the radiometric response depends on the various radiativesources along the observation path [5], [7]. With respect to anempirical inversion technique trained by measured observablesand parameters [4], [6], the accuracy of a physically basedretrieval approach relies on modeling capability to take intoaccount multiple scattering and atmospheric inhomogeneitydue to hydrometeors in different phases [7], [8], [10]. Froman experimental point of view, one of the main problems ofground-based radiometric retrieval of rainfall is contaminationgenerated by liquid water on the receiving antenna. In orderto solve this problem, hardware solutions [11], [12] or robustinversion techniques [5], [8] can be foreseen.
An appealing objective of current research is to extract rainfallsignatures and parameters in a quantitative way from multi-spectral ground-based microwave radiometric measurements.Previous work used observations from a three-channel mi-crowave radiometer [5], [8]. As explained in Section II, in thiswork we use observations from 12-channel radiometers thatare currently operational in various sites around the world [13].Rain events that occurred at Boulder, Colorado, and near La-mont, OK, at the Atmospheric Radiation Measurement (ARM)Program Southern Great Plains (SGP) site have been analyzedon a temporal period including nearly one year of continuousmeasurements. Observations from a rain gauge at the samelocation were coordinated with the radiometric measurements.
In order to exploit the information content of the 12-channelradiometric system, we have adopted a retrieval approach basedon a physical radiative model able to characterize both strat-
0196-2892/$20.00 © 2005 IEEE

MARZANO et al.: MODELING AND MEASUREMENT OF RAINFALL 1001
Fig. 1. Example of the operational MWRP output. Plots refer to data collected during 19 July 2003, in Boulder, CO. A rain shower happened roughly at 0400UTC. Contour plots show time-height cross sections of atmospheric temperature (top), relative humidity (middle), and liquid water (bottom). Surface temperature,relative humidity, and pressure are shown on the left. Infrared cloud temperature, rain detection, integrated content of vapor and liquid are shown on the bottom.
iform and convective precipitation, including spherical liquid,melt, and ice hydrometeors [5], [8]. The model is further de-scribed in Section III. By varying and properly tuning the for-ward model parameters at the measurement sites in a physicallybased manner, a synthetic cloud radiative database has been de-rived in terms of the downwelling simulated brightness temper-atures ( ’s), the associated mean radiative temperature and thetotal path-attenuation. In addition, a new nonlinear statistical in-version procedure has been developed that is based on succes-sive steps where rainfall is: 1) detected; 2) classified with respectto its regime; and 3) estimated in terms of columnar water andrain rate. Results are illustrated by means of comparisons be-tween multispectral measurements and model data in order toshow that the observed radiometric signatures can be attributedto rainfall scattering and absorption. Finally in Section IV, rainrate radiometric estimates are compared with available simul-taneous rain gauge data, showing the potential of the techniqueto retrieve rainfall parameters, followed by a discussion aboutthe limitations of this intercomparison and on possible effectsof antenna water-film mitigation techniques.
II. EXPERIMENTAL DATA
As already mentioned, in order to interpret and test rainfallmodel simulations and rain rate estimates, a fairly large set ofmeasurements, acquired by MicroWave Radiometer Profilers(MWRPs) manufactured by Radiometrics Corp., has been used.
The MWRP radiometer observes the radiation intensity at 12frequencies in a region of the microwave spectrum that is dom-inated by atmospheric emissions from water vapor, cloud liquidwater, and molecular oxygen. The 12 observation frequencies(i.e., 22.035, 22.235, 23.835, 26.235, 30.00, 51.250, 52.280,53.850, 54.940, 56.660, 57.290, 58.800 GHz) were chosen by aneigenvalue analysis to optimize retrieval accuracy. Using neuralnetwork inversion algorithms the MWRP provides temperatureand humidity soundings up to 10-km height and low resolutioncloud liquid soundings [13]. The radiometric profiler includes avertical infrared sensor and surface temperature, humidity, pres-sure sensors. A rain detector, based on resistive changes of aprinted circuit in presence of rain, is also included to identifythe presence of liquid water on the radiometer antenna.
As an example, Fig. 1 shows the operational real-time outputprinted on the screen by the proprietary MWRP data acqui-sition and processing software (VizMet). Contour plots showtime-height cross sections of atmospheric temperature, relativehumidity and liquid water retrievals. Time series of tempera-ture, relative humidity, and pressure at the instrument level areshown on the left. Time series of infrared cloud temperature,rain detection, integrated content of vapor and liquid are shownat the bottom. An estimate of the cloud base height is also plottedin the upper contour panel. Thus, the operational output allowsthe user to monitor in real-time ten fields of meteorological in-terest simultaneously. Data were collected during 19 July 2003,in Boulder, Colorado, USA, including the occurrence of a rain

1002 IEEE TRANSACTIONS ON GEOSCIENCE AND REMOTE SENSING, VOL. 43, NO. 5, MAY 2005
Fig. 2. Time series of T observed by the MWRP 12 channels during the same event as in Fig. 1. For each channel, the corresponding frequency (in gigahertz)is shown on top of each subplot. It is evident how rainfall greatly effects the low-frequency channels (22.2 to 53.8 GHz), while has a relatively small impact onstrongly absorbed frequencies (56.6 to 58.8 GHz).
shower which started at roughly 0400 UTC, as revealed by therain detector, and lasted for about 20 min.
Rainfall has a distinct signature on radiometric measurementswhich appears in a different way if considering either a windowor an absorption channel. Fig. 2 shows the time series of MWRPradiometric observations at its 12 frequency channels duringthe same period as in Fig. 1. A signature of more than 200 Kis shown by the window channels. Rain occurrence causes thelarge increase of measured ’s in the low-frequency chan-nels and saturation/depression in the oxygen absorbed band.This behavior is due to the predominance of either emission orscattering in the signature from ground with respect to theclear-air value, as we will point out in the next section.
For a preliminary statistical validation, about one year ofMWRP radiometric observations at the ARM SGP site, fromJune 2001 to June 2002, have been analyzed in this work. Atipping-bucket rain gauge, part of the ARM Surface Meteoro-logical Observation System (SMOS) has been also available.The rain gauge was located at about 500 m from the MWRP,providing data with a temporal resolution of half an hour anda precision of 0.254 mm with an uncertainty of 0.254 mm.It should be noted that 500 m may be a significant fractionof the correlation distance of convective rainfall (about fewkilometers). Unfortunately, no other rain gauges closer to theradiometer and with a faster response were available.
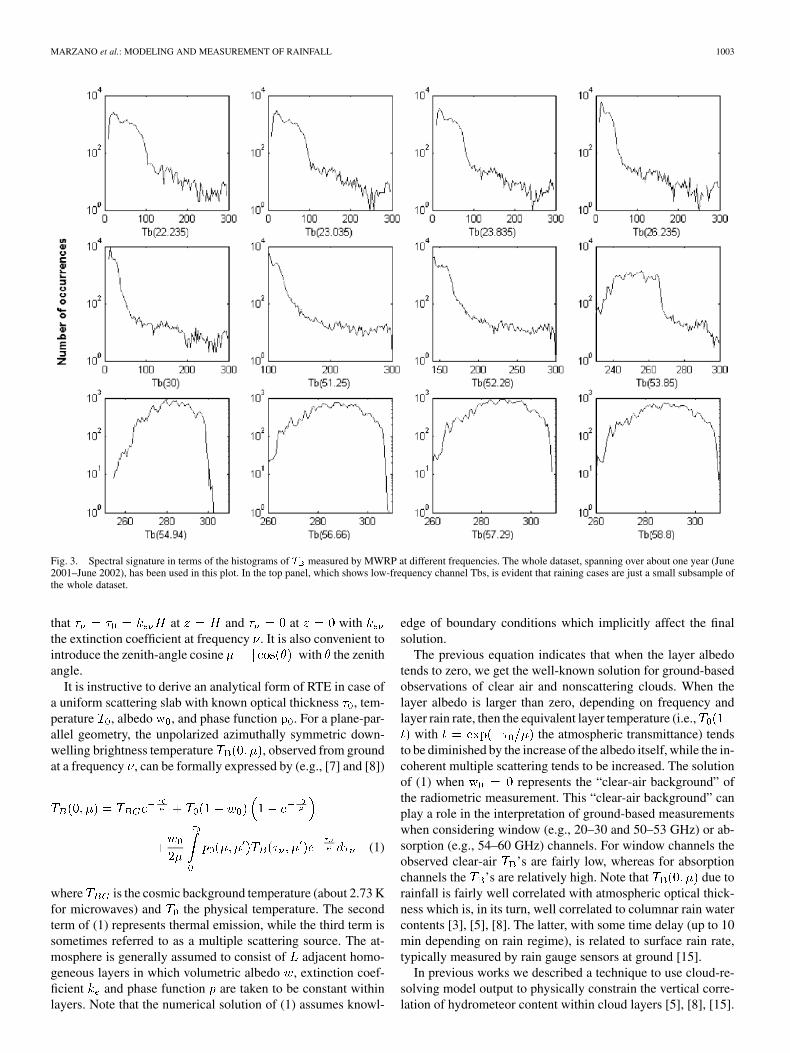
Fig. 3 characterizes the set of observations in terms of TBhistograms at different frequencies. It is evident from the dual-
mode distribution of low-frequency ’s that rain cases repre-sent just a small fraction of the entire dataset. According to therain gauge, for the entire dataset the total fraction of time whenrain was observed is 174 h. Channels with strong absorption,like the ones near the oxygen complex centered at 60 GHz, showa small range of variability, since they are close to saturation.On the other hand, channels with weak absorption, such as inthe 20–30-GHz range, show a much larger range of variability,since the signals go from 10–20 K to saturation. A detailed anal-ysis of the rainfall microwave signature will be carried out whencomparing measured and simulated data in the next section.
III. RADIOMETRIC SIGNATURE OF RAINFALL
A general theoretical framework for modeling of brightnesstemperatures generated by clouds and hydrometeors and mea-sured by a microwave radiometer is given by radiative transferintegro-differential equation (RTE) [8], [14]. In the followingsections, we briefly summarize characteristics of forwardmodels employed in this work, together with a comparison withmeasured ’s.
A. Rain Radiative Models
A vertically stratified atmosphere with its lowest level at(surface) and highest level at (generally around 30 km)
is here considered. For convenience we can define a verticalcoordinate in terms of optical thickness at frequency such
MARZANO et al.: MODELING AND MEASUREMENT OF RAINFALL 1003
Fig. 3. Spectral signature in terms of the histograms of T measured by MWRP at different frequencies. The whole dataset, spanning over about one year (June2001–June 2002), has been used in this plot. In the top panel, which shows low-frequency channel Tbs, is evident that raining cases are just a small subsample ofthe whole dataset.
that at and at withthe extinction coefficient at frequency . It is also convenient tointroduce the zenith-angle cosine with the zenithangle.
It is instructive to derive an analytical form of RTE in case ofa uniform scattering slab with known optical thickness , tem-perature , albedo , and phase function . For a plane-par-allel geometry, the unpolarized azimuthally symmetric down-welling brightness temperature , observed from groundat a frequency , can be formally expressed by (e.g., [7] and [8])
(1)
where is the cosmic background temperature (about 2.73 Kfor microwaves) and the physical temperature. The secondterm of (1) represents thermal emission, while the third term issometimes referred to as a multiple scattering source. The at-mosphere is generally assumed to consist of adjacent homo-geneous layers in which volumetric albedo , extinction coef-ficient and phase function are taken to be constant withinlayers. Note that the numerical solution of (1) assumes knowl-
edge of boundary conditions which implicitly affect the finalsolution.
The previous equation indicates that when the layer albedotends to zero, we get the well-known solution for ground-basedobservations of clear air and nonscattering clouds. When thelayer albedo is larger than zero, depending on frequency andlayer rain rate, then the equivalent layer temperature (i.e.,
with the atmospheric transmittance) tendsto be diminished by the increase of the albedo itself, while the in-coherent multiple scattering tends to be increased. The solutionof (1) when represents the “clear-air background” ofthe radiometric measurement. This “clear-air background” canplay a role in the interpretation of ground-based measurementswhen considering window (e.g., 20–30 and 50–53 GHz) or ab-sorption (e.g., 54–60 GHz) channels. For window channels theobserved clear-air ’s are fairly low, whereas for absorptionchannels the ’s are relatively high. Note that due torainfall is fairly well correlated with atmospheric optical thick-ness which is, in its turn, well correlated to columnar rain watercontents [3], [5], [8]. The latter, with some time delay (up to 10min depending on rain regime), is related to surface rain rate,typically measured by rain gauge sensors at ground [15].
In previous works we described a technique to use cloud-re-solving model output to physically constrain the vertical corre-lation of hydrometeor content within cloud layers [5], [8], [15].

1004 IEEE TRANSACTIONS ON GEOSCIENCE AND REMOTE SENSING, VOL. 43, NO. 5, MAY 2005
Briefly speaking, the gross vertical distribution of four speciesof hydrometeors including cloud droplets, raindrops, graupelparticles, and snow particles, has been modeled. Cloud struc-tures have been vertically resolved, within each cloud class, inseven homogeneous layers with fixed levels and a vertical reso-lution of about 1–1.5 km. The cloud dataset, classified into strat-iform rain clouds (nimbostratus, Ns, including strato-cumuli aswell), convective rain clouds (cumulonimbus, Cb), stratiformnonraining clouds (stratus, St), cumuliform nonraining clouds(cumulus, Cu), and clear-air (Cl), has been then extended bymeans of a Monte Carlo statistical procedure. Meteorologicalvariables, such as temperature, humidity and pressure profiles,have been assumed to be uniformly variable around their meanvalues within a given percentage. Microwave gaseous absorp-tion has been computed by means of the Liebe model [16]. Theland-surface emission has been characterized by a Lambertianemissivity model, depending on randomly variable surface hu-midity (giving emissivity values between 0.85 and 0.95) [17].
The hydrometeor shapes have been assumed all spherical andcharacterized by inverse-exponential particle size distributions(PSDs) (see [8] for further details). In the logarithmic plane theintercept of a PSD has been derived from the assigned equiva-lent water content within each layer, while the slope has beenparameterized to surface rain-rate using a Marshall-Palmer, aSekhon–Srivastava and a Gunn–Marshall PSD for raindrops,ice graupel and snow, respectively. For stratiform rain clouds,a melting layer has been modeled by choosing a water-coatedice-particle model. Indeed, oblateness of raindrops can causea depolarization signal, depending on cloud stage and windcirculation [7], but it is here considered a second-order effect.Mie absorption and scattering functions have been numericallycomputed by imposing hydrometeor diameter ranges and den-sities [8].
In order to generate a fairly large dataset to cover a widerange of climatic conditions, the synthetic clouds have beenembedded in various meteorological environments which havebeen tuned to the specific measurement site by collecting avail-able radiosoundings. All meteorological profiles have been sup-posed to be standard and varied in a random way, with a uni-form statistics, around mean values of surface and vertical gra-dient parameters depending on the season. Mean surface tem-peratures from 273 to 303 K have been imposed with steps of5 K and a uniform variability of 10 K around the mean valueswith a standard gradient of 7.5 K/km (with a uniform variabilityof 15%). The mean pressure profile has been supposed to be ex-ponential with a surface value of 980 hPa (SPG site referencevalue) and a uniform variability of 1% of the mean value to-gether with a scale height of 7 km. Humidity was assumed tobe close to saturation with an exponential profile having a meansurface value between 7 and 14 g/m , according to the season,with a uniform variability of 15% of the mean value and a scaleheight of 1.5 km. When imposing the variability of meteorolog-ical profiles, the vertical distribution of rain and ice layers hasbeen modified accordingly by imposing some physical criteriasuch as the absence of ice below the freezing level (except for anexplicit melting layer), the prevention of super-saturation, theabsence of water above the glaciation level and the limitationof the vertical extension of the rain cloud by using a reduction
factor proportional to the temperature difference between thesynthesized mean profile and the initial one.
By using the coupled rainfall and radiative transfer modeldescribed above, a large classified dataset has been simulated,consisting of several thousands of cloud structures togetherwith related brightness temperatures at given frequenciesand observation angles. More precisely, the overall simulateddataset, adopted in this work, consists of 35 classes, each with1000 structures, derived from: 1) 7 meteorological (macro-physical) classes spanning from 0 C to 30 C of mean surfacetemperature with steps of 5 C (named as m0, m5, m10, m15,m20, m25, m30) and 2) within each meteorological class, fivecloud (microphysical) classes categorized as Cl, St, Cu, Ns,and Cb genera. The number of 1000 cloud structures has beenchosen as a compromise between computation efficiency andcurrent radiometric system accuracy. The analysis has includedthe frequency bands of the operational multichannel radiometerMWRP. The observation angle has been chosen in accordanceto the application, in principle between 0 and 90 elevation.Here we will show results only for zenith observations in orderto be able to compare simulations with radiometric and raingauge measurements, as discussed in the next sections.
B. Comparison With Radiometric Data
A way to represent the ensemble of multispectral signaturesin a compact manner is to perform a principal component (PC)analysis (e.g., [20]). If is a column vector made by 12 TBsmeasured at the MWRP frequencies (in gigahertz) at zenith, i.e.,
then can be expanded as follows:
(2)
where the angular brackets stands for ensemble average, isthe th principal component , and is the corre-sponding th eigenvector or empirical orthogonalfunction (EOF) of the autocovariance matrix. As known, if
is the th eigenvalue associated to th EOF, then its normal-ization to the eigenvalue sum represents the dataset explainedvariance. Note that the convention is such that PCs are orderedwith explaining the higest relative variance.
As an example, by taking into consideration all the simulateddataset, in order to explain the 99% of the variance only the firstthree principal components are needed, with , , andexplaining 96%, 2%, and 1% of the total variance correspondingto an associated standard deviation of 213, 28, and 6 K, respec-tively. The information content carried by the first three EOFsis shown in Fig. 4 by plotting the elements of with respectto the frequency band.
It isworthmentioning thatEOF1ismostlyaffectedbyacombi-nation of liquid water and water vapor emission, EOF2 respondsbasically to water vapor channels, while EOF3 weighs humidity

MARZANO et al.: MODELING AND MEASUREMENT OF RAINFALL 1005
Fig. 4. First three relevant spectral empirical orthogonal functions (EOFs)from the simulated dataset. EOF1 spans 96% of the total variance, while 2%and 1% for EOF2 and EOF3, respectively.
and temperature sounding channels. Considering that EOF el-ements are proportional to the –PC correlation coefficients,we note that the first PC is fairly correlated with the window-fre-quency and water-vapor absorption ’s, the second PC iscorrelated with water-vapor absorption and 60 GHz more trans-parent channels, while the third PC is correlated with 60-GHzabsorbed channels and cloud-liquid channel at 30 GHz. It shouldbe stressed that, when we consider only a cloud class datasetfor a given meteorological surface condition, the contributionof oxygen-band channels to the third PC tends to be negligible.
A valuable objective to verify the simulation outputs is tocompare radiometric measurements, introduced in Section II,with the synthetic dataset, described in the previous section.This comparison can give an indication of the realism and phys-ical consistency of the ground-based radiometric simulationsover a wide span of microwave frequencies.
Fig. 5 shows rainfall spectral signature in terms of scatterplots of ’s at different frequencies. About one year of radio-metric observations at ARM SGP site are involved in this plot.
’s from the simulated dataset are shown in black, while mea-surements are shown in gray (number of points are 35 000 forthe simulations and 37 569 for the measurements). In the toppanel, which shows low frequency ’s, nonraining cases areconcentrated below 100 K, while raining cases cover the rangeup to 300 K mainly dominated by hydrometeor emission [see(1)]. On the other hand, for higher frequency, nonraining casesare clustered in the middle of the distribution, thus indicatingthe presence of both emission (i.e., ’s increase) and scattering(i.e., ’s decrease) signature mechanisms.
Fig. 5 demonstrates that simulations are able to representa reasonable range of measured ’s, both for weak absorp-tion (20–30 GHz) and strong absorption (55–60 GHz) frequen-cies. By comparing simulated and measured data, we can appre-ciate a similar behavior. The similarity between the syntheticand the observed data distributions gives us some confidence inusing the first as a training set for estimating rain rate from theset of observations.
IV. RADIOMETRIC ESTIMATION OF RAINFALL
The inversion technique introduced in this work has beendeveloped mainly by focusing on the multispectral nature ofMWRP radiometric measurements and on its operational real-time features. Based on previous work [5], [8], [18], we herehave developed a new inversion technique suited for the MWRPmultispectral observations. Such technique, when trained withsimulations and applied to observations, provides estimates ofa variety of rainfall parameters, such as columnar hydrometeorcontent and rain rate. In this work, we do not attempt to esti-mate a rain water profile, even though in principle it could beperformed with some approximations [10]. This potential andcapability to easily generalize and extend the results is one ofthe major advantages of a physically based inversion algorithmwith respect to an empirical one.
Radiometer-based rain rate can be validated when measure-ments from a collocated rain gauge are provided, as discussed inSection IV-B. This intercomparison is affected by several prob-lems. Indeed, the type of measurements are profoundly different:one can provide the rain water along a slant column, while theother the accumulated water at a ground point. A major problemconcerning rainfall ground-based observation by radiometers isrelated to the instrument antenna exposure to hydrometeor fall,which can contaminate measurements. Water films formingon the antenna have resulted with a possible significant impact onobserved ’s [11]. The effects on the retrievals of water filmson the antenna and an experimental demonstration of how tosubstantially reduce them by hardware solutions are discussedelsewhere [12], [19]. Here we do not consider such hardware-corrected MWRP data and concentrate on the exploitation of astatistical estimator sufficiently robust to unknown noise, suchas ’s due to antenna water films, being aware that this wouldimply a slightly less expected accuracy [8].
A. Inversion Technique
The inversion procedure, designed for MWRP, is structuredin three subsequent steps, specifically extended and tuned forthis application but easily extendible to any other sensor config-uration. The three foreseen steps are the following:
Step 1) classify the meteorological background scenario;Step 2) detect rainfall and classify the cloud genera and,
eventually, rain regime (stratiform or convective);Step 3) estimate the rain columnar water contents and sur-
face rain rate.The entire inversion algorithm is formulated in terms of PCs.
As justified in the previous section, the first three PCs (andEOFs) are sufficient in our case to explain more than 99% of thetotal variance. The PC transformation has several advantages,mainly its robustness to unknown noise and higher accuracy inbest fitting predictands to predictors—the latter feature gener-ally due to the lower degree of nonlinearity of the fitting model[9], [20], [21]. These properties have been numerically provenby using the illustrated synthetic dataset as well.
Once a measured vector (where “m” stands for mea-surement) is available, the measured PCs vector is basi-cally computed by inverting (2), i.e.,
(3)

1006 IEEE TRANSACTIONS ON GEOSCIENCE AND REMOTE SENSING, VOL. 43, NO. 5, MAY 2005
Fig. 5. Rainfall spectral signature in terms of scatter plots between T at different frequencies. Simulated datasets are shown in black, while about one year ofmeasurements (June 2001–June 2002) are shown in gray.
where is the 3 12 matrix whose rows are represented bythe first three EOFs and “(c)” stands for the class. Note that, foreach classification step, the matrix is different as it is derivedfrom different datasets—for Step 1), we use 35 000 (i.e., 351000) records, while for Steps 2) and 3) we operate on 5000(i.e., 5 1000) and 1000 records, respectively.
For the first two classification steps, a maximum a posterioriprobability (MAP) criterion has been used [8]. Briefly speaking,if is the cloud class, then the conditional probability densityfunction (pdf) of considered class given a measurementcan be expressed through the Bayesian theorem. If the metricsis assumed to be a multivariate Gaussian pdf, then the MAP es-timation of cloud class reduces to the following maximization:
(4)
where is the PC-converted measurement autocovariance di-agonal matrix of class and is the matrix determinant, while
is the PC mean value vector of class and repre-sents the a priori discrete pdf of class . The computation of themode in (4) requires to know the mean value of the radiometricprincipal component and its autocovariance at eachclassification step. This statistical characterization of each cloudclass can be derived from the generated synthetic dataset, whilethe prior pdf can be used to subjectively weight each classas a function of other available information. For simplicity, wehave assumed as uniform in this work. Note that (and
TABLE ICONFUSION MATRIX OF CLOUD CLASSIFICATION, EXPRESSED IN PERCENTAGE
FOR Cl, St, Cu, Ns, AND Cb CLOUD GENERA, GIVING THE NUMBER OF
CORRECTLY CLASSIFIED CLOUDS ON THE DIAGONAL AND MISCLASSIFIED
CLOUDS ON THE OFF-DIAGONAL ELEMENTS. ROWS ARE INPUTS, AND
COLUMNS ARE OUTPUTS (THE SUM OF EACH ROW IS EQUAL TO 100%,AS EXPRESSED BY THE LAST COLUMN)
TABLE IISTATISTICS INDEXES FOR RAIN DETECTION, AS DEFINED IN [9]. THE ENTIRE
DATASET OF 14 716 RAINING AND NONRAINING CASES HAS BEEN USED FOR
THIS ANALYSIS DURING THE CONSIDERED YEAR (JUNE 2001–JUNE 2002)
then PC) probability density is a truncated-Gaussian within eachcloud class, but the ensemble of all classes is not necessarilyGaussian [8]. Since we have assumed a Guassian metrics foreach class distance, the inherent error is not critical. The veri-fication of the long-term statistics of each cloud class throughmeasured data is beyond the scopes of this paper and, indeed,not an easy task due to the lack of reference data apart from vi-sual inspections.
As an example of the expected accuracy of the classificationstep, we have performed a simulated analysis on synthetic mea-surements, divided in the already mentioned five classes (Cl, St,
MARZANO et al.: MODELING AND MEASUREMENT OF RAINFALL 1007
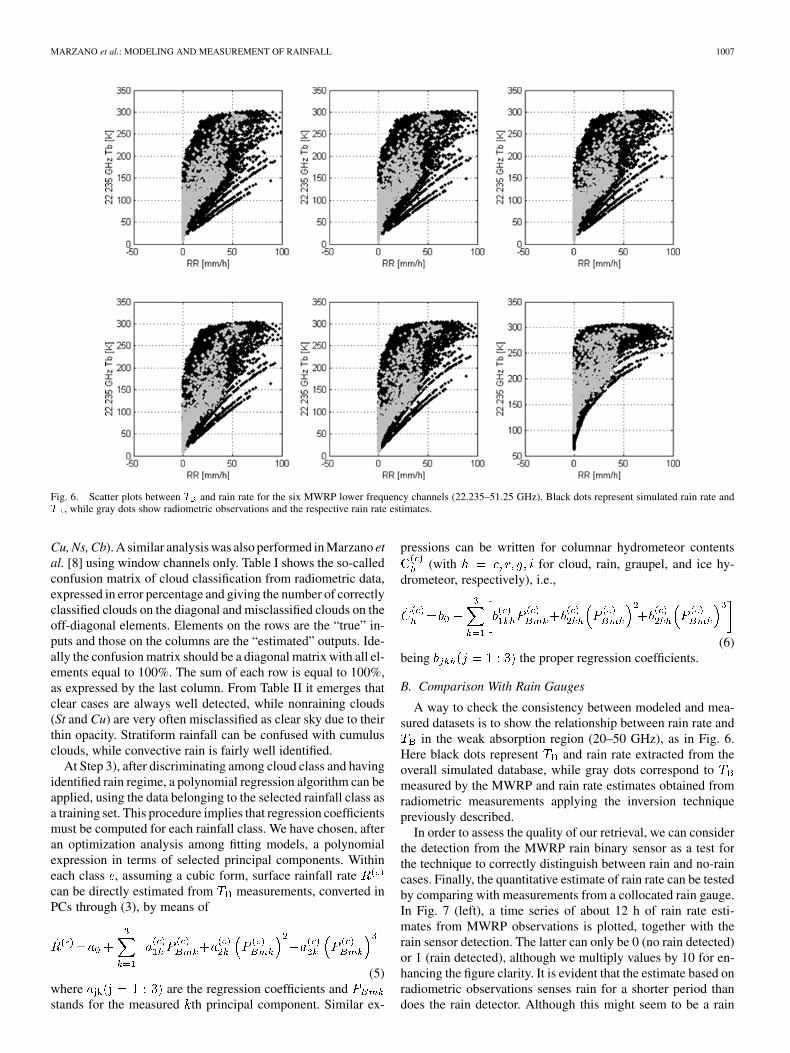
Fig. 6. Scatter plots between T and rain rate for the six MWRP lower frequency channels (22.235–51.25 GHz). Black dots represent simulated rain rate andT , while gray dots show radiometric observations and the respective rain rate estimates.
Cu, Ns, Cb). A similar analysis was also performed in Marzano etal. [8] using window channels only. Table I shows the so-calledconfusion matrix of cloud classification from radiometric data,expressed in error percentage and giving the number of correctlyclassified clouds on the diagonal and misclassified clouds on theoff-diagonal elements. Elements on the rows are the “true” in-puts and those on the columns are the “estimated” outputs. Ide-ally the confusion matrix should be a diagonal matrix with all el-ements equal to 100%. The sum of each row is equal to 100%,as expressed by the last column. From Table II it emerges thatclear cases are always well detected, while nonraining clouds(St and Cu) are very often misclassified as clear sky due to theirthin opacity. Stratiform rainfall can be confused with cumulusclouds, while convective rain is fairly well identified.
At Step 3), after discriminating among cloud class and havingidentified rain regime, a polynomial regression algorithm can beapplied, using the data belonging to the selected rainfall class asa training set. This procedure implies that regression coefficientsmust be computed for each rainfall class. We have chosen, afteran optimization analysis among fitting models, a polynomialexpression in terms of selected principal components. Withineach class , assuming a cubic form, surface rainfall ratecan be directly estimated from measurements, converted inPCs through (3), by means of
(5)where are the regression coefficients andstands for the measured th principal component. Similar ex-
pressions can be written for columnar hydrometeor contents(with for cloud, rain, graupel, and ice hy-
drometeor, respectively), i.e.,
(6)being the proper regression coefficients.
B. Comparison With Rain Gauges
A way to check the consistency between modeled and mea-sured datasets is to show the relationship between rain rate and
in the weak absorption region (20–50 GHz), as in Fig. 6.Here black dots represent and rain rate extracted from theoverall simulated database, while gray dots correspond tomeasured by the MWRP and rain rate estimates obtained fromradiometric measurements applying the inversion techniquepreviously described.
In order to assess the quality of our retrieval, we can considerthe detection from the MWRP rain binary sensor as a test forthe technique to correctly distinguish between rain and no-raincases. Finally, the quantitative estimate of rain rate can be testedby comparing with measurements from a collocated rain gauge.In Fig. 7 (left), a time series of about 12 h of rain rate esti-mates from MWRP observations is plotted, together with therain sensor detection. The latter can only be 0 (no rain detected)or 1 (rain detected), although we multiply values by 10 for en-hancing the figure clarity. It is evident that the estimate based onradiometric observations senses rain for a shorter period thandoes the rain detector. Although this might seem to be a rain

1008 IEEE TRANSACTIONS ON GEOSCIENCE AND REMOTE SENSING, VOL. 43, NO. 5, MAY 2005
Fig. 7. (Left) Time series of MWRP estimated rain rate. Dashed gray line, representing rain sensor detection (0/1), has been multiplied by 10 for convenience.(Right) Time series of 30-min accumulated rain for the same case. Dashed gray line represents rain sensor detection (0/1). Dash-dotted gray line representsmeasurements from a rain gauge, while the solid black line represents radiometric estimates.
rate estimator problem, it is actually an advantage of the MWRPtechnique. In fact, this effect is probably due to residual waterdroplets laying on top of the MWRP, which are misinterpretedby the rain detector. On the other hand, the retrieval algorithmwe have developed is able to interpret this water as residual andto estimate actual rainfall.
Fig. 7 (right) can further justify this latter explanation sinceit shows, for the same case study, measurements from the col-located rain gauge. Rain sensor detections are now shown withtheir original values (0/1), while rain rate estimates had to be av-eraged into 30-min accumulated rain in order to match the raingauge time sampling. Rain gauge measurements clearly confirmthe duration of the rain shower sensed by radiometric observa-tions, but also show a good quantitative agreement with the ra-diometric estimates.
Similar to Fig. 7, four time series of rain rate at ARM SGPcentral facility, extending for one to three days, are plotted inFig. 8. Note that averaging for 30 min has substantially reducedthe dynamical range available for rain rate. By comparing withrain gauge measurements, it is evident that radiometric esti-mates follow quite well both the detection of rain and the valuesof rain rates, although there are some differences mainly attrib-utable, in our opinion, to their diverse mode of precipitationsensing.
In order to have a statistical comparison between radiometricestimates and rain gauge measurements we have aligned the twodatasets and averaged them into 30-min bins. This filtering op-eration results in 14 716 bins when both measurements wereavailable. A first analysis concerning the capability of the pro-posed technique to detect rain is performed on the whole set,and reported in Table II. Here we use the statistics indexes asdefined in [9] to measure the probability of detection of rain(PODR), the probability of detection of no-rain (PODNR), andthe false alarm ratio (FAR). From Table II, we see that the dis-cussed technique shows an excellent PODNR and fairly goodPODR and FAR. The last two indexes might be also slightly af-fected by time-space variation of the rain field, since the MWRPand the rain gauge were sitting some hundreds meters apart (seeSection II).
A further analysis concerns the ability of the proposedtechnique to retrieve quantitatively the value of rain rate, onceraining conditions have been detected. Thus, we have limitedthe set of observations to those classified as rain, a selectionwhich drastically reduces the number of bins to 98. This datasetis plotted in Fig. 9 and has been used to obtain Table III. It isevident that there is a fairly good correlation (about 0.82) be-tween the two measurements, although the statistics is limitedby the relative small range of variation. The bias and standarddeviation of the error are about 0.9 and 1.8 mm, respectively,which results in a root mean square of about 2.0 mm. This erroris attributable to the combination of the uncertainty for raingauge measurements ( 0.25 mm, according to the manufac-turer), the uncertainty related to the retrieval technique, whichdepends on the rain rate [8]–[10], but also in large extent to thedifferent features of the two observing systems.
V. SUMMARY AND FUTURE DEVELOPMENTS
A large set of ground-based multifrequency radiometric mea-surements and simulations for different precipitation regimeshas been analyzed. The modeled frequencies have been selectedin order to match the set of channels currently available on anoperational ground-based radiometric system. Rain events oc-curred in Boulder, CO, and at the ARM SGP site have beenanalyzed in terms of comparisons between measurements andmodel data. This comparison has in a way validated that the ob-served radiometric signatures can be attributed to rainfall scat-tering and absorption.
We have discussed and applied a three-step nonlinear inver-sion technique, based on principal components decompositionto estimate rain rate from radiometric observations. This statis-tical inversion approach is advantageous mainly because of itsrobustness to unknown noise and higher accuracy in best fittingpredictands to predictors. The proposed technique relies on thegenerated cloud radiative database to train the nonlinear regres-sion algorithm. This feature makes the technique easy to gener-alize and to extend to applications with other observing systems.The consistency of simulations with both measurements and re-trievals has been proven as well.

MARZANO et al.: MODELING AND MEASUREMENT OF RAINFALL 1009
Fig. 8. More rain events are shown. As in Fig. 7, dash-dotted gray line represents 30-min accumulated rain as measured by the rain gauge, while the solid blackline represents radiometric estimates. Dashed gray line represents the rain sensor detection (0/1).
Fig. 9. Scatter plot of 30-min accumulated rain (in millimeters) as measuredby the rain gauge (SMOS) and as estimated by the MWRP. The sample size isreduced to 98 cases.
Retrieval results have been presented comparing time seriesof radiometric estimates with rain sensor detections and rain
TABLE IIISTATISTICS INDEXES FOR RAIN ESTIMATE, AS DEFINED IN [9]. THE DATASET
CONSISTS OF 98 RAINING CASES DURING THE CONSIDERED YEAR
(JUNE 2001–JUNE 2002)
gauge measurements. These results are encouraging, showingthe potential of this approach, and indicating that the use of theconsidered radiometric system together with the proposed in-version technique are not too much affected by water films overthe antenna. Statistical indexes for rain detection and estimateshow reasonable agreement, although the analysis is limited bythe relative small range of variation available.
A final remark can be highlighted in terms of a provocativequestion: do we need a radiometric estimate of rainfall rate at theground if you can have a gauge there? Would not gauge measure-ments be more accurate after all? Indeed, we are interested in therain water content of the atmosphere more than its rate at surface.For historical and practical reasons we need to validate our es-timators with rain gauge data, but the aim is not to replace raingauges but to add estimated rainfall contents to microwave ra-diometer products as a new feature. This would open to ground-based radiometry an unique potentiality as an all weather instru-

1010 IEEE TRANSACTIONS ON GEOSCIENCE AND REMOTE SENSING, VOL. 43, NO. 5, MAY 2005
ment for atmospheric monitoring. We hope that the results herepresented can contribute to support the use of ground-basedmultifrequency microwave radiometry for rain monitoring.
Future developments of this work will regard both mod-eling and empirical issues. Indeed, the solution of the forwardproblem might be improved by considering a more sophisti-cated melting layer and including depolarization effects, whilethe quality of observations could be further improved if the for-mation of water film on the antenna is prevented by instrumenthardware upgrades (e.g., [11] and [12]). Finally, further workshall be devoted to the analysis of a larger set of rainfall casesin various climatological conditions, possibly spanning a largerrange of rainfall variation, and to the comparison with otherrain sensors, such as weather radars.
ACKNOWLEDGMENT
The authors are grateful to the Guest Editor and threereviewers for their helpful comments and suggestions. TheMWRP and raingauge data were provided by the U.S. De-partment of Energy as part of the Atmospheric RadiationMeasurement Program.
REFERENCES
[1] E. R. Westwater, “Ground-based microwave remote sensing of meteo-rological variables,” in Atmospheric Remote Sensing by Microwave Ra-diometry, M. A. Janssen, Ed. New York: Wiley, 1993.
[2] L. Li, J. Vivekanandan, C. H. Chan, and L. Tsang, “Microwave radio-metric technique to retrieve vapor, liquid and ice. Part I: Development ofa neural-network based inversion method,” IEEE Trans. Geosci. RemoteSens., vol. 35, pp. 224–236, 1997.
[3] A. Hornbostel and A. Schroth, “Propagation research on the 20 GHzEarth-Olympus satellite path,” J. Electromagn. Waves Appl., vol. 9, pp.439–461, 1995.
[4] B. E. Sheppard, “Effect of rain on ground-based microwave radiometricmeasurements in the 20–90 GHz,” J. Atmos. Oceanic Technol., vol. 13,pp. 1139–1151, 1996.
[5] F. S. Marzano, E. Fionda, P. Ciotti, and A. Martellucci, “Rainfall re-trieval from ground-based multichannel microwave radiometers,” in Mi-crowave Radiometry and Remote Sensing of the Environment, P. Pam-paloni, Ed. Utrecht, The Netherlands: VSP, 1999, pp. 397–405.
[6] G. R. Liu, C. C. Liu, and T. H. Kuo, “Rainfall intensity estimation byground-based dual-frequency microwave radiometers,” J. Appl. Mete-orol., vol. 40, pp. 1035–1041, 2001.
[7] H. Czekala, S. Crewell, C. Simmer, A. Thiele, A. Hornbostel, andA. Schroth, “Interpretation of polarization features in ground-basedmicrowave observations as caused by horizontally aligned oblatespheroids,” J. Appl. Meteorol., vol. 40, pp. 1918–1932, 2001.
[8] F. S. Marzano, E. Fionda, P. Ciotti, and A. Martellucci, “Ground-basedmulti-frequency microwave radiometry for rainfall remote sensing,”IEEE Trans. Geosci. Remote Sens., vol. 40, pp. 742–759, 2002.
[9] F. S. Marzano, M. Palmacci, G. Giuliani, D. Cimini, and J. Turk, “Mul-tivariate statistical integration of satellite infrared and microwave radio-metric measurements for rainfall retrieval at the geostationary scale,”IEEE Trans. Geosci. Remote Sens., vol. 42, pp. 1018–1032, 2004.
[10] F. S. Marzano, E. Fionda, and P. Ciotti, “Simulation of radiometric andattenuation measurements along earth-satellite links in the 10 to 50 GHzband through horizontally-finite convective raincells,” Radio Sci., vol.34, pp. 841–858, 1999.
[11] M. D. Jacobson, D. C. Hogg, and J. B. Snider, “Wet reflectors inmillimeter-wave radiometry-experiment and theory,” Trans. Geosci.Remote Sens., vol. GE-24, pp. 784–791, 1986.
[12] R. Ware, D. Cimini, P. Herzegh, F. S. Marzano, J. Vivekanandan, andE. R. Westwater, “Ground-based microwave radiometer measurementsduring precipitation,” presented at the Proc. MicroRad, Rome, Italy, Feb.24–27, 2004.
[13] R. Ware, F. Solheim, R. Carpenter, J. Gueldner, J. Liljegren, T. Nehrkorn,and F. Vandenberghe, “A multi-channel radiometric profiler of temper-ature, humidity and cloud liquid,” Radio Sci., vol. 38, no. 4, 8079, pp.1–13, 2003.
[14] E. A. Smith, P. Bauer, F. S. Marzano, C. D. Kummerow, D. McKague,A. Mugnai, and G. Panegrossi, “Intercomparison of microwave radiativetransfer models for precipitating clouds,” Trans. Geosci. Remote Sens.,vol. 40, no. 1, pp. 197–203, Jan. 2002.
[15] G. d’Auria, F. S. Marzano, N. Pierdicca, R. P. Nossai, P. Basili, and P.Ciotti, “Remotely sensing cloud properties from microwave radiometricobservations by using a modeled cloud data base,” Radio Sci., vol. 33,pp. 369–392, 1998.
[16] H. Liebe, “An atmospheric millimeter-wave propagation model,” Int. J.Infr. Millimeter-Wave, vol. 10, pp. 367–378, 1989.
[17] F. S. Marzano, A. Mugnai, E. A. Smith, X. Xiang, J. Turk, and J.Vivekanandan, “Active and passive remote sensing of precipitatingstorms during CaPE. Part II: Intercomparison of precipitation retrievalsfrom AMPR radiometer and CP-2 radar,” Meteorol. Atmos. Phys., vol.54, pp. 29–51, 1994.
[18] F. S. Marzano, D. Cimini, R. Ware, E. Fionda, and P. Ciotti, “Charac-terization of rainfall signature due to multispectral microwave radio-metric data from ground,” in Proc. IGARSS, vol. 2, Toulouse, France,Jul. 15–21, 2003, pp. 890–892.
[19] D. Cimini, F. S. Marzano, R. Ware, E. Fionda, and P. Ciotti, “Modelingand measurements of rainfall by ground-based multispectral microwaveradiometry,” presented at the Proc. MicroRad, Rome, Italy, Feb. 24–27,2004.
[20] W. W. Cooley and P. R. Lohnes, Multivariate Data Analysis. NewYork: Wiley, 1971.
[21] P. Basili, P. Ciotti, G. d’Auria, F. S. Marzano, and N. Pierdicca, “Sim-ulation study of a microwave radiometric temperature profiler for theAntarctic atmosphere,” in Proc. IGARSS, Pasadena, CA, Aug. 27–31,1994, pp. 2436–2438.
Frank Silvio Marzano (S’89–M’99–SM’03) re-ceived the laurea degree (cum laude) in electricalengineering and the Ph.D. degree in applied electro-magnetics, in 1988 and 1993, respectively, both fromthe University or Rome “La Sapienza,” Rome, Italy.
He currently teaches a course on antennas andpropagation and coordinates the satellite and radarremote sensing group within the Center of Excel-lence CETEMPS in the Department of ElectricalEngineering, University of L’Aquila, L’Aquila,Italy. In 1993, he collaborated with the Institute of
Atmospheric Physics (CNR), Rome. From 1994 until 1996, he was with theItalian Space Agency, Rome, as a Post-Doctorate Researcher. After being aLecturer at the University of Perugia, Perugia, Italy, in 1997, he joined theDepartment of Electrical Engineering, University of L’Aquila. His currentresearch interests are passive and active remote sensing of the atmosphere fromground-based, airborne, and spaceborne platforms, with a particular focus onprecipitation using microwave and infrared data, development of inversionmethods, radiative-transfer modeling of scattering media, and scintillation andrain-fading analysis along satellite microwave links.
Dr. Marzano received the Young Scientist Award of the XXIV General As-sembly of the International Union of Radio Science in 1993. In 1998, he wasthe recipient of the Alan Berman Publication Award from the Naval ResearchLaboratory, Washington, DC. Since 2001, he is the Italian National Delegate forthe European COST actions number 720 on meteorological remote sensing andnumber 280 on satellite communications. He is an Associate Editor for IEEEGEOSCIENCE AND REMOTE SENSING LETTERS.
Domenico Cimini (M’03) was born in Teramo, Italy,in 1973. He received the M.S. (cum laude) and Ph.D.degrees from the University of L’Aquila, L’Aquila,Italy, in 1998 and 2002, respectively, both in physics.
Since 1999, he has collaborated with the Envi-ronmental Technology Laboratory (ETL, NationalOceanic and Atmospheric Administration (NOAA),Boulder, CO. From 2000 and 2004, he participatedin two Water Vapor Intensive Operational Periods(WVIOPs), held at the Atmospheric RadiationMeasurement (ARM) program Southern Great Plain
(SGP) and North Slope of Alaska (NSA) sites. Since 2002, he has been workingwith the Center of Excellence CETEMPS, University of L’Aquila, Italy, onradiometer calibration techniques, microwave radiative transfer models, andground- and satellite-based passive microwave and infrared radiometry. SinceAugust 2004, he has been a Visiting Fellow at the Cooperative Institute for Re-search in Environmental Sciences (CIRES), University of Colorado, Boulder.

MARZANO et al.: MODELING AND MEASUREMENT OF RAINFALL 1011
Piero Ciotti (M’94) was born in Rome, Italy,on November 10, 1952. He received the laurea(Doctor’s) degree in electronic engineering (cumlaude) from the University of Rome, Rome, Italy, in1977.
Since 1991, he has been with the Departmentof Electrical Engineering, University of L’Aquila,L’Aquila, Italy, where he has taught courses on signaltheory, electromagnetic fields, and electromagneticwave propagation. He joined the Department ofElectronic Engineering, University “La Sapienza,”
Rome, in 1977, where he served first as an Assistant Professor and, since1987, as an Associate Professor, teaching a course on remote sensing. In April2000, he became a Full Professor of electromagnetics at the same university.During 1984–1985, he conducted research at the Wave Propagation Laboratory,Environmental Research Labotatory, National Oceanic and AtmosphericAdministration, Boulder, CO, on a NATO/CNR fellowship. He was a memberof the ESA Calibration Team for the ERS-1 Radar Altimeter and a PrincipalInvestigator of the ESA/JRC MAESTRO airborne SAR campaign. He is alsoPrincipal Investigator of an ESA/ENVISAT accepted research proposal andmember of RA-2/MWR, MERIS, MIPAS, GOMOS, and SCIAMACHY Vali-dation Teams. His research activity has been concerned with microwave remotesensing of the environment, microwave and millimeter-wave atmosphere,microwave line-of-sight propagation, inverse electromagnetic problems, anddigital signal processing.
Randolph Ware received the Ph.D. degree in nuclearphysics from the University of Colorado, Boulder.
He is currently President of Radiometrics Corpo-ration, Boulder. He founded and directed UNAVCO,GPS/MET, and SuomiNet at the University Corpo-ration for Atmospheric Research. He has publishednumerous scientific articles and holds patents on at-mospheric remote sensing with microwave radiom-etry and with GPS.