2418 ieee transactions on geoscience and remote …
TRANSCRIPT

2418 IEEE TRANSACTIONS ON GEOSCIENCE AND REMOTE SENSING, VOL. 43, NO. 11, NOVEMBER 2005
Polarimetric Scanning Radiometer C- and X-BandMicrowave Observations During SMEX03
Thomas J. Jackson, Fellow, IEEE, Rajat Bindlish, Member, IEEE, Albin J. Gasiewski, Fellow, IEEE, Boba Stankov,Marian Klein, Eni G. Njoku, Fellow, IEEE, David Bosch, Tommy L. Coleman, Charles A. Laymon, Member, IEEE,
and Patrick Starks
Abstract—Soil Moisture Experiment 2003 (SMEX03) was thesecond in a series of field campaigns using the National Oceanicand Atmospheric Administration Polarimetric Scanning Ra-diometer (PSR/CX) designed to validate brightness temperature(TB) data and soil moisture retrieval algorithms for the AdvancedMicrowave Scanning Radiometer (AMSR-E) for the Earth Ob-serving System on the Aqua satellite. Objectives related to thePSR/CX during SMEX03 included: calibration and validation ofAMSR-E TB observations over different climate/vegetation re-gions of the U.S. [Alabama (AL), Georgia (GA), Oklahoma (OK)],identification of possible areas of radio-frequency interference(RFI), comparison of X-band observations from Tropical RainfallMeasurement Mission Microwave Imager (TMI), AMSR-E, andPSR/CX, and exploring the potential of soil moisture retrievalalgorithms using C- and X-band imagery in diverse landscapes.In the current investigation, more than 100 flightlines of PSR/CXdata were extensively processed to produce gridded TB productsfor the four study regions. Due to the lack of significant rainfallin OK, generally dry soil moisture conditions were observed. Ob-servations obtained over AL include a wide range of soil moistureand vegetation conditions. Results from the AL site clearly showeda lack of sensitivity to rainfall/soil moisture under forest canopycover. Quantitative comparisons made with the TMI validatedthat both the PSR/CX and AMSR-E X-band channels were wellcalibrated. Spectral analyses indicated that the PSR/CX obser-vations at C-band also are reasonable. As expected, there werevarying degrees of RFI in the AMSR-E C-band data for the studysites that will prevent further soil moisture analysis using thesedata. X-band comparisons of the PSR/CX high-resolution and
Manuscript received October 19, 2004; revised February 9, 2005. This workwas supported in part by the National Aeronautics and Space AdministrationEarth Observing System AMSR-E Instrument Science Program, in part by theNASA Terrestrial Hydrology Program, in part by the Japan Aerospace Explo-ration Agency Advanced Microwave Scanning Radiometer Science Program,and in part by the National Oceanic and Atmospheric Administration Office ofOceanic and Atmospheric Research.
T. J. Jackson is with the Hydrology and Remote Sensing Laboratory, Agricul-tural Research Service, U.S. Department of Agrilcuture, Beltsville, MD 20705USA (e-mail: [email protected]).
R. Bindlish is with the Science Systems and Applications, Inc., Lanham,MD 20706 USA and also with the Hydrology and Remote Sensing Laboratory,Agricultural Research Service, U.S. Department of Agrilcuture, Beltsville, MD20705 USA.
A. J. Gasiewski, B. Stankov, and M. Klein are with Environmental Tech-nology Laboratory, National Oceanic and Atmospheric Administration,Boulder, CO 80305 USA.
E. G. Njoku is with the Jet Propulsion Laboratory, Pasadena, CA 91109 USA.D. Bosch is with the Southeast Watershed Research Center, Agricultural Re-
search Service, U.S. Department of Agrilcuture, Tifton, GA 31794 USA.T. L. Coleman is with the Hydrology, Soil Climatology, and Remote Sensing
Research Center, Alabama A&M University, Normal, AL 35762 USA.C. A. Laymon is with the Global Hydrology and Climate Center, Huntsville,
AL 35805 USA.P. Starks is with the Grazinglands Research Laboratory, Agricultural Re-
search Service, U.S. Department of Agrilcuture, El Reno, OK 73036 USA.Digital Object Identifier 10.1109/TGRS.2005.857625
AMSR-E and TMI low-resolution data indicated a linear scalingfor the range of conditions studied in SMEX03. These results willform the basis for further soil moisture investigations.
Index Terms—Advanced Microwave Scanning Radiometer(AMSR-E), passive microwave, soil moisture, validation.
I. INTRODUCTION
GLOBAL remote sensing of soil moisture has been a majorresearch goal for more than two decades. Low frequen-
cies are preferable for soil moisture retrieval since perturbingfactors such as vegetation are less significant. Recent advancesin science and technology have resulted in space agency com-mitments to L-band (1.4 GHz) missions within the next fiveyears [1], [2]. At present, there are several new satellite sensorsoperating at somewhat higher frequencies than L-band thatshow promise for soil moisture mapping under some conditions.The Advanced Microwave Scanning Radiometer (AMSR-E)provided by Japan onboard the National Aeronautics and SpaceAdministration (NASA) Earth Observing System (EOS) Aquasatellite is one such sensor capable of retrieving soil moistureusing microwave channels at 6.9 and 10.7 GHz. Aqua waslaunched in May 2002 and will provide a soil moisture productbased on AMSR-E data in regions with low levels of vegetation[3]. Other related satellites are the Advanced Earth ObservingSatellite 2 (ADEOS-II) AMSR, which has ceased operations,and the Coriolis WindSat.
Validation of the soil moisture products, as well as the bright-ness temperatures over land, from AMSR-E and the other satel-lite instruments is a critical issue and one that is difficult toaddress. The coarse spatial scale of these passive microwave in-struments (40–75 km) and the high temporal and spatial vari-ability of the soil moisture fields make extensive sampling andreplication difficult and costly. A series of field experiments[Soil Moisture Experiment (SMEX)] were developed to addressthese needs using a combination of ground and aircraft obser-vations. Each experiment focuses on a different set of climateand vegetation regimes but maintains, to the degree it is pos-sible, a standard set of validation data. The National Oceanicand Atmospheric Administration (NOAA) Polarimetric Scan-ning Radiometer (PSR/CX) has been a key component of theexperiments. It collects high spatial resolution data ( 3 km) atthe lower AMSR-E frequencies.
Here, the brightness temperature T results obtained bythe PSR/CX during SMEX03 are analyzed. SMEX03 wasconducted over sites in Oklahoma, Georgia, and Alabamaduring the summer of 2003. Aircraft data were processed togenerate a series of calibrated, georegistered, and temporally
0196-2892/$20.00 © 2005 IEEE
JACKSON et al.: POLARIMETRIC SCANNING RADIOMETER C- AND X-BAND MICROWAVE OBSERVATIONS 2419
normalized T products. Future investigations will focus onsite-specific studies of soil moisture. Analyses included thePSR/CX T responses associated with general landscape fea-tures resulting from land cover and precipitation. In addition,data from the PRS/CX, AMSR-E, and Tropical Rainfall Mea-surement Mission (TRMM) Microwave Imager (TMI) sensorswere compared to assess scaling, radio-frequency interference(RFI), and validation of AMSR-E T products. The passivemicrowave aircraft program to support AMSR-E algorithmdevelopment and validation was one of the most importantcomponents of SMEX03. The aircraft measurements provide avaluable link between the ground observations and the satellitemeasurements.
II. SMEX03 DESCRIPTION
Early soil moisture mapping experiments, such as theWashita92, Southern Great Plains (SGP97), and SGP99 ex-periments, were conducted over areas with minimal levels ofvegetation water content ( kg m ) using low-frequencyaircraft sensors. In SGP99, the PSR/C (an earlier version ofthe PSR/CX) was used with a soil moisture algorithm to mapand assess retrievals across a wide range of soil moistureconditions under low to moderate vegetation [4]. SMEX02 wasdesigned to extend the algorithm to areas with moderate to highvegetation water content conditions (4–8 kg m ). PSR/CXand AMSR-E data were collected in this campaign; however,problems with the early AMSR-E calibration and RFI in theregion limited the analyses [5].
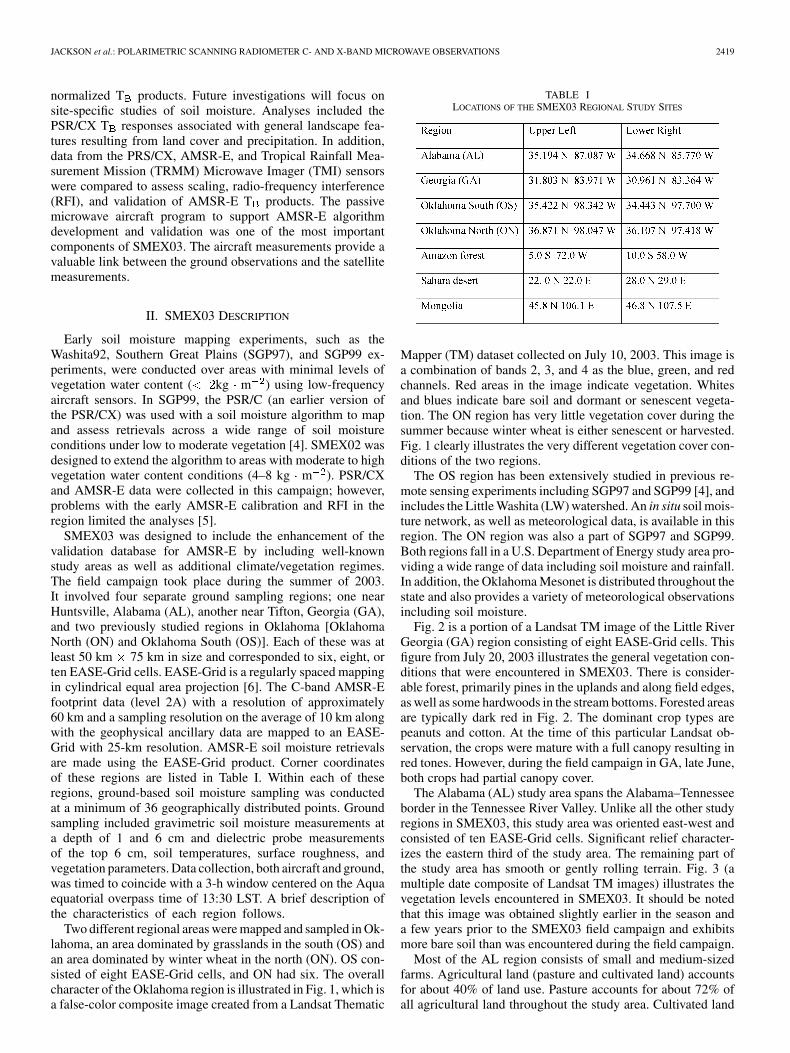
SMEX03 was designed to include the enhancement of thevalidation database for AMSR-E by including well-knownstudy areas as well as additional climate/vegetation regimes.The field campaign took place during the summer of 2003.It involved four separate ground sampling regions; one nearHuntsville, Alabama (AL), another near Tifton, Georgia (GA),and two previously studied regions in Oklahoma [OklahomaNorth (ON) and Oklahoma South (OS)]. Each of these was atleast 50 km 75 km in size and corresponded to six, eight, orten EASE-Grid cells. EASE-Grid is a regularly spaced mappingin cylindrical equal area projection [6]. The C-band AMSR-Efootprint data (level 2A) with a resolution of approximately60 km and a sampling resolution on the average of 10 km alongwith the geophysical ancillary data are mapped to an EASE-Grid with 25-km resolution. AMSR-E soil moisture retrievalsare made using the EASE-Grid product. Corner coordinatesof these regions are listed in Table I. Within each of theseregions, ground-based soil moisture sampling was conductedat a minimum of 36 geographically distributed points. Groundsampling included gravimetric soil moisture measurements ata depth of 1 and 6 cm and dielectric probe measurementsof the top 6 cm, soil temperatures, surface roughness, andvegetation parameters. Data collection, both aircraft and ground,was timed to coincide with a 3-h window centered on the Aquaequatorial overpass time of 13:30 LST. A brief description ofthe characteristics of each region follows.
Two different regional areas were mapped and sampled in Ok-lahoma, an area dominated by grasslands in the south (OS) andan area dominated by winter wheat in the north (ON). OS con-sisted of eight EASE-Grid cells, and ON had six. The overallcharacter of the Oklahoma region is illustrated in Fig. 1, which isa false-color composite image created from a Landsat Thematic
TABLE ILOCATIONS OF THE SMEX03 REGIONAL STUDY SITES
Mapper (TM) dataset collected on July 10, 2003. This image isa combination of bands 2, 3, and 4 as the blue, green, and redchannels. Red areas in the image indicate vegetation. Whitesand blues indicate bare soil and dormant or senescent vegeta-tion. The ON region has very little vegetation cover during thesummer because winter wheat is either senescent or harvested.Fig. 1 clearly illustrates the very different vegetation cover con-ditions of the two regions.
The OS region has been extensively studied in previous re-mote sensing experiments including SGP97 and SGP99 [4], andincludes the Little Washita (LW) watershed. An in situ soil mois-ture network, as well as meteorological data, is available in thisregion. The ON region was also a part of SGP97 and SGP99.Both regions fall in a U.S. Department of Energy study area pro-viding a wide range of data including soil moisture and rainfall.In addition, the Oklahoma Mesonet is distributed throughout thestate and also provides a variety of meteorological observationsincluding soil moisture.
Fig. 2 is a portion of a Landsat TM image of the Little RiverGeorgia (GA) region consisting of eight EASE-Grid cells. Thisfigure from July 20, 2003 illustrates the general vegetation con-ditions that were encountered in SMEX03. There is consider-able forest, primarily pines in the uplands and along field edges,as well as some hardwoods in the stream bottoms. Forested areasare typically dark red in Fig. 2. The dominant crop types arepeanuts and cotton. At the time of this particular Landsat ob-servation, the crops were mature with a full canopy resulting inred tones. However, during the field campaign in GA, late June,both crops had partial canopy cover.
The Alabama (AL) study area spans the Alabama–Tennesseeborder in the Tennessee River Valley. Unlike all the other studyregions in SMEX03, this study area was oriented east-west andconsisted of ten EASE-Grid cells. Significant relief character-izes the eastern third of the study area. The remaining part ofthe study area has smooth or gently rolling terrain. Fig. 3 (amultiple date composite of Landsat TM images) illustrates thevegetation levels encountered in SMEX03. It should be notedthat this image was obtained slightly earlier in the season anda few years prior to the SMEX03 field campaign and exhibitsmore bare soil than was encountered during the field campaign.
Most of the AL region consists of small and medium-sizedfarms. Agricultural land (pasture and cultivated land) accountsfor about 40% of land use. Pasture accounts for about 72% ofall agricultural land throughout the study area. Cultivated land

2420 IEEE TRANSACTIONS ON GEOSCIENCE AND REMOTE SENSING, VOL. 43, NO. 11, NOVEMBER 2005
Fig. 1. Landsat TM false-color composite image (red = band 4, green = band3, and blue = band 2) of the OS and ON regions. Image was acquired on July10, 2003.
Fig. 2. Landsat TM false-color composite image (red = band 4, green = band3, and blue = band 2) of the GA region. Image was acquired on July 20, 2003.
generally is located in the central and southwestern part of thestudy area, where relief is lowest. Crops are predominantly corn,soybeans, and cotton.
Fig. 3. Landsat TM false-color composite image (red = band 4, green = band3, and blue = band 2) of the AL region. This is a composite from two imagesacquired on May 14 and April 19, 2000.
The amount of forested land ranges from about 27% in thewestern part to 68% in the eastern part of the study region wheretopographic relief is greatest (the dark red area in the right-handportion of Fig. 3). The plateau and remnant “mountains” supporta mixed oak-pine forest. Shortleaf pine, loblolly pine, sweetgum,yellow-poplar, red oaks, and white oaks are the major overstoryspecies. Dogwood and redbud are major midstory species.Japanese honeysuckle, greenbrier, low panicums, bluestems,and native lespedezas are understory species.
III. ADVANCED MICROWAVE SCANNING RADIOMETER
Full details on AMSR-E and specifics on the soil moisturealgorithm can be found in [3]. This instrument was developedby the Japanese Aerospace Exploration Agency (JAXA) andlaunched by NASA on the Aqua platform on May 4, 2002.AMSR-E makes dual-polarized passive microwave measure-ments at six frequencies: 6.9, 10.7, 18.7, 23.8, 36.5, and89 GHz. The orbit is Sun-synchronous with equator crossingsat 0130 and 1330 local solar time (LST).
The C- (6.9 GHz) and X-band (10.7 GHz) observations havepotential for soil moisture estimation. Atmospheric effects atthese frequencies are minimal, and it is possible to partiallyfilter the effects of vegetation and surface roughness on thebrightness temperature observations through relatively simpleradiative transfer modeling. AMSR-E observations are avail-able globally with a relatively short (2–3 day) repeat time andwill form the basis for the first globally available daily soilmoisture product [3]. Standard soil moisture products are agoal of both the NASA Aqua AMSR-E science team [3] andthe Japanese ADEOS-II AMSR program [7].
It is hoped that the availability of these products will spawnnew applications for remotely sensed soil moisture. However,hopes for AMSR-E soil moisture products have been temperedsomewhat by the discovery that microwave measurements atC-band frequencies are contaminated with anthropogenic RFI[8]. The AMSR-E C-band radiometer makes observations witha central frequency of 6.925 GHz (350-MHz bandwidth) thatis shared with fixed and mobile communication services andis subject to RFI contamination—particularly near large urbanareas [3] and [9]. Some RFI has been reported in other AMSR-Echannels [9].
In addition to RFI, there were problems with the very earlyversions of the C-band channel data related to the calibration[9]. It was found that low brightness temperatures were cor-rect but higher values (typical of land targets) were overesti-

JACKSON et al.: POLARIMETRIC SCANNING RADIOMETER C- AND X-BAND MICROWAVE OBSERVATIONS 2421
mated by approximately 7 K for both H- and V-polarization. InSeptember of 2003, the NASA AMSR-E program implementeda correction for this in their Level 2A dataset that utilizes a non-linear calibration. This is called version B0 data. It should benoted that data produced by JAXA will not include this correc-tion until 2005. The version of the AMSR-E data employed inthe current investigation (B0) was obtained from the NationalSnow and Ice Data Center (http://nsidc.org/data/ae_l2a.html) onNovember 23, 2003.
IV. POLARIMETRIC SCANNING RADIOMETER
The PSR is an airborne microwave imaging radiometer oper-ated by the NOAA Environmental Technology Laboratory [10]for the purpose of obtaining polarimetric microwave emissionof the Earth’s oceans, land, ice, clouds, and precipitation. It hasbeen successfully used in several major experiments includingSGP99 [4] and SMEX02 [5].
The PSR/CX scanhead houses two thermally stabilized polari-metric radiometers that share a common dual-band lens/feedhornantenna. Each radiometer has four subbands that provide sensi-tivity to both vertical and horizontal polarization, along with ananalog correlator that provides sensitivity to the third and fourthStokesparametersateachof the twoprimarybands.Theradiome-ters use internal noise diodes for rapid precalibration, along withexternal views of hot and ambient blackbody targets and coldspace to provide absolute radio thermal calibration.
The PSR/CX radiometers are scanned in a conical mode usinga gimbal drive mechanism (the PSR “positioner”). The posi-tioner rotates the scanhead as fast as one rotation in 2.7 s.This rotation rate along with an 18-ms sample period providesnear-Nyquist sampling of the scene below the aircraft at loweraltitudes, and Nyquist sampling at higher altitudes ( 2000 m).The sensitivity of the radiometers is better than 1 K for 18-msintegration time at most of the PSR/CX subbands.
The PSR/CX is housed within a gimbal-mounted scanheaddrum. The scanhead drum is rotatable by the gimbal positionerso that the radiometers can view any angle within el-evation of nadir at any azimuthal angle, as well as external hotand ambient calibration targets. The configuration thus supportsconical, cross-track, along-track, fixed-angle stare, and spotlightscan modes. Conical scanning at 55 incidence from nadir wasused in SMEX03.
A network of precision clocks within the scanhead and con-trolling computers provides position/sample synchronization tobetter than one millisecond. An aircraft inertial navigation unit(INU) provided roll and pitch information at 10-ms intervals.These data were later used to correct the observed imagery forminor aircraft attitudinal variations.
The PSR/CX system provided simultaneous four-Stokes’vector measurements within four adjacent frequency subbandsin both C- and X-bands (Table II). The multiband capability ofPSR/CX allows the use of using frequency agile radiometry forobservations over interference prone regions [11]. The primarylens/feedhorn antenna is located adjacent to a coboresightedvideo camera and longwave (10 m) infrared sensor.
Calibration of all radiometers was performed in-flight usingstandard (unpolarized) hot and cold blackbody targets. The tar-gets consist of an array of canted pyramidal iron-epoxy ab-sorbing wedges organized in a two-faced L-shaped configura-tion. The pyramids are canted at an angle of 45 so as to provide
TABLE IIPSR/CX CHANNELS FOR SMEX03
TABLE IIIPSR/CX FLIGHTLINE AND MAPPING SPECIFICATIONS FOR SMEX03
maximum absorption in the direction of PSR/CX lens antennas.The absorbing pyramids overlie a thermally conducting sub-strate of aluminum pyramids so that the physical temperature ofthe entire structure remains homogeneous to within 1.5 K. Inboth hot and cold cases the effective emissivities of these targetswere estimated using views of cold space obtained by rollingthe aircraft steeply by 60 and pointing the radiometers to coldspace at above the horizon. The extremely cold observedbrightness temperatures ( 3.2 K) allowed the adjustment of thecalibration target emission temperatures to achieve consistencyacross a wide range ( 340 K) of T values.
During SMEX03, the PSR/CX scanhead was integrated intothe NASA Wallops Flight Facility P-3B aircraft in the aft portionof the bomb bay. Spatial resolution and other features of thePSR/CX for the high-altitude lines are listed in Table III.
V. AIRCRAFT DATA COLLECTION AND PROCESSING
The NASA P-3B was deployed to Huntsville, AL from June25 to July 2 to provide coverage of the AL and GA regionsand was then moved to Oklahoma City to provide coverage ofthe OS and ON sites through July 18. High-altitude flights at7700 m above ground level were conducted over all regions.Limited low-altitude flights were conducted over the Little

2422 IEEE TRANSACTIONS ON GEOSCIENCE AND REMOTE SENSING, VOL. 43, NO. 11, NOVEMBER 2005
TABLE IVSMEX03 P-3B SITE COVERAGE
Washita portion of OS. Table IV summarizes the flights con-ducted over each of the four regional sites. The P3-B flightswere flown during midday in order to match the nominal Aquaoverpass time of 1400 LST. Each flight was approximately 2 hin duration. Additional details can be found in the SMEX03experiment plan http://hydrolab.arsusda.gov/smex03/ and in thedata archive http://nsidc.org/data/amsr_validation/soil_mois-ture/smex03/.
PSR/CX raw data goes through several processing steps.Quality control, time synchronization, calibration, rasterization,and georegistration are considered preprocessing. Followingthis are RFI removal [10], adjusting for temporal variationsinherent in mapping a large region with an aircraft sensor, andfinally the data are resampled to a standard grid that facilitatesmultitemporal analysis and integration with ancillary data basesfor algorithm applications. These three steps are described inthe following sections.
In the course of processing the PSR/CX data from SMEX03,it was found that the X-band V-polarization data had inherentnoise diode calibration problems that could not be corrected.Therefore, these data had to be deleted from analyses.
A. Removal of RFI and Subband Selection
An initial review of the PSR/CX data for all the C-band fre-quencies available indicated that anthropogenic RFI was presentin all channels and both polarizations. RFI is manifested byhigher than expected brightness temperatures, sometimes ex-ceeding the nominal geophysical brightness temperatures byhundreds of Kelvins. In most cases the RFI was spatially lo-calized, temporally consistent and often present in all channelssimultaneously.
The purpose of using multiple subbands for each primaryPSR/CX band is to provide a means of detecting anthropogenicradio-frequency interference. Such an interference detectionand correction algorithm was successfully demonstrated usingPSR data from SGP99 [4] and was applied to both C- andX-band in SMEX02 [5]. The algorithm works by comparingbrightness temperatures in several nearby subbands throughthe use of a standard spectral model. This approach was usedwith the SMEX03 data. PSR/CX subbands could be used toidentify the general location of the interference and to select
the frequency band of least contamination. Relatively fewoccurrences of interference were noted at X-band.
Based upon a close examination of the RFI in the data, itwas concluded that the 7.32- and 10.7-GHz bands were superiorto the others. Therefore, all analyses used these channels. Theresulting PSR/CX datasets should be nearly free of RFI.
B. Temporal Normalization
Collecting high-resolution radiometric data over a large re-gion requires considerable aircraft flight time. For SMEX03,it took over an hour to complete a mapping session for a re-gion on any given day. Both the surface emissivity and physicaltemperature can increase over the course of this interval. Otherlong-term drifts in instrument characteristics not accounted forin the calibration process could also contribute to brightnesstemperature variations over the flight period.
By design, the data from any given flight line partially over-lapped the data from adjacent flight lines. To have the equivalentof an instantaneous snapshot of the region, it was necessary tonormalize the observed imagery to a single time. It is assumedthat no temporal correction was needed within a given flight line,but rather only from line to line. Next, the second of the fournorth–south lines on each day was used as a standard for thatday. Following this, all data points that fell in the overlappingareas of the flight lines were identified and averaged by line.The average of this area for each line was compared to the samearea for line 2 to determine a correction offset. This techniquehas been employed in previous aircraft missions [4] and [5].
C. Grid Resampling
The PSR/CX data consist of beam positions for sequentialconical scans. Each beam position footprint is about 3 km insize. Due to sampling rates, the spacing between these foot-prints is 300 m, which results in over sampling. In addition,as described above, each line of data overlaps other lines. It isalso desirable to produce datasets that can be integrated in fur-ther analyses. Therefore, all the footprint data were used in akriging-based grid resampling procedure. The output grid se-lected was 800 m, which matched the nominal field scale inthe regions as well as the resolution of other databases. Eachchannel of data was resampled independently.
VI. BRIGHTNESS TEMPERATURE IMAGE ANALYSES
In this section, the quality of the PSR/CX datasets collected inSMEX03 isassessed. Only theC-band H-polarizationwill bedis-cussed because, based upon theory, this is expected to be the mostresponsive to soil moisture and least affected by vegetation. Theother channels did behave in a similar manner and are included inthe quantitative analyses in the next section. Patterns of T are in-terpreted in the context of measured precipitation and landscapefeatures inferred from the previously presented Landsat imagerywith supporting field observations. A limitation of the SMEX03microwave observations, both satellite and aircraft, was the lackof a range in the observed soil moisture conditions. There was al-most no rainfall during SMEX03 at the OS and ON sites resultingin constant dry soil conditions. There was significant rainfall overthe AL region and limited rainfall over GA.
The observed sequence of gridded brightness temperature im-ages for OS is shown in Fig. 4. The only rainfall that occurred

JACKSON et al.: POLARIMETRIC SCANNING RADIOMETER C- AND X-BAND MICROWAVE OBSERVATIONS 2423
Fig. 4. PSR 7.32-GHz H-polarization brightness temperature images for the OS region.
Fig. 5. PSR 7.32-GHz H-polarization brightness temperature images for the ON region.
in this region during the entire period was on July 1. This is re-flected in the lower T values in the northeast portion of theimage. This lower T area shrinks on July 3 and is nearly goneby July 5. The overall levels of T are remarkably consistentfrom day to day. The only significantly different features in the
image sequence are a number of small water bodies in the re-gion. Fig. 1 indicates rather uniform vegetation conditions in theOS region.
Fig. 5 is the sequence of images obtained for ON. Much thesame precipitation conditions discussed for OS were encoun-

2424 IEEE TRANSACTIONS ON GEOSCIENCE AND REMOTE SENSING, VOL. 43, NO. 11, NOVEMBER 2005
Fig. 6. PSR 7.32-GHz H-polarization brightness temperature images for the GA region.
Fig. 7. Precipitation images for events during SMEX03 in the GA region.
tered in the ON region. In the ON region there was a single eventprior to the July 10 flight that impacted a portion of the region.Much of the decrease in T associated with this event was gonein the data collected the next flight day. Two features of note inthe image sequence are the city of Enid (also see Fig. 1) locatedin the northwest portion of the image (slightly lower values ofT each day) and two small lakes near Oklahoma City (alsosee Fig. 1) in the southeast. Fig. 1 indicates fairly consistent
land cover throughout the region. The overall levels of T areslightly lower in this region than in OS, which may reflect theoverall lower amount of vegetation in ON.
Fig. 6 shows the three images obtained for the GA region.These images show interesting features as the result of precipi-tation and more spatially variable vegetation conditions than en-countered in OS and ON. The last rainfall prior to the June 25 Timage occurred on June 20. Therefore, high T values were ex-

JACKSON et al.: POLARIMETRIC SCANNING RADIOMETER C- AND X-BAND MICROWAVE OBSERVATIONS 2425
Fig. 8. PSR 7.32-GHz H-polarization brightness temperature images for theOS region.
pected. There are also patterns in this image that are the result ofthe vegetation cover. All of the darker red areas in Fig. 2, whichare mostly forested, correspond to higher T values. There area few areas with lower T values that are associated with thedrainages.
Rainfall in the GA region was provided by cumulative gaugesplaced in fields used for soil moisture sampling. These locationsare indicated in Fig. 7. Readings were made at the time of soilmoisture sampling and corresponded to the rainfall in the 24 hprior to local noon, which was just prior to the aircraft data col-lection. Although this is a rather dense network the precisionof this type of gauge is not high. These data were used in akriging-based interpolation procedure to generate gridded im-ages of the region. These images are intended only to illustratepatterns and are not used in any further quantitative analyses.Rain events occurred prior to the June 29 and June 30 flights.Interpolated images of the antecedent rainfall for these dates areshown in Fig. 7.
Fig. 9. Precipitation images for events during SMEX03 in the AL region.
The rainfall was light over most of the GA region prior toJune 29. Comparing Figs. 6 and 7 for June 29 it is observedthat there was very little change in T from the preceding dryday (June 25) over much of the region. Unfortunately the areaswhere there were changes in T corresponded to areas withfewer rain gauges. Therefore, it would be difficult to infer moreinformation from this date without utilizing the actual soil mois-ture observations.
The rainfall image for June 30 (Fig. 7) shows that significantrain occurred in some areas of the GA region prior to the aircraftdata collection on that date. Comparing the rainfall (Fig. 7), landcover (Fig. 2), and T values (Fig. 6) it appears that this amountof rain reduced T values over both the agricultural fields andportions of what were interpreted as forested areas from Fig. 2.As in the case of the June 29 observations, the highly variablerainfall and mixed land uses make it difficult to comment anyfurther without soil moisture observations.
The data collected in AL are the most interesting and straightforward to interpret of all the SMEX03 datasets. The first thingto point out for the AL region is that there are three well-definedvegetation domains in Fig. 3. The northwest is mixed forest andpasture, the balance of the western half is cropland intermixedwith pasture, and the eastern half is forest. In Fig. 8 there areconsistent spatial features of the T values that are the result ofthese land cover variations. A river and reservoir are located onthe eastern edge and southwest corner of the images (low Tvalues).
For the AL analyses, ground data collected as part ofa cooperative project between Alabama A&M University

2426 IEEE TRANSACTIONS ON GEOSCIENCE AND REMOTE SENSING, VOL. 43, NO. 11, NOVEMBER 2005
Fig. 10. Photo of ground and canopy conditions within the AL forest areaduring SMEX03.
and the USDA Soil Climate Analysis Network (SCAN)(http://www.wcc.nrcs.usda.gov/smst/smst.html) were used.There were a total of ten stations distributed in or near the ALregion; the locations of those within the mapping region areshown in Fig. 9. Data are reported on an hourly basis. For eachflight date, the cumulative rainfall from the previous flight,up to the time of the aircraft over flight, was computed. As inthe case of the GA data, the point observations were used toproduce the resampled grid images.
The June 25 T images shown in Fig. 8 are fairly uniformand represent dry conditions, since there had been no rain in theregion for several days. Rainfall between the June 25 and 27 Timages is shown in Fig. 9. From this figure, we observed thatthe rain was widespread but heaviest in the central portion ofthe image, which corresponded to the lowest vegetation levels.Therefore, in attempting to interpret the T image for June 27it was not possible to separate the effects of lighter vegetationin the eastern portion from the increased vegetation levels asso-ciated with a forest canopy. An overall decrease of T valuesin the July 27 image is likely the result of decreased physicaltemperature since the rainfall occurred just a few hours beforethe flight. The next precipitation occurred on June 30 during theearly morning on the day of the flight. As shown in Fig. 9, therainfall was light and there was likely no precipitation in thewestern portion. In the T image sequence of Fig. 8 there is anincrease between June 27 and 29 that was likely the result ofdrying. The June 29 and 30 images are very similar.
Between the flight on June 30 and that of July 2 there wasextended and significant rainfall throughout the region (Fig. 9).Here, the eastern-forested portion received the most rainfall(over 5 cm). The central portion of the July 2 T image (Fig. 8),which was agriculture, exhibited a decrease in T values;however, no change in T was observed for the forested areabetween June 30 and July 2 even though there was significantantecedent rainfall. This result clearly demonstrates the lackof sensitivity to soil moisture changes when using a C-bandsensor in this particular forested region. Fig. 10 illustrates thecanopy/understory conditions in this forested region. Theseare not exceptionally dense forest canopy conditions. Thecanopy leaf water content was estimated to be approximately,1.6 kg/m (John Kimball, personal communication).
Fig. 11. Comparison of X-band brightness temperature data collected by TMIand AMSR-E X during SMEX03. The legend indicates the site and polarization.
VII. COMPARISON OF AMSR-E, TMI, AND PSRBRIGHTNESS TEMPERATURES
One of the goals in SMEX03 was to contribute to the validationof the low-frequency brightness temperature products generatedfrom Aqua AMSR-E over land. Since this analysis involves thePSR/CX data it also addresses an important science question;do the high-resolution aircraft T data ( 3 km) scale directlyto the coarse-resolution satellite observations ( 50 km)? In thissection, the results of a multiple-step analysis are presented thataddress these validation and scaling issues. First, TMI X-bandobservations are compared to similar PSR/CX and AMSR-Echannels. Following this, the relationships between X- andC-band channels is examined. Finally, an evaluation of thePSR/CX and AMSR-E X- and C-band channels is presented.
All datasets for the four regional study areas that had concur-rent observations of TMI and AMSR-E, TMI, and PSR/CX, orAMSR-E and PSR/CX were identified. It was noted earlier thatfor this investigation the definition of concurrent is within 1 hof each other. No attempt was made to temporally adjust any ofthe datasets. This resulted in a moderate number of samples foreach combination but fewer for the TMI comparisons. This isdue to the constantly changing time of observations of the TMI;only a few days had observations close enough to the AMSR-Eobserving time. It was also noted previously that the PSR/CXX-band V-polarization data were not considered to be reliableand was not analyzed here.
For each of the instruments being used, all footprints withcenters that fell at least 10 km inside the study regions were aver-aged. This typically resulted in 50 for TMI, 27 for AMSR-E,and 160 000 for PSR/CX.
The starting point in this analysis is the stipulation that theTMI is a well-calibrated radiometer. This seems a reasonableassumption since TMI has been in operation for five yearsand many investigators have evaluated the data. Therefore,comparisons of the AMSR-E and PSR/CX X-band channelsto the TMI data should indicate how well the same channels ofthese instruments were calibrated. Fig. 11 shows the TMI versusthe AMSR-E data. The results indicate a nearly one-to-onecorrespondence between the two datasets for both H- andV-polarization. The bias for H-polarization was 0.6 K (AMSR-

JACKSON et al.: POLARIMETRIC SCANNING RADIOMETER C- AND X-BAND MICROWAVE OBSERVATIONS 2427
TABLE VSTATISTICAL COMPARISON OF AIRCRAFT AND SATELLITE
BRIGHTNESS TEMPERATURE DATASETS
Fig. 12. Comparison of X-band H-polarization brightness temperature datacollected by the PSR/CX with TMI and AMSR-E X data during SMEX03. Thelegend indicates the site and satellite source.
E—TMI) and the standard error of estimate (SEE) was 2.1 K.The SEE may be the result of several factors. The higherspatial resolution of the TMI will result in a somewhat smallerarea being averaged since we are averaging all footprints thatfall at least 10 km inside the study area boundaries. Temporalvariationwithin the1-h timewindowselectedcanalsocontribute.Other results are summarized in Table V. These results supportthe assumption that the AMSR-E X-band channels are wellcalibrated in the range of observed T .
The next comparison is between the PSR/CX X-band H-po-larization data and the similar TMI and AMSR-E channels. Thisset of results is shown in Fig. 12. Generally unbiased relation-ships were observed (0.3 K for PSR—TMI and 1.0 K forPSR—AMSR-E). The scatter appears similar to that found inFig. 11 (SEE value of 2.0 K for PSR—TMI). Statistics are sum-marized in Table V. Increased scatter (SEE) was anticipated dueto the large difference in spatial scales of the aircraft and satel-lite observations. However, the SEE did not increase signifi-cantly. In addition, the results are unbiased. These results sug-gest that the scaling from higher resolution aircraft observationsto coarser satellite measurements is close to linear for the rangeof conditions studied in SMEX03.
Evaluation of the C-band data from the PSR/CX andAMSR-E is not as straightforward as the X-band analysis since
Fig. 13. Average brightness temperature as a function of frequency during theSMEX03 time period for homogeneous land sites.
the TMI data cannot be used as a reference and neither instru-ment has a validated calibration. The previous analyses did,however, establish the reliability of the X-band data. Therefore,we will attempt to use this as a reference and establish a linkbetween X- and C-band. The basis of this is the spectral be-havior (T as a function of frequency). From theory [9], [12],the emissivity of soil and vegetation should tend to increase asfrequency increases. Over the AMSR-E frequency range thedielectric constant of soil and water exhibit small decreases,which could result in an increase in emissivity with frequency.Another soil related factor is that a shallower soil layer con-tributes to the measurement as frequency increases. Sincethe surface is typically drier than deeper layers, an increasein emissivity with frequency might be expected. Vegetationcan increase emissivity as the result of increased masking ofthe soil surface. However, there is also the possibility thatat higher frequencies the size of the vegetation componentsmay contribute to increased scattering and lower values of T .Based upon these various considerations, it is anticipated thatthe X-band T values will be greater than the C-band values.
The spectral behavior described above can be examinedusing the observed T for specific types of land cover and theSMEX03 study sites. As noted in [9], when using T instead ofemissivity, the atmospheric effects must be considered. Thesewill tend to impact the frequencies higher than X-band. As aresult, it is possible to observe decreases or increases at specificfrequencies. Following the approach used in [9] we averagedthe data for each site over a one-month period encompassingthe SMEX03 study period. Only the ascending AMSR-E datawere used.
As a first step in the spectral analysis we examined AMSR-Edata for three regions of homogeneous land cover where the pos-sibility of RFI contamination is low: the Amazon forest, the Sa-hara desert, and a grassland region in Mongolia. Corner coor-dinates of these sites are listed in Table I. Fig. 13 is a plot ofAMSR-E T as a function of frequency. The absolute levelsof T cannot be compared between sites because of the dif-ferent temperature regimes. However, the patterns and differ-ences between H- and V-polarization are relevant. For all sites

2428 IEEE TRANSACTIONS ON GEOSCIENCE AND REMOTE SENSING, VOL. 43, NO. 11, NOVEMBER 2005
Fig. 14. Average brightness temperature as a function of frequency duringthe SMEX03 time period for the SMEX03 study sites. (a) H-polarization.(b) V-polarization.
the V-polarization T is nearly constant as a function of fre-quency. For H-polarization the T increases with frequency.The rate of change at the lower frequencies is a function of theamount of vegetation. For the Amazon, with the densest vege-tation, the T is nearly constant over the AMSR-E frequencyspectrum. The difference between the C-band V- and H-polar-ization observations over the Amazon is small due to the pres-ence of vegetation ( 3 K). This difference in C-band V- andH-polarization observations increases ( 35 K) over Mongolia(sparse vegetation) and over the Sahara desert ( 60 K). As thefrequency increases the effect of vegetation and atmosphere in-creases, resulting in a decrease in the difference between V- andH-polarization values. In addition, we also examined each dayof data on an individual basis to establish that average repre-sented the daily trends.
Data for the SMEX03 sites are plotted in Fig. 14. ThePSR/CX H-polarization data [Fig. 14(a)] exhibit the patternthat we expect to see based upon theory, an increase in T asfrequency increases from C-to X-band. The PSR/CX results in-dicate that X-band T was 3.3 K higher than C-band. Fig. 14(a)and Table V summarize the results for H-polarization.
As noted previously, only the H-polarization could be usedin this portion of the analysis since the X-band V-polarizationhad to be deleted. A comparison of the PSR/CX C-band H- andV-polarization indicated that V was larger than H by 10.6 K(ranging from 8.3 K in AL to 13.5 in ON). The difference be-tween the V- and H band observations should be smaller overvegetated areas (AL was 50% forested), than the difference oversparse vegetation (ON was mostly harvested winter wheat). Thisrelationship between the amount of vegetation and the differ-ence in V- and H-polarization observations is also seen whencomparing AMSR-E observations over the Amazon and Sahara
regions. From theory and observations (Fig. 13), it is expectedthat the V-polarization T should be larger than the H-polariza-tion value.
The AMSR-E data for the SMEX03 study sites do not exhibitthe pattern that is expected from theory or the reference sitespresented in Fig. 13. For H-polarization [Fig. 14(a)], all sitesexhibited a decrease in T from C-to X-band. A review of thespatial and temporal patterns of AMSR-E C- and X-band Tdata from the study sites suggests that there was C-band RFIpresent at various levels in all sites. As described in [9], RFIwill tend to increase the C-band T resulting in the patterns weobserve in Fig. 14(a). ON and GA followed the expected trend,which suggests that these H-polarization data may not be as con-taminated. It was also observed for V-polarization [Fig. 14(b)]that a decrease in T from C-to X-band occurred for all sites.Therefore, it appears that there are different issues involved inthe H- and V-polarization data. This suggests that RFI may havepolarization dependence.
The comparisons above indicate that the PSR/CX X-bandH- and C-band H channels are accurately calibrated. AMSR-EX-band data is also considered to be accurate. However, RFIcontamination in the AMSR-E C-band channels prevents use ofthe data in soil moisture retrieval at these sites.
VIII. SUMMARY
Validation of the soil moisture products, as well as thebrightness temperatures over land, from AMSR-E and the othersatellite instruments is a critical issue and one that is difficult toaddress. The coarse spatial scale of these passive microwaveinstruments (40–75 km) and the high temporal and spatialvariability of the soil moisture fields make extensive samplingand replication difficult and costly. A series of field experiments(Soil Moisture Experiment) were developed to address theseneeds using a combination of ground and aircraft observations.
Here, the brightness temperature results obtained by thePSR/CX during SMEX03 were analyzed. Data from fourdiverse regions were utilized. Aircraft data were processed togenerate a series of calibrated, georegistered, and temporallynormalized brightness temperature products. Analyses includedthe PSR/CX brightness temperatures responses associated withgeneral landscape features resulting from land cover and pre-cipitation. The value of the data collected in Oklahoma for thisportion of the analysis was very limited due to a small rangeof observed moisture conditions. Data collected in Alabamaincluded a wide range of antecedent rainfall conditions anddiverse vegetation cover. Results indicated a lack of sensitivityto rainfall/soil moisture under the forest canopy conditionstypical of the region at C-bands.
In addition, data from the PRS/CX, AMSR-E, and TMIsensors were compared to assess scaling, RFI, and validation ofAMSR-E brightness temperatures products. These comparisonsvalidated the AMSR-E and PSR/CX X-band H-polarizationcalibrations, which indicated linear scaling from the aircraftto satellite observations. PSR/CX C-band H-polarization datawere also validated; however, there was RFI present in theAMSR-E C-band observations. The presence of RFI willeliminate these data from further analyses.
The results of the analyses conducted here have establishedthe quality of both PSR/CX X- and C-band data and AMSR-EX-band data collected in SMEX03. With this knowledge, further

JACKSON et al.: POLARIMETRIC SCANNING RADIOMETER C- AND X-BAND MICROWAVE OBSERVATIONS 2429
soil moisture and geophysical interpretations can be performedwith confidence.
ACKNOWLEDGMENT
The aircraft data are available from the National Snow and IceData Center at http://nsidc.org/data/amsr_validation/soil_mois-ture/smex03/.
REFERENCES
[1] Y. H. Kerr, P. Waldteufel, J. P. Wigneron, J. Font, and M. Berger,“Soil moisture retrieval from space: The Soil Moisture Ocean Salinity(SMOS) mission,” IEEE Trans. Geosci. Remote Sens., vol. 39, no. 8,pp. 1729–1735, Aug. 2001.
[2] D. Entekhabi, E. Njoku, P. Houser, M. Spencer, T. Doiron, J. Smith, R.Girard, S. Belair, W. Crow, T. Jackson, Y. Kerr, J. Kimball, R. Koster, K.Mcdonald, P. O’Neill, T. Pultz, S. Running, J. Shi, E. Wood, and J. VanZyl, “An Earth system pathfinder for global mapping of soil moistureand land freeze/thaw: The Hydrosphere State (HYDROS) mission con-cept,” IEEE Trans. Geosci. Remote Sens., vol. 42, no. 10, pp. 2184–2195,Oct. 2004.
[3] E. G. Njoku, T. J. Jackson, V. Lakshmi, T. K. Chan, and S. V. Nghiem,“Soil moisture retrieval from AMSR-E,” IEEE Trans. Geosci. RemoteSens., vol. 41, no. 2, pp. 215–229, Feb. 2003.
[4] T. Jackson, A. Gasiewski, A. Oldak, M. Klein, E. Njoku, A. Yevgrafov,S. Christiani, and R. Bindlish, “Soil moisture retrieval using the C-bandPolarimetric Scanning Radiometer during the Southern Great Plains1999 experiment,” IEEE Trans. Geosci. Remote Sens., vol. 40, no. 10,pp. 2151–2161, Oct. 2002.
[5] R. Bindlish, T. J. Jackson, A. J. Gasiewski, M. Klein, and E. G. Njoku,“Soil moisture mapping and AMSR-E validation using the PSR inSMEX02,” Remote Sens. Environ., to be published.
[6] R. Armstrong, M. J. Brodzik, and A. Varani, “The NSIDC EASE-grid:Addressing the need for a common, flexible, mapping and griddingscheme,” Earth Syst. Monitor, vol. 7, no. 4, 1997.
[7] T. Koike, E. G. Njoku, T. J. Jackson, and S. Paloscia, “Soil moisturealgorithm development and validation for the ADEOS/AMSR,” in Proc.IGARSS, Honolulu, HI, Jul. 24–28, 2000.
[8] L. Li, E. G. Njoku, E. Im, P. Chang, and K. St. Germain, “A preliminarysurvey of radio-frequency interference over the U.S. in Aqua AMSR-Edata,” IEEE Trans. Geosci. Remote Sens., vol. 42, no. 2, pp. 380–390,Feb. 2004.
[9] E. G. Njoku, T. Chan, W. Crosson, and A. Limaye, “Evaluation of theAMSR-E data calibration over land,” Ital. J. Remote Sens., vol. 30/31,pp. 19–38, 2004.
[10] J. R. Piepmeier and A. J. Gasiewski, “High-resolution passive polari-metric microwave mapping of ocean surface wind vector fields,” IEEETrans. Geosci. Remote Sens., vol. 39, no. 3, pp. 606–622, Mar. 2001.
[11] A. G. Gasiewski, M. Klein, A. Yevgrafov, and V. Leuskiy, “Interferencemitigation in passive microwave radiometry,” in Proc. IGARSS, vol. 3,Toronto, CA, Jun. 2002, pp. 1682–1684.
[12] N. C. Grody, “Surface identification using satellite microwave radiome-ters,” IEEE Trans. Geosci. Remote Sens., vol. 26, no. 6, pp. 850–859,Nov. 1988.
Thomas J. Jackson (A’86–SM’96–F’02) receivedthe Ph.D. degree in civil engineering from theUniversity of Maryland, College Park, in 1976.
He is currently a Hydrologist with the U.S.Department of Agriculture’s Agricultural ResearchService Hydrology and Remote Sensing Laboratory,Beltsville, MD. His research involves the applicationand development of remote sensing technologyin hydrology and agriculture. His initial researchwith USDA extended his Ph.D. work on the use of
visible/near-infrared satellite data for deriving land cover parameters used inhydrologic models. He has also investigated the use of an airborne laser profilerfor measuring and monitoring soil erosion. The results of this research resultedin a paper “Airborne Laser Measurements of the Surface Topology of SimulatedConcentrated Flow Gullies.” His current research focuses on the use of passivemicrowave techniques in hydrology. These studies have ranged from small-scalecontrolled condition field experiments utilizing truck-mounted radiometers tolarge-scale multitemporal aircraft mapping. He is the Leader of a series of large-scale field experiments designed to extend high-resolution research to satellitescales. In conjunction with this, he is a Principal Investigator of studies involvingSSM/I, TRMM, ADEOS-II, Aqua, Envisat, and ALOS.
Dr. Jackson received The Paper of the Year Award from the American Societyof Agricultural Engineers for his paper “Airborne Laser Measurements of theSurface Topography of Simulated Concentrated Flow Gullies” in 1990, and thePrize Paper Award for his “Diurnal Observations of Surface Soil Moisture UsingPassive Microwave Radiometers” at the International Geoscience and RemoteSensing Symposium in 1994. in 1999, he received the National Soceity of Pro-fessional Engineers 1999 Engineer of the Year Award for USDA ARS. In 2000,his work on aircraft mapping “Soil Moisture Mapping With Passive MicrowaveImagery Data and Geostatistical Analysis” received the Remote Sensing andHydrology 2000 Sympoisum Best Paper Award from the International Associ-ation of Hydrological Sciences. He is a Fellow of the American GeophysicalUnion and currently serves on the Administrative Committee of the IEEE Geo-science and Remote Sensing Society.
Rajat Bindlish (M’00) received the B.S. degreein civil engineering from the Indian Institute ofTechnology, Bombay, and the M.S. and Ph.D.degrees in civil engineering from The PennsylvaniaState University, University Park, in 1993, 1996, and2000, respectively.
He is currently with SSAI, Lanham, MD, workingat the U.S. Department of Agriculture’s AgriculturalResearch Service, Hydrology and Remote SensingLaboratory, Beltsville, MD. His research interests in-volve the application of microwave remote sensing in
hydrology. He is currently working on soil moisture estimation from microwavesensors and their subsequent application in land surface hydrology.
Albin J. Gasiewski (S’81–M’88–SM’95–F’02) re-ceived the B.S. and M.S. degrees in electrical engi-neering and the B.S. degree in mathematics, all fromCase Western Reserve University, Cleveland, OH, in1983, and the Ph.D. degree in electrical engineeringand computer science from the Massachusetts Insti-tute of Technology, Cambridge, in 1989.
From 1989 to 1997, he was Faculty Memberwithin the School of Electrical and Computer En-gineering, Georgia Institute of Technology (GeorgiaTech), Atlanta. As an Associate Professor at Georgia
Tech, he developed and taught courses on electromagnetics, remote sensing,instrumentation, and wave propagation theory. He is currently with the U.S.National Oceanic and Atmospheric Administration’s (NOAA) EnvironmentalTechnology Laboratory (ETL) in Boulder, CO, where he is Acting Chief of theETL Microwave Systems Development Division. His technical interests includepassive and active remote sensing, radiative transfer theory, electromagnetics,antennas and microwave circuits, electronic instrumentation, meteorology, andoceanography.
Dr. Gasiewski is currently President of the IEEE Geoscience and RemoteSensing Society and was General Chair of the 2nd Combined Optical-Mi-crowave Earth and Atmosphere Sensing Symposium (CO-MEAS 1995). Heorganized the technical program for the 20th International Geoscience and Re-mote Sensing Symposium (IGARSS 2000) and is the named General Co-Chairof IGARSS 2006, to be held in Denver, CO. He is a member of the AmericanMeteorological Society, the American Geophysical Union, the InternationalUnion of Radio Scientists (URSI), Tau Beta Pi, and Sigma Xi,. He is currentlyserving as Secretary of USNC/URSI Commission F. He has served on the U.S.National Research Councils Committee on Radio Frequencies (CORF) from1989 to 1995.

2430 IEEE TRANSACTIONS ON GEOSCIENCE AND REMOTE SENSING, VOL. 43, NO. 11, NOVEMBER 2005
Boba Stankov, photograph and biography not available at the time ofpublication.
Marian Klein received the M.S. and Ph.D. degrees inelectrical engineering from the Technical University(TU) of Kosice, Kosice, Slovak Republic, in 1986 and1996, respectively.
From 1987 to 1996, he was a Faculty Memberwithin the Faculty of Electrical Engineering and In-formatics, TU Kosice. From September 1996 to June1997, he was a Fulbright Scholar at the Georgia In-stitute of Technology, Atlanta, working in the Labo-ratory for Radio Science and Remote Sensing. FromJune 1997 to August 1998, he was a Guest Worker
at the National Oceanic and Atmospheric Administration, Environmental Tech-nology Laboratory, Boulder, CO. Since August 1998, he has been with the Co-operative Institute for Research in Environmental Sciences, University of Col-orado, Boulder. The areas of his technical expertise include passive microwaveremote sensing and radiative transfer theory.
Dr. Klein is member of the IEEE Geoscience and Remote Sensing Society.
Eni G. Njoku (M’77–SM’83–F’95) received theB.A. degree in natural and electrical sciencesfrom Cambridge University, Cambridge, U.K., in1972, and the M.S. and Ph.D. degrees in electricalengineering from the Massachusetts Institute ofTechnology, Cambridge, in 1974 and 1976.
He is currently a Principal Scientist with the JetPropulsion Laboratory (JPL), Pasadena, CA, and isthe JPL Project Scientist for the HYDROS mission.From 1976 to 1977, he was a National ResearchCouncil Resident Research Associate. In 1977, he
joined JPL. From 1986 to 1990, he served as Discipline Scientist for Ocean andEarth Science Data Systems at NASA Headquarters, Washington, DC, and from1993 to 1994, he was Manager of the Geology and Planetology Section at JPL.During the 2001–2002 academic year, he was on leave as a Visiting Professorat the Massachusetts Institute of Technology. He is a member of the AquaAdvanced Microwave Scanning Radiometer science team and was PrincipalInvestigator for the IIP OSIRIS technology study. His primary interests arein the use of passive and active microwave remote sensing for hydrology andclimate applications. His research involves studies of microwave interactionswith land surfaces and retrieval algorithm development.
Dr. Njoku is a member of the American Meteorological Society, the Amer-ican Geophysical Union, the American Association for the Advancement of Sci-ence, Commission F of the International Union of Radio Science, and Sigma Xi.He has served as an Associate Editor of the IEEE Transactions on Geoscienceand Remote Sensing (1985–1988) and was the Technical Program Chairmanfor IGARSS’94 held in Pasadena, CA. He has been a recipient of NASA GroupAchievement Awards in 1980, 1982, and 1985, and he was awarded the NASAExceptional Service Medal in 1985.
David Bosch, photograph and biography not available at the time of publication.
Tommy L. Coleman, photograph and biography not available at the time ofpublication.
Charles A. Laymon (M’01) received the B.S. degreein geology with honors from St. Lawrence University,Canton, NY, and the Ph.D. degree in geological sci-ences from the University of Colorado, Boulder, in1982 and 1988, respectively.
He joined Universities Space Research Asso-ciation (USRA), Huntsville, AL, in 1991 and iscurrently a Research Fellow with the USRA GlobalHydrology and Climate Center. His research interestsinclude remote sensing of land surface propertiesand processes, such as soil moisture, vegetation
parameters, surface temperature, and energy fluxes, and in the assimilation ofthese data in hydrologic and climate models for a wide variety of applications.
Dr. Laymon received the Sigma Xi Award in 1982 for excellence in under-graduate research.
Patrick Starks, photograph and biography not available at the time ofpublication.