11- 1 mcgraw hill/irwin copyright © 2009 by the mcgraw-hill companies, inc. all rights reserved...
TRANSCRIPT

11- 1
McGraw Hill/Irwin Copyright © 2009 by The McGraw-Hill Companies, Inc. All rights reserved
Fundamentals of Corporate
Finance
Sixth Edition
Richard A. Brealey
Stewart C. Myers
Alan J. Marcus
Slides by
Matthew Will
Chapter 10
McGraw Hill/Irwin Copyright © 2009 by The McGraw-Hill Companies, Inc. All rights reserved
Introduction to Risk, Return, and the Opportunity Cost of
Capital
11- 2
Topics Covered
Rates of Return: A Review A Century of Capital Market History Measuring Risk Risk & Diversification Thinking About Risk
11- 3
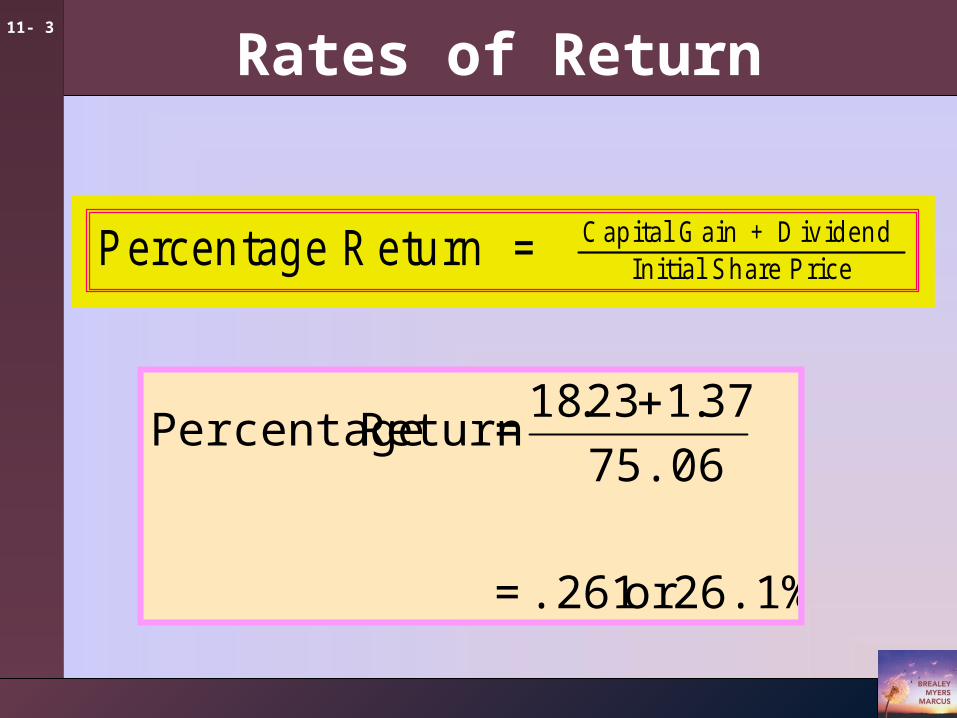
Rates of Return
26.1%or .261=
75.06
37.123.18 =Return Percentage
P e rc e n ta g e R e tu rn = C a p i ta l G a in + D iv id e n d In i t ia l S h a re P r ic e
11- 4
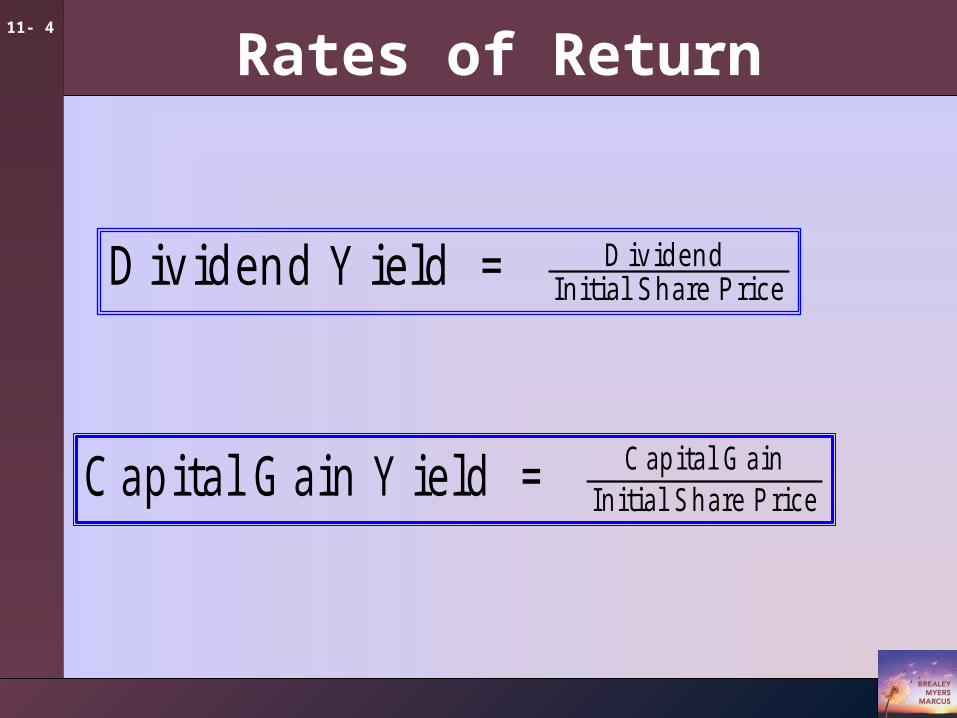
Rates of Return
D iv id e n d Y ie ld = D iv id e n d In i t ia l S h a re P r ic e
C a p i t a l G a in Y ie ld = C a p i t a l G a inIn i t i a l S h a r e P r i c e
11- 5
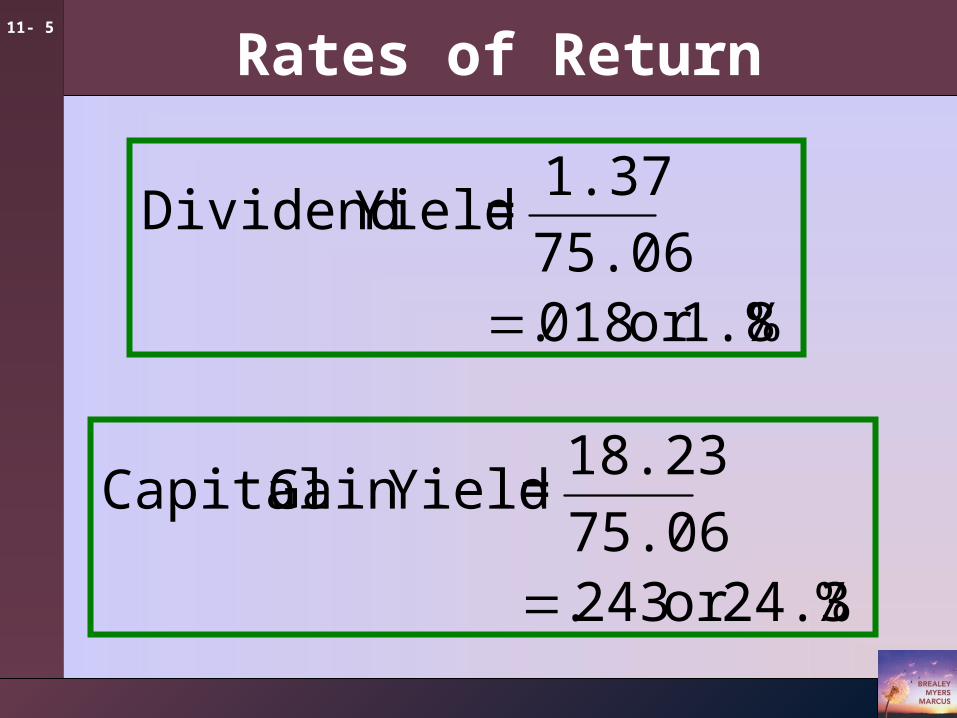
Rates of Return
%1.8or 018.75.06
1.37= Yield Dividend
%24.3or 243.75.06
18.23= YieldGain Capital
11- 6
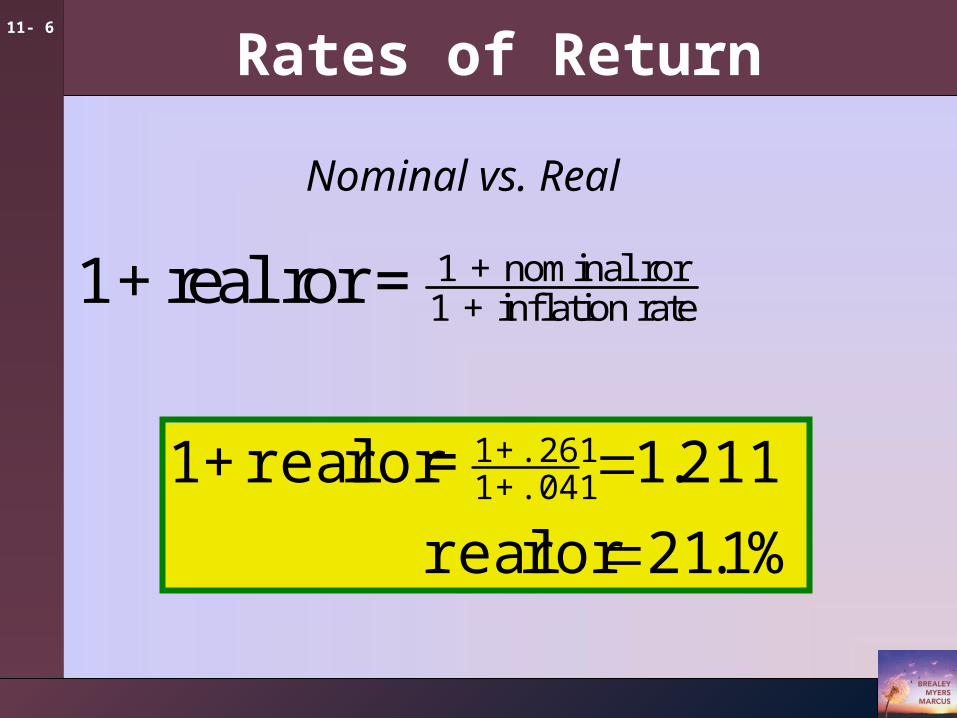
Rates of Return
Nominal vs. Real
1+ real ror = 1 + nominal ror1 + inflation rate
%1.21ror real
211.1=ror real+1 .041 + 1.261 + 1
11- 7
Market Indexes
Dow Jones Industrial Average (The Dow)
Value of a portfolio holding one share in each of 30 large industrial firms.
Standard & Poor’s Composite Index (The S&P 500)
Value of a portfolio holding shares in 500 firms. Holdings are proportional to the number of shares in the issues.
11- 8
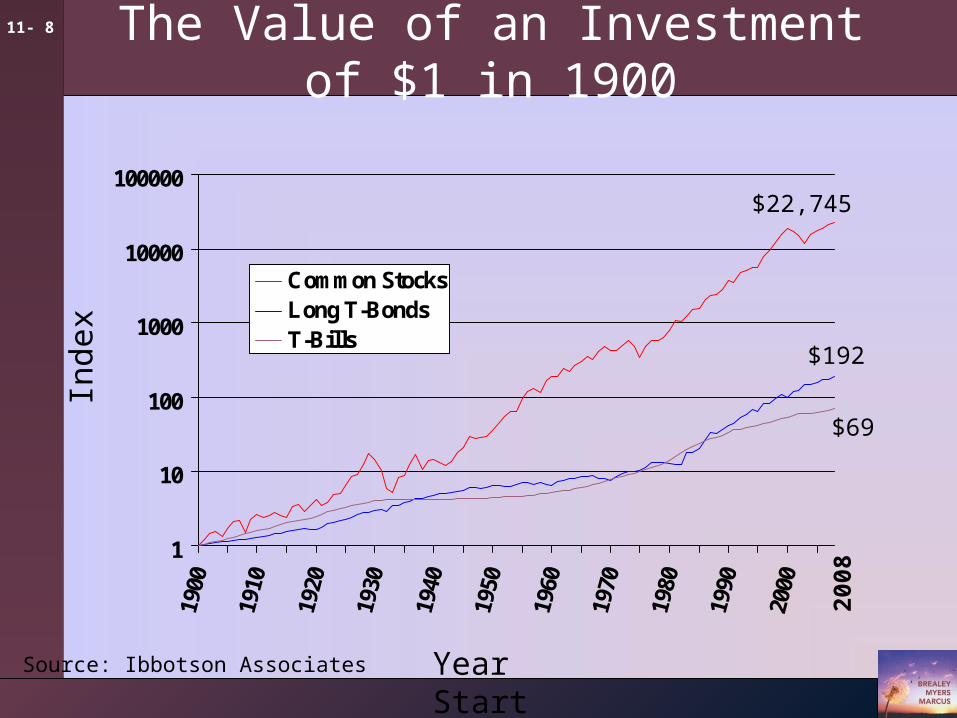
The Value of an Investment of $1 in 1900
Source: Ibbotson Associates
1
10
100
1000
10000
10000019
00
1910
1920
1930
1940
1950
1960
1970
1980
1990
2000
Common StocksLong T-BondsT-Bills
Inde
x
Year Start
$22,745
$192
$69
2008
11- 9
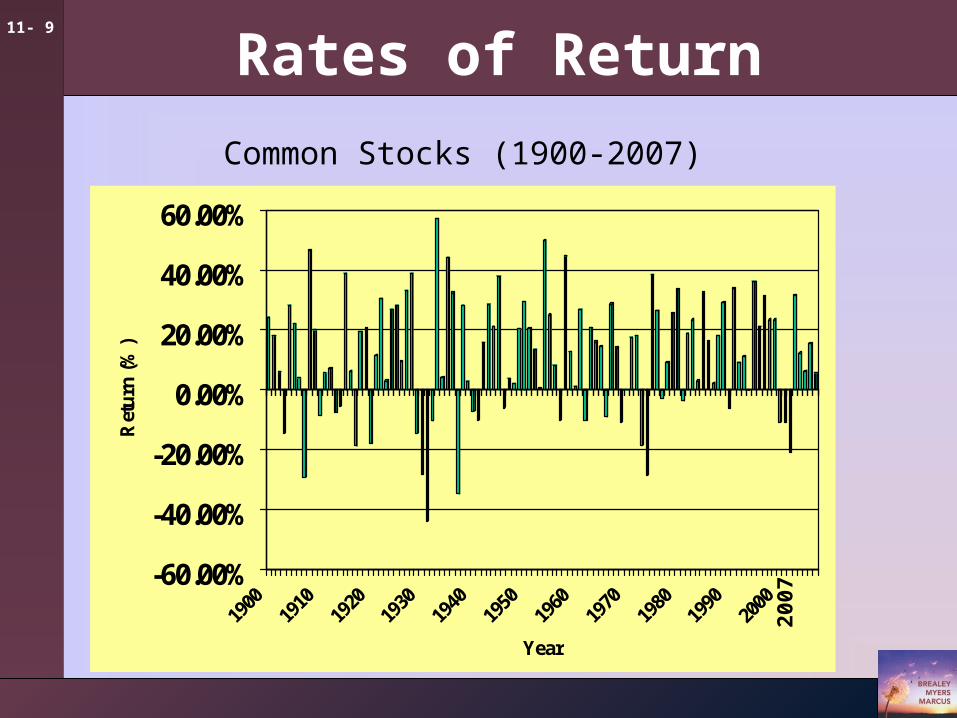
Rates of Return
-60.00%
-40.00%
-20.00%
0.00%
20.00%
40.00%
60.00%
Ret
urn
(%
)
1900
1910
1920
1930
1940
1950
1960
1970
1980
1990
2000
Year
Common Stocks (1900-2007)
2007
11- 10
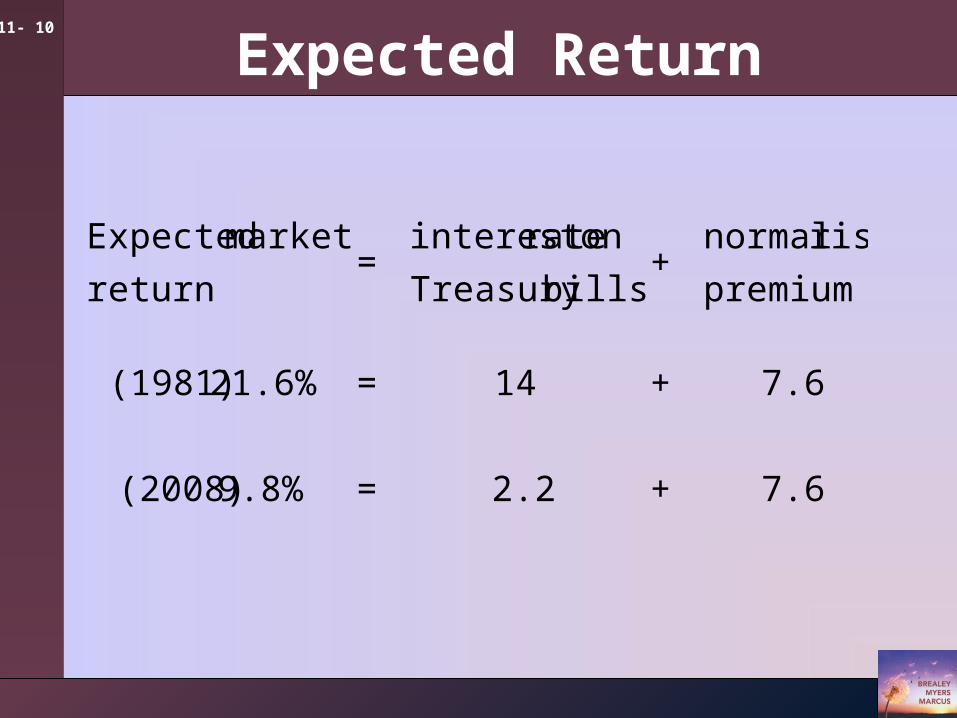
Expected Return
7.6+2.2=9.8% (2008)
7.6+14=21.6% (1981)
premium
risk normal+
billsTreasury
on rateinterest =
return
market Expected
11- 11
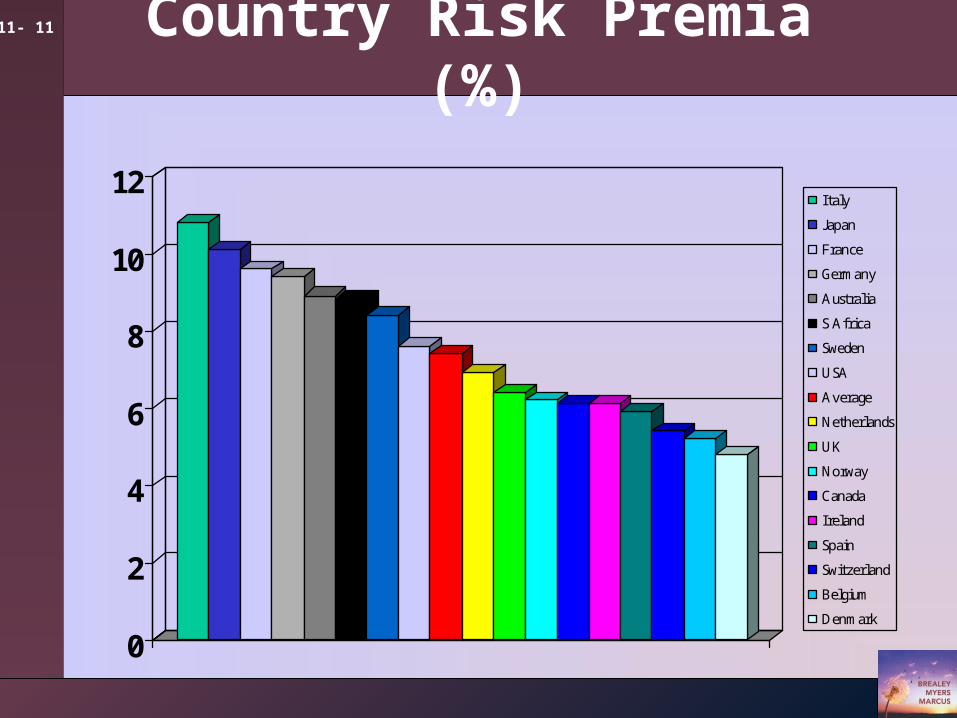
Country Risk Premia (%)
0
2
4
6
8
10
12Italy
Japan
France
Germany
Australia
S Africa
Sweden
USA
Average
Netherlands
UK
Norway
Canada
Ireland
Spain
Switzerland
Belgium
Denmark
11- 12
Measuring Risk
Variance - Average value of squared deviations from mean. A measure of volatility.
Standard Deviation - Average value of squared deviations from mean. A measure of volatility.

11- 13
Measuring Risk
Coin Toss Game-calculating variance and standard deviation
(1) (2) (3)
Percent Rate of Return Deviation from Mean Squared Deviation
+ 40 + 30 900
+ 10 0 0
+ 10 0 0
- 20 - 30 900
Variance = average of squared deviations = 1800 / 4 = 450
Standard deviation = square of root variance = 450 = 21.2%
11- 14
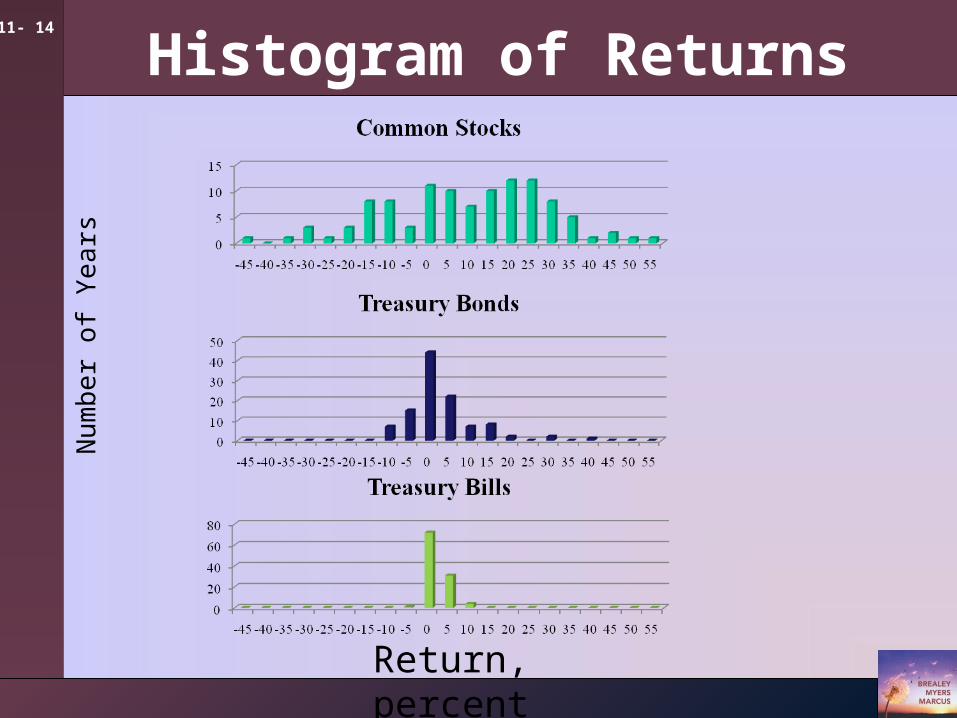
Histogram of Returns
Return, percent
Num
ber
of Y
ears
11- 15
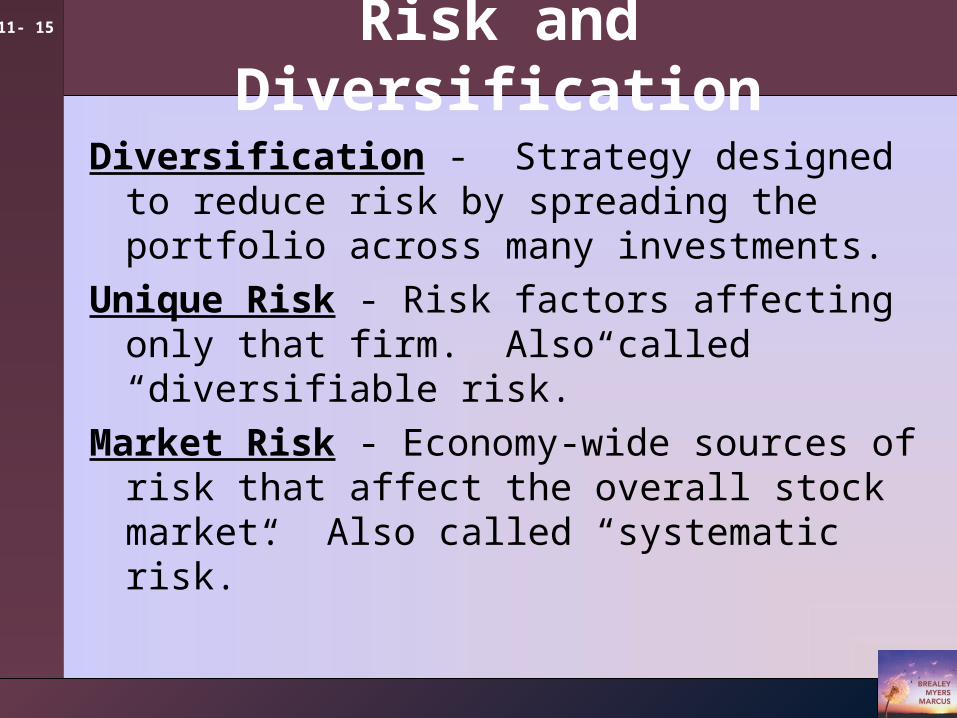
Risk and Diversification
Diversification - Strategy designed to reduce risk by spreading the portfolio across many investments.
Unique Risk - Risk factors affecting only that firm. Also called “diversifiable risk.”
Market Risk - Economy-wide sources of risk that affect the overall stock market. Also called “systematic risk.”
11- 16
Risk and Diversification
Deviations from SquaredYear Rate of Return, % Average Return, % Deviations
2002 -20.9 -29.4 864.362003 31.6 23.1 533.612004 12.5 4.0 16.002005 6.4 -2.1 4.412006 15.8 7.3 53.292007 5.6 -2.9 8.41
Total 51.0 1,480.08
Average return = 51.0/6 = 8.50%246.6815.71%
Variance = average of squared deviations = 1,480.08/6 = Standard deviation = square root of variance =
11- 17
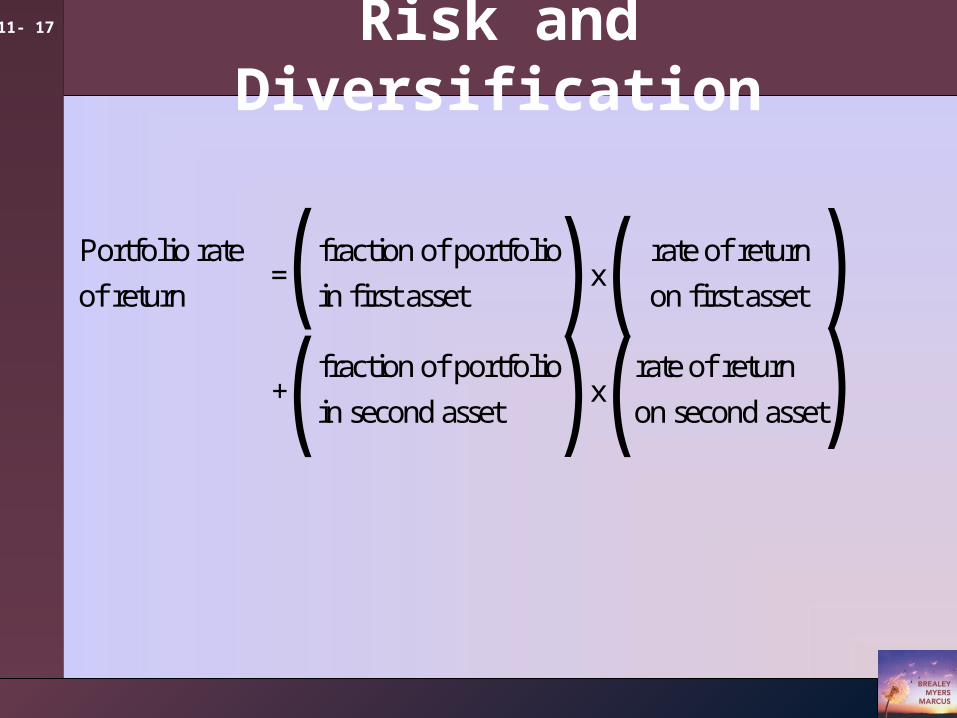
Risk and Diversification
Portfolio rate
of return=
fraction of portfolio
in first assetx
rate of return
on first asset
+fraction of portfolio
in second assetx
rate of return
on second asset
((
((
))
))

11- 18
Stock Market Volatility 1900-2007
0
10
20
30
40
50
60
1900
1905
1910
1915
1920
1925
1930
1935
1940
1945
1950
1955
1960
1965
1970
1975
1980
1985
1990
1995
2000
2005
Std
Dev
2007
11- 19
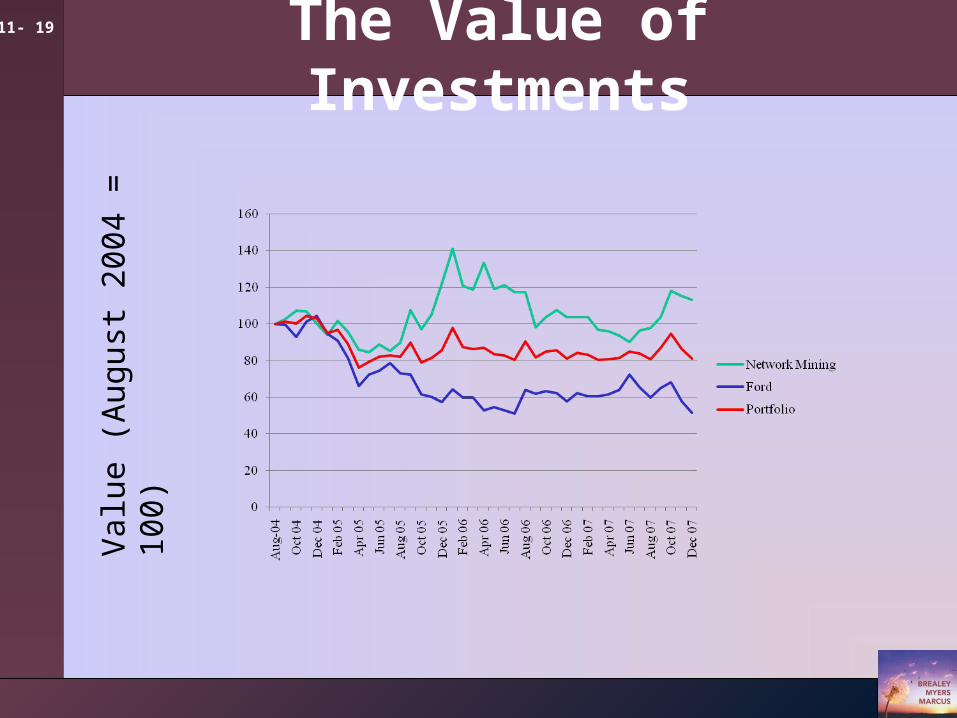
The Value of InvestmentsV
alue
(A
ugus
t 200
4 =
100
)
11- 20
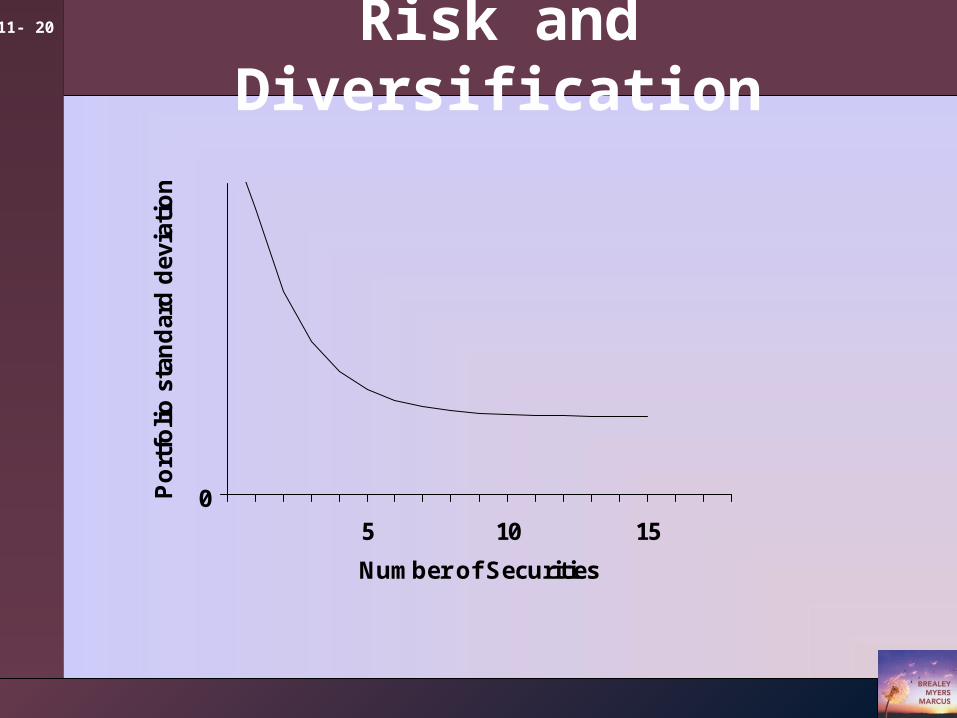
Risk and Diversification
05 10 15
Number of Securities
Po
rtfo
lio
sta
nd
ard
dev
iati
on
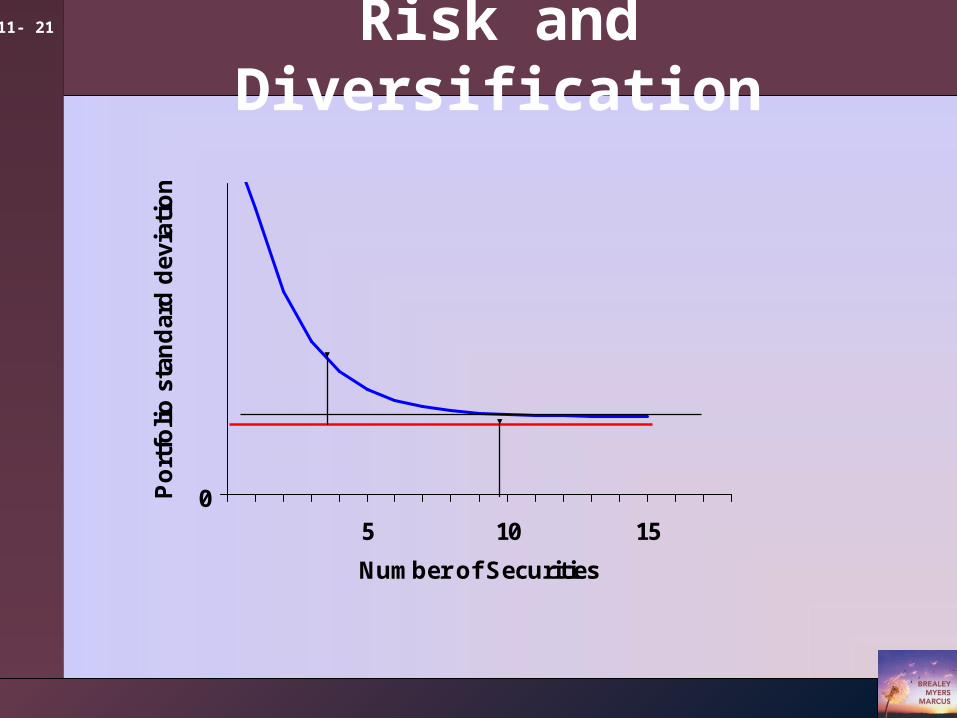
11- 21
05 10 15
Number of Securities
Po
rtfo
lio
sta
nd
ard
dev
iati
on
Market risk
Uniquerisk
Risk and Diversification
11- 22
Thinking About Risk
Message 1 Some Risks Look Big and Dangerous but Really Are
Diversifiable
Message 2 Market Risks Are Macro Risks
Message 3 Risk Can Be Measured

11- 23
Web Resources