11 october 2012 - data.daff.gov.audata.daff.gov.au/.../acwaur9aae_00311a20121011.docx · web...
TRANSCRIPT
11 October 2012The full report is available from www.daff.gov.au/abares
Summary of key issues A cold front has brought wintry conditions to much of south-eastern Australia with severe
frosts reported in some areas. The likelihood of an El Niño event has reduced. Most El Niño-Southern Oscillation (ENSO)
indicators are neutral. Reduced grain yields are expected this harvest due to frost and dry conditions during much
of the growing season. Water storage levels in the Murray–Darling Basin decreased by 85 gigalitres this week and
are at 97 per cent of total capacity. The world wheat indicator price (US No. 2 hard red winter, free on board Gulf ports)
averaged US$369 a tonne in the week ending 9 October 2012, compared with US$376 a tonne in the previous week.
The world coarse grains indicator price (US No. 2 yellow corn, free on board Gulf ports) averaged US$320 a tonne in the week ending 10 October 2012, similar to the previous week.
The world canola indicator price (Rapeseed, Europe, free on board Hamburg) averaged US$631 a tonne in the week ending 9 October 2012, similar to the previous week.
For the week ending 7 October 2012, around 58 per cent of the US soybean crop has been harvested, with around 37 per cent of the crop rated as good/excellent, compared with 56 per cent at the same time last year according to the United States Department of Agriculture.
The wholesale prices of fruit were generally higher and wholesale prices of vegetables were generally lower in the week ending 6 October 2012, compared with the previous week.
For more information or to subscribe, email [email protected]
1. Climate
1.1. Notable events
The likelihood of an El Niño event has reduced. The tropical Pacific Ocean temperatures, while still warmer than average, have continued to cool over the past fortnight and remain within the neutral range. Neutral conditions persist in the atmosphere.
A cold front has brought wintry conditions to much of south-eastern Australia. Severe frosts have struck parts of South Australia with late season snow reported around Mount Lofty, Sevenhill, Hallett and Mount Remarkable. Some South Australian growers are cutting down frost-affected crops for hay.
Heavy rain and thunderstorms are predicted for Queensland and north-eastern New South Wales today, with the possibility of hail. This rain may be of marginal benefit to late-maturing crops.
Central and northern Australia have experienced early hot weather with some locations recording the warmest October temperatures in 10 to 15 years.
The wheat harvest is beginning in Queensland. Yields may vary as many early crops were affected by frost and dry conditions.
1.2. Rainfall this weekFor the week ending 10 October 2012, moderate rain fell over Tasmania, Victoria and southern New South Wales. Light rain fell over the Far North and parts of South Australia and Western Australia. The highest measured rainfall total for the week was 75 millimetres at Topaz, near Innisfail in Queensland. For further information, go to www.bom.gov.au/climate/current/weeklyrain.shtml.
Rainfall for the week ending 10 October 2012
©Commonwealth of Australia 2012, Australia Bureau of Meteorology Issued: 11/10/2012

1.3. Temperature anomalies this weekSpatial temperature analyses are based on historical weekly temperature data provided by the Bureau of Meteorology. These temperature anomaly maps show the departure of the maximum and minimum from the long-term average. Temperature anomalies are calculated using high resolution gridded datasets from 1911 onwards. For further information on temperature anomalies, go to www.bom.gov.au/jsp/awap/.
Maximum temperature anomalies for the week ending 9 October 2012
©Commonwealth of Australia 2012, Australia Bureau of Meteorology Issued: 10/10/2012
Minimum temperature anomalies for the week ending 9 October 2012
©Commonwealth of Australia 2012, Australia Bureau of Meteorology Issued: 10/10/2012

1.4. Rainfall outlookThe rainfall forecast below is produced from computer models. As it contains no input from weather forecasters, it is important to also check local forecasts and warnings by the Bureau of Meteorology.
Total forecast rainfall for the period 11 to 18 October 2012
©Commonwealth of Australia 2012, Australia Bureau of Meteorology Issued: 10/10/2012

2. Water
2.1. Water availabilityWater storage levels in the Murray–Darling Basin (MDB) decreased this week by 85 gigalitres (GL) and are at 97 per cent of total capacity. This is 9 percentage points, or 2036 GL, more than this time last year.
2.2. Water storages
Water storages in the Murray–Darling Basin (NSW, Victoria and Queensland)
Information on irrigation water available in the Murray–Darling Basin from 1 January 2001 to 11 October 2012 is shown above. The top horizontal (red) line indicates the storage level at the similar time last year. The bottom horizontal (orange) line indicates the amount of ‘dead’, or unusable, storage.

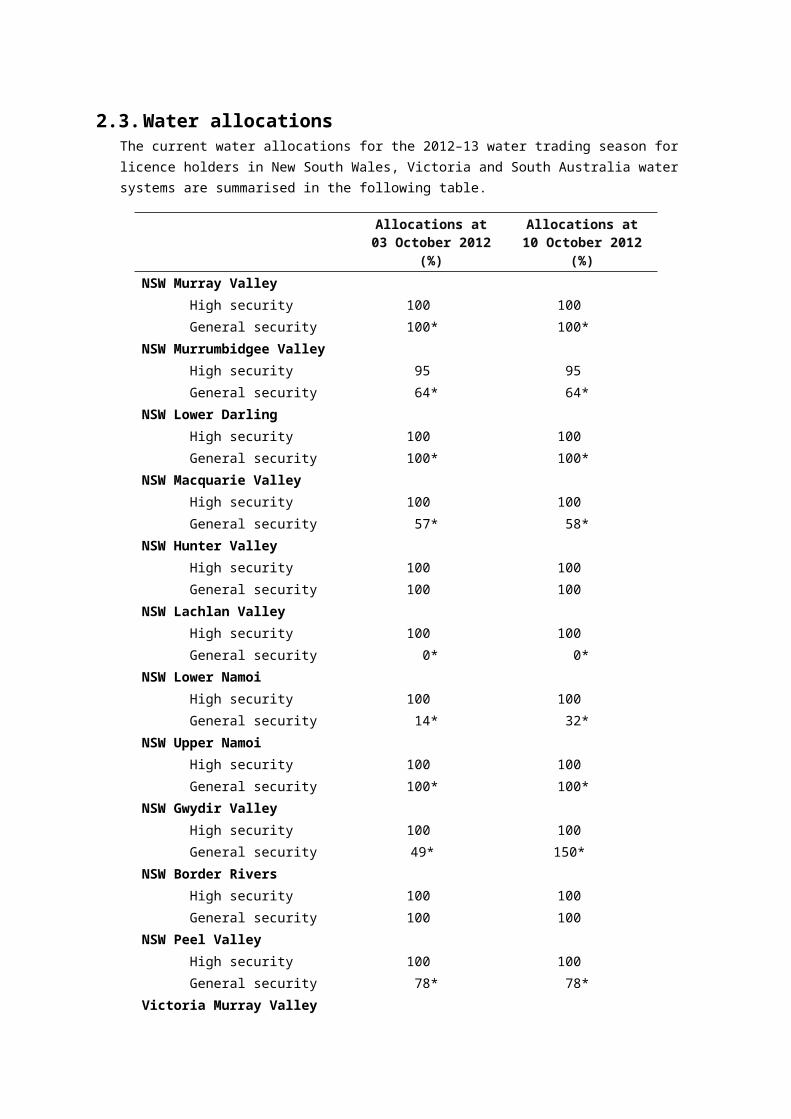
2.3. Water allocationsThe current water allocations for the 2012–13 water trading season for licence holders in New South Wales, Victoria and South Australia water systems are summarised in the following table.
Allocations at 03 October 2012 (%)
Allocations at 10 October 2012 (%)
NSW Murray ValleyHigh security 100 100General security 100* 100*
NSW Murrumbidgee ValleyHigh security 95 95General security 64* 64*
NSW Lower DarlingHigh security 100 100General security 100* 100*
NSW Macquarie ValleyHigh security 100 100General security 57* 58*
NSW Hunter ValleyHigh security 100 100General security 100 100
NSW Lachlan ValleyHigh security 100 100General security 0* 0*
NSW Lower NamoiHigh security 100 100General security 14* 32*
NSW Upper NamoiHigh security 100 100General security 100* 100*
NSW Gwydir ValleyHigh security 100 100General security 49* 150*
NSW Border RiversHigh security 100 100General security 100 100
NSW Peel ValleyHigh security 100 100General security 78* 78*
Victoria Murray ValleyHigh reliability 81 81Low reliability 0 0
Victoria GoulburnHigh reliability 100 100Low reliability 0 0

Allocations at 03 October 2012 (%)
Allocations at 10 October 2012 (%)
Victoria CampaspeHigh reliability 100 100Low reliability 67 67
Victoria LoddonHigh reliability 100 100Low reliability 0 0
Victoria BullarookHigh reliability 100 100Low reliability 100 100
Victoria BrokenHigh reliability 47 47Low Reliability 0 0
South Australia Murray ValleyHigh security 100 100
*Carryover water may also be available.
3. Commodities
3.1. Production and commodities The world wheat indicator price (US No. 2 hard red winter, free on board Gulf ports) averaged US$369 a
tonne in the week ending 9 October 2012, compared with US$376 a tonne in the previous week. The world coarse grains indicator price (US No. 2 yellow corn, free on board Gulf ports) averaged US$320 a
tonne in the week ending 10 Oct 2012, similar to the previous week. The world canola indicator price (Rapeseed, Europe, free on board Hamburg) averaged US$631 a tonne in
the week ending 9 October 2012, similar to last week’s price of US$625 a tonne, but 6 per cent higher than the same time last year when the price was US$594 a tonne.
For the week ending 7 October 2012, around 58 per cent of the US soybean crop has been harvested, with around 37 per cent of the crop rated as good/excellent, compared with 56 per cent at the same time last year according to the United States Department of Agriculture. The US corn harvest is around 69 per cent complete, the US sorghum harvest is around 39 per cent complete and the US cotton harvest is around 21 per cent complete.
The Australian canola indicator price (Portland, Victoria) averaged $501 a tonne in the week ending 8 October 2012, compared with $520 a tonne in the previous week.
The world cotton indicator price (the Cotlook ‘A’ index) averaged US81.1 cents a pound in the week ending 10 October 2012, similar to the previous week.
The world sugar indicator price (Intercontinental Exchange, nearby futures, No. 11 contract) averaged US21.5 cents a pound in the week ending 10 October 2012, 3 per cent higher than in the previous week.
Fruit wholesale prices were generally higher in the week ending 6 October 2012, compared with the previous week, with the prices of pineapple (smoothleaf), watermelon (seedless), rockmelon and strawberry all rising. However, the wholesale price of banana (cavendish) was lower than the previous week.
Vegetable wholesale prices were generally lower in the week ending 6 October 2012, compared with the previous week, with the prices of cauliflower, green peas, tomato (field, gourmet), and broccoli all falling. However, the wholesale price of iceberg lettuce was higher than the previous week.
The Queensland young cattle indicator price (330-400 kg live weight C3) rose by 2 per cent to 363 cents a kilogram in the week ending 5 October 2012.
There were mixed movements in the saleyard prices of lamb in the week ending 5 October 2012. The lamb indicator price rose by 2 per cent in both South Australia and Western Australia, and declined in Victoria (4 per cent) and New South Wales (3 per cent). The total number of lambs offered for sale was 8 per cent lower compared with the previous week.
The Australian Eastern Market Indicator price for wool rose by 2 per cent in the week ending 4 October 2012 to 956 cents a kilogram clean. The total number of bales offered at sale rose by 24 per cent, compared with the previous week.

3.2. Recent movements in fruit and vegetable pricesWeekly wholesale prices for selected fruit, Melbourne market
Weekly wholesale prices for selected vegetables, Melbourne market

3.3. Selected world indicator prices

3.4. Crop indicator prices

3.5. Livestock indicator prices

4. Data attributionClimateBureau of Meteorology Weekly rainfall totals: www.bom.gov.au/jsp/awap/rain/index.jsp Monthly and last 3-months rainfall percentiles: www.bom.gov.au/jsp/awap/ Temperature anomalies: www.bom.gov.au/jsp/awap/ Rainfall forecast: www.bom.gov.au/jsp/watl/rainfall/pme.jsp Seasonal outlook: www.bom.gov.au/climate/ahead Drought statement: www.bom.gov.au/climate/drought/drought.shtml ENSO Wrap-Up: www.bom.gov.au/climate/enso/ Soil moisture (BoM, CSIRO and the former Bureau of Rural Sciences): www.eoc.csiro.au/ awap /
WaterNew South Wales New South Wales Water Information: http://waterinfo.nsw.gov.au/
New South Wales Office of Water, Department of Environment, Climate Change and Water: www.water.nsw.gov.au/Home/default.aspx
Available water determinations register: www.wix.nsw.gov.au/wma/DeterminationSearch.jsp?selectedRegister=Determination
Snowy Hydro: www.snowyhydro.com.au/lakeLevels.asp?pageID=47&parentID=61&grandParentID=4Queensland Sunwater: www.sunwater.com.au seqwater: http://seqwater.com.auSouth Australia SA Water: www.sawater.com.au/SAWater/Environment/TheRiverMurray/River+Murray+Levels.htm
South Australian Department of Water: www.waterforgood.sa.gov.au/
Victoria Goulburn–Murray Water: www.g-mwater.com.auWater trading
Waterexchange: www.waterexchange.com.au
CommoditiesFruit and vegetables
Datafresh: www.datafresh.com.auMutton, lambs, wheat, barley and grain sorghum
The Land: hardcopy or online at http://theland.farmonline.com.au/markets.aspxCattle, mutton, lambs and pigs
Meat and Livestock Australia: www.mla.com.au/Prices-and-marketsCanola
Weekly Times: hardcopy