111 south wacker prospectus
DESCRIPTION
This is my final project for Structuring Real Estate Finance Deals. Our task was to "Assume that your group is a real estate investment firm looking for a sizeable local or regional commercial or residential real estate deal. After identifying a suitable object, you will produce an investors' prospectus whichwill serve as the basis for your client's fund raising activities." I completed the project with John Drain, M.U.P. and Dustin Sommer, M.Arch.TRANSCRIPT
Midwest Diversified REITProposal for:
111 South Wacker Dr Chicago, IL 60606
UP 566 Structuring Real Estate Financial Deals
Dr. David Bieri
December 17, 2010
Submitted by:
Chris CannaJohn Drain
Dustin Sommer
Photo Credit: Wayne Lorentze
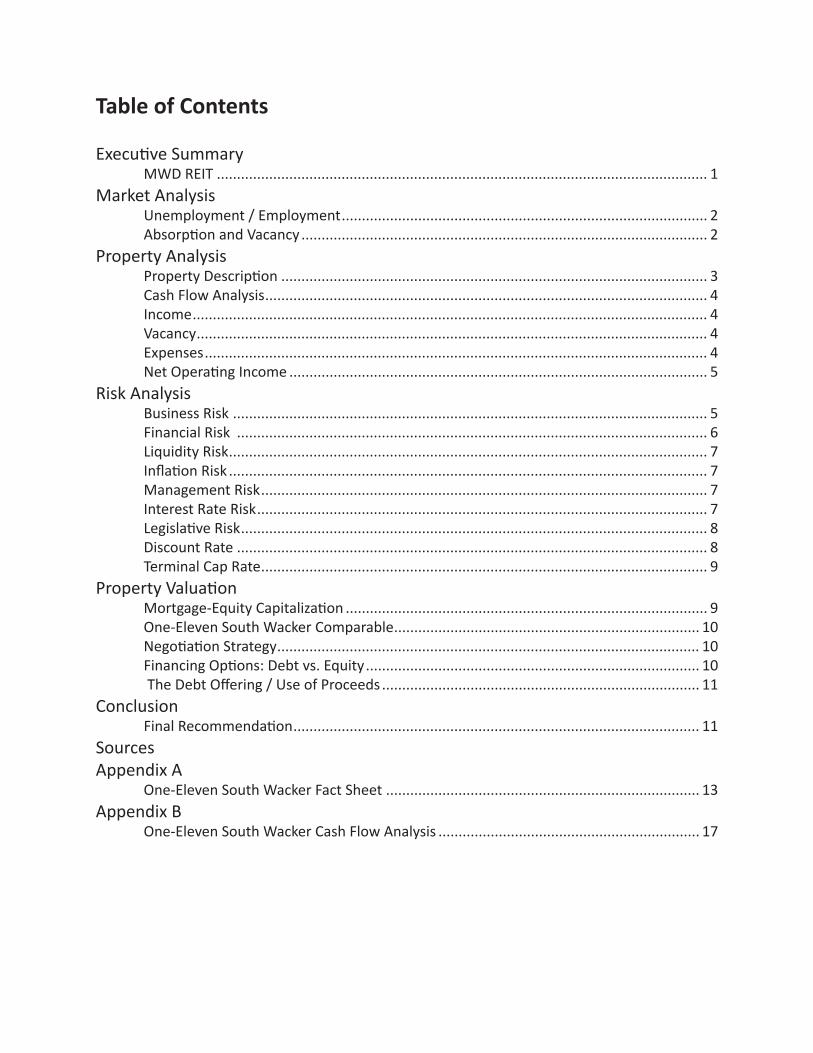
Table of Contents
Executive Summary MWD REIT .......................................................................................................................... 1
Market AnalysisUnemployment / Employment ........................................................................................... 2Absorption and Vacancy ..................................................................................................... 2
Property AnalysisProperty Description .......................................................................................................... 3Cash Flow Analysis .............................................................................................................. 4Income ................................................................................................................................ 4Vacancy ............................................................................................................................... 4Expenses ............................................................................................................................. 4Net Operating Income ........................................................................................................ 5
Risk AnalysisBusiness Risk ...................................................................................................................... 5Financial Risk ..................................................................................................................... 6Liquidity Risk ....................................................................................................................... 7Inflation Risk ....................................................................................................................... 7Management Risk ............................................................................................................... 7Interest Rate Risk ................................................................................................................ 7Legislative Risk .................................................................................................................... 8Discount Rate ..................................................................................................................... 8Terminal Cap Rate ............................................................................................................... 9
Property ValuationMortgage-Equity Capitalization .......................................................................................... 9One-Eleven South Wacker Comparable ............................................................................ 10Negotiation Strategy ......................................................................................................... 10Financing Options: Debt vs. Equity ................................................................................... 10 The Debt Offering / Use of Proceeds ............................................................................... 11
ConclusionFinal Recommendation ..................................................................................................... 11
SourcesAppendix A
One-Eleven South Wacker Fact Sheet .............................................................................. 13Appendix B
One-Eleven South Wacker Cash Flow Analysis ................................................................. 17
1
Executive Summary
One-Eleven South Wacker is an excellent investment opportunity for Midwest Diversified REIT. The property, built in 2005, is located in Chicago’s West Loop neighborhood, and has many amenities and features attractive to tenants, including an in-building parking garage, conference center, open floor plate, and LEED Gold Certification. As a result of these features, the property has experienced minimal vacancy, no higher than .6%, even through the recent economic crisis, which has set record highs for vacancy in the Chicago Central Business District.
Given One-Eleven South Wacker’s relatively low risk profile, we believe it would be a valuable addition to MWD REIT’s portfolio, and have valued the property at $512,650,000 or $499 / RSF. This price is based on our own cash flow projections, and a competitive 7.5% annual yield on equity invested in the property.
MWD REITWe are a private, self-administered equity Real Estate Investment Trust (REIT). Our business consists of owning and operating income- producing properties in the greater Chicago region. Accordingly, our principal objective is to invest in high quality and diverse properties in prime locations, then proactively manage, lease and develop ongoing capital improvement programs to enhance their long-term economic performance. We have elected to be taxed as a REIT under the Internal Revenue Code. The benefit of that tax treatment is that it avoids the “double taxation,” or taxation at both the corporate and shareholder levels, that generally results from owning shares in a corporation. For MWD to
qualify as a REIT under the Internal Revenue Code, not more than 50% in value of MWD’s outstanding shares may be owned by five or fewer individuals, and the shares must be owned by 100 or more individual investors. Furthermore, because we are backed with beneficial and transferable common shares registered with a stock exchange, a greater level of transparency is required of us than of a privately held, consolidated real estate trust. These requirements further reinforce our duty to not engage in highly leveraged and speculative transactions, and to look for income-producing and growth opportunities.
Additionally, to qualify as a REIT we must adhere to various organizational requirements, gross income tests, asset tests, and annual dividend requirements. The proposed acquisition of One-Eleven South Wacker described here satisfies the various income and asset tests. Regarding the annual dividend, we are required to distribute dividends to our shareholders in excess of 90% of our “REIT taxable income,” or else pay tax on those amounts at ordinary capital gains corporate tax rates.
As trustees of the REIT, we are interested in acquiring stable income-producing properties such as One-Eleven South Wacker for the purposes of maintaining quarterly dividends at established REIT norms, which we benchmark at 5% annually, based on industry norms. This is greater than the dividends paid to the common shareholders of companies in most other sectors.
Under our estimated valuation, One-Eleven South Wacker will produce an annual yield of 7.5%, an amount that exceeds the quarterly dividends we aspire to distribute. Given the
2
property’s growth potential as an asset, we believe this acquisition represents a good value to our long-term shareholders.
Market Analysis
Unemployment / EmploymentThe national unemployment rate for October 2010 was 9.6% with the Chicago Metropolitan Statistical Area at 9%, down from 10.3% in October 2009, and down from a high of 11.7% in January 2010 (BLS). Total non-farm employment in the Chicago MSA was down 1.5% in October 2010 compared to October 2009, while key office sectors, financial activities and professional services, were down .8% and 1.9% respectively (BLS).
These figures paint a mixed picture for office properties in the Chicago CBD, because demand for office space lags office employment growth, which in turn lags wider economic growth. Therefore, demand for office space will not return to full strength until office employment picks up. Declining unemployment suggests, however, that the broader economy is slowly improving, which should translate into greater demand for office space in the near future.
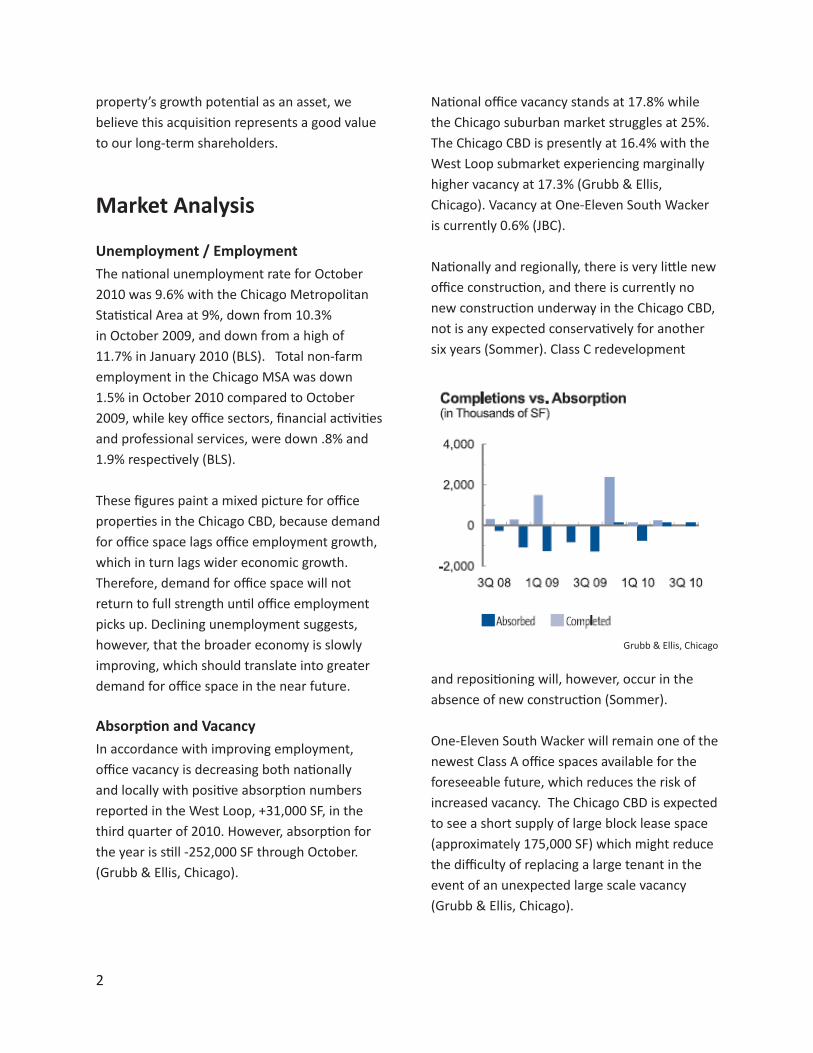
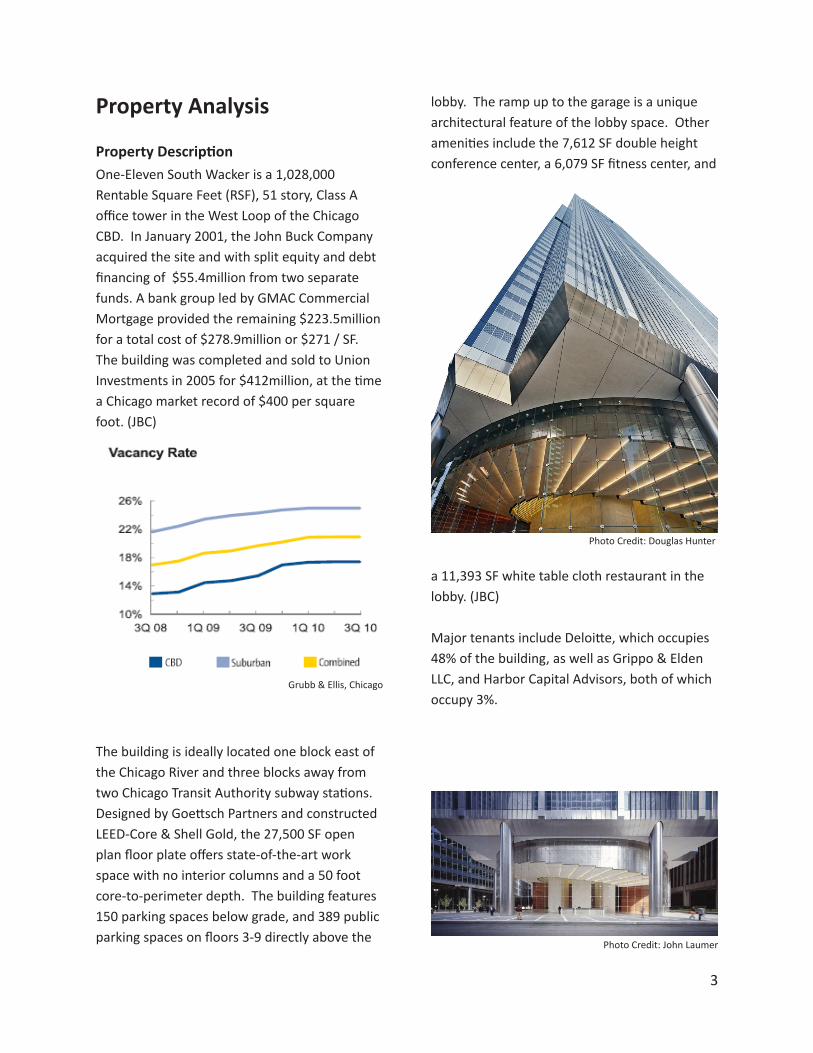
Absorption and VacancyIn accordance with improving employment, office vacancy is decreasing both nationally and locally with positive absorption numbers reported in the West Loop, +31,000 SF, in the third quarter of 2010. However, absorption for the year is still -252,000 SF through October. (Grubb & Ellis, Chicago).
National office vacancy stands at 17.8% while the Chicago suburban market struggles at 25%. The Chicago CBD is presently at 16.4% with the West Loop submarket experiencing marginally higher vacancy at 17.3% (Grubb & Ellis, Chicago). Vacancy at One-Eleven South Wacker is currently 0.6% (JBC). Nationally and regionally, there is very little new office construction, and there is currently no new construction underway in the Chicago CBD, not is any expected conservatively for another six years (Sommer). Class C redevelopment
and repositioning will, however, occur in the absence of new construction (Sommer).
One-Eleven South Wacker will remain one of the newest Class A office spaces available for the foreseeable future, which reduces the risk of increased vacancy. The Chicago CBD is expected to see a short supply of large block lease space (approximately 175,000 SF) which might reduce the difficulty of replacing a large tenant in the event of an unexpected large scale vacancy (Grubb & Ellis, Chicago).
Grubb & Ellis, Chicago
3
Property Analysis
Property DescriptionOne-Eleven South Wacker is a 1,028,000 Rentable Square Feet (RSF), 51 story, Class A office tower in the West Loop of the Chicago CBD. In January 2001, the John Buck Company acquired the site and with split equity and debt financing of $55.4million from two separate funds. A bank group led by GMAC Commercial Mortgage provided the remaining $223.5million for a total cost of $278.9million or $271 / SF. The building was completed and sold to Union Investments in 2005 for $412million, at the time a Chicago market record of $400 per square foot. (JBC)
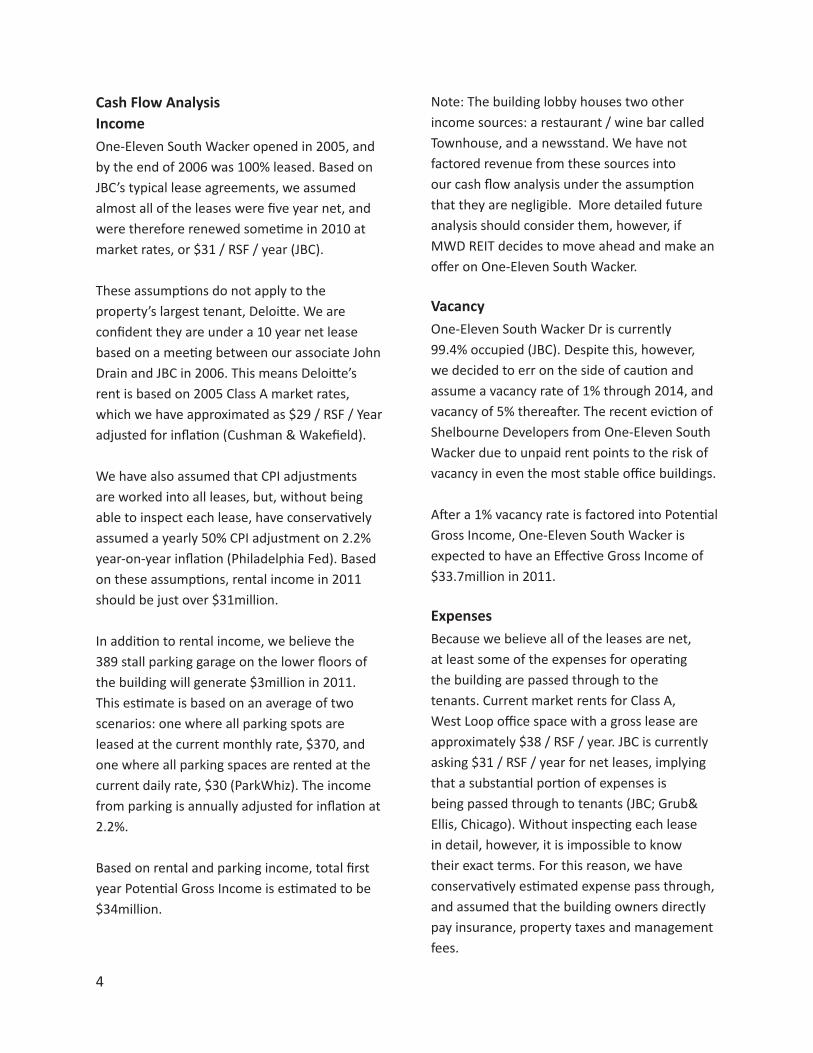
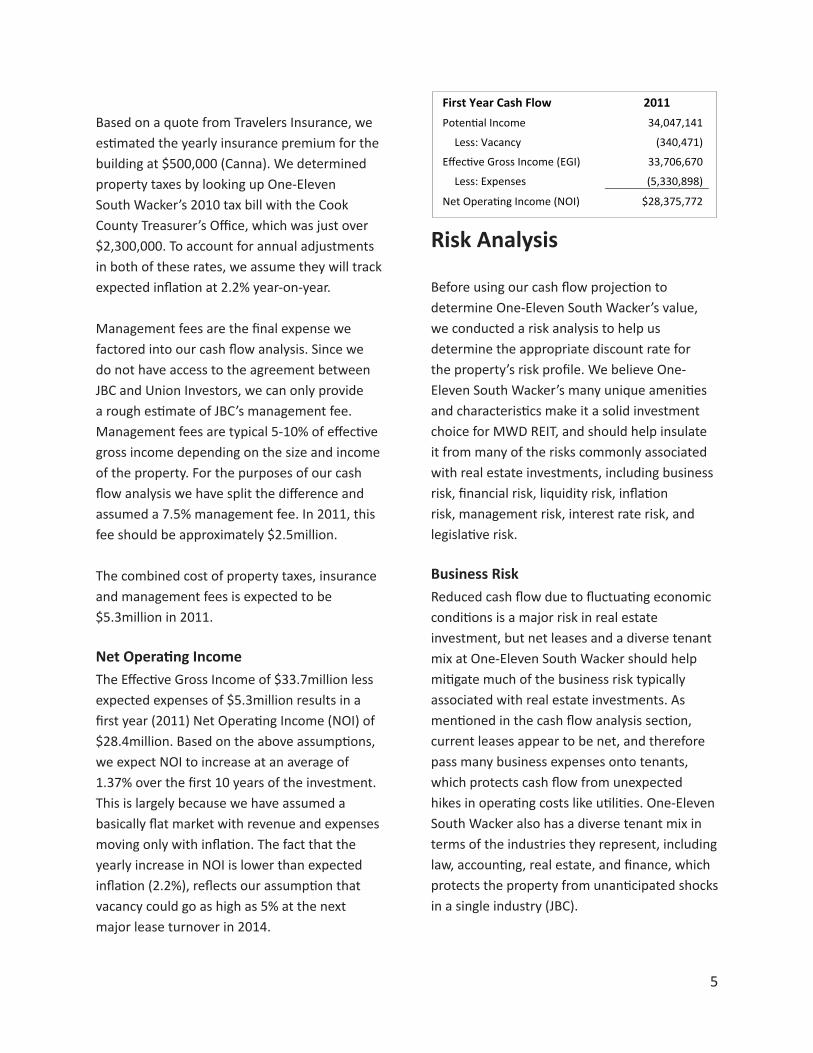
The building is ideally located one block east of the Chicago River and three blocks away from two Chicago Transit Authority subway stations. Designed by Goettsch Partners and constructed LEED-Core & Shell Gold, the 27,500 SF open plan floor plate offers state-of-the-art work space with no interior columns and a 50 foot core-to-perimeter depth. The building features 150 parking spaces below grade, and 389 public parking spaces on floors 3-9 directly above the
lobby. The ramp up to the garage is a unique architectural feature of the lobby space. Other amenities include the 7,612 SF double height conference center, a 6,079 SF fitness center, and
a 11,393 SF white table cloth restaurant in the lobby. (JBC)
Major tenants include Deloitte, which occupies 48% of the building, as well as Grippo & Elden LLC, and Harbor Capital Advisors, both of which occupy 3%.
Photo Credit: Douglas Hunter
Grubb & Ellis, Chicago
Photo Credit: John Laumer
4
Cash Flow AnalysisIncomeOne-Eleven South Wacker opened in 2005, and by the end of 2006 was 100% leased. Based on JBC’s typical lease agreements, we assumed almost all of the leases were five year net, and were therefore renewed sometime in 2010 at market rates, or $31 / RSF / year (JBC).
These assumptions do not apply to the property’s largest tenant, Deloitte. We are confident they are under a 10 year net lease based on a meeting between our associate John Drain and JBC in 2006. This means Deloitte’s rent is based on 2005 Class A market rates, which we have approximated as $29 / RSF / Year adjusted for inflation (Cushman & Wakefield).
We have also assumed that CPI adjustments are worked into all leases, but, without being able to inspect each lease, have conservatively assumed a yearly 50% CPI adjustment on 2.2% year-on-year inflation (Philadelphia Fed). Based on these assumptions, rental income in 2011 should be just over $31million.
In addition to rental income, we believe the 389 stall parking garage on the lower floors of the building will generate $3million in 2011. This estimate is based on an average of two scenarios: one where all parking spots are leased at the current monthly rate, $370, and one where all parking spaces are rented at the current daily rate, $30 (ParkWhiz). The income from parking is annually adjusted for inflation at 2.2%.
Based on rental and parking income, total first year Potential Gross Income is estimated to be $34million.
Note: The building lobby houses two other income sources: a restaurant / wine bar called Townhouse, and a newsstand. We have not factored revenue from these sources into our cash flow analysis under the assumption that they are negligible. More detailed future analysis should consider them, however, if MWD REIT decides to move ahead and make an offer on One-Eleven South Wacker.
VacancyOne-Eleven South Wacker Dr is currently 99.4% occupied (JBC). Despite this, however, we decided to err on the side of caution and assume a vacancy rate of 1% through 2014, and vacancy of 5% thereafter. The recent eviction of Shelbourne Developers from One-Eleven South Wacker due to unpaid rent points to the risk of vacancy in even the most stable office buildings.
After a 1% vacancy rate is factored into Potential Gross Income, One-Eleven South Wacker is expected to have an Effective Gross Income of $33.7million in 2011.
ExpensesBecause we believe all of the leases are net, at least some of the expenses for operating the building are passed through to the tenants. Current market rents for Class A, West Loop office space with a gross lease are approximately $38 / RSF / year. JBC is currently asking $31 / RSF / year for net leases, implying that a substantial portion of expenses is being passed through to tenants (JBC; Grub& Ellis, Chicago). Without inspecting each lease in detail, however, it is impossible to know their exact terms. For this reason, we have conservatively estimated expense pass through, and assumed that the building owners directly pay insurance, property taxes and management fees.
5
Based on a quote from Travelers Insurance, we estimated the yearly insurance premium for the building at $500,000 (Canna). We determined property taxes by looking up One-Eleven South Wacker’s 2010 tax bill with the Cook County Treasurer’s Office, which was just over $2,300,000. To account for annual adjustments in both of these rates, we assume they will track expected inflation at 2.2% year-on-year. Management fees are the final expense we factored into our cash flow analysis. Since we do not have access to the agreement between JBC and Union Investors, we can only provide a rough estimate of JBC’s management fee. Management fees are typical 5-10% of effective gross income depending on the size and income of the property. For the purposes of our cash flow analysis we have split the difference and assumed a 7.5% management fee. In 2011, this fee should be approximately $2.5million.
The combined cost of property taxes, insurance and management fees is expected to be $5.3million in 2011.
Net Operating IncomeThe Effective Gross Income of $33.7million less expected expenses of $5.3million results in a first year (2011) Net Operating Income (NOI) of $28.4million. Based on the above assumptions, we expect NOI to increase at an average of 1.37% over the first 10 years of the investment. This is largely because we have assumed a basically flat market with revenue and expenses moving only with inflation. The fact that the yearly increase in NOI is lower than expected inflation (2.2%), reflects our assumption that vacancy could go as high as 5% at the next major lease turnover in 2014.
Risk Analysis
Before using our cash flow projection to determine One-Eleven South Wacker’s value, we conducted a risk analysis to help us determine the appropriate discount rate for the property’s risk profile. We believe One-Eleven South Wacker’s many unique amenities and characteristics make it a solid investment choice for MWD REIT, and should help insulate it from many of the risks commonly associated with real estate investments, including business risk, financial risk, liquidity risk, inflation risk, management risk, interest rate risk, and legislative risk.
Business Risk Reduced cash flow due to fluctuating economic conditions is a major risk in real estate investment, but net leases and a diverse tenant mix at One-Eleven South Wacker should help mitigate much of the business risk typically associated with real estate investments. As mentioned in the cash flow analysis section, current leases appear to be net, and therefore pass many business expenses onto tenants, which protects cash flow from unexpected hikes in operating costs like utilities. One-Eleven South Wacker also has a diverse tenant mix in terms of the industries they represent, including law, accounting, real estate, and finance, which protects the property from unanticipated shocks in a single industry (JBC).
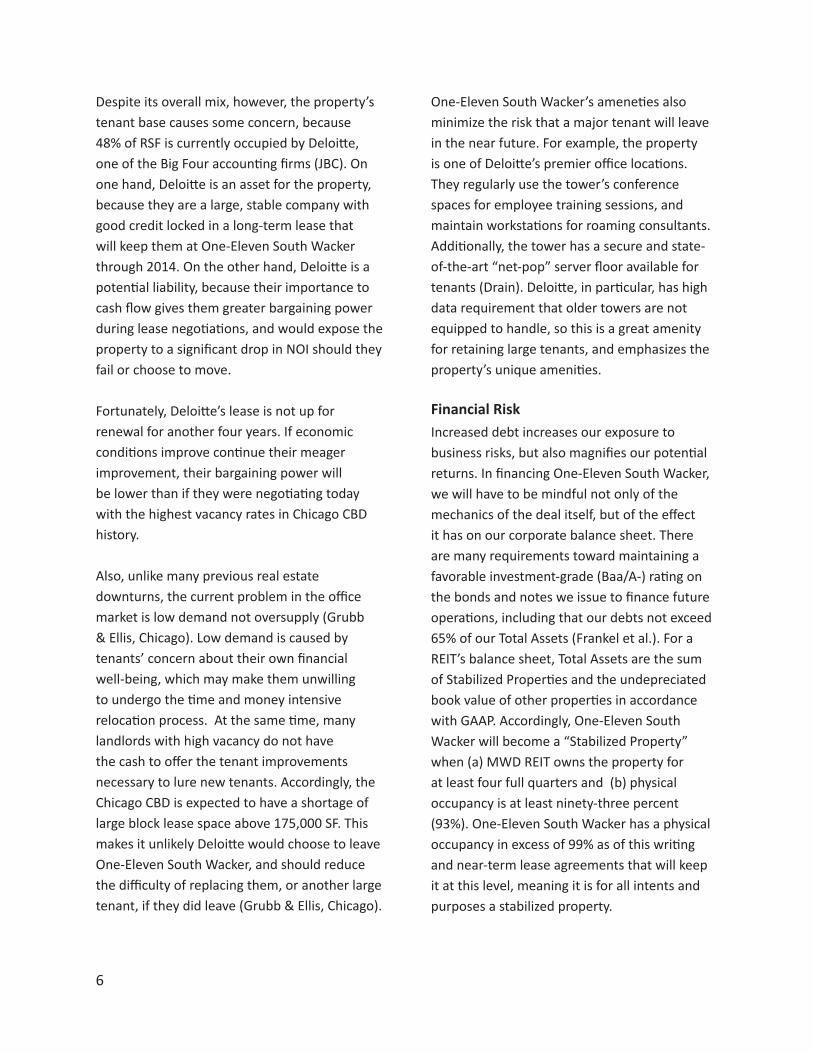
First Year Cash Flow 2011 Potential Income 34,047,141
Less: Vacancy (340,471)
Effective Gross Income (EGI) 33,706,670
Less: Expenses (5,330,898)
Net Operating Income (NOI) $28,375,772
6
Despite its overall mix, however, the property’s tenant base causes some concern, because 48% of RSF is currently occupied by Deloitte, one of the Big Four accounting firms (JBC). On one hand, Deloitte is an asset for the property, because they are a large, stable company with good credit locked in a long-term lease that will keep them at One-Eleven South Wacker through 2014. On the other hand, Deloitte is a potential liability, because their importance to cash flow gives them greater bargaining power during lease negotiations, and would expose the property to a significant drop in NOI should they fail or choose to move.
Fortunately, Deloitte’s lease is not up for renewal for another four years. If economic conditions improve continue their meager improvement, their bargaining power will be lower than if they were negotiating today with the highest vacancy rates in Chicago CBD history.
Also, unlike many previous real estate downturns, the current problem in the office market is low demand not oversupply (Grubb & Ellis, Chicago). Low demand is caused by tenants’ concern about their own financial well-being, which may make them unwilling to undergo the time and money intensive relocation process. At the same time, many landlords with high vacancy do not have the cash to offer the tenant improvements necessary to lure new tenants. Accordingly, the Chicago CBD is expected to have a shortage of large block lease space above 175,000 SF. This makes it unlikely Deloitte would choose to leave One-Eleven South Wacker, and should reduce the difficulty of replacing them, or another large tenant, if they did leave (Grubb & Ellis, Chicago).
One-Eleven South Wacker’s ameneties also minimize the risk that a major tenant will leave in the near future. For example, the property is one of Deloitte’s premier office locations. They regularly use the tower’s conference spaces for employee training sessions, and maintain workstations for roaming consultants. Additionally, the tower has a secure and state-of-the-art “net-pop” server floor available for tenants (Drain). Deloitte, in particular, has high data requirement that older towers are not equipped to handle, so this is a great amenity for retaining large tenants, and emphasizes the property’s unique amenities.
Financial Risk Increased debt increases our exposure to business risks, but also magnifies our potential returns. In financing One-Eleven South Wacker, we will have to be mindful not only of the mechanics of the deal itself, but of the effect it has on our corporate balance sheet. There are many requirements toward maintaining a favorable investment-grade (Baa/A-) rating on the bonds and notes we issue to finance future operations, including that our debts not exceed 65% of our Total Assets (Frankel et al.). For a REIT’s balance sheet, Total Assets are the sum of Stabilized Properties and the undepreciated book value of other properties in accordance with GAAP. Accordingly, One-Eleven South Wacker will become a “Stabilized Property” when (a) MWD REIT owns the property for at least four full quarters and (b) physical occupancy is at least ninety-three percent (93%). One-Eleven South Wacker has a physical occupancy in excess of 99% as of this writing and near-term lease agreements that will keep it at this level, meaning it is for all intents and purposes a stabilized property.
7
Guided by Moody’s REIT ratings methodology, the debt we incur must be less than 1.5 to 1 on a pro forma basis, and we must maintain a portfolio of Total Unencumbered Assets of not less than 150% of the outstanding principal amount of unsecured debts (encumbrance includes the amount of mortgages, outstanding notes, etc.). To continue to satisfy both the ratings agencies and the various test associated with REIT qualification, we propose financing One-Eleven South Wacker through a combination of debt and equity. (Frankel et al.) Liquidity RiskAs our ownership is in the form of exchange-traded common shares, and our debt underwriters make markets for our Notes, liquidity risk is not a high concern for this investment for either our investors or creditors. Our primary concern is that our own portfolio is both relatively liquid and well-hedged, and that this particular property matches or surpasses the growth and income-producing dimensions of our existing assets. Inflation RiskOver the next 10 years, most analysts expect inflation to remain low at around 2 – 2.5% (Philadelphia Fed). Even if inflation were at much higher levels, real estate has historically done well during periods of inflation, partly as a result of adjusting rental rates along with CPI, or another inflation benchmark. We believe the leases at One-Eleven South Wacker adjust to at least 50% of CPI, and, therefore, at least half of the risk of future inflation lies with the property’s tenants. We also factored the potential affects of inflation into the calculation of our discount rate, accounting for the lower risk associated with rent CPI adjustments.
Management RiskThe John Buck Company, the building’s developer and former owner, currently manages One-Eleven South Wacker. They have a well-respected property management division that has been operating in the Chicago area since 1983. Their portfolio consist of over 6 million square feet of real estate, including other Class A office spaces in the Loop as well as the landmark Rookery building (JBC). Their proven track record, and intimate connection with One-Eleven South Wacker offers good reason for keeping them as property managers and should minimize any risk associated with mismanagement and difficulty securing new tenants as space becomes available.
With regard to satisfying organizational requirements, if property management constituted more than 1% of our income from the property, the IRS would consider MWD a Taxable REIT Subsidiary (Section 856, IRS Code). This creates an incentive for us to hire an independent contractor, such as the John Buck Company’s property management division, to handle the day-to-day management of the property on a fee basis. Interest Rate RiskSince the 2008 economic melt down, U.S. monetary policy has been primarily aimed at keeping interest rates low through two unprecedented rounds of “Quantitative Easing.” As a result, it seems unlikely interest rates will increase dramatically in the near future. In fact, the primary risk associated with this strategy is that it could push inflation above otherwise expected levels. Even if interest rates rose unexpectedly in the longer term, the resulting decrease in property values is not an immediate concern for WMD
8
REIT given that we are more interested in receiving the property’s cash flow than any gains through sale.
The effect of increased interest rates on the attractiveness the entire WMD REIT portfolio is a greater concern, because, as interest rates rise, the yield demanded by investors will rise as well. However, the expected 7.5% annual yield generated by One-Eleven South Wacker is well above current interest rates, which again are likely to remain low for the foreseeable future.
Legislative RiskChanges to regulations, particularly at the local level, can drastically affect the value of real estate. Fortunately, the City of Chicago and Cook County are not currently contemplating any major changes to zoning, property taxes or other regulations in the Chicago CBD.
As an established building, current zoning regulations favor us by limiting high rise development outside of the Loop. This is particularly important in a city that has no natural barriers to development West of Lake Michigan. If at some point the City of Chicago relaxed zoning regulations outside the Loop, an increase in office space supply could potentially reduce rents within the Loop, but there is little threat of this happening at present.
The only minor cause for concern at the local level is that Richard Daly is retiring after 20 years as the city’s mayor. It is currently unclear who his replacement will be, but all indications are that his successor will have substantially similar land development policies.
National policies present the greatest potential risk as the federal government has become historically involved in the national economy
since the 2008 financial crisis. In the near term, federal policies are propping up the national economy and have resulted in modest job growth. Over the longer term increased deficits could dampen economic growth. Few experts can agree on the final outcome of policies like Quantitative Easing and fiscal stimulus, but our projections for One-Eleven South Wacker have assumed modest growth in rents, mostly tied to inflation, to reflect the currently weak economy. Discount RateBased on the limited amount of risk presented by One-Eleven South Wacker, we believe a 7.5% annual yield is an appropriate return for investing in the property. To determine this discount rate, we looked at above-average yields of other investment opportunities, including (E*Trade):
• 10 year Municipal Bonds, 5.68% • 10 year investment grade Corporate
Bonds, 6.5%• 10 year returns on Common Stock, 10.7%
Real estate investments are typically considered more risky than Corporate Bonds, but less risky than Common Stock (Brueggeman). Therefore, our discount rate should fall between 6.5% and 10.7%. This range is consistent with current discount rates for CBD office properties at the national level. According to the Korpacz National Market Indicators survey produced by Price Waterhouse Cooper, discount rates for CBD office properties ranged from 6.5%-12% with an average of 9.11% in the third quarter of this year.
Given the lower level of risk associated with One-Eleven South Wacker, a discount rate at the lower end of these ranges is appropriate.
9
As outlined above, the property has unique features and amenities that make it more attractive to tenants and investors than other Chicago CBD office buildings. Its very high occupancy rate through the recent economic crisis largely proves its appeal. This does not mean, however, that there is no risk associated with the property. In particular, an uncertain future economic environment, and Deloitte’s large share of the tenant base present real, but manageable risks. For these reason, we feel 7.5% is a competitive yield that accounts for One-Eleven South Wacker ’s low risk, but not risk free profile.
Terminal Cap RateIn order to project cash flows beyond 2020, we applied a 5.5% Terminal Cap Rate to our expected NOI in 2021 ($32.4million). This Terminal CAP Rate is based on our discount rate minus 2% expected NOI growth past 2020. We expect that year on year NOI increases will pick up again after 2020 as the economy hopefully enters a period of more robust growth. Historically, however, commercial properties in CBDs over the long term have only appreciated through inflation, and 2% is consistent with expected, long term inflation (Wheaton).
Applying this rate to expected NOI in 2021, results in a reversion value of $589million for One-Eleven South Wacker Dr. This is equivalent to the price we could expect if we sold the property in 2020, but given that MWD REIT intends to hold the property for 20 years or more, the reversion value serves as an approximation of all future cash flows past 2020.
Property Valuation
Based on our projected cash-flows and desired discount rate, we believe One-Eleven South Wacker has a current value of $512,650,000 or $499 / RSF.
Mortgage-Equity CapitalizationIn order to determine One-Eleven South Wacker ’s value, we used the mortgage-equity capitalization approach to valuation, and assumed MWD REIT would use a mix of debt and equity to purchase the property. This approach takes the requirements of both the mortgage lender and equity investor into consideration when determining a property’s value.
Financing for an income producing property is typically based on a first year Debt Coverage Ratio (DCR), which is typically 1.2 (Brueggemen, 316). When a 1.2 DCR is applied to our expected first year NOI, it results in a yearly mortgage payment of $23.6million. Assuming we take out a ten year mortgage at 4.95% interest, these yearly payments would result in a mortgage valued at $183million. Subtracting our yearly debt service from our expected NOI, results in a Before Tax Cash Flow (BTCF) of $4.7million in 2011.
By calculating the present value of the BTCF through 2020, including the $589million reversion value, at a 7.5% discount rate, we estimate that One-Eleven South Wacker is currently worth $512,650,000 or $499 / RSF.
Note: To determine our mortgage rate, we canvassed all 10-year maturity offerings for other REITs issued in the last 6 months. Using Moody’s rating methodology, we anticipate
10
a Baa rating on any notes we issue, provided we structure this acquisition to not impair our corporate debt to asset ratio (E*Trade; Frankel et al.). Our underwriters have advised us that higher yield notes (+5.65%) are trading well above face value, and have quoted our tentative issue at 4.95%.
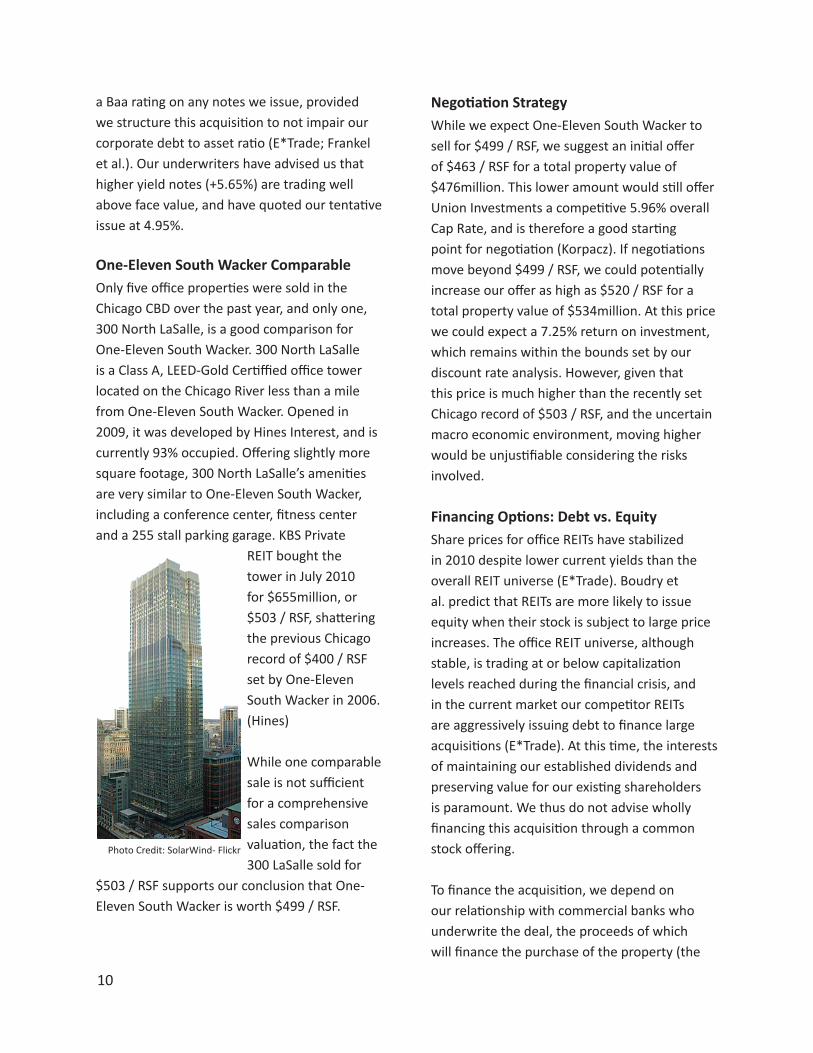
One-Eleven South Wacker ComparableOnly five office properties were sold in the Chicago CBD over the past year, and only one, 300 North LaSalle, is a good comparison for One-Eleven South Wacker. 300 North LaSalle is a Class A, LEED-Gold Certiffied office tower located on the Chicago River less than a mile from One-Eleven South Wacker. Opened in 2009, it was developed by Hines Interest, and is currently 93% occupied. Offering slightly more square footage, 300 North LaSalle’s amenities are very similar to One-Eleven South Wacker, including a conference center, fitness center and a 255 stall parking garage. KBS Private
REIT bought the tower in July 2010 for $655million, or $503 / RSF, shattering the previous Chicago record of $400 / RSF set by One-Eleven South Wacker in 2006. (Hines)
While one comparable sale is not sufficient for a comprehensive sales comparison valuation, the fact the 300 LaSalle sold for
$503 / RSF supports our conclusion that One-Eleven South Wacker is worth $499 / RSF.
Negotiation StrategyWhile we expect One-Eleven South Wacker to sell for $499 / RSF, we suggest an initial offer of $463 / RSF for a total property value of $476million. This lower amount would still offer Union Investments a competitive 5.96% overall Cap Rate, and is therefore a good starting point for negotiation (Korpacz). If negotiations move beyond $499 / RSF, we could potentially increase our offer as high as $520 / RSF for a total property value of $534million. At this price we could expect a 7.25% return on investment, which remains within the bounds set by our discount rate analysis. However, given that this price is much higher than the recently set Chicago record of $503 / RSF, and the uncertain macro economic environment, moving higher would be unjustifiable considering the risks involved.
Financing Options: Debt vs. EquityShare prices for office REITs have stabilized in 2010 despite lower current yields than the overall REIT universe (E*Trade). Boudry et al. predict that REITs are more likely to issue equity when their stock is subject to large price increases. The office REIT universe, although stable, is trading at or below capitalization levels reached during the financial crisis, and in the current market our competitor REITs are aggressively issuing debt to finance large acquisitions (E*Trade). At this time, the interests of maintaining our established dividends and preserving value for our existing shareholders is paramount. We thus do not advise wholly financing this acquisition through a common stock offering.
To finance the acquisition, we depend on our relationship with commercial banks who underwrite the deal, the proceeds of which will finance the purchase of the property (the
Photo Credit: SolarWind- Flickr
11
underwriters will be obligated to purchase all the Notes if they purchase any of the Notes). We anticipate that our underwriters will immediately develop a liquid trading and secondary market for the Notes.
The Debt Offering / Use of Proceeds• Securities Offered: $183,000,000
aggregate principal amount of 4.95% Notes due January 22, 2021.
• Maturity Date: the Notes will mature on January 22, 2021.
• Interest Payment Schedule: Interest on the Notes is payable semi-annually
Conclusion
Final RecommendationOne-Eleven South Wacker’s unique amenities, low vacancy rate, and relatively secure cash flow make it an excellent investment opportunity for MWD REIT. Given its relatively low risk profile, we believe it can produce an annual yield of 7.5% at a purchase price of $512,650,000, or $499 / RSF. This return exceeds the quarterly dividends MWD REIT distributes to its shareholders, and therefore represents a valuable addition to our portfolio.
The return is set appropriately according to the risks associated with the property. While One-Eleven South Wacker is an exceptional property, given the current economic climate, it is essential to receive adequate return for the full risks involved in real estate investment at this time. For that reason, we recommend MWD REIT attempt to buy the property at $499 / RSF, which corresponds to our desired 7.5% yield. Under no circumstances, however, should we pay a price higher than $520 / RSF, which would reduce our yield to 7.25%.
Sources
Brueggeman, W. B. and J. D. Fisher (2011): Real Estate Finance and Investments. McGraw Hill Irwin, New York, NY, 14th edn.
Bureau of Labor Statistics (BLS). All employment statistics taken from www.bls.gov
Canna, Peter. Vice President, Travelers Insurance Company. Interview with authors, November 30, 2010.
Cook County Treasurer’s Office. “Cook County Property Tax Information” Available at: www.cookcountytreasurer.com
Cushman & Wakefield. “Marketbeat: Chicago CBD Office Report 3Q10” Available at www.cushwake.com.
Drain, John. Meeting with The John Buck Company. February, 2006.
E*trade Market Trader. Available at: www.etrade.walst.com
Federal Reserve Bank of Philadelphia. “Fourth Quarter 2010 Survey of Professional Forcasters” November 15, 2010. Available at: www.philadelphiafed.org
Frankel, Merrie et al. (2006): “Ratings Methodology for REITs and Other Corporate Property Firms.” Moody’s Investors Service, New York, NY.
Grubb & Ellis Company. “Office Trends Report: Third Quarter 2010, Chicago, IL.” Available at www.grubb-ellis.com.
Grubb & Ellis Company. “Office Trends Report: Third Quarter 2010, United States” Available at www.grubb-ellis.com.
Hines. “300 North LaSalle: Property Fact Sheet” Available at: www.hines.com.
The John Buck Company (JBC). “One-Eleven South Wacker: Property Information Page” Available at: www.tjbc.com.
ParkWhiz. “One-Eleven South Wacker Parking Rates.” Available at www.parkwhiz.com.
Price Waterhouse Cooper. “Korpacz Market Indicators Third Quarter 2010” Available at: www.appraisalinstitute.org/ano/econ_indicator/indicators.aspx.
Sommer, Dustin. Meeting with Hines Interest, February 11, 2010
Wheaton, W. C., M. S. Baranski, and C. A. Templeton (2009): “100 Years of Commercial Real Estate Prices in Manhattan,” Real Estate Economics,37(1), 69{83.
12
Appendix
One-Eleven South Wacker Cash Flow Analysis
17
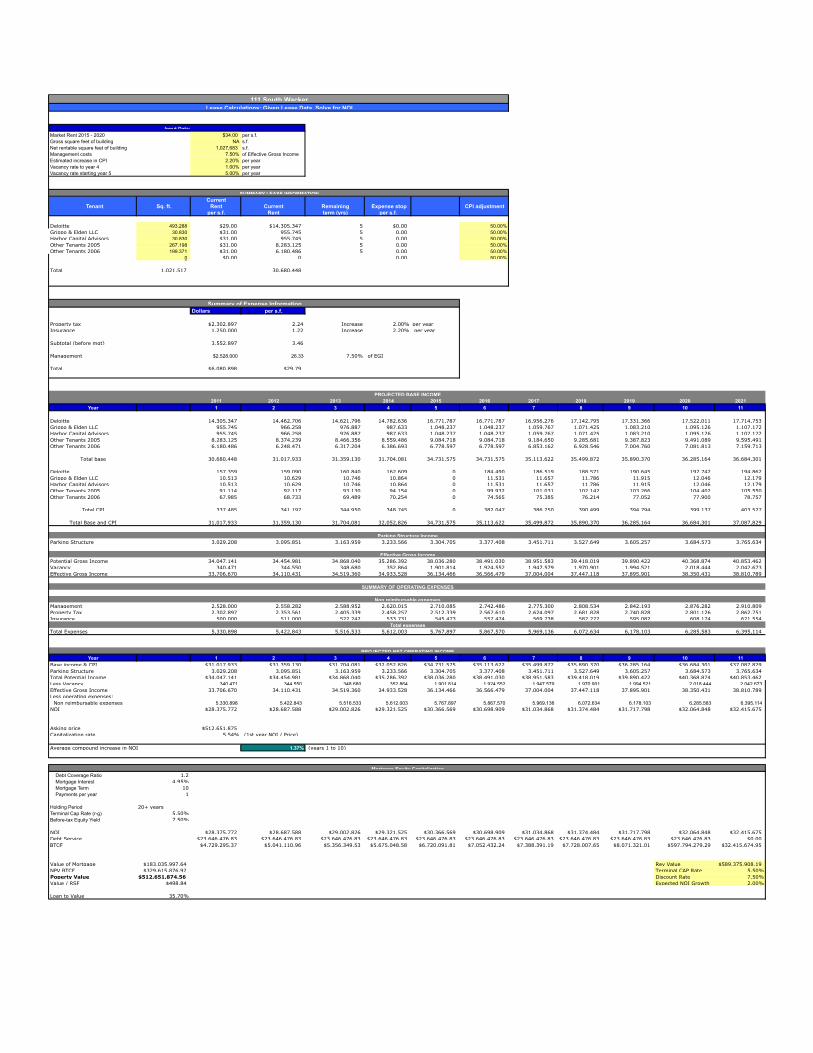
Market Rent 2015 - 2020 $34.00 per s.f.Gross square feet of building NA s.f.Net rentable square feet of building 1,027,683 s.f.Management costs 7.50% of Effective Gross IncomeEstimated increase in CPI 2.20% per yearVacancy rate to year 4 1.00% per yearVacancy rate starting year 5 5.00% per year
Current Tenant Sq. ft. Rent Current Remaining Expense stop CPI adjustment
per s.f. Rent term (yrs) per s.f.
Deloitte 493,288 $29.00 $14,305,347 5 $0.00 50.00%Grippo & Elden LLC 30,830 $31.00 955,745 5 0.00 50.00%Harbor Capital Advisors 30,830 $31.00 955,745 5 0.00 50.00%Other Tenants 2005 267,198 $31.00 8,283,125 5 0.00 50.00%Other Tenants 2006 199,371 $31.00 6,180,486 5 0.00 50.00%
0 $0.00 0 0.00 50.00%
Total 1,021,517 30,680,448
Dollars per s.f.
Property tax $2,302,897 2.24 Increase 2.00% per yearInsurance 1,250,000 1.22 Increase 2.20% per year
Subtotal (before mgt) 3,552,897 3.46
Management $2,528,000 26.33 7.50% of EGI
Total $6,080,898 $29.79
2011 2012 2013 2014 2015 2016 2017 2018 2019 2020 2021Year 1 2 3 4 5 6 7 8 9 10 11
Deloitte 14,305,347 14,462,706 14,621,796 14,782,636 16,771,787 16,771,787 16,956,276 17,142,795 17,331,366 17,522,011 17,714,753Grippo & Elden LLC 955,745 966,258 976,887 987,633 1,048,237 1,048,237 1,059,767 1,071,425 1,083,210 1,095,126 1,107,172Harbor Capital Advisors 955,745 966,258 976,887 987,633 1,048,237 1,048,237 1,059,767 1,071,425 1,083,210 1,095,126 1,107,172Other Tenants 2005 8,283,125 8,374,239 8,466,356 8,559,486 9,084,718 9,084,718 9,184,650 9,285,681 9,387,823 9,491,089 9,595,491Other Tenants 2006 6,180,486 6,248,471 6,317,204 6,386,693 6,778,597 6,778,597 6,853,162 6,928,546 7,004,760 7,081,813 7,159,713
Total base 30,680,448 31,017,933 31,359,130 31,704,081 34,731,575 34,731,575 35,113,622 35,499,872 35,890,370 36,285,164 36,684,301
Deloitte 157,359 159,090 160,840 162,609 0 184,490 186,519 188,571 190,645 192,742 194,862Grippo & Elden LLC 10,513 10,629 10,746 10,864 0 11,531 11,657 11,786 11,915 12,046 12,179Harbor Capital Advisors 10,513 10,629 10,746 10,864 0 11,531 11,657 11,786 11,915 12,046 12,179Other Tenants 2005 91,114 92,117 93,130 94,154 0 99,932 101,031 102,142 103,266 104,402 105,550Other Tenants 2006 67,985 68,733 69,489 70,254 0 74,565 75,385 76,214 77,052 77,900 78,757
Total CPI 337,485 341,197 344,950 348,745 0 382,047 386,250 390,499 394,794 399,137 403,527
Total Base and CPI 31,017,933 31,359,130 31,704,081 32,052,826 34,731,575 35,113,622 35,499,872 35,890,370 36,285,164 36,684,301 37,087,829
Parking Structure 3,029,208 3,095,851 3,163,959 3,233,566 3,304,705 3,377,408 3,451,711 3,527,649 3,605,257 3,684,573 3,765,634
Potential Gross Income 34,047,141 34,454,981 34,868,040 35,286,392 38,036,280 38,491,030 38,951,583 39,418,019 39,890,422 40,368,874 40,853,462Vacancy 340,471 344,550 348,680 352,864 1,901,814 1,924,552 1,947,579 1,970,901 1,994,521 2,018,444 2,042,673Effective Gross Income 33,706,670 34,110,431 34,519,360 34,933,528 36,134,466 36,566,479 37,004,004 37,447,118 37,895,901 38,350,431 38,810,789
Management 2,528,000 2,558,282 2,588,952 2,620,015 2,710,085 2,742,486 2,775,300 2,808,534 2,842,193 2,876,282 2,910,809Property Tax 2,302,897 2,353,561 2,405,339 2,458,257 2,512,339 2,567,610 2,624,097 2,681,828 2,740,828 2,801,126 2,862,751Insurance 500,000 511,000 522,242 533,731 545,473 557,474 569,738 582,272 595,082 608,174 621,554
Total Expenses 5,330,898 5,422,843 5,516,533 5,612,003 5,767,897 5,867,570 5,969,136 6,072,634 6,178,103 6,285,583 6,395,114
Year 1 2 3 4 5 6 7 8 9 10 11Base income & CPI $31,017,933 $31,359,130 $31,704,081 $32,052,826 $34,731,575 $35,113,622 $35,499,872 $35,890,370 $36,285,164 $36,684,301 $37,087,829Parking Structure 3,029,208 3,095,851 3,163,959 3,233,566 3,304,705 3,377,408 3,451,711 3,527,649 3,605,257 3,684,573 3,765,634Total Potential Income $34,047,141 $34,454,981 $34,868,040 $35,286,392 $38,036,280 $38,491,030 $38,951,583 $39,418,019 $39,890,422 $40,368,874 $40,853,462Less Vacancy 340,471 344,550 348,680 352,864 1,901,814 1,924,552 1,947,579 1,970,901 1,994,521 2,018,444 2,042,673Effective Gross Income 33,706,670 34,110,431 34,519,360 34,933,528 36,134,466 36,566,479 37,004,004 37,447,118 37,895,901 38,350,431 38,810,789Less operating expenses: Non reimbursable expenses 5,330,898 5,422,843 5,516,533 5,612,003 5,767,897 5,867,570 5,969,136 6,072,634 6,178,103 6,285,583 6,395,114NOI $28,375,772 $28,687,588 $29,002,826 $29,321,525 $30,366,569 $30,698,909 $31,034,868 $31,374,484 $31,717,798 $32,064,848 $32,415,675
Asking price $512,651,875Capitalization rate 5.54% (1st year NOI / Price)
Average compound increase in NOI 1.37% (years 1 to 10)
Debt Coverage Ratio 1.2 Mortgage Interest 4.95% Mortgage Term 10 Payments per year 1
Holding Period 20+ yearsTerminal Cap Rate (r-g) 5.50%Before-tax Equity Yield 7.50%
NOI $28,375,772 $28,687,588 $29,002,826 $29,321,525 $30,366,569 $30,698,909 $31,034,868 $31,374,484 $31,717,798 $32,064,848 $32,415,675Debt Service $23,646,476.83 $23,646,476.83 $23,646,476.83 $23,646,476.83 $23,646,476.83 $23,646,476.83 $23,646,476.83 $23,646,476.83 $23,646,476.83 $23,646,476.83 $0.00BTCF $4,729,295.37 $5,041,110.96 $5,356,349.53 $5,675,048.58 $6,720,091.81 $7,052,432.24 $7,388,391.19 $7,728,007.65 $8,071,321.01 $597,794,279.29 $32,415,674.95
Value of Mortgage $183,035,997.64 Rev Value $589,375,908.19NPV BTCF $329,615,876.92 Terminal CAP Rate 5.50%Poperty Value $512,651,874.56 Discount Rate 7.50%Value / RSF $498.84 Expected NOI Growth 2.00%
Loan to Value 35.70%
Mortgage-Equity Capitalization
PROJECTED NET OPERATING INCOME
111 South WackerLease Calculations: Given Lease Data, Solve for NOI
Input Data:
SUMMARY LEASE INFORMATION
Summary of Expense Information
PROJECTED BASE INCOME
Parking Structure Income
Effective Gross Income
SUMMARY OF OPERATING EXPENSES
Non reimbursable expenses
Total expenses