1114220046-565-r-rev0-screening multimedia 5apr 16 · chemical data screening for multimedia...
TRANSCRIPT

April 5, 2016
BURNCO AGGREGATE PROJECT
Chemical Data Screening for Multimedia Assessment
REP
OR
T
Report Number: 1114220046-565-R-Rev0
Distribution:
2 copies - Burnco Rock Products Ltd. 1 copy - Golder Associates Ltd.
Submitted to:Derek Holmes Regional Manager BC Aggregate Operations BURNCO Rock Products Ltd. 1A, 2760 Emerson Street Abbotsford, BC V2T 3J6

CHEMICAL DATA SCREENING FOR MULTIMEDIA ASSESSMENT
April 5, 2016 Report No. 1114220046-565-R-Rev0 i
Table of Contents
1.0 INTRODUCTION .................................................................................................................................................... 1
2.0 SCREENING VALUES USED IN THE HUMAN HEALTH MULTIMEDIA RISK ASSESSMENT .......................... 1
2.1 Summary of Guidelines and Standards Used ........................................................................................... 1
2.1.1 Surface Water ..................................................................................................................................... 1
2.1.2 Soil ...................................................................................................................................................... 2
2.2 Elimination of Non-Toxic Chemicals ......................................................................................................... 3
3.0 RESULTS OF SCREENING .................................................................................................................................. 4
3.1 Water ........................................................................................................................................................ 4
3.2 Soil ............................................................................................................................................................ 4
4.0 SCREENING OF BASELINE DATA ...................................................................................................................... 5
4.1 Soil ............................................................................................................................................................ 5
4.2 Fish, Crab, and Mussel Tissue ................................................................................................................. 5
4.2.1 Results ................................................................................................................................................ 6
5.0 CLOSURE .............................................................................................................................................................. 7
6.0 REFERENCES ....................................................................................................................................................... 8
TABLES
Table 9.1-C-1: Human Health Application Case Water Screening
Table 9.1-C-2: Human Health Application Case Soil Screening
Table 9.1-C-3: Input Values and Sources Used to Calculate Fish and Shellfish Screening Levels
Table 9.1-C-4: Human Health Toxicity Reference Values Used for Fish and Shellfish Screening
ATTACHMENTS
Attachment 1 Screened Baseline Soil and Tissue Concentrations

CHEMICAL DATA SCREENING FOR MULTIMEDIA ASSESSMENT
April 5, 2016 Report No. 1114220046-565-R-Rev0 ii
Acronyms and Abbreviations BC British Columbia BC CSR British Columbia Contaminated Sites Regulation BC MoE British Columbia Ministry of Environment CCME Canadian Council of Ministers of the Environment COPC Contaminant of potential concern e.g. exempli gratia (for example) i.e. id est (that is) RSL Regional Screening Level The Proposed Project BURNCO Aggregate Project US EPA United States Environmental Protection Agency
Units of Measure % Percent

CHEMICAL DATA SCREENING FOR MULTIMEDIA ASSESSMENT
April 5, 2016 Report No. 1114220046-565-R-Rev0 1
1.0 INTRODUCTION This appendix summarizes the selected screening values and outcome of the chemical screening for the human
health multimedia risk assessment being completed as part of the overall Environmental Assessment
Certificate/Environmental Impact Assessment (hereafter referred to as the EA) for the Proposed BURNCO
Aggregate Project (the Proposed Project).
2.0 SCREENING VALUES USED IN THE HUMAN HEALTH MULTIMEDIA RISK ASSESSMENT
A chemical screening process was used to determine the chemicals of potential concern (COPCs) in
environmental media as outlined in Section 9.1.4 of the main report.
For the Application Case assessment, the screening for COPCs entailed comparison between predicted
concentrations of contaminants in exposure media (e.g., soil and water) against both regulatory
guidelines/standards and a 10% or greater increase above the Base Case concentration at any location. Detailed
methods for the prediction of environmental concentrations in soil are provided in Appendix 9.1-D. Methods for
the prediction of aerial deposition rates and water quality concentrations are provided in Part B, Sections 5.7 and
5.5, respectively.
2.1 Summary of Guidelines and Standards Used Provincial (British Columbia Ministry of Environment [BC MoE]) and Canadian (e.g., Canadian Council of Ministers
of the Environment [CCME] and Health Canada) environmental quality regulations and guidelines were used
preferentially as part of the COPC identification process. In the absence of BC or Canadian environmental quality
criteria for a particular chemical, an environmental quality criterion from other international regulatory agencies
(e.g., United States Environmental Protection Agency [US EPA]) were used. Environmental quality regulations or
guidelines used in this assessment are summarized below by media type with the exception of the air quality
criteria which are presented in Appendix 9.1-B.
2.1.1 Surface Water
Water quality was predicted for the Proposed Project for the following locations:
the pit lake (MCF-5);
the downstream receiving environment including two locations on McNab Creek (MCF-1 and MCF-7);
a location downstream of the pit lake along a permanent channel (MCF-12); and
a location within the groundwater channel downstream of the pit lake (MCF-6).

CHEMICAL DATA SCREENING FOR MULTIMEDIA ASSESSMENT
April 5, 2016 Report No. 1114220046-565-R-Rev0 2
Water quality was predicted for each of the 16 years of the Proposed Project operation and for 2 years of closure
using inputs from water quality monitoring conducted between 2010 and 2014. Water quality inputs were
developed using the 95th percentile or probability distributions based on the available monitoring data (i.e., the
Base Case concentrations). Where insufficient data were available (i.e., less than three observations) a maximum
concentration was used instead of the 95th percentile. The predicted maximum yearly concentrations of total metals
and nutrients for each of the five locations identified above across the Proposed Project operations and closure
were screened against the Base Case concentrations and against the most conservative of the health-based
guidelines (Table 9.1-C-1).
The guidelines applied for the screening process included:
BC Contaminated Sites Regulation (CSR; BC MOE 2011, including updates to 2014) which provides
numerical standards representing acceptable concentrations of chemicals for drinking water use (Schedule
6 and 10 of the BC CSR);
BC Water Quality Guidelines (BC MoE 2014) which provides numerical guidelines for drinking water;
Health Canada Guidelines for Canadian Drinking Water Quality (Health Canada 2014). The Health Canada
drinking water guidelines typically assume a total daily intake allocated to drinking water of 20%
(i.e., assuming 20% of a person’s tolerable daily intake form a chemical comes from water, and the remaining
80% comes from other sources such as food); and
US EPA Residential Tap Water Regional Screening Levels (RSLs) for Chemical Contaminants at Superfund
Sites (US EPA 2014) (in the absence of guidelines from the agencies listed above). For non-carcinogens,
US EPA RSLs were adjusted to a hazard quotient of 0.2, and for carcinogens, RSLs were adjusted to reflect
a cancer risk level of 1 in 100,000 (consistent with Health Canada guidance). US EPA RSL values were only
provided if there were no health-based guidelines or standards from the above sources.
MCF-1 and MCF-7 are located along McNab Creek and the local Strata hold a license to use this water for potable
purposes. In addition, the pit lake and MCF-6 and -12 are considered possible sources for incidental ingestion of
water through recreational use. For this reason, predicted water quality concentrations were screened against
drinking water guidelines. The selected screening value was the lowest human health-based value from the above
listed sources.
2.1.2 Soil
Maximum Application Case soil concentrations at selected receptor locations were screened against health-based
residential soil quality thresholds (Table 9.1-C-2). The following soil quality thresholds were considered:
CCME (1999) – Canadian soil quality guidelines for protection of human health. Where available, screening
values for relevant pathways were used (i.e., soil ingestion, direct contact). The Canadian soil quality
guidelines are typically based on an allocation of 20% of the provisional tolerable daily intake of soil
(i.e., assuming 20% of a person’s tolerable daily intake of a chemical comes from soil, and the remaining
80% comes from other sources such as food and water);

CHEMICAL DATA SCREENING FOR MULTIMEDIA ASSESSMENT
April 5, 2016 Report No. 1114220046-565-R-Rev0 3
BC CSR which provides numerical standards for soil (Schedules 4, 5 and 10) (BC MoE 2011; including
updates to 2014). Where available, standards for relevant pathways were used (i.e., soil intake).
BC regional background soil concentrations for the Lower Mainland (BC MoE 2005; 2010) are provided in Table
9.1-C-2. The background soil quality database includes soil data analyzed by two different digestion methods,
aqua regia and nitric perchloric. The aqua regia method is considered the preferred analytical method for metals
(BC MoE 2010). However, aqua regia results were not available for all metals reported in the background soil
quality database. Aqua regia results were not available for bismuth, mercury, and thallium; therefore the nitric
perchloric results were utilized for these parameters.
The lower of the BC CSR and/or CCME standards and guidelines was conservatively chosen as the selected
screening value. If a BC CSR and CCME standard or guideline was not available, the BC background soil
concentration was used for screening purposes. Regional background concentrations were used as a secondary
screen to determine whether a chemical that exceeded a guideline/standard and increased by greater than 10%
from Base Case concentrations should be retained for further evaluation in the risk assessment. Background
values were used instead of screening values available from other jurisdictions because they were specific to soils
in BC. In media other than soil, local background concentrations were not available and therefore screening values
from other jurisdictions were deferred to in the absence of a provincial or federal standard.
2.2 Elimination of Non-Toxic Chemicals Some metals and essential minerals are commonly analyzed in environmental samples (as part of the standard
suite of metals treated by the analytical method) but generally have low toxicity at concentrations typically found
in the environment, even at industrial sites such as a mine. Many of these chemicals are present in parent rock
and soil materials and are present in a toxicologically inert form, and some are essential micro- and
macro-nutrients.
Although the following metals and essential minerals may be present in media in the area of direct influence,
they were excluded from further consideration in the COPC screening process based on their expected low
toxicological hazard:
Calcium, sodium, potassium, magnesium, and phosphorus are essential minerals that serve a variety of
biochemical, intracellular, and ion balance purposes in human tissues. These parameters are naturally
occurring chemicals and are included in routine analytical chemical analyses. Government agencies often do
not develop regulatory criteria for these and other innocuous chemicals. As these chemicals are not known
or expected to be associated with on-site activities, they have been excluded from the human health risk
assessment.

CHEMICAL DATA SCREENING FOR MULTIMEDIA ASSESSMENT
April 5, 2016 Report No. 1114220046-565-R-Rev0 4
3.0 RESULTS OF SCREENING
3.1 Water The predicted water concentrations for the Application Case as well as the Base Case concentrations are provided
in Table 9.1-C-2. Water sampling locations are provided in Figure 9.1-2. Results of the screening for each water
quality location are provided below:
Pit Lake
A guideline was not available for ammonia, hardness and total titanium and the predicted maximum 95th percentile
concentration was greater than 10% above the Base Case concentration. All other parameters were either below
the applicable health-based guideline or did not increase by greater than 10% above Base Case. Therefore,
ammonia, hardness and titanium were retained as COPCs in the pit lake.
MCF-6, MFC-12
A guideline was not available for ammonia or hardness and the predicted maximum 95th percentile concentration
was greater than 10% above the Base Case concentration. All other parameters were either below the applicable
health-based guideline or did not increase by greater than 10% above Base Case. Therefore, hardness was
retained as a COPC.
MCF-1
A guideline was not available for alkalinity and the predicted maximum 95th percentile concentration was greater
than 10% above the Base Case concentration. All other parameters were either below the applicable health-
based guideline or did not increase by greater than 10% above Base Case. Therefore, alkalinity was retained as
a COPC.
MCF-7
The water quality predictions were either below the applicable health-based guideline or did not increase by greater
than 10% above the Base Case.
3.2 Soil Based on the screening process outlined in Section 2.1.2, no COPCs were retained in soil for the Application
Case. None of the metals emitted by the Proposed Project were predicted to increase the concentration in soil by
greater than 10% from the Base Case to the Application Case. Although the maximum Application Case
concentration for arsenic (15.8 mg/kg) exceeded the selected screening value (12 mg/kg), it was below the
regional background concentration of 20 mg/kg and; therefore, not retained for further evaluation in the human
health risk assessment.

CHEMICAL DATA SCREENING FOR MULTIMEDIA ASSESSMENT
April 5, 2016 Report No. 1114220046-565-R-Rev0 5
4.0 SCREENING OF BASELINE DATA Baseline data including soil, mussels, crabs, and fish collected to support the human health assessment were also
screened against applicable guidelines. While significant changes to these media as a result of the Proposed
Project are not anticipated because of the minimal changes to soil and water anticipated as a result of the Proposed
Project, (see main document; section 9.1; rationale provided in section 9.1.4.6.2), these screened baseline data
are presented in Attachment 1 of this appendix for informational purposes. Berries were collected as part of the
baseline study; however there are no screening guidelines available for vegetation. Soil was considered a
surrogate for assessing vegetation.
4.1 Soil Baseline soil concentrations were all below the CSR and CCME screening values with the exception of arsenic
which exceeded the CCME residential and industrial guideline of 12 mg/kg at three locations (13-BRP-S-01, 02
and 05). The maximum concentration which occurred at 13-BRP-S-05 (15.7 mg/kg) did not exceed the BC MoE
regional background concentration of 20 mg/kg. Screened baseline data are presented in Table 1 of Attachment 1
of this appendix.
4.2 Fish, Crab, and Mussel Tissue Baseline fish, crab, and mussel tissue concentrations compared to screening levels are provided in Tables 2 to 4 of Attachment 1 of this appendix. Screening levels were calculated using the Health Canada (2012) equation for ingestion of contaminated foods (provided below). The equation was rearranged to solve for the concentration of contaminant in food (CFoodi). The equation input values and sources used are provided in Table 9.1-C-3 and Table 9.1-C-4. Ingestion rates for high consumers (eaters only) of fish and shellfish were used so as not to underestimate potential exposure scenarios (e.g., subsistence consumption), so therefore an exceedance of a screening level does not necessarily imply a potential health risk but rather may require some further evaluation if the contaminants are related to those released by the proposed Project.
Toxicity reference values (TRVs) were used from Health Canada (2012) if available. If not, TRVs were used from the hierarchy of sources following Health Canada guidance (2010; Table 9.1-C-4). For non-carcinogenic parameters, the TRV, body weight, and ingestion rate for the toddler (if available) were used to be conservative in the calculation of the screening values. For carcinogenic parameters (e.g., arsenic and benzo(a)pyrene), the TRV, body weight, and ingestion rates for adults were used.
Dose (mg/kg bw/day) = [Σ [CFoodi × IRFoodi × RAFOrali × D i ]] × D4
BW × 365 × LE Where: CFoodi = concentration of contaminant in food i (mg/kg) IRFoodi = receptor ingestion rate for food i (kg/day) RAFOrali = relative absorption factor from the gastrointestinal tract for contaminant i (unitless) Di = days per year during which consumption of food i will occur D4 = total years exposed to site (for assessment of carcinogens only) BW = body weight (kg) 365 = total days per year (constant) LE = life expectancy (years) (for assessment of carcinogens only)

CHEMICAL DATA SCREENING FOR MULTIMEDIA ASSESSMENT
April 5, 2016 Report No. 1114220046-565-R-Rev0 6
4.2.1 Results
Fish
Available baseline fish data included a single sample collected from McNab Creek, which was analyzed for metals.
The concentrations of arsenic, chromium (compared to chromium VI screening value), lead, and mercury
exceeded the calculated fish screening levels. The mercury fish tissue concentrations were conservatively
compared to a screening value based on methylmercury. Concentrations of the remaining parameters analyzed
were below the calculated fish screening levels.
Crab
Available baseline crab data include seven samples collected from a reference site (Camp Potlatch) and nine
samples from the proposed Project area. Both muscle and organ tissue samples were collected from each crab
and analyzed for metals. The concentrations of arsenic (ranging from 1.06 to 12.20 mg/kg ww) exceeded the
shellfish screening level (0.06 mg/kg ww) in all tissue samples collected from the reference site and the proposed
Project area. The concentration of copper exceeded the shellfish screening level (33.4 mg.kg ww) in three organ
samples only; one sample from the reference site (58.1 mg.kg ww) and two from the proposed Project area
(33.5 and 35.9 mg/kg ww) The concentration of mercury exceeded the screening level of 0.07 mg.kg ww in both
muscle and organ tissue samples collected from the reference site (Camp Potlatch) for three crabs and in one
muscle tissue sample collected from the proposed Project area. The concentrations of strontium exceeded the
screening value in one organ tissue sample collected from Camp Potlatch and in two organ samples collected
from the proposed Project area. No muscle tissue samples exceeded the strontium screening value. In general,
concentrations of metals and PAHs in crab in muscle and organ tissues collected at the reference site and the
Project area, were quite similar.
Mussel
Available baseline mussel data included ten samples collected from a reference site (Camp Potlatch) and ten
samples collected from the proposed Project area. All mussel samples were analyzed for metals and five samples
were analyzed for polycyclic aromatic hydrocarbons (PAHs). The following metals had concentrations in the
proposed Project area that exceeded the screening levels: arsenic, cadmium, copper, lead, and zinc. All mussel
samples collected from Camp Potlatch had concentrations exceeding the screening levels for arsenic and
cadmium, and one sample also had exceedances for aluminum, chromium, cobalt, iron, and vanadium. There
were no exceedances of the PAH screening levels in samples collected from Camp Potlatch or from the proposed
Project area. In general, concentrations of metals and PAHs in mussels collected at the reference site and the
Project area, were quite similar.

CHEMICAL DATA SCREENING FOR MULTIMEDIA ASSESSMENT
April 5, 2016 Report No. 1114220046-565-R-Rev0 7
5.0 CLOSURE We trust this information is sufficient for your needs at this time. Should you have any questions or concerns, please do not hesitate to contact the undersigned at 604-296-4200.
GOLDER ASSOCIATES LTD.
Ann-Marie Norris, B.Sc. Audrey Wagenaar, M.Sc., DABT, PChem. Project Biologist Associate, Senior Environmental Scientist
Golder, Golder Associates and the GA globe design are trademarks of Golder Associates Corporation.
o:\final\2011\1422\11-1422-0046\1114220046-565-r-rev0\1114220046-565-r-rev0-screening multimedia_5apr_16.docx

CHEMICAL DATA SCREENING FOR MULTIMEDIA ASSESSMENT
April 5, 2016 Report No. 1114220046-565-R-Rev0 8
6.0 REFERENCES BC MoE (British Columbia Ministry of the Environment). 2005. Technical Guidance 17: Soil quality database.
October 2005.
BC MoE. 2010. Protocol 4 for Contaminated Sites: Determining background soil quality. October 12, 2010.
BC MoE. 2011. Contaminated Sites Regulation Schedule 6 – Generic numerical water standards. 2011, includes
amendments up to January 31, 2014. Available at:
http://www.bclaws.ca/EPLibraries/bclaws_new/document/ID/freeside/375_96_08. Accessed September
2014.
BC MoE. 2014. Water quality, Water quality guidelines (criteria) reports. Available at:
http://www.env.gov.bc.ca/wat/wq/wq_guidelines.html#approved. Accessed September 2014.
CCME (Canadian Council of Ministers of the Environment). 1999. Soil Quality Guidelines for the Protection of
Environmental and Human Health. Last updated 2014. Available at: http://st-ts.ccme.ca/en/index.html.
Accessed September 2014.
Health Canada. 2010. Federal Contaminated Site Risk Assessment in Canada. Part I: Guidance on Human Health Preliminary Quantitative Risk Assessment. Version 2.0, Ottawa, ON, Canada.
Health Canada. 2014. Guidelines for Canadian Drinking Water Quality – Summary Table. Federal-Provincial-Territorial Committee on Drinking Water of the Federal-Provincial-Territorial Committee on Health and the Environment. Water, Air and Climate Change Bureau, Healthy Environments and Consumer Safety Branch. Ottawa, ON, Canada.
US EPA (United States Environmental Protection Agency). 2014. Regional Screening Levels – Residential tap water table. Last updated November 2014. Available at: http://www.epa.gov/region9/superfund/prg/. Accessed January 2015.

4/5/2016 Table 9.1-C-1: Drinking Water Screening for Pit Lake, MCF-6, MCF-12, MCF-1, and MCF-7Public Health Assessment
Proposed Burnco Aggregate Project
11-1422-0046
Maximum6 Year
Does Maximum Exceed
Screening Value?
Is % Change Greater than
10%?
Is Parameter a COPC? Maximum6 Year
Does Maximum Exceed
Screening Value?
Is % Change Greater than
10%?
Is Parameter a COPC? Maximum6 Year
Does Maximum Exceed
Screening Value?
Is % Change Greater than
10%?
Is Parameter a COPC?
Conventional
Total Dissolved Solidsa - - 500 AO - 500 36 63 Year 2 No Yes No 63 Year 2 No Yes No 63 Year 2 No Yes NoAlkalinityb - - - - - 6.3 5.4 Year 1 NG No No 5.4 Year 1 NG No No 5.4 Year 1 NG No NoHardnessc - - - - - 8.05 21 Year 3 NG Yes Yes 21 Year 3 NG Yes Yes 21 Year 3 NG Yes Yes
Major IonsCalcium - - - - - 2.7 7 Year 3 NG Yes No j 7.2 Year 3 NG Yes No j 7.2 Year 3 NG Yes No j
Chloride 250 250 250 AO - 250 1.1 1.3 Year 11 No Yes No 1.3 Year 11 No Yes No 1.3 Year 11 No Yes NoFluoride 1.5 1.5 1.5 - 1.5 0.010 0.026 Year 3 No Yes No 0.026 Year 3 No Yes No 0.026 Year 3 No Yes NoMagnesium 100 TO - - - 100 0.31 0.86 Year 10 No Yes No 0.86 Year 10 No Yes No 0.86 Year 10 No Yes NoPotassium - - - - - 1.0 1.69 Year 10 NG Yes No j 1.7 Year 10 NG Yes No j 1.7 Year 10 NG Yes No j
Sodium 200 TO - 200 AO - 200 1.0 37.6 Year 2 No Yes No 38 Year 2 No Yes No 38 Year 2 No Yes NoSulphate 500 500 500 AO - 500 4.7 6 Year 3 No Yes No 6.1 Year 3 No Yes No 6.1 Year 3 No Yes NoNutrientsAmmonia - - - - - 0.0025 0.015 Year 3 NG Yes Yes 0.015 Year 3 NG Yes Yes 0.015 Year 3 NG Yes YesNitrate (as N) 10 d 10 10 - 10 0.43 0.19 Year 2 No No No 0.19 Year 2 No No No 0.19 Year 2 No No NoNitrite (as N) 3.2 1 1 - 1 0.00050 0.00050 Year 2 No No No 0.00050 Year 2 No No No 0.00050 Year 2 No No NoTotal Kjeldhal Nitrogen - - - - - 0.11 0.063 Year 2 NG No No 0.063 Year 2 NG No No 0.063 Year 2 NG No NoTotal Phosphorus - 0.01 f - - 0.01 0.0084 0.009 Year 3 No No No 0.0087 Year 3 No No No 0.0087 Year 3 No No NoDissolved Metals7
Aluminum 9.5 e 0.2 dis. 0.1 OG - 0.2 0.071 0.044 Year 10 No No No 0.044 Year 10 No No No 0.044 Year 10 No No NoAntimony 0.006 0.014 g, W 0.006 - 0.006 0.00025 0.00025 Year 2 No No No 0.00025 Year 2 No No No 0.00025 Year 2 No No NoArsenic 0.01 0.025 h 0.01 - 0.01 0.00025 0.00076 Year 3 No Yes No 0.00076 Year 3 No Yes No 0.00076 Year 3 No Yes NoBarium 1 - - - 1 0.010 0.013 Year 3 No Yes No 0.013 Year 3 No Yes No 0.013 Year 3 No Yes NoBeryllium - 0.004 W - - 0.004 0.00050 0.00050 Year 2 No No No 0.00050 Year 2 No No No 0.00050 Year 2 No No NoBoron 5 5 5 - 5 0.050 0.050 Year 2 No No No 0.050 Year 2 No No No 0.050 Year 2 No No NoCadmium 0.005 - 0.005 - 0.005 0.000024 0.000017 Year 2 No No No 0.000017 Year 2 No No No 0.000017 Year 2 No No NoChromium 0.05 - 0.05 - 0.05 0.00050 0.00050 Year 2 No No No 0.00050 Year 2 No No No 0.00050 Year 2 No No NoCobalt - - - 0.0012 NC 0.0012 0.00015 0.00018 Year 14 No Yes No 0.00018 Year 14 No Yes No 0.00018 Year 14 No Yes NoCopper 1 TO 0.5 1 AO - 0.5 0.00050 0.00071 Year 14 No Yes No 0.00071 Year 14 No Yes No 0.00071 Year 14 No Yes NoIron 6.5 e - 0.3 AO - 6.5 0.015 0.042 Year 3 No Yes No 0.042 Year 3 No Yes No 0.042 Year 3 No Yes NoLead 0.01 0.05 0.01 - 0.01 0.00025 0.00025 Year 8 No No No 0.00025 Year 8 No No No 0.00025 Year 8 No No NoLithium 0.73 - - - 0.73 0.0025 0.0025 Year 2 No No No 0.0025 Year 2 No No No 0.0025 Year 2 No No NoManganese 0.55 e - 0.05 AO - 0.55 0.0093 0.050 Year 3 No Yes No 0.050 Year 3 No Yes No 0.050 Year 3 No Yes NoMercury 0.001 0.001 0.001 - 0.001 0.0000050 0.0000050 Year 2 No No No 0.0000050 Year 2 No No No 0.0000050 Year 2 No No NoMolybdenum 0.25 0.25 - - 0.25 0.00050 0.00090 Year 3 No Yes No 0.00090 Year 3 No Yes No 0.00090 Year 3 No Yes NoNickel - - - 0.078 i, NC 0.044 0.00050 0.00050 Year 2 No No No 0.00050 Year 2 No No No 0.00050 Year 2 No No NoSelenium 0.01 0.01 0.05 - 0.01 0.00050 0.00050 Year 2 No No No 0.00050 Year 2 No No No 0.00050 Year 2 No No NoSilicon - - - - - - 9.1 Year 10 NG - No 9.1 Year 10 NG - No 9.1 Year 10 NG - NoSilver - - - 0.019 NC 0.02 0.000010 0.000011 Year 3 No No No 0.000011 Year 3 No No No 0.000011 Year 3 No No NoThallium - 0.0005 W - - 0.0005 0.00010 0.00010 Year 2 No No No 0.00010 Year 2 No No No 0.00010 Year 2 No No NoTin 22 - - - 22 0.00025 0.00025 Year 2 No No No 0.00025 Year 2 No No No 0.00025 Year 2 No No NoTitanium - - - - - 0.0050 0.0050 Year 2 NG No No 0.0050 Year 2 NG No No 0.0050 Year 2 NG No NoUranium 0.02 - 0.02 - 0.02 0.00010 0.00010 Year 14 No No No 0.00010 Year 14 No No No 0.00010 Year 14 No No NoVanadium - - - 0.017 NC 0.017 0.00050 0.00074 Year 10 No Yes No 0.00074 Year 10 No Yes No 0.00074 Year 10 No Yes NoZinc 5 TO 5 AO 5 AO 1.2 NC 1.2 0.0025 0.0026 Year 13 No No No 0.0026 Year 13 No No No 0.0026 Year 13 No No NoTotal MetalsAluminum 9.5 e - 0.1 OG - 9.5 0.32 0.12 Year 2 No No No 0.044 Closure No No No 0.044 Year 10 No No NoAntimony 0.006 0.014 g, W 0.006 - 0.006 0.00025 0.00025 Year 2 No No No 0.00025 Year 2 No No No 0.00025 Year 2 No No NoArsenic 0.01 0.025 h 0.01 - 0.01 0.00025 0.00078 Year 3 No Yes No 0.00076 Year 3 No Yes No 0.00076 Year 3 No Yes NoBarium 1 - - - 1 0.010 0.013 Year 3 No Yes No 0.013 Year 3 No Yes No 0.013 Year 3 No Yes NoBeryllium - 0.004 W - - 0.004 0.00050 0.00050 Year 2 No No No 0.00050 Year 2 No No No 0.00050 Year 2 No No NoBoron 5 5 5 - 5 0.050 0.050 Year 2 No No No 0.050 Year 2 No No No 0.050 Year 2 No No NoCadmium 0.005 - 0.005 - 0.005 0.000031 0.000018 Year 2 No No No 0.000017 Year 2 No No No 0.000017 Year 2 No No NoChromium 0.05 - 0.05 - 0.05 0.00050 0.00053 Year 1 No No No 0.00050 Year 2 No No No 0.00050 Year 2 No No NoCobalt - - - 0.0012 NC 0.0012 0.00015 0.00019 Year 3 No Yes No 0.00018 Year 14 No Yes No 0.00018 Year 14 No Yes NoCopper 1 TO 0.5 1 AO - 0.5 0.00050 0.00076 Year 14 No Yes No 0.00072 Year 14 No Yes No 0.00072 Year 14 No Yes NoIron 6.5 e - 0.3 AO - 6.5 0.18 0.083 Year 2 No No No 0.043 Year 3 No No No 0.043 Year 3 No No NoLead 0.01 0.05 0.01 - 0.01 0.00025 0.00027 Year 1 No No No 0.00025 Year 8 No No No 0.00025 Year 8 No No NoLithium 0.73 - - - 0.73 0.0025 0.0025 Year 2 No No No 0.0025 Year 2 No No No 0.0025 Year 2 No No NoManganese 0.55 e - 0.05 AO - 0.55 0.011 0.050 Year 3 No Yes No 0.050 Year 3 No Yes No 0.050 Year 3 No Yes NoMercury 0.001 0.001 0.001 - 0.001 0.0000050 0.0000051 Year 1 No No No 0.0000050 Year 2 No No No 0.0000050 Year 2 No No NoMolybdenum 0.25 0.25 - - 0.25 0.00050 0.00091 Year 3 No Yes No 0.00090 Year 3 No Yes No 0.00090 Year 3 No Yes NoNickel - - - 0.078 i, NC 0.044 0.00050 0.00051 Year 1 No No No 0.00050 Year 2 No No No 0.00050 Year 2 No No NoSelenium 0.01 0.01 0.05 - 0.01 0.00050 0.00050 Year 2 No No No 0.00050 Year 2 No No No 0.00050 Year 2 No No NoSilver - - - 0.019 NC 0.02 0.000010 0.000011 Year 3 No Yes No 0.000011 Year 3 No No No 0.000011 Year 3 No No NoThallium - 0.0005 W - - 0.0005 0.00010 0.00010 Year 2 No No No 0.00010 Year 2 No No No 0.00010 Year 2 No No NoTin 22 - - - 22 0.00025 0.00025 Year 2 No No No 0.00025 Year 2 No No No 0.00025 Year 2 No No NoTitanium - - - - - 0.0050 0.0056 Year 1 NG Yes Yes 0.0050 Year 2 NG No No 0.0050 Year 2 NG No NoUranium 0.02 - 0.02 - 0.02 0.00010 0.00010 Year 14 No No No 0.00010 Year 14 No No No 0.00010 Year 14 No No NoVanadium - - - 0.017 NC 0.017 0.00050 0.00075 Year 10 No Yes No 0.00074 Year 10 No Yes No 0.00074 Year 10 No Yes NoZinc 5 TO 5 AO 5 AO 1.2 NC 1.2 0.0025 0.0028 Year 3 No Yes No 0.0026 Year 13 No No No 0.0026 Year 13 No No NoNotes:Bolded and shaded values exceed the selected screening value.Units in milligrams per litre (mg/L), unless otherwise noted.
3. Health Canada. 2014. Guidelines for Canadian Drinking Water Quality Summary Table (October 2014).
5. Selected screening value is the lowest health-based standard or guideline from BC CSR, BC WQG and Health Canada Drinking Water Guidelines.6. Maximum concentration for each parameter at each location is based on the predicted Conservative Scenario concentrations.7. Total metal standards/guidelines/screening levels are used in the absence of dissolved metal screening values, unless otherwise indicated. a. Calculated value: Calculated TDS based on standard methods (APHA 2005).b. Assumed alkalinity based on mean of SFE test, used for calculation of TDS.c. Calculated hardness based on concentrations of calcium and magnesium.d. Where nitrate and nitrite are present, total nitrate plus nitrite-nitrogen should not exceed this value.
f. Related to taste and odour from algae.g. Human health protection from consumption of water and organisms.h. Interim guideline.i. As nickel soluble salts.j. An innocuous substance or is calculated based on innocuous substances, therefore not a COPC (Health Canada 2010).
"-" = no value or not measured; % = percent; AO = Aesthetic objective; COPC = contaminant of potential concern; dis. = Dissolved guideline; OG = Operational guideline; NC = Non-carcinogenic endpoint; TDS = total dissolved solids; TO = taste and odour concerns; W = Working Water Quality Guidelines.
1. British Columbia Contaminated Sites Regulation (BC CSR) Schedule 6 (Generic Numerical Water Standards) and Schedule 10 (Generic Numerical Soil and Water Standards) for Drinking Water (including amendments to January 31, 2014). Available at: http://www.env.gov.bc.ca/epd/remediation/leg_regs/csr.htm. Accessed March 2016.
4. United States Environmental Protection Agency (US EPA) Regional Screening Levels for Residential Tapwater (RSL) (updated as of November 2014). Available at: http://www.epa.gov/region9/superfund/prg/. Accessed March 2016. Non-carcinogenic values are multiplied by 0.2 and carcinogenic values are multipled by 10 to adjust to a target Hazard Quotient of 0.2 and an Incremental Lifetime Cancer Risk of 1x10⁻⁵, respectively. Where both non-carcinogenic and carcinogenic RSLs were available for a parameter, the lower of the two adjusted values was selected as the screening level. RSLs are only shown when health-based BC CSR, BC WQG and Health Canada Drinking Water Guidelines screening values are not available.
2. British Columbia Water Quality Guidelines (BC WQG). Available at: http://www.env.gov.bc.ca/wat/wq/wq_guidelines.html#approved. Accessed March 2016
e. Protective of human health, based on toxicological reference value protective of adults. Standards may not address aesthetic concerns related to drinking water quality and water treatment may be required.
ParameterBC CSR -
Drinking Water1 NotesBC WQG -
Drinking Water2 NotesHealth Canada Drinking Water
Guidelines3Notes
MCF-6 MCF-12
US EPA RSL (Tap
water)4 NotesSelected
Screening
Value5
Conservative Scenario Baseline
Surface Water Quality
Pit Lake
O:\Final\2011\1422\11-1422-0046\1114220046-565-R-Rev0\Tables\Tables 1 to 2_APP 9.1-C.xlsx Golder Associates Ltd. Page 1 of 2

4/5/2016 Table 9.1-C-1: Drinking Water Screening for Pit Lake, MCF-6, MCF-12, MCF-1, and MCF-7Public Health Assessment
Proposed Burnco Aggregate Project
11-1422-0046
Conventional
Total Dissolved Solidsa - - 500 AO - 500
Alkalinityb - - - - -Hardnessc - - - - -Major IonsCalcium - - - - -Chloride 250 250 250 AO - 250Fluoride 1.5 1.5 1.5 - 1.5Magnesium 100 TO - - - 100Potassium - - - - -Sodium 200 TO - 200 AO - 200Sulphate 500 500 500 AO - 500NutrientsAmmonia - - - - -Nitrate (as N) 10 d 10 10 - 10Nitrite (as N) 3.2 1 1 - 1Total Kjeldhal Nitrogen - - - - -Total Phosphorus - 0.01 f - - 0.01
Dissolved Metals7
Aluminum 9.5 e 0.2 dis. 0.1 OG - 0.2Antimony 0.006 0.014 g, W 0.006 - 0.006Arsenic 0.01 0.025 h 0.01 - 0.01Barium 1 - - - 1Beryllium - 0.004 W - - 0.004Boron 5 5 5 - 5Cadmium 0.005 - 0.005 - 0.005Chromium 0.05 - 0.05 - 0.05Cobalt - - - 0.0012 NC 0.0012Copper 1 TO 0.5 1 AO - 0.5Iron 6.5 e - 0.3 AO - 6.5Lead 0.01 0.05 0.01 - 0.01Lithium 0.73 - - - 0.73Manganese 0.55 e - 0.05 AO - 0.55Mercury 0.001 0.001 0.001 - 0.001Molybdenum 0.25 0.25 - - 0.25Nickel - - - 0.078 i, NC 0.044Selenium 0.01 0.01 0.05 - 0.01Silicon - - - - -Silver - - - 0.019 NC 0.02Thallium - 0.0005 W - - 0.0005Tin 22 - - - 22Titanium - - - - -Uranium 0.02 - 0.02 - 0.02Vanadium - - - 0.017 NC 0.017Zinc 5 TO 5 AO 5 AO 1.2 NC 1.2Total MetalsAluminum 9.5 e - 0.1 OG - 9.5Antimony 0.006 0.014 g, W 0.006 - 0.006Arsenic 0.01 0.025 h 0.01 - 0.01Barium 1 - - - 1Beryllium - 0.004 W - - 0.004Boron 5 5 5 - 5Cadmium 0.005 - 0.005 - 0.005Chromium 0.05 - 0.05 - 0.05Cobalt - - - 0.0012 NC 0.0012Copper 1 TO 0.5 1 AO - 0.5Iron 6.5 e - 0.3 AO - 6.5Lead 0.01 0.05 0.01 - 0.01Lithium 0.73 - - - 0.73Manganese 0.55 e - 0.05 AO - 0.55Mercury 0.001 0.001 0.001 - 0.001Molybdenum 0.25 0.25 - - 0.25Nickel - - - 0.078 i, NC 0.044Selenium 0.01 0.01 0.05 - 0.01Silver - - - 0.019 NC 0.02Thallium - 0.0005 W - - 0.0005Tin 22 - - - 22Titanium - - - - -Uranium 0.02 - 0.02 - 0.02Vanadium - - - 0.017 NC 0.017Zinc 5 TO 5 AO 5 AO 1.2 NC 1.2Notes:Bolded and shaded values exceed the selected screening value.Units in milligrams per litre (mg/L), unless otherwise noted.
3. Health Canada. 2014. Guidelines for Canadian Drinking Water Quality Summary Table (October 2014).
5. Selected screening value is the lowest health-based standard or guideline from BC CSR, BC WQG and Health Canada Drinking Water Guidelines.6. Maximum concentration for each parameter at each location is based on the predicted Conservative Scenario concentrations.7. Total metal standards/guidelines/screening levels are used in the absence of dissolved metal screening values, unless otherwise indicated. a. Calculated value: Calculated TDS based on standard methods (APHA 2005).b. Assumed alkalinity based on mean of SFE test, used for calculation of TDS.c. Calculated hardness based on concentrations of calcium and magnesium.d. Where nitrate and nitrite are present, total nitrate plus nitrite-nitrogen should not exceed this value.
f. Related to taste and odour from algae.g. Human health protection from consumption of water and organisms.h. Interim guideline.i. As nickel soluble salts.j. An innocuous substance or is calculated based on innocuous substances, therefore not a COPC (Health Canada 2010).
"-" = no value or not measured; % = percent; AO = Aesthetic objective; COPC = contaminant of potential concern; dis. = Dissolved guideline; OG = Operational guideline; NC = Non-carcinogenic endpoint; TDS = total dissolved solids; TO = taste and odour concerns; W = Working Water Quality Guidelines.
1. British Columbia Contaminated Sites Regulation (BC CSR) Schedule 6 (Generic Numerical Water Standards) and Schedule 10 (Generic Numerical Soil and Water Standards) for Drinking Water (including amendments to January 31, 2014). Available at: http://www.env.gov.bc.ca/epd/remediation/leg_regs/csr.htm. Accessed March 2016.
4. United States Environmental Protection Agency (US EPA) Regional Screening Levels for Residential Tapwater (RSL) (updated as of November 2014). Available at: http://www.epa.gov/region9/superfund/prg/. Accessed March 2016. Non-carcinogenic values are multiplied by 0.2 and carcinogenic values are multipled by 10 to adjust to a target Hazard Quotient of 0.2 and an Incremental Lifetime Cancer Risk of 1x10⁻⁵, respectively. Where both non-carcinogenic and carcinogenic RSLs were available for a parameter, the lower of the two adjusted values was selected as the screening level. RSLs are only shown when health-based BC CSR, BC WQG and Health Canada Drinking Water Guidelines screening values are not available.
2. British Columbia Water Quality Guidelines (BC WQG). Available at: http://www.env.gov.bc.ca/wat/wq/wq_guidelines.html#approved. Accessed March 2016
e. Protective of human health, based on toxicological reference value protective of adults. Standards may not address aesthetic concerns related to drinking water quality and water treatment may be required.
ParameterBC CSR -
Drinking Water1 NotesBC WQG -
Drinking Water2 NotesHealth Canada Drinking Water
Guidelines3Notes
US EPA RSL (Tap
water)4 NotesSelected
Screening
Value5
Conservative Scenario Baseline
Surface Water Quality
Maximum6 Year
Does Maximum Exceed
Screening Value?
Is % Change Greater than
10%?
Is Parameter a COPC?
Conservative Scenario Baseline
Surface Water Quality
Maximum6 Year
Does Maximum Exceed
Screening Value?
Is % Change Greater than
10%?
Is Parameter a COPC?
27 30 Year 1 No Yes No 27 33 Closure No Yes No1.0 5.4 Year 1 NG Yes Yes 5.0 5.4 Year 1 NG No No3.7 3.8 Year 1 NG No No 3.9 3.9 Closure NG No No
1.24 1.3 Year 1 NG No No 1.4 1.3 Closure NG No No0.60 0.60 Year 1 No No No 1.7 1.7 Closure No No No
0.010 0.010 Year 1 No No No 0.027 0.027 Closure No No No0.14 0.15 Year 1 No No No 0.18 0.16 Closure No No No1.0 1.0 Year 1 NG No No 1.0 1.0 Closure NG No No1.0 1.0 Year 1 No No No 1.0 1.1 Closure No No No
0.93 0.93 Year 1 No No No 3.3 3.3 Closure No No No
0.0025 0.0025 Year 1 NG No No 0.035 0.035 Closure NG No No0.47 0.51 Year 1 No No No 0.33 0.33 Closure No No No
0.00050 0.00050 Year 1 No No No 0.0025 0.0025 Year 16 No No No0.087 0.089 Year 1 NG No No 0.38 0.38 Closure NG No No
0.0039 0.0039 Year 1 No No No 0.011 0.011 Closure Yes No No
0.11 0.12 Year 1 No No No 0.099 0.099 Closure No No No0.00025 0.00025 Year 1 No No No 0.00025 0.00025 Closure No No No0.00025 0.00025 Year 1 No No No 0.00050 0.00050 Closure No No No
0.010 0.010 Year 1 No No No 0.010 0.010 Closure No No No0.00050 0.00050 Year 1 No No No 0.00050 0.00050 Closure No No No
0.050 0.050 Year 1 No No No 0.050 0.050 Closure No No No0.0000085 0.0000085 Year 1 No No No 0.000027 0.000027 Year 16 No No No
0.00050 0.00050 Year 1 No No No 0.00050 0.00050 Closure No No No0.00015 0.00015 Year 1 No No No 0.00025 0.00025 Closure No No No0.00050 0.00050 Year 1 No No No 0.00074 0.00074 Closure No No No
0.015 0.015 Year 1 No No No 0.025 0.025 Closure No No No0.00025 0.00025 Year 1 No No No 0.00025 0.00025 Closure No No No0.0025 0.0025 Year 1 No No No 0.0025 0.0025 Closure No No No0.0019 0.0019 Year 1 No No No 0.0011 0.0011 Closure No No No
0.0000050 0.0000050 Year 1 No No No 0.000010 0.000010 Year 15 No No No0.00050 0.00050 Year 1 No No No 0.00050 0.00050 Closure No No No0.00050 0.00050 Year 1 No No No 0.00068 0.00068 Closure No No No0.00050 0.00050 Year 1 No No No 0.00050 0.00050 Closure No No No
- 6.0 Year 1 NG - No - 6.0 Closure NG - No0.000010 0.000010 Year 1 No No No 0.00010 0.00010 Year 1 No No No0.00010 0.00010 Year 1 No No No 0.00010 0.00010 Closure No No No0.00025 0.00025 Year 1 No No No 0.0025 0.0025 Year 14 No No No0.0050 0.0050 Year 1 NG No No 0.0050 0.0050 Closure NG No No
0.00022 0.00022 Year 1 No No No 0.00020 0.00020 Closure No No No0.00050 0.00050 Year 1 No No No 0.0025 0.0025 Closure No No No0.0025 0.0025 Year 1 No No No 0.0025 0.0025 Closure No No No
0.17 0.17 Year 1 No No No 0.13 0.13 Year 16 No No No0.00025 0.00025 Year 1 No No No 0.00025 0.00025 Closure No No No0.00025 0.00025 Year 1 No No No 0.00050 0.00050 Closure No No No
0.010 0.010 Year 1 No No No 0.010 0.010 Closure No No No0.00050 0.00050 Year 1 No No No 0.00050 0.00050 Closure No No No
0.050 0.050 Year 1 No No No 0.050 0.050 Closure No No No0.000016 0.000017 Year 1 No No No 0.000034 0.000034 Closure No No No0.00050 0.00050 Year 1 No No No 0.00050 0.00050 Closure No No No0.00015 0.00015 Year 1 No No No 0.00025 0.00025 Closure No No No0.00050 0.00050 Year 1 No No No 0.0024 0.0024 Closure No No No
0.069 0.073 Year 1 No No No 0.042 0.043 Closure No No No0.00025 0.00025 Year 1 No No No 0.00025 0.00025 Closure No No No0.0025 0.0025 Year 1 No No No 0.0025 0.0025 Closure No No No0.0023 0.0023 Year 1 No No No 0.0015 0.0015 Closure No No No
0.0000050 0.0000050 Year 1 No No No 0.000014 0.000014 Closure No No No0.00050 0.00050 Year 1 No No No 0.00050 0.00050 Closure No No No0.00050 0.00050 Year 1 No No No 0.0010 0.0010 Closure No No No0.00050 0.00050 Year 1 No No No 0.00050 0.00050 Closure No No No
0.000010 0.000010 Year 1 No No No 0.00010 0.00010 Year 14 No No No0.00010 0.00010 Year 1 No No No 0.00010 0.00010 Closure No No No0.00025 0.00025 Year 1 No No No 0.0025 0.0025 Closure No No No0.0050 0.0050 Year 1 NG No No 0.0050 0.0050 Closure NG No No
0.00024 0.00024 Year 1 No No No 0.00020 0.00020 Closure No No No0.00050 0.00050 Year 1 No No No 0.0025 0.0025 Closure No No No0.0025 0.0025 Year 1 No No No 0.0051 0.0051 Closure No No No
MCF-7MCF-1
O:\Final\2011\1422\11-1422-0046\1114220046-565-R-Rev0\Tables\Tables 1 to 2_APP 9.1-C.xlsx Golder Associates Ltd. Page 2 of 2

4/5/2016 Table 9.1-C-2: Soil Screening - Application CasePublic Health Assessment
Proposed Burnco Aggregate Project
11-1422-0046
BC Regional Background
Residential Land Use Notes Industrial
Land Use Notes Residential Land Use Notes Industrial
Land Use Notes Lower Mainland
Aluminum (Al) 45,000 45,000 44,000 44,001 McNab Creek Strata No NG Yes NoAntimony (Sb) 20 G 40 G 20 G 40 G 15 20 1.14 1.14 McNab Creek Strata No No Yes NoArsenic (As) 100 I 300 I 12 SI 12 SI 20 12 15.8 15.8 McNab Creek Strata No Yes Yes NoBarium (Ba) 6500 I >1,000,000 I 6800 DC 130000 DC 300 6500 217 217 McNab Creek Strata No No Yes NoBeryllium (Be) 4 G 8 G 75 DC 1400 DC 1.5 4 0.378 0.378 McNab Creek Strata No No Yes NoBismuth (Bi) - - 0.308 0.308 McNab Creek Strata No NG NC No (NG)Cadmium (Cd) 3 Ia 3500 I 14 SI 2090 SI 0.4 3 0.188 0.188 McNab Creek Strata No No Yes NoCalcium (Ca) 8000 8000 4132 4132 McNab Creek Strata No NG NC NoChromium (Cr) 100 I b 20000 I b 220 SI c 6700 SI c 80 100 35.8 35.8 McNab Creek Strata No No Yes NoCobalt (Co) 50 G 300 G 50 G 300 G 30 50 11.1 11.1 McNab Creek Strata No No Yes NoCopper (Cu) 15000 I 200000 I 1100 SI 20000 SI 45 1100 40.2 40.2 McNab Creek Strata No No Yes NoIron (Fe) 45,000 45,000 28,001 28,003 McNab Creek Strata No NG Yes NoLead (Pb) 400 I 4000 I 140 SI 8200 SI 60 140 58.0 58.0 McNab Creek Strata No No Yes NoLithium (Li) 1600 G 20000 G - 1600 17.1 17.1 McNab Creek Strata No No NC NoMagnesium (Mg) 10,000 10,000 8114 8114 McNab Creek Strata No NG NC NoManganese (Mn) 1800 G 19000 G 800 1800 497 497 McNab Creek Strata No No Yes NoMercury (Hg) 15 I 2000 I 6.6 SI 690 SI 0.15 6.6 0.382 0.382 McNab Creek Strata No No No NoMolybdenum (Mo) 10 G 40 G 10 G 40 G 1f 10 0.882 0.882 McNab Creek Strata No No Yes NoNickel (Ni) 100 G 500 G 200 SI/DC 5100 DC 80 100 23.1 23.1 McNab Creek Strata No No Yes NoPhosphorus (P) 2000 2000 864 864 McNab Creek Strata No NG NC NoPotassium (K) 5000 5000 2388 2388 McNab Creek Strata No NG NC NoSelenium (Se) 3 G 10 G 80 DC 4050 DC 4f 3 0.565 0.565 McNab Creek Strata No No Yes NoSilver (Ag) 20 G 40 G 20 G 40 G 1f 20 0.140 0.140 McNab Creek Strata No No Yes NoSodium (Na) >1,000,000 I >1,000,000 I 900 1,000,000 658 658 McNab Creek Strata No NG Yes NoStrontium (Sr) 47000 G 100000 G 75 47,000 40.8 40.8 McNab Creek Strata No No Yes NoThallium (Tl) 1 SI , P 1 SI , P - 1 0.135 0.135 McNab Creek Strata No No NC NoTin (Sn) 50 G 300 G 50 G 300 G 4f 50 2.00 2.00 McNab Creek Strata No No Yes NoTitanium (Ti) 2500 2500 1750 1750 McNab Creek Strata No NG Yes NoUranium (U) 16 G 200 G 23 DC 510 DC - 16 3.14 3.14 McNab Creek Strata No No NC NoVanadium (V) 200 G 150 200 73.5 73.5 McNab Creek Strata No No Yes NoZinc (Zn) 10000 I >1,000,000 I 100 10,000 63.4 63.4 McNab Creek Strata No No Yes NoNotes:Units in milligram per kilogram dry weight (mg/kg dw), unless otherwise noted.CSR-Contaminated Sites Regulations Soil Standards-Schedules 4, 5 and 10 BC Regs 375/96, December 16, 1996, updates to January 2014.CCME-Canadian Environmental Quality Guidelines - Canadian Council of Ministers of the Environment, 1999, includes updates to 2015.BC Regional Background soil concentrations were obtained from BC MoE (2010) Protocol 4 - Determining Background Soil Quality, Table 1 - Regional background soil quality estimates for inorganic substances, Lower Mainland. > = greater than; DC = Direct contact; I = Soil Intake; G = Generic guideline or standard; NC = no background concentration available; mg/kg = milligram per kilogram; P = Provisional; SI = Soil ingestion pathwaya. Standard for land used to grow produce for human consumptionb. Standard is for Chromium VIc. Standard is for total chromiumd. Non-toxic essential minerale. Lower of BC CSR and CCME. If a value was not available from BC CSR or CCME, BC regional background was used.f. Background concentration based on half of the detection limit
Is Predicted Application Soil
Concentration >BC CSR or CCME?
Is Parameter a COPC?
BC CSR-Standards for the Protection of Human Health
CCME- Guidelines for the Protection of Human Health Selected
Screening
Valuee
Is Predicted Application Soil
Concentration Below BC Background Concentration?
ParameterMaximum Base Case Soil Concentration (mg/kg dry weight)
Maximum Predicted Application Case Soil Concentration (mg/kg
dry weight)
Location of Maximum Application Soil Concentration
Is Predicted Application Soil
Concentration >Base Case + 10%?
O:\Final\2011\1422\11-1422-0046\1114220046-565-R-Rev0\Tables\Tables 1 to 2_APP 9.1-C.xlsx Golder Associates Ltd. Page 1 of 1

4/5/2016 Table 9.1-C-3: Input Values and Sources Used to Calculate Fish and Shellfish Screening Levels 11-1422-0046
Adult Toddler
Body weight (BW) 70.7 16.5 kg Health Canada 2010Ingestion rate (fish) 0.04 0.02 kg/day Health Canada 2007; eaters only sport/subsistanceIngestion rate (shellfish) 0.009 - kg/day Health Canada 2007; eaters only intakeOral RAF 1 1 unitless Health Canada 2010; default assumptionNon-cancer TRV (oral RfD) see Table 9.1-C-4 see Table 9.1-C-4 mg/kg BW/day Health Canada 2010Cancer TRV (oral slope factor) see Table 9.1-C-4 see Table 9.1-C-4 (mg/kg BW/day)-1 Health Canada 2010Target/acceptable hazard quotient 0.2 0.2 unitless Health Canada 2010Target/acceptable ILCR 1.00E-05 1.00E-05 unitless Health Canada 2010Life stage duration (for carcinogens) 60 N/A years Health Canada 2010Life expectancy (for carcinogens) 80 N/A years Health Canada 2010Days per year consuming fish/shellfish 365 365 days Health Canada 2007
Abbreviations:
ILCR: incramental lifetime cancer risk; kg: kilogram; mg: miligram; RAF: relative absorption factor; RfD: reference dose; TRV: toxicity reference value
References:
Health Canada. 2010. Fereral Contaminated Site Risk Assessment in Canada, Guidance on Human Health Preliminary Quantitaive Risk Assessment (PQRA), Version 2.0.
Health Canada. 2007. Human Health Risk Assessment of Mercury in Fish and Health Benefits of Fish Consumption. Bureau of Chemical Safety Food Directorate Health Products and Food Branch. ON, Canada.
ParameterInput Value
Units Source
O:\Final\2011\1422\11-1422-0046\1114220046-565-R-Rev0\Tables\Tables 3 and 4_APP 9.1-C .xlsx [Equation Inputs] Golder Associates Page 1 of 1
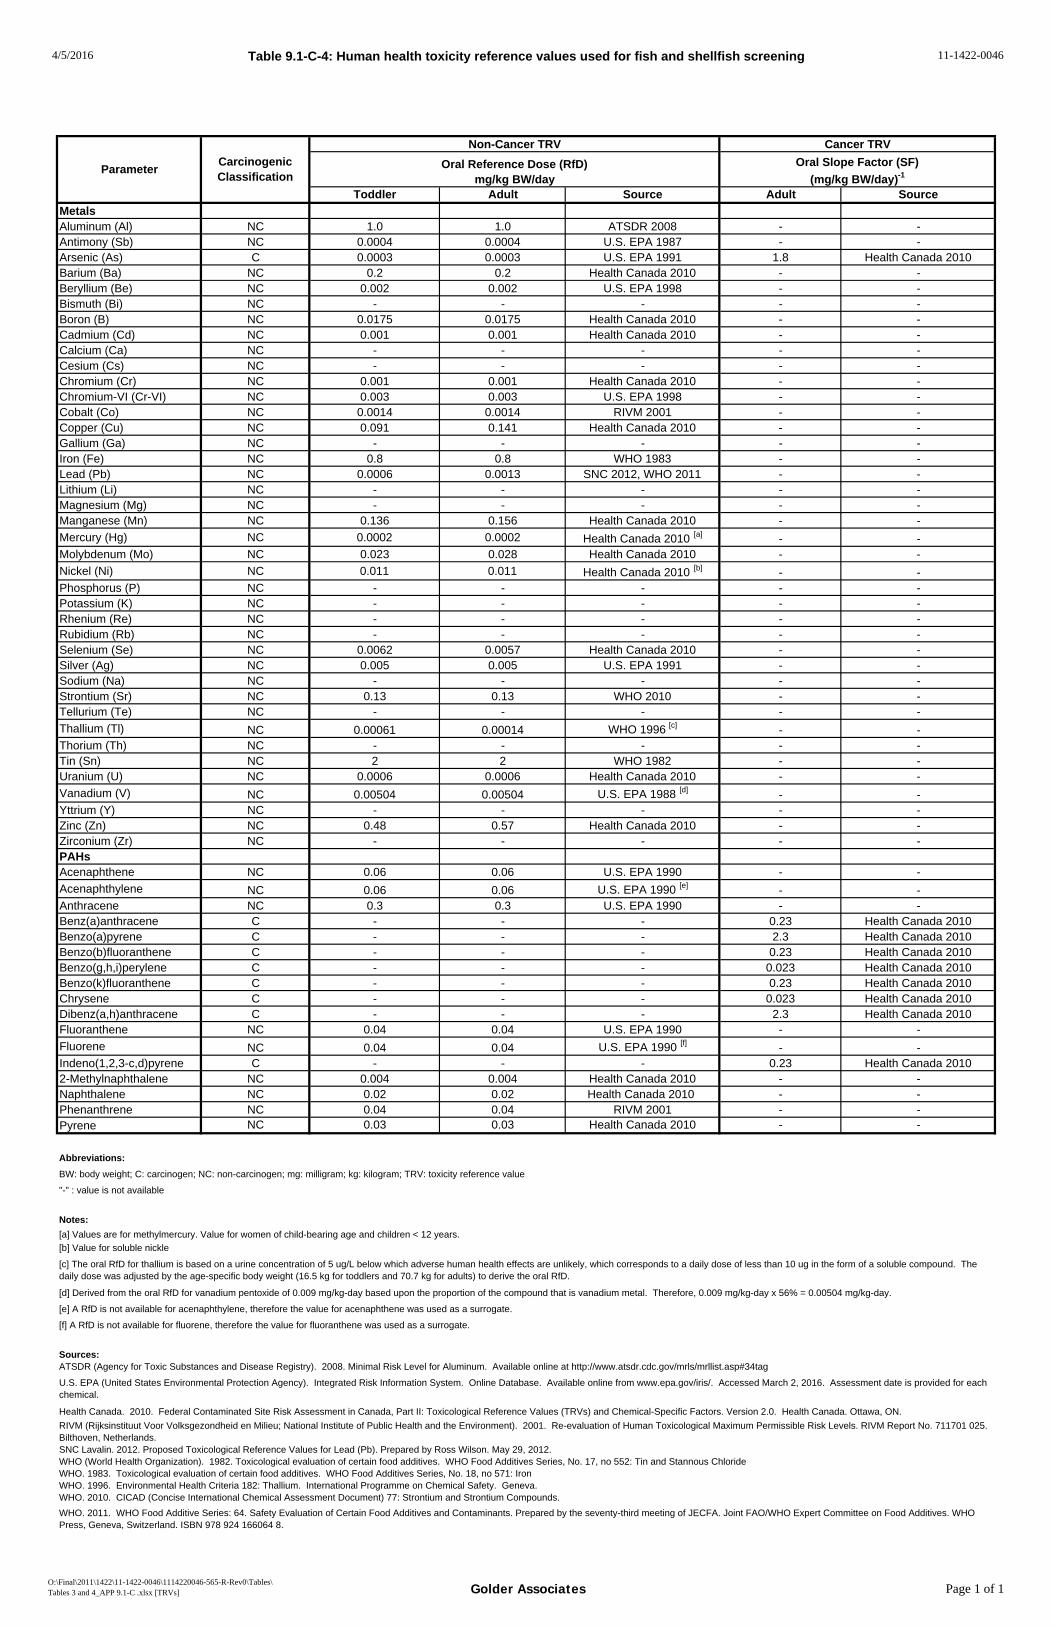
4/5/2016 Table 9.1-C-4: Human health toxicity reference values used for fish and shellfish screening 11-1422-0046
Toddler Adult Source Adult Source
MetalsAluminum (Al) NC 1.0 1.0 ATSDR 2008 - - Antimony (Sb) NC 0.0004 0.0004 U.S. EPA 1987 - - Arsenic (As) C 0.0003 0.0003 U.S. EPA 1991 1.8 Health Canada 2010Barium (Ba) NC 0.2 0.2 Health Canada 2010 - - Beryllium (Be) NC 0.002 0.002 U.S. EPA 1998 - - Bismuth (Bi) NC - - - - - Boron (B) NC 0.0175 0.0175 Health Canada 2010 - - Cadmium (Cd) NC 0.001 0.001 Health Canada 2010 - - Calcium (Ca) NC - - - - - Cesium (Cs) NC - - - - - Chromium (Cr) NC 0.001 0.001 Health Canada 2010 - - Chromium-VI (Cr-VI) NC 0.003 0.003 U.S. EPA 1998 - - Cobalt (Co) NC 0.0014 0.0014 RIVM 2001 - - Copper (Cu) NC 0.091 0.141 Health Canada 2010 - - Gallium (Ga) NC - - - - - Iron (Fe) NC 0.8 0.8 WHO 1983 - - Lead (Pb) NC 0.0006 0.0013 SNC 2012, WHO 2011 - - Lithium (Li) NC - - - - - Magnesium (Mg) NC - - - - - Manganese (Mn) NC 0.136 0.156 Health Canada 2010 - - Mercury (Hg) NC 0.0002 0.0002 Health Canada 2010 [a] - - Molybdenum (Mo) NC 0.023 0.028 Health Canada 2010 - - Nickel (Ni) NC 0.011 0.011 Health Canada 2010 [b] - - Phosphorus (P) NC - - - - - Potassium (K) NC - - - - - Rhenium (Re) NC - - - - - Rubidium (Rb) NC - - - - - Selenium (Se) NC 0.0062 0.0057 Health Canada 2010 - - Silver (Ag) NC 0.005 0.005 U.S. EPA 1991 - - Sodium (Na) NC - - - - - Strontium (Sr) NC 0.13 0.13 WHO 2010 - - Tellurium (Te) NC - - - - - Thallium (Tl) NC 0.00061 0.00014 WHO 1996 [c] - - Thorium (Th) NC - - - - - Tin (Sn) NC 2 2 WHO 1982 - - Uranium (U) NC 0.0006 0.0006 Health Canada 2010 - - Vanadium (V) NC 0.00504 0.00504 U.S. EPA 1988 [d] - - Yttrium (Y) NC - - - - - Zinc (Zn) NC 0.48 0.57 Health Canada 2010 - - Zirconium (Zr) NC - - - - - PAHsAcenaphthene NC 0.06 0.06 U.S. EPA 1990 - - Acenaphthylene NC 0.06 0.06 U.S. EPA 1990 [e] - - Anthracene NC 0.3 0.3 U.S. EPA 1990 - - Benz(a)anthracene C - - - 0.23 Health Canada 2010Benzo(a)pyrene C - - - 2.3 Health Canada 2010Benzo(b)fluoranthene C - - - 0.23 Health Canada 2010Benzo(g,h,i)perylene C - - - 0.023 Health Canada 2010Benzo(k)fluoranthene C - - - 0.23 Health Canada 2010Chrysene C - - - 0.023 Health Canada 2010Dibenz(a,h)anthracene C - - - 2.3 Health Canada 2010Fluoranthene NC 0.04 0.04 U.S. EPA 1990 - - Fluorene NC 0.04 0.04 U.S. EPA 1990 [f] - - Indeno(1,2,3-c,d)pyrene C - - - 0.23 Health Canada 20102-Methylnaphthalene NC 0.004 0.004 Health Canada 2010 - - Naphthalene NC 0.02 0.02 Health Canada 2010 - - Phenanthrene NC 0.04 0.04 RIVM 2001 - - Pyrene NC 0.03 0.03 Health Canada 2010 - -
Abbreviations:
BW: body weight; C: carcinogen; NC: non-carcinogen; mg: milligram; kg: kilogram; TRV: toxicity reference value
"-" : value is not available
Notes:
[a] Values are for methylmercury. Value for women of child-bearing age and children < 12 years.[b] Value for soluble nickle
[d] Derived from the oral RfD for vanadium pentoxide of 0.009 mg/kg-day based upon the proportion of the compound that is vanadium metal. Therefore, 0.009 mg/kg-day x 56% = 0.00504 mg/kg-day.
[e] A RfD is not available for acenaphthylene, therefore the value for acenaphthene was used as a surrogate.
[f] A RfD is not available for fluorene, therefore the value for fluoranthene was used as a surrogate.
Sources:ATSDR (Agency for Toxic Substances and Disease Registry). 2008. Minimal Risk Level for Aluminum. Available online at http://www.atsdr.cdc.gov/mrls/mrllist.asp#34tag
Health Canada. 2010. Federal Contaminated Site Risk Assessment in Canada, Part II: Toxicological Reference Values (TRVs) and Chemical-Specific Factors. Version 2.0. Health Canada. Ottawa, ON.
SNC Lavalin. 2012. Proposed Toxicological Reference Values for Lead (Pb). Prepared by Ross Wilson. May 29, 2012. WHO (World Health Organization). 1982. Toxicological evaluation of certain food additives. WHO Food Additives Series, No. 17, no 552: Tin and Stannous ChlorideWHO. 1983. Toxicological evaluation of certain food additives. WHO Food Additives Series, No. 18, no 571: IronWHO. 1996. Environmental Health Criteria 182: Thallium. International Programme on Chemical Safety. Geneva.WHO. 2010. CICAD (Concise International Chemical Assessment Document) 77: Strontium and Strontium Compounds.
[c] The oral RfD for thallium is based on a urine concentration of 5 ug/L below which adverse human health effects are unlikely, which corresponds to a daily dose of less than 10 ug in the form of a soluble compound. The daily dose was adjusted by the age-specific body weight (16.5 kg for toddlers and 70.7 kg for adults) to derive the oral RfD.
U.S. EPA (United States Environmental Protection Agency). Integrated Risk Information System. Online Database. Available online from www.epa.gov/iris/. Accessed March 2, 2016. Assessment date is provided for each chemical.
RIVM (Rijksinstituut Voor Volksgezondheid en Milieu; National Institute of Public Health and the Environment). 2001. Re-evaluation of Human Toxicological Maximum Permissible Risk Levels. RIVM Report No. 711701 025. Bilthoven, Netherlands.
WHO. 2011. WHO Food Additive Series: 64. Safety Evaluation of Certain Food Additives and Contaminants. Prepared by the seventy-third meeting of JECFA. Joint FAO/WHO Expert Committee on Food Additives. WHO Press, Geneva, Switzerland. ISBN 978 924 166064 8.
ParameterCarcinogenic Classification
Non-Cancer TRV Cancer TRV
Oral Reference Dose (RfD)mg/kg BW/day
Oral Slope Factor (SF)
(mg/kg BW/day)-1
O:\Final\2011\1422\11-1422-0046\1114220046-565-R-Rev0\Tables\Tables 3 and 4_APP 9.1-C .xlsx [TRVs] Golder Associates Page 1 of 1

CHEMICAL DATA SCREENING FOR MULTIMEDIA ASSESSMENT
April 5, 2016 Report No. 1114220046-565-R-Rev0
ATTACHMENT 1 Screened Baseline Soil and Tissue Concentrations

Table 1: Baseline Soil ScreeningPublic Health Assessment
Proposed Burnco Aggregate Project
4/5/2016 11-1422-0046
Sample ID 13-BRP-S-01 13-BRP-S-02 13-BRP-S-03 13-BRP-S-04 13-BRP-S-05 13-BRP-S-06 13-BRP-S-07 13-BRP-S-08 13-BRP-S-09Date Sampled 19-Aug-13 19-Aug-13 19-Aug-13 19-Aug-13 19-Aug-13 19-Aug-13 19-Aug-13 19-Aug-13 19-Aug-13ALS Sample ID L1350062-11 L1350062-12 L1350062-13 L1350062-14 L1350062-15 L1350062-16 L1350062-17 L1350062-18 L1350062-19QA/QC FDA
Units Residential Land Use Notes Industrial
Land Use Notes Residential Land Use Notes Industrial
Land Use Notes Lower Mainland
Physical TestspH pH units 4.40 4.05 3.63 3.65 5.01 4.83 5.02 5.23 5.85MetalsAluminum (Al) mg/kg 45,000 45,000 16,600 11,400 3420 3910 17,000 44,000 12,600 18,400 17,000Antimony (Sb) mg/kg 20 G 40 G 20 G 40 G 15 20 0.53 0.53 0.80 1.14 0.34 0.17 0.25 0.32 0.34Arsenic (As) mg/kg 100 I 300 I 12 SI 12 SI 20 12 13.4 12.7 4.77 8.64 15.7 5.39 9.49 11.5 10.8Barium (Ba) mg/kg 6500 I >1,000,000 I 6800 DC 130000 DC 300 6500 70.5 57.6 34.0 67.1 75.9 217 76.4 78.0 61.2Beryllium (Be) mg/kg 4 G 8 G 75 DC 1400 DC 1.5 4 <0.20 <0.20 <0.20 <0.20 <0.20 0.36 <0.20 <0.20 0.21Bismuth (Bi) mg/kg - - 0.21 0.23 <0.20 0.29 <0.20 <0.20 <0.20 <0.20 <0.20Cadmium (Cd) mg/kg 3 Ia 3500 I 14 SI 2090 SI 0.4 3 0.137 0.157 0.186 0.133 0.101 0.090 0.051 0.073 0.106Calcium (Ca) mg/kg 8000 8000 3080 4130 2990 4040 2870 3530 2740 3190 3070Chromium (Cr) mg/kg 100 I b 20000 I b 220 SI c 6700 SI c 80 100 21.9 16.6 5.14 7.50 25.6 23.1 29.0 30.2 35.8Cobalt (Co) mg/kg 50 G 300 G 50 G 300 G 30 50 6.32 4.31 1.01 1.40 9.76 11.1 6.44 8.19 7.46Copper (Cu) mg/kg 15000 I 200000 I 1100 SI 20000 SI 45 1100 24.7 23.2 21.8 14.4 26.5 40.2 26.9 23.8 24.3Iron (Fe) mg/kg 45,000 45,000 17,900 13,100 3640 4870 19,100 28,000 18,200 22,000 22,100Lead (Pb) mg/kg 400 I 4000 I 140 SI 8200 SI 60 140 36.1 37.2 58.0 46.1 5.20 6.61 3.00 3.40 5.44Lithium (Li) mg/kg 1600 G 20000 G - 1600 10.8 7.1 <5.0 <5.0 16.1 14.9 15.2 14.7 16.9Magnesium (Mg) mg/kg 10,000 10,000 4180 3040 638 1130 4800 8110 4730 5310 5910Manganese (Mn) mg/kg 1800 G 19000 G 800 1800 202 178 119 36.8 297 497 228 316 391Mercury (Hg) mg/kg 15 I 2000 I 6.6 SI 690 SI 0.15 6.6 0.105 0.329 0.380 0.336 0.0336 0.0230 0.0085 0.0264 0.0117Molybdenum (Mo) mg/kg 10 G 40 G 10 G 40 G 1 HDL 10 0.88 0.79 0.63 0.59 0.62 0.72 0.51 0.75 0.82Nickel (Ni) mg/kg 100 G 500 G 200 SI/DC 5100 DC 80 100 11.8 12.0 7.51 7.23 18.7 17.6 19.7 16.3 23.1Phosphorus (P) mg/kg 2000 2000 325 592 853 713 483 704 406 364 408Potassium (K) mg/kg 5000 5000 890 960 500 340 1850 2320 1710 1490 1760Selenium (Se) mg/kg 3 G 10 G 80 DC 4050 DC 4 HDL 3 0.42 0.40 0.40 0.53 <0.20 <0.20 <0.20 0.27 <0.20Silver (Ag) mg/kg 20 G 40 G 20 G 40 G 1 HDL 20 <0.10 <0.10 <0.10 0.14 <0.10 <0.10 <0.10 <0.10 <0.10Sodium (Na) mg/kg >1,000,000 I >1,000,000 I 900 1,000,000 590 400 180 180 390 300 370 490 510Strontium (Sr) mg/kg 47000 G 100000 G 75 47,000 24.6 25.7 17.5 29.2 19.3 40.8 20.6 22.3 22.7Thallium (Tl) mg/kg 1 SI , P 1 SI , P - 1 0.103 0.094 <0.050 <0.050 0.117 0.110 0.101 0.131 0.104Tin (Sn) mg/kg 50 G 300 G 50 G 300 G 4 HDL 50 <2.0 <2.0 <2.0 <2.0 <2.0 <2.0 <2.0 <2.0 <2.0Titanium (Ti) mg/kg 2,500 2,500 827 498 133 188 666 1750 528 711 573Uranium (U) mg/kg 16 G 200 G 23 DC 510 DC - 16 1.98 1.39 0.254 0.209 3.14 0.803 1.24 2.14 0.502Vanadium (V) mg/kg 200 G 150 200 53.7 36.2 12.1 16.5 49.9 73.5 50.6 70.0 56.6Zinc (Zn) mg/kg 10000 I >1,000,000 I 100 10,000 35.5 38.3 34.7 33.2 44.5 63.1 41.5 43.8 57.6Notes:CSR-Contaminated Sites Regulations Soil Standards-Schedules 4, 5 and 10 BC Regs 375/96, December 16, 1996, updates to January 2014.CCME-Canadian Environmental Quality Guidelines - Canadian Council of Ministers of the Environment, 1999, includes updates to 2015.BC Regional Background soil concentrations were obtained from BC MoE (2010) Protocol 4 - Determining Background Soil Quality, Table 1 - Regional background soil quality estimates for inorganic substances, Lower Mainland. 1. Where screening values were not available from BC CSR or CCME, US EPA RSLs (Regional Screening Levels) for Residential Soils (2014) were used. RSLs were adjusted from an HQ = 1 to HQ = 0.2 by dividing by 5.2. Non-toxic essential mineral
a. Standard for land used to grow produce for human consumptionb. Standard is for chromium VIc. Standard is for total chromiumd. Lower of BC CSR and CCME. If a value was not available from BC CSR or CCME, BC regional background was used.
< = below laboratory detection limit; DC = Direct contact; I = Soil Intake; FD = Field duplicate; FDA = Field duplicate available; G = Generic guideline or standard; HDL = Half the detection limit; mg/kg = milligram per kilogram; P = Provisional; QA/QC = Quality assurance/quality control; SI = Soil ingestion pathway; US EPA = United States Environmental Protection Agency.
Selected Screening
Valued
BC Regional Background
CCME- Guidelines for the Protection of Human Health
BC CSR-Standards for the Protection of Human Health
O:\Final\2011\1422\11-1422-0046\1114220046-565-R-Rev0\ATT 1\ATT 1_Baseline Screening Tables March 2016.xlsx [Table 1 soil baseline] Golder Associates Page 1 of 1

Table 2: Baseline Fish Tissue ScreeningPublic Health Assessment
Proposed Burnco Aggregate Project
4/5/2016 11-1422-0046
Location McNab CreekSample ID ONCLDate Sampled 9-Dec-13Matrix TissueUnits mg/kg wwtPhysical Tests% Moisture - 76.2MetalsAluminum (Al) 165 1.68Antimony (Sb) 0.07 0.0047Arsenic (As) 0.01 0.381Barium (Ba) 33.0 0.058Beryllium (Be) 0.33 <0.0020Bismuth (Bi) - <0.0020Boron (B) 2.89 <0.20Cadmium (Cd) 0.17 0.0083Calcium (Ca) - 1260Cesium (Cs) - 0.0230Chromium (Cr) 0.17 2 0.259Chromium (Cr) 0.50 3 0.259Cobalt (Co) 0.23 0.0112Copper (Cu) 15.0 1.62Gallium (Ga) - <0.0040Iron (Fe) 132 15.0Lead (Pb) 0.10 2.35Lithium (Li) - <0.020Magnesium (Mg) - 364Manganese (Mn) 22.4 0.335Mercury (Hg) 0.03 4 0.099Molybdenum (Mo) 3.80 0.0175Nickel (Ni) 1.82 5 0.097Phosphorus (P) - 3190Potassium (K) - 3850Rhenium (Re) - <0.0020Rubidium (Rb) - 1.53Selenium (Se) 1.02 0.489Silver (Ag) 0.83 0.0018Sodium (Na) - 509Strontium (Sr) 21.5 4.62Tellurium (Te) - <0.0040Thallium (Tl) 0.10 0.00062Thorium (Th) - <0.0020Tin (Sn) 330 <0.020Uranium (U) 0.10 <0.00040Vanadium (V) 0.83 0.104Yttrium (Y) - <0.0020Zinc (Zn) 79.2 34.5Zirconium (Zr) - <0.040Notes:
4. Screening value for methylmercury5. Screening value for soluble nickel
Value indicates exceedance of the screening level
Value indicates detection limit exceeds the screening level
"-" = no value; < = below laboratory detection limit; mg/kg wwt = milligrams per kilogram in wet weight; ONCL= cutthroat trout.
Fish Screening Level 1 Notes
1. Screening values determined using Health Canada (2010) ingestion of contaminated foods equation. Details provided in text.2. Screening value for chromium VI; speciation data is not available, therefore, the total chromium concentration is compared to both the chromium VI and chromium III screening values.3. Screening value for chromium III; speciation data is not available, therefore, the total chromium concentration is compared to both the chromium VI and chromium III screening values.
O:\Final\2011\1422\11-1422-0046\1114220046-565-R-Rev0\ATT 1\ATT 1_Baseline Screening Tables March 2016.xlsx [Table 2 fish baseline] Golder Associates Page 1 of 1

Table 3: Baseline Crab Tissue ScreeningPublic Health Assessment
Proposed Burnco Aggregate Project
4/5/2016 11-1422-0046
Location
Sample ID CP CRAB-TS-1 CP CRAB-TS-2 CP CRAB-TS-3 CP CRAB-TS-4 CP CRAB-TS-5 CP CRAB-TS-6 CP CRAB-TS-7 CP CRAB-TS-1 CP CRAB-TS-2 CP CRAB-TS-3 CP CRAB-TS-4 CP CRAB-TS-5 CP CRAB-TS-6 CP CRAB-TS-7
Date Sampled 5-Dec-13 5-Dec-13 5-Dec-13 5-Dec-13 5-Dec-13 5-Dec-13 5-Dec-13 5-Dec-13 5-Dec-13 5-Dec-13 5-Dec-13 5-Dec-13 5-Dec-13 5-Dec-13Matrix
Physical Tests% Moisture - 81.5 84.2 84.2 81.0 82.0 82.9 81.8 75.0 86.7 90.5 88.1 88.9 91.3 86.6MetalsAluminum (Al) 367 0.98 1.11 3.52 3.71 2.15 1.71 4.23 2.21 3.86 8.77 1.85 13.9 3.35 2.51Antimony (Sb) 0.15 <0.0020 <0.0020 0.0023 <0.0020 0.0028 <0.0020 <0.0020 0.0024 0.0061 <0.0020 <0.0020 0.0040 0.0029 0.0026Arsenic (As) 0.06 3.76 3.10 9.48 3.50 11.60 1.66 4.84 3.81 1.72 5.45 1.82 6.31 1.06 3.15Barium (Ba) 73.3 0.015 0.021 0.047 0.071 0.048 0.023 0.038 0.047 0.129 0.108 0.144 0.840 0.071 0.135Beryllium (Be) 0.73 <0.0020 <0.0020 <0.0020 <0.0020 <0.0020 <0.0020 <0.0020 <0.0020 <0.0020 <0.0020 <0.0020 <0.0020 <0.0020 <0.0020Bismuth (Bi) - <0.0020 <0.0020 0.0044 <0.0020 0.0064 <0.0020 0.0020 <0.0020 <0.0020 <0.0020 <0.0020 0.0023 <0.0020 <0.0020Boron (B) 6.42 0.71 0.88 1.38 1.12 1.37 0.96 1.13 1.11 1.06 1.47 0.88 1.54 0.93 1.16Cadmium (Cd) 0.37 0.0205 0.0180 0.0139 0.0086 0.0144 0.0101 0.0131 0.1980 0.1540 0.0952 0.0486 0.1030 0.0720 0.1140Calcium (Ca) - 642 840 682 927 764 645 450 3000 2870 819 1480 3570 889 1800Cesium (Cs) - 0.0033 0.0030 0.0044 0.0034 0.0032 0.0032 0.0037 0.0035 0.0029 0.0031 0.0026 0.0035 0.0047 0.0054Chromium (Cr) 0.37 2 0.015 0.014 <0.010 0.011 <0.010 0.012 <0.010 0.018 0.106 0.010 0.015 0.065 0.072 0.011Chromium (Cr) 1.10 3 0.015 0.014 <0.010 0.011 <0.010 0.012 <0.010 0.018 0.106 0.010 0.015 0.065 0.072 0.011Cobalt (Co) 0.51 0.0215 0.0315 0.0408 0.0368 0.0518 0.0337 0.0431 0.0644 0.0734 0.0855 0.0557 0.106 0.0884 0.107Copper (Cu) 33.4 5.18 5.43 11.0 8.33 12.3 9.06 12.5 6.86 4.85 58.1 10.8 33.1 16.6 30.1Gallium (Ga) - <0.0040 <0.0040 <0.0040 <0.0040 <0.0040 0.0068 <0.0040 <0.0040 <0.0040 <0.0040 <0.0040 <0.0040 <0.0040 <0.0040Iron (Fe) 293 3.41 3.62 7.18 5.01 4.90 3.53 6.71 19.2 37.3 19.4 11.2 19.0 12.3 17.3Lead (Pb) 0.22 <0.0040 <0.0040 0.0062 0.0048 <0.0040 0.0045 <0.0040 0.0222 0.0658 0.123 0.0229 0.0821 0.0233 0.0416Lithium (Li) - 0.098 0.112 0.096 0.073 0.076 0.111 0.051 0.130 0.095 0.146 0.089 0.134 0.133 0.089Magnesium (Mg) - 448 543 532 376 445 498 398 745 927 735 509 830 1080 821Manganese (Mn) 49.9 0.0923 0.111 0.123 0.195 0.180 0.106 0.120 0.520 0.883 0.695 0.523 2.57 0.437 1.16Mercury (Hg) 0.07 4 0.0340 0.0298 0.151 0.0544 0.296 0.0248 0.0988 0.0160 0.0533 0.0861 0.0236 0.117 0.0250 0.0518Molybdenum (Mo) 8.43 0.0122 0.0240 0.0124 0.0147 0.0116 0.0390 0.0104 0.0735 0.466 0.0641 0.0601 0.0529 0.437 0.0654Nickel (Ni) 4.03 5 0.017 0.015 0.025 0.012 0.015 0.018 0.011 0.050 0.055 0.027 0.017 0.080 0.062 0.024Phosphorus (P) - 1040 868 999 1270 1120 943 1380 1080 1550 1020 858 1960 1280 2300Potassium (K) - 2550 2300 2550 2670 2530 2330 2670 1800 1050 1330 1260 1550 1420 1950Rhenium (Re) - <0.0020 <0.0020 <0.0020 <0.0020 <0.0020 <0.0020 <0.0020 <0.0020 <0.0020 <0.0020 <0.0020 <0.0020 <0.0020 <0.0020Rubidium (Rb) - 0.820 0.750 0.701 0.719 0.667 0.790 0.660 0.731 0.480 0.450 0.517 0.605 0.845 0.846Selenium (Se) 2.27 0.288 0.298 0.326 0.331 0.427 0.271 0.330 0.649 0.618 0.559 0.340 0.532 0.399 0.769Silver (Ag) 1.83 0.0357 0.0555 0.0569 0.0539 0.0772 0.0843 0.100 0.0799 0.136 0.877 0.107 0.414 0.217 0.566Sodium (Na) - 4490 5560 4810 3980 3800 5090 3350 5550 4510 5610 4220 5420 5550 5240Strontium (Sr) 47.7 7.28 14.5 8.10 11.2 9.01 8.29 4.30 23.9 36.6 13.7 20.3 64.0 13.2 31.5Tellurium (Te) - <0.0040 <0.0040 <0.0040 <0.0040 <0.0040 <0.0040 <0.0040 <0.0040 <0.0040 <0.0040 <0.0040 <0.0040 <0.0040 <0.0040Thallium (Tl) 0.22 <0.00040 <0.00040 <0.00040 <0.00040 <0.00040 <0.00040 <0.00040 <0.00040 0.00066 <0.00040 <0.00040 <0.00040 <0.00040 <0.00040Thorium (Th) - <0.0020 <0.0020 <0.0020 <0.0020 <0.0020 <0.0020 <0.0020 <0.0020 <0.0020 <0.0020 <0.0020 <0.0020 <0.0020 <0.0020Tin (Sn) 733 <0.020 <0.020 <0.020 <0.020 <0.020 <0.020 <0.020 0.058 0.089 0.084 0.049 0.043 0.054 <0.020Uranium (U) 0.22 0.00080 0.00094 0.00840 0.00098 0.00054 0.00055 0.00049 0.0350 0.0898 0.00743 0.0169 0.0256 0.0218 0.0201Vanadium (V) 1.85 <0.020 <0.020 <0.020 <0.020 <0.020 <0.020 <0.020 0.029 0.066 0.043 0.026 0.074 0.108 0.037Yttrium (Y) - <0.0020 <0.0020 <0.0020 <0.0020 <0.0020 <0.0020 <0.0020 0.0030 0.0148 0.0042 <0.0020 0.0108 0.0033 0.0036Zinc (Zn) 176 26.1 26.4 29.8 28.4 30.5 27.0 32.3 10.1 10.9 10.3 8.21 10.7 9.23 23.2Zirconium (Zr) - <0.040 <0.040 <0.040 <0.040 <0.040 <0.040 <0.040 <0.040 <0.040 <0.040 <0.040 <0.040 <0.040 <0.040Notes:Units in milligram per kilogram wet weight (mg/kg ww) unless otherwise specified.1. Screening values determined using Health Canada (2010) ingestion of contaminated foods equation. Details provided in text.2. Screening value for chromium VI; speciation data is not available, therefore, the total chromium concentration is compared to both the chromium VI and chromium III screening values.3. Screening value for chromium III; speciation data is not available, therefore, the total chromium concentration is compared to both the chromium VI and chromium III screening values.4. Screening value for methylmercury5. Screening value for soluble nickel "-" = no value; < = below laboratory detection limit; FDA = Field duplicate available; QA/QC = Quality assurance/quality control.
Value indicates exceedance of the screening levelValue indicates detection limit exceeds the screening level
Camp Potlatch
Muscle Tissue Organ Tissue
Shellfish Screening Level 1
Notes
O:\Final\2011\1422\11-1422-0046\1114220046-565-R-Rev0\ATT 1\ATT 1_Baseline Screening Tables March 2016.xlsx [Table 3 Crab baseline] Golder Associates Page 1 of 2

Table 3: Baseline Crab Tissue ScreeningPublic Health Assessment
Proposed Burnco Aggregate Project
4/5/2016 11-1422-0046
Location
Sample ID
Date SampledMatrix
Physical Tests% Moisture -MetalsAluminum (Al) 367Antimony (Sb) 0.15Arsenic (As) 0.06Barium (Ba) 73.3Beryllium (Be) 0.73Bismuth (Bi) -Boron (B) 6.42Cadmium (Cd) 0.37Calcium (Ca) -Cesium (Cs) -Chromium (Cr) 0.37Chromium (Cr) 1.10Cobalt (Co) 0.51Copper (Cu) 33.4Gallium (Ga) -Iron (Fe) 293Lead (Pb) 0.22Lithium (Li) - Magnesium (Mg) -Manganese (Mn) 49.9Mercury (Hg) 0.07Molybdenum (Mo) 8.43Nickel (Ni) 4.03Phosphorus (P) -Potassium (K) -Rhenium (Re) -Rubidium (Rb) -Selenium (Se) 2.27Silver (Ag) 1.83Sodium (Na) -Strontium (Sr) 47.7Tellurium (Te) -Thallium (Tl) 0.22Thorium (Th) -Tin (Sn) 733Uranium (U) 0.22Vanadium (V) 1.85Yttrium (Y) -Zinc (Zn) 176Zirconium (Zr) - Notes:Units in milligram per kilogram wet weight (mg/kg ww) un1. Screening values determined using Health Canada (202. Screening value for chromium VI; speciation data is no3. Screening value for chromium III; speciation data is no4. Screening value for methylmercury5. Screening value for soluble nickel "-" = no value; < = below laboratory detection limit; FDA =
Value indicates exceedance ofValue indicates detection limit e
Shellfish Screening Level 1
MCNAB - CRAB-TS-1
MCNAB - CRAB-TS-2
MCNAB - CRAB-TS-3
MCNAB - CRAB-TS-4
MCNAB - CRAB-TS-5
MCNAB - CRAB-TS-6
MCNAB - CRAB-TS-7
MCNAB - CRAB-TS-9
MCNAB - CRAB-TS-10
MCNAB - CRAB-TS-1
MCNAB - CRAB-TS-2
MCNAB - CRAB-TS-3
MCNAB - CRAB-TS-4
MCNAB - CRAB-TS-5
MCNAB - CRAB-TS-6
MCNAB - CRAB-TS-7
MCNAB - CRAB-TS-9
MCNAB - CRAB-TS-10
5-Dec-13 5-Dec-13 5-Dec-13 5-Dec-13 5-Dec-13 5-Dec-13 5-Dec-13 5-Dec-13 5-Dec-13 5-Dec-13 5-Dec-13 5-Dec-13 5-Dec-13 5-Dec-13 5-Dec-13 5-Dec-13 5-Dec-13 5-Dec-13
80.8 82.8 86.9 79.6 81.3 81.5 88.3 82.5 86.8 90.9 84.7 86.4 79.4 81.8 84.4 88.4 87.6 86.6
1.55 1.80 1.88 1.40 1.11 2.32 2.02 3.73 1.87 0.67 2.68 0.89 5.85 0.99 1.66 1.68 0.73 1.40<0.0020 <0.0020 <0.0020 <0.0020 <0.0020 0.0028 <0.0020 0.0033 <0.0020 0.0033 0.0021 <0.0020 0.0048 0.0020 0.0025 <0.0020 0.0022 <0.0020
2.79 3.71 1.25 2.93 2.80 8.15 1.77 12.20 5.56 1.66 1.96 1.08 3.01 2.66 4.87 1.60 7.12 3.330.021 0.030 0.050 0.029 0.040 0.029 0.064 0.059 0.052 0.314 0.136 0.106 0.089 0.087 0.055 0.085 0.085 0.087
<0.0020 <0.0020 <0.0020 <0.0020 <0.0020 <0.0020 <0.0020 <0.0020 <0.0020 <0.0020 <0.0020 <0.0020 <0.0020 <0.0020 <0.0020 <0.0020 <0.0020 <0.0020<0.0020 <0.0020 <0.0020 <0.0020 <0.0020 <0.0020 <0.0020 0.0046 <0.0020 <0.0020 <0.0020 <0.0020 <0.0020 <0.0020 <0.0020 <0.0020 0.0022 <0.0020
1.47 1.70 1.40 1.56 1.12 1.18 0.87 2.10 1.19 1.23 1.57 1.20 1.28 0.93 1.00 0.90 1.45 1.090.0097 0.0392 0.0121 0.0251 0.0343 0.0229 0.0521 0.0087 0.0384 0.0816 0.2210 0.0371 0.3040 0.3280 0.1540 0.1930 0.0503 0.1100
655 908 815 989 1070 859 1960 895 1110 2160 3390 2750 3220 2410 1510 2420 1370 29800.0038 0.0039 0.0031 0.0040 0.0038 0.0041 0.0027 0.0041 0.0031 0.0040 0.0034 0.0023 0.0046 0.0034 0.0032 0.0024 0.0031 0.00200.018 <0.010 <0.010 <0.010 <0.010 <0.010 <0.010 <0.010 <0.010 0.024 0.010 <0.010 0.016 <0.010 <0.010 <0.010 <0.010 0.0150.018 <0.010 <0.010 <0.010 <0.010 <0.010 <0.010 <0.010 <0.010 0.024 0.010 <0.010 0.016 <0.010 <0.010 <0.010 <0.010 0.015
0.0266 0.0271 0.0257 0.0333 0.0293 0.0387 0.0243 0.0570 0.0416 0.0427 0.0416 0.0380 0.0751 0.0648 0.0797 0.0349 0.0902 0.063910.1 8.68 8.88 8.37 7.57 13.4 4.99 10.5 10.7 15.4 9.55 12.2 17.8 13.5 35.9 6.62 33.5 18.3
<0.0040 <0.0040 <0.0040 <0.0040 <0.0040 <0.0040 <0.0040 <0.0040 <0.0040 <0.0040 <0.0040 <0.0040 <0.0040 <0.0040 <0.0040 <0.0040 <0.0040 <0.00404.64 3.81 3.45 3.53 3.70 6.51 2.96 8.44 4.18 25.7 11.9 4.56 11.7 14.7 19.6 4.46 8.38 8.91
0.0043 <0.0040 <0.0040 <0.0040 <0.0040 0.0041 <0.0040 0.0057 <0.0040 0.0404 0.0273 0.0284 0.0426 0.0096 0.0230 0.0104 0.0141 0.02400.088 0.124 0.158 0.075 0.088 0.083 0.172 0.107 0.161 0.111 0.151 0.175 0.105 0.113 0.121 0.172 0.137 0.158476 578 682 468 437 486 669 602 672 836 1010 889 679 523 584 783 649 707
0.132 0.148 0.134 0.117 0.165 0.373 0.153 2.83 0.338 0.915 1.01 0.334 0.649 0.789 1.94 0.434 3.51 0.6860.0301 0.0493 0.0243 0.0355 0.0297 0.0627 0.0367 0.0932 0.0492 0.0288 0.0470 0.0103 0.0273 0.0160 0.0391 0.0205 0.0488 0.02620.0154 0.0170 0.0140 0.0122 0.0127 0.0160 0.0124 0.0295 0.0135 0.0835 0.0537 0.0301 0.0670 0.0457 0.0453 0.0329 0.0345 0.03050.017 0.015 0.022 0.025 0.013 0.017 0.014 0.020 0.016 0.025 0.028 0.024 0.032 0.021 0.017 0.017 0.022 0.0291020 873 698 1000 1050 996 719 919 700 1460 1580 849 1110 1310 949 958 1300 7192680 2490 1900 2830 2740 2640 1730 2500 1870 1270 1910 1590 2280 2100 1870 1360 1840 1440
<0.0020 <0.0020 <0.0020 <0.0020 <0.0020 <0.0020 <0.0020 <0.0020 <0.0020 <0.0020 <0.0020 <0.0020 <0.0020 <0.0020 <0.0020 <0.0020 <0.0020 <0.00200.732 0.803 0.729 0.815 0.796 0.713 0.649 0.750 0.693 0.607 0.632 0.539 0.832 0.724 0.596 0.544 0.563 0.4430.284 0.377 0.251 0.331 0.314 0.273 0.229 0.415 0.286 0.375 0.603 0.291 0.548 0.526 0.522 0.345 0.521 0.3740.102 0.0839 0.126 0.0860 0.0864 0.115 0.0697 0.145 0.136 0.192 0.194 0.144 0.229 0.290 0.384 0.0826 1.02 0.2344410 5130 6520 3760 4300 4190 8600 4430 6650 4780 6200 7560 5370 5280 5330 7360 5700 72007.38 15.5 21.2 11.9 14.4 10.2 25.5 11.0 23.5 41.7 51.5 51.1 32.2 29.7 18.6 31.0 20.6 38.1
<0.0040 <0.0040 <0.0040 <0.0040 <0.0040 <0.0040 <0.0040 <0.0040 <0.0040 <0.0040 <0.0040 <0.0040 <0.0040 <0.0040 <0.0040 <0.0040 <0.0040 <0.0040<0.00040 <0.00040 <0.00040 <0.00040 <0.00040 <0.00040 <0.00040 <0.00040 <0.00040 <0.00040 <0.00040 <0.00040 <0.00040 <0.00040 <0.00040 <0.00040 <0.00040 <0.00040
0.0029 <0.0020 <0.0020 <0.0020 <0.0020 <0.0020 <0.0020 <0.0020 <0.0020 <0.0020 <0.0020 <0.0020 <0.0020 <0.0020 <0.0020 <0.0020 <0.0020 <0.0020<0.020 0.029 0.035 0.027 0.022 <0.020 0.040 0.065 0.026 0.031 0.122 0.121 0.067 0.102 0.062 0.121 0.111 0.1080.00062 0.00050 0.00045 0.00050 0.00051 0.00119 0.00098 0.00146 0.00261 0.0241 0.0243 0.00594 0.0232 0.0159 0.0268 0.0272 0.0183 0.0422<0.020 <0.020 <0.020 <0.020 <0.020 <0.020 <0.020 0.025 <0.020 0.023 <0.020 <0.020 0.054 0.024 0.028 0.023 0.025 0.029
<0.0020 <0.0020 <0.0020 <0.0020 <0.0020 0.0020 <0.0020 <0.0020 <0.0020 <0.0020 0.0035 <0.0020 0.0039 <0.0020 <0.0020 0.0044 <0.0020 0.002834.2 31.8 24.5 35.3 30.5 33.9 18.6 32.7 21.6 9.08 9.89 9.72 12.2 14.3 15.7 9.24 14.2 8.77
<0.040 <0.040 <0.040 <0.040 <0.040 <0.040 <0.040 <0.040 <0.040 <0.040 <0.040 <0.040 <0.040 <0.040 <0.040 <0.040 <0.040 <0.040
Proposed Project Area
Muscle Tissue Organ Tissue
O:\Final\2011\1422\11-1422-0046\1114220046-565-R-Rev0\ATT 1\ATT 1_Baseline Screening Tables March 2016.xlsx [Table 3 Crab baseline] Golder Associates Page 2 of 2

Table 4: Baseline Mussel ScreeningPublic Health Assessment
Proposed Burnco Aggregate Project
4/5/2016 11-1422-0046
Location
Sample ID BMREF1-T BMREF2-T CP MUSSEL-TS-1A
CP MUSSEL-TS-2
CP MUSSEL-TS-3
CP MUSSEL-TS-4
CP MUSSEL-TS-5
CP MUSSEL-TS-6
CP MUSSEL-TS-7
CP MUSSEL-TS-8 MCM1 MCM2 MCM3 MCNAB-MUSSEL-
TS-1AMCNAB-MUSSEL-
TS-5MCNAB-MUSSEL-
TS-6MCNAB-MUSSEL-
TS-7MCNAB-MUSSEL-
TS-8MCNAB-MUSSEL-
TS-9MCNAB-MUSSEL-
TS-10Date Sampled 12-Sep-12 12-Sep-12 5-Dec-13 5-Dec-13 5-Dec-13 5-Dec-13 5-Dec-13 5-Dec-13 5-Dec-13 5-Dec-13 17-Aug-12 17-Aug-12 17-Aug-12 5-Dec-13 5-Dec-13 5-Dec-13 5-Dec-13 5-Dec-13 5-Dec-13 5-Dec-13Matrix Tissue Tissue Tissue Tissue Tissue Tissue Tissue Tissue Tissue Tissue Tissue Tissue Tissue Tissue Tissue Tissue Tissue Tissue Tissue TissueQA/QC FDA FDAPhysical Tests% Moisture - 83.8 92.6 82.5 81.7 79.4 81.0 79.8 74.4 82.1 80.8 84.4 91.5 90.4 65.3 82.3 81.5 78.1 82.1 82.7 76.3MetalsAluminum (Al) 367 185 84 49.4 40.6 29.5 1160 40.0 87.1 83.9 37.5 171 17.7 145 114 21.1 90.7 19.3 59.5 62.4 91.4Antimony (Sb) 0.15 <0.010 <0.010 0.0025 <0.0020 <0.0020 <0.0020 <0.0020 0.0021 0.0027 <0.0020 <0.010 <0.010 <0.010 0.0059 <0.0020 0.0028 <0.0020 0.0023 0.0028 0.0030Arsenic (As) 0.06 1.09 1.25 1.22 1.76 1.55 0.846 1.04 1.22 1.32 1.17 1.51 0.678 0.794 1.38 1.29 1.30 1.24 1.32 1.18 0.969Barium (Ba) 73.3 1.35 0.948 0.316 0.250 0.189 13.1 0.202 0.443 0.379 0.268 1.68 0.152 1.21 0.750 0.170 0.679 0.176 0.365 0.425 0.569Beryllium (Be) 0.73 <0.10 <0.10 <0.0020 <0.0020 <0.0020 0.0191 <0.0020 <0.0020 <0.0020 <0.0020 <0.10 <0.10 <0.10 0.0021 <0.0020 <0.0020 <0.0020 <0.0020 <0.0020 <0.0020Bismuth (Bi) - <0.030 <0.030 <0.0020 <0.0020 <0.0020 <0.0020 <0.0020 <0.0020 <0.0020 <0.0020 <0.030 <0.030 <0.030 <0.0020 <0.0020 <0.0020 <0.0020 <0.0020 <0.0020 <0.0020Boron (B) 6.42 - - 3.53 4.03 3.82 4.13 3.82 4.05 3.85 3.79 - - - 3.91 3.57 3.02 3.49 3.29 2.97 3.39Cadmium (Cd) 0.37 0.502 0.538 0.428 0.639 0.541 0.450 0.392 0.390 0.399 0.376 0.558 2.13 0.563 0.405 0.307 0.393 0.304 0.449 0.373 0.297Calcium (Ca) - 550 3040 571 709 704 659 573 768 622 596 1730 217 2110 693 614 615 1520 797 540 515Cesium (Cs) - - - 0.0052 0.0036 0.0040 0.338 0.0036 0.0082 0.0061 0.0047 - - - 0.0093 0.0027 0.0078 0.0026 0.0050 0.0054 0.0067Chromium (Cr) 0.37 2 0.22 0.11 0.070 0.103 0.059 0.993 0.033 0.066 0.074 0.069 0.22 <0.10 0.20 0.152 0.055 0.132 0.039 0.117 0.097 0.080Chromium (Cr) 1.10 3 0.22 0.11 0.070 0.103 0.059 0.993 0.033 0.066 0.074 0.069 0.22 <0.10 0.20 0.152 0.055 0.132 0.039 0.117 0.097 0.080Cobalt (Co) 0.51 0.136 0.083 0.0654 0.101 0.0644 0.886 0.0507 0.0615 0.0767 0.0823 0.155 0.026 0.132 0.0859 0.0360 0.0721 0.0432 0.0630 0.0623 0.0596Copper (Cu) 33.4 1.04 0.819 1.04 0.860 1.09 0.623 0.912 0.783 0.948 0.805 1.26 35.7 1.25 1.33 0.735 0.990 1.05 0.936 1.07 0.907Gallium (Ga) - - - 0.0113 0.0078 0.0110 0.321 0.0115 0.0191 0.0186 0.0085 - - - 0.0272 0.0055 0.0245 0.0047 0.0137 0.0136 0.0206Iron (Fe) 293 - - 65.1 49.9 45.8 1410 45.9 63.8 84.7 56.0 - - - 120 38.0 119 33.8 76.8 82.8 99.0Lead (Pb) 0.22 0.046 0.026 0.0758 0.0620 0.0345 0.0613 0.0372 0.0554 0.0449 0.0286 0.091 0.028 0.094 0.465 0.0344 0.0790 0.0365 0.0742 0.0644 0.0736Lithium (Li) - 0.22 0.1 0.164 0.134 0.106 1.41 0.126 0.215 0.146 0.103 0.23 <0.10 0.16 0.139 0.079 0.128 0.066 0.136 0.089 0.119Magnesium (Mg) - 438 435 848 838 1030 1120 862 961 900 798 568 267 344 780 777 726 709 808 645 670Manganese (Mn) 49.9 6.33 3.67 1.79 1.26 1.81 15.5 2.52 2.59 3.30 1.70 6.57 0.992 5.48 4.51 1.98 3.39 2.24 2.82 2.72 2.85Mercury (Hg) 0.07 4 0.0056 0.006 0.0085 0.0152 0.0104 0.0075 0.0066 0.0072 0.0082 0.0066 0.0122 0.0103 0.011 0.0080 0.0065 0.0074 0.0071 0.0088 0.0083 0.0060Molybdenum (Mo) 8.43 0.106 0.036 0.0876 0.103 0.0887 0.0719 0.0654 0.0752 0.133 0.0882 0.078 0.011 0.062 0.101 0.0679 0.0716 0.0757 0.0971 0.0766 0.0683Nickel (Ni) 4.03 5 0.23 0.15 0.141 0.142 0.171 0.851 0.114 0.126 0.202 0.150 0.28 <0.10 0.3 0.236 0.078 0.135 0.107 0.129 0.125 0.131Phosphorus (P) - - - 1050 1400 1410 988 1040 1230 1070 1410 - - - 1230 1520 1310 1730 1220 1200 1060Potassium (K) - - - 1210 1520 1240 1380 1390 1360 1240 1310 - - - 1580 1360 1260 1460 1100 1120 1510Rhenium (Re) - - - <0.0020 <0.0020 <0.0020 <0.0020 <0.0020 <0.0020 <0.0020 <0.0020 - - - <0.0020 <0.0020 <0.0020 <0.0020 <0.0020 <0.0020 <0.0020Rubidium (Rb) - - - 0.564 0.651 0.565 1.66 0.629 0.652 0.588 0.564 - - - 0.723 0.621 0.629 0.666 0.466 0.511 0.691Selenium (Se) 2.27 0.22 0.24 0.327 0.379 0.455 0.276 0.362 0.349 0.419 0.365 0.31 0.2 <0.20 0.387 0.361 0.348 0.441 0.325 0.339 0.368Silver (Ag) 1.83 - - 0.0052 0.0076 0.0057 0.0024 0.0058 0.0067 0.0051 0.0051 - - - 0.0043 0.0046 0.0040 0.0051 0.0034 0.0038 0.0045Sodium (Na) - - - 5720 4840 5350 5860 5930 6050 5710 5480 - - - 4850 5140 4310 4280 4860 3640 4640Strontium (Sr) 47.7 5.37 25.9 6.76 7.59 6.98 8.40 6.73 8.88 7.16 6.98 16.1 2.15 19 7.20 5.96 6.60 8.40 7.34 4.71 5.31Tellurium (Te) - - - <0.0040 <0.0040 <0.0040 <0.0040 <0.0040 <0.0040 <0.0040 <0.0040 - - - <0.0040 <0.0040 <0.0040 <0.0040 <0.0040 <0.0040 <0.0040Thallium (Tl) 0.22 <0.010 <0.010 0.00163 0.00060 0.00123 0.00970 0.00084 0.00093 0.00148 0.00103 <0.010 <0.010 <0.010 0.00342 0.00090 0.00145 0.00167 0.00143 0.00172 0.00206Thorium (Th) - - - 0.0050 0.0045 0.0041 0.0357 0.0028 0.0039 0.0057 0.0024 - - - 0.0142 0.0031 0.0105 0.0026 0.0073 0.0089 0.0105Tin (Sn) 733 <0.050 <0.050 0.088 0.089 0.028 0.052 0.060 0.061 0.064 0.057 <0.050 <0.050 <0.050 0.080 0.064 0.071 0.042 0.055 0.052 0.071Uranium (U) 0.22 0.0765 0.0211 0.0333 0.0581 0.0317 0.0350 0.0200 0.0255 0.0352 0.0247 0.119 0.0299 0.128 0.0515 0.0210 0.0348 0.0231 0.0328 0.0295 0.0236Vanadium (V) 1.85 0.66 0.27 0.229 0.198 0.172 3.76 0.160 0.249 0.446 0.206 0.63 <0.10 0.54 0.336 0.124 0.372 0.094 0.212 0.233 0.294Yttrium (Y) - - - 0.0335 0.0505 0.0227 0.152 0.0163 0.0312 0.0340 0.0157 - - - 0.0550 0.0168 0.0502 0.0166 0.0387 0.0400 0.0424Zinc (Zn) 176 8.07 8.01 10.2 17.5 9.39 9.71 10.4 8.19 8.12 10.4 14.4 210 12.1 12.2 13.1 9.80 12.6 11.3 11.1 11.2Zirconium (Zr) - - - <0.040 <0.040 <0.040 <0.040 <0.040 <0.040 <0.040 <0.040 - - - 0.041 <0.040 <0.040 <0.040 <0.040 <0.040 <0.040Polycyclic Aromatic HydrocarbonsAcenaphthene 22.0 <0.010 <0.010 - - - - - - - - <0.060 <0.040 <0.070 - - - - - - -Acenaphthylene 22.0 <0.010 <0.010 - - - - - - - - <0.060 <0.010 <0.070 - - - - - - -Anthracene 110 <0.010 <0.010 - - - - - - - - <0.060 <0.010 <0.070 - - - - - - -Benz(a)anthracene 0.46 <0.010 <0.010 - - - - - - - - <0.060 <0.010 <0.070 - - - - - - -Benzo(a)pyrene 0.05 <0.010 <0.010 - - - - - - - - <0.060 <0.010 <0.070 - - - - - - -Benzo(b)fluoranthene 0.46 <0.010 <0.010 - - - - - - - - <0.060 <0.010 <0.070 - - - - - - -Benzo(g,h,i)perylene 4.55 <0.010 <0.010 - - - - - - - - <0.060 <0.010 <0.070 - - - - - - -Benzo(k)fluoranthene 0.46 <0.010 <0.010 - - - - - - - - <0.060 <0.010 <0.070 - - - - - - -Chrysene 4.55 <0.010 <0.010 - - - - - - - - <0.060 <0.020 <0.070 - - - - - - -Dibenz(a,h)anthracene 0.05 <0.010 <0.010 - - - - - - - - <0.060 <0.010 <0.070 - - - - - - -Fluoranthene 14.7 <0.010 <0.010 - - - - - - - - <0.060 <0.010 <0.070 - - - - - - -Fluorene 14.7 <0.010 <0.010 - - - - - - - - <0.060 <0.010 <0.070 - - - - - - -Indeno(1,2,3-c,d)pyrene 0.46 <0.010 <0.010 - - - - - - - - <0.060 <0.010 <0.070 - - - - - - -2-methylnaphthalene 1.47 <0.010 <0.010 - - - - - - - - - - - - - - - - - -Naphthalene 7.33 <0.010 <0.010 - - - - - - - - <0.060 <0.010 <0.070 - - - - - - -Phenanthrene 14.7 <0.010 <0.010 - - - - - - - - <0.060 <0.010 <0.070 - - - - - - -Pyrene 11.0 <0.010 <0.030 - - - - - - - - <0.060 <0.010 <0.070 - - - - - - -Notes:Units in milligram per kilogram wet weight (mg/kg ww) unless otherwise specified.1. Screening values determined using Health Canada (2010) ingestion of contaminated foods equation. Details provided in text.2. Screening value for chromium VI; speciation data is not available, therefore, the total chromium concentration is compared to both the chromium VI and chromium III screening values.3. Screening value for chromium III; speciation data is not available, therefore, the total chromium concentration is compared to both the chromium VI and chromium III screening values.4. Screening value for methylmercury5. Screening value for soluble nickel "-" = no value or not measured; < = below laboratory detection limit; FDA = Field duplicate available; QA/QC = Quality assurance/quality control.
Value indicates exceedance of the screening levelValue indicates detection limit exceeds the screening level
Camp Potlatch Proposed Project Area
Shellfish Screening
Level 1Notes
O:\Final\2011\1422\11-1422-0046\1114220046-565-R-Rev0\ATT 1\ATT 1_Baseline Screening Tables March 2016.xlsx [Table 4 mussel baseline] Golder Associates Page 1 of 1

Golder Associates Ltd.
Suite 200 - 2920 Virtual Way
Vancouver, BC, V5M 0C4
Canada
T: +1 (604) 296 4200