12-14 november 2013 (brussels)
TRANSCRIPT
1
Coal gasification in Spain – the future of sustainable coal
Francisco García Peña – ELCOGAS Puertollano IGCC plant
12-14 November 2013 (Brussels)

2
Index
1. The ELCOGAS IGCC power plant
2. Lessons learnt for the future

3
Index
1. The ELCOGAS IGCC power plant
1.1 Introduction
1.2 Description of the IGCC process
1.3 Operational data
1.4 CO2 separation and H2 production
1.5 Flexibility of feeding and products
2. Lessons learnt for the future

4
ELCOGAS is an Spanish
company established in April
1992 to undertake the planning,
construction, management and
operation of a 335 MWeISO IGCC
plant located in Puertollano
(Spain)
Enel, SpA
4,32%
Siemens Project
Ventures GmbH
2,53%
Hidrocantábrico
Explotación de
Centrales SAU
4,32%
Electricité de
France
International, S.A.
31,48%
Endesa
Generación, S.A.
40,99%
Krupp Koppers
GmbH
0,04%
Iberdrola
Generación, S.A.
12,00%
Hidroeléctrica del
Cantábrico, S.A.
4,32%
ENCASUR (open cast coal mine)
REPSOL refinery
Puertollano IGCC Plant
The ELCOGAS company
Shareholders

5
Index
1. The ELCOGAS IGCC power plant
1.1 Introduction
1.2 Description of the IGCC process
1.3 Operational data
1.4 CO2 separation and H2 production
1.5 Flexibility of feeding and products
2. Lessons learnt for the future
6
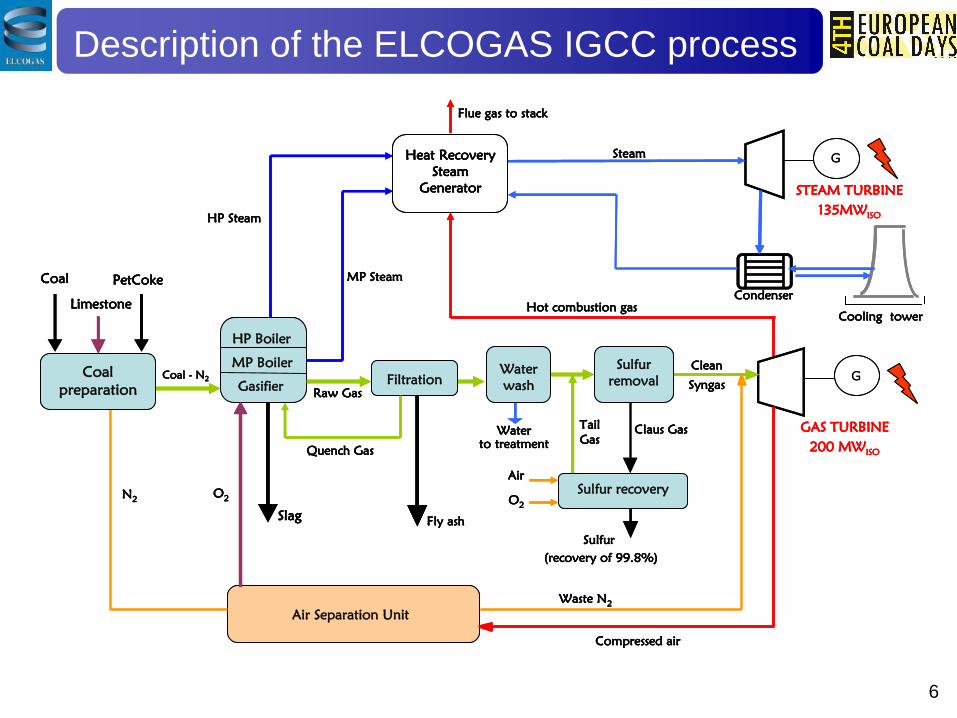
Description of the ELCOGAS IGCC process
G
Flue gas to stack
SteamHeat Recovery
Steam
Generator STEAM TURBINE
135MWISO
Cooling tower
Hot combustion gas
Condenser
GAS TURBINE
200 MWISO
GGasifier
Slag
Sulfur
(recovery of 99.8%)
Quench Gas
O2
Air
Clean
Syngas
Raw Gas
Coal - N2
HP Boiler
MP Boiler
Coal PetCoke
Limestone
Fly ash
Claus Gas
HP Steam
MP Steam
Air Separation Unit
N2
O2
Compressed air
Waste N2
Tail
Gas
Water
to treatment
Coal
preparation
Filtration
Water
wash
Sulfur
removal
Sulfur recovery

7
Description of the ELCOGAS IGCC process
Fuel design values
Syngas composition
Fuel design is a mixture 50/50 of coal/coke which now is 45/55. Moreover some tests with biomass were undertaken (meat bone meal, grape seed meal, olive oil waste).
Real average Design Real average Design
CO (%) 59.26 61.25 CO (%) 59.30 60.51
H2 (%) 21.44 22.33 (%) 21.95 22.08
CO2 (%) 2.84 3.70 2.41 3.87
N2 (%) 13.32 10.50 14.76 12.5
Ar (%) 0.90 1.02 Ar (%) 1.18 1.03
H2S (%) 0.81 1.01 H2S (ppmv) 3 6
COS (%) 0.19 0.17 COS (ppmv) 9 6
HCN (ppmv) 23 38 HCN (ppmv) - 3
RAW GAS CLEAN GAS
H2
N2 (%)
CO2 (%)
COAL PET COKE FUEL MIX(50:50)
Moisture (%w) 11.8 7.00 9.40
Ash (%w) 41.10 0.26 20.68
C (%w) 36.27 82.21 59.21
H (%w) 2.48 3.11 2.80
N (%w) 0.81 1.90 1.36
O (%w) 6.62 0.02 3.32
S (%w) 0.93 5.50 3.21
LHV (MJ/kg) 13.10 31.99 22.55
With those fuels at 50:50, the whole plant demonstrated a gross efficiency of 47,2% and a net efficiency of 42%, under
acceptance tests in 2000 year
8
Index
1. The ELCOGAS IGCC power plant
1.1 Introduction
1.2 Description of the IGCC process
1.3 Operational data
1.4 CO2 separation and H2 production
1.5 Flexibility of feeding and products
2. Lessons learnt for the future

9
1st 5 years: Learning curve
2003: Major overhaul Gas Turbine findings
2004 & 2005: Gas turbine main generation transformer isolation fault
2006: Gas turbine major overhaul & candle fly ash filters crisis
2007 & 2008: ASU WN2 compressor coupling fault and repair MAN TURBO
2010: No operation due to non-profitable electricity price (30-40 days).
2011: 100,000 EOH Major Overhaul
2012: 1,498 hours in stand-by due to regulatory restrictions. (3,969 in 2013)
IGCC, NGCC and Total yearly production
9
335
911
1.39
1
1.59
5
1.37
1
1.29
3
1.12
9
1.15
0
1.13
0
1.16
2 1.52
7
1.43
5
1.35
8
1.16
6
743
836
622
321
343
301
452
421
312
259 32
7
277
263
265
251
0
500
1.000
1.500
2.000
2.500
1998 1999 2000 2001 2002 2003 2004 2005 2006 2007 2008 2009 2010 2011 2012
year
GW
h
NGCC GWh
IGCC GWh
752
1,171
1,533
1,712
1,938
1,6721,744
1,5501,462
1,3891,489
1,8031,698
1,623
1,417
Operational data: Annual energy production

10 ELCOGAS power plant emissions in NGCC & IGCC modes
Natural gas (NGCC)
Coal gas (IGCC)
Natural gas (mg/Nm3 at 6% O2 dry)
250
4
292
294
294
250
13NINI
125
0,46,7
155,3
0
50
100
150
200
250
300
350
SO2 NOx Particles
EEC 88/609EU Directive 2001/80/EECELCOGAS Environmental PermitEU Directive 2010/75/EU DEIELCOGAS 2012 average
Coal gas (mg/Nm3 at 6% O2 dry)
20
650
400
50
200
500
200
5
300
200
111
200,40
100
200
300
400
500
600
700
SO2 NOx Particles
EU Direct ive 88/609/EEC
EU Direct ive 2001/80/EEC
ELCOGAS Environmental Permit
EU Direct ive 2010/75/EEC
ELCOGAS 2012 average
Operational data: Emissions 2012

11
Note: Net energy variable costs (average 2012)
Fuel mode FuelConsume
(GJPCS)
Production
(GWh)
Heat rate
(GJPCS/GWh)
Fuel cost
(€/GJPCS)
Partial cost
(€/MWh)
Total cost
(€/MWh)
GT Natural gas 59.987 2,891 20.748 10,46 216,98 216,98
NGCC Natural gas 249.495 22,154 11.262 10,46 117,77 117,77
NGCC + ASU Natural gas 1.854.675 155,148 11.954 10,46 125,01 125,01
Natural gas 351.147 10.522 10,46 110,03
Coal 67.459 2.021 3,49 7,05
Petocke 195.947 5.871 1,98 11,61
NG auxiliar
consumption257.700 260 10,46 2,71
Coal 2.536.891 2.555 3,49 8,91
Petocke 7.368.734 7.422 1,98 14,67
NGCC+ASU+
Gasifier
(by flare)
33,373 128,69
IGCC 992,811 26,30
Operational data: Variable costs 2012

12
Unavailability in 4 years maintenance cycle (2009–2012)
MAIN IGCC UNAVAILABILITY HOURS PER ISLAND, ACTUAL MAINTENANCE CYCLE 2009 - 2012
0
1000
2000
3000
4000
5000
6000
7000
8000
GA
SIF
ICA
TIO
N
CO
MB
INED
CYC
LE
ASU
BO
P
ho
urs
2009-2012 2012 2011 2010 2009
Technology at demonstration state
First four large coal-based plants (USA & EU, 1994 - 1998) show 60-80% of IGCC availability (> 90 % considering auxiliary fuel)
Main unavailability causes related with its maturity lack :
Auxiliary system design: solid handling, downtime corrosion, ceramic filters, materials and procedures
Performance of last generation turbines with syngas or natural gas
Excessive integration between units. High dependence and start-up delay
More complex process compared to other coal-based plants. Learning is necessary. IGCC power plants using petroleum wastes show higher availability than 92%
Gasification
Combined cycle
ASU BOP

13
0
100
200
300
400
500
600
700
1993 1994 1995 1996 1997
Mil
lio
n E
ur
Fuel handling plant
Cooling system
Control system
A.S.U
B.O.P.
Combined Cycle
Gasification
ACCUMULATED INVESTMENT COSTS
REPRESENTATIVE YEAR (2008) OPERATING COSTS, WITHOUT FINANCIAL COSTS:
Total: 83,602 k€ (57.98 €/MWh) Variable costs:
Fuels: 54,276 k€ (37.59 €/MWh)
Fixed costs:
Total: 29,326 k€ (20.39 €/MWh)
Operational data: Costs

14
Cost Of Electricity (€2012/MWh)

15
Operational data: Economic results
Benefit or lost before taxes is directly related to the
existing regulatory framework
-60
-50
-40
-30
-20
-10
0
10
20
1997
1998
1999
2000
2001
2002
2003
2004
2005
2006
2007
2008
2009
2010
2011
2012
UPA
2013
MLE Transition competition costs PdV RD 134/2010
Regulatory “Gap” + payments
by CO2 not perceived
Losts: Million € 110.7
Law 15/2012
Millio
n
€

16
Index
1. The ELCOGAS IGCC power plant
1.1 Introduction
1.2 Description of the IGCC process
1.3 Operational data
1.4 CO2 separation and H2 production
1.5 Flexibility of feeding and products
2. Lessons learnt for future
17
COMBINED
CYCLE
COAL + COKE
GASIFICATION
Raw gas FILTRATION
SYSTEM
Syngas
PURIFICATION &
DESULPHURATION
Tail gas 1.3 bar
IP STEAM
SHIFTING REACTORS
CO2
CO2 & H2
separation (Chemical, aMDEA)
100 t/d
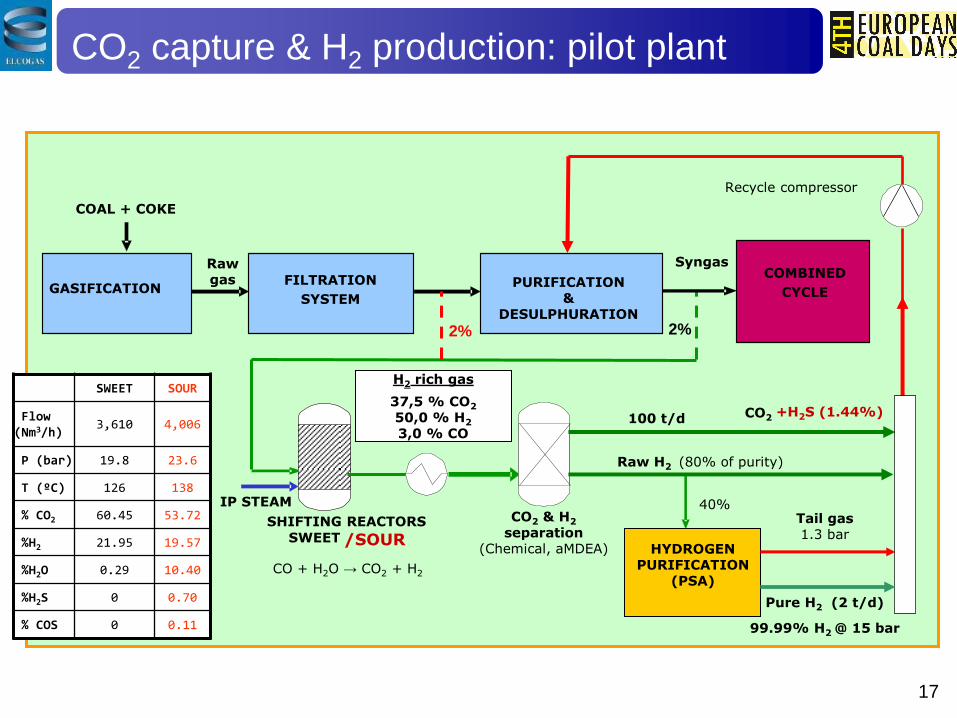
CO + H2O → CO2 + H2
Raw H2 (80% of purity)
40%
H2 rich gas
37,5 % CO2
50,0 % H2 3,0 % CO
HYDROGEN PURIFICATION
(PSA)
Recycle compressor
Pure H2 (2 t/d)
99.99% H2 @ 15 bar
SWEET /SOUR
+H2S (1.44%)
2% 2%
SWEET SOUR
Flow (Nm3/h)
3,610 4,006
P (bar) 19.8 23.6
T (ºC) 126 138
% CO2 60.45 53.72
%H2 21.95 19.57
%H2O 0.29 10.40
%H2S 0 0.70
% COS 0 0.11
CO2 capture & H2 production: pilot plant

CO2 capture & H2 production: pilot plant
18
Engineering: Empresarios Agrupados
CO2 unit: Linde-Caloric
PSA unit: Linde
Control: Zeus Control
Reactors: Técnicas Reunidas
Catalysts: Johnson Matthey
Construction: Empresas locales
CO2 stripper
CO2 absorber
PSA adsorbers
Shifting reactors
Control room

19
Index
1. The ELCOGAS IGCC power plant
1.1 Introduction
1.2 Description of the IGCC process
1.3 Operational data
1.4 CO2 separation and H2 production
1.5 Flexibility of feeding and products
2. Lessons learnt for future

Flexibility of feeding and products
Battery of biomass co-gasification tests
Test Month/Year BIOMASS
Biomass
dosage
ratio (% wt)
Biomass
(t)
Test
Duration
(h)
2001
Meat Bone
& Meal 1-4.5% 93.3 15
2007-2009
Olive oil
waste
1-2 % 1,572.8 800.3
2008 4% 652.1 154
Mar 2009 6% 395.8 64.4
Jun 2009 8% 383.9 46
Sept 2009 10% 656.6 62
Nov-Dec 2011 Olive oil
waste
2% 218.1 106
Oct-Nov 2012 4% 409.3 153.5
Oct 2012 Grape
Seed Meal
2% 179.3 127
Nov-Dec 2012 4% 425.7 119.5
TOTAL 4,987.3 1,647.7
Preselected biomass

21
Index
1. The ELCOGAS IGCC power plant
2. Lessons learnt for the future
2.1 What is gasification?
2.2 Gasification flexibility
2.3 Engineering plant modifications
2.4 “Demonstration project”
2.5 CO2 capture experience

22
Gasification itself is not the core, neither the root of the project nor plant problematic.
On the contrary, they are the design & detailed engineering of the auxiliary systems.
Each plant is different because they depend on:
- Available raw fuel - Chosen gasifier technology
- Expected use of syngas - Environmental regulations
So, Engineering & O&M expertise are crucial
Feeding
Dry
Wet
Gasification
Fixed bed
Fluid bed
Entrained flow
Cooling
Heat exchangers
Direct with water
Chemical
Particles separation
Dry filtration
Wet filtration
Scrubbing
One step
Two steps
Desulphurization
COS hydrolyzation
Chemical absorption
Physical absorption
Adsorption
Clean syngas
What is gasification?
Syngas production by gasification. Processes

23
Index
1. The ELCOGAS plant
2. Lessons learnt for the future
2.1 What is gasification?
2.2 Gasification flexibility
2.3 Engineering plant modifications
2.4 “Demonstration project”
2.5 CO2 capture experience

Gasification flexibility
Selection of the best gasification technology depending on:
Fuel (C content, LHV, available quantities)
Gasifier size required to obtained a competitive product
Products required (H2, Chemicals, Fischer-Tropsch liquids, energy w/ CO2 capture, ..)
Feedstock
Gasifier
Gas clean-up
Syngas
Power
Chemicals
Transportation fuels

Gasification deployment
Accumulated world gasification capacity
(Fuente: Higman Consulting, 2012)
Gasification by region

Gasification deployment
(Fuente: EPRI, 2012)

27
Index
1. The ELCOGAS IGCC power plant
2. Lessons learnt for the future
2.1 What is gasification?
2.2 Gasification flexibility
2.3 Engineering plant modifications
2.4 “Demonstration project”
2.5 CO2 capture experience

28
Engineering plant modifications
0
200
400
600
800
1000
1995 1996 1997 1998 1999 2000 2001 2002 2003 2004 2005 2006 2007 2008 2009 2010 2011 2012 2013
ANNUAL EVOLUTION OF APPROVED HM
Mec Elec
I&C Control
ANNUAL EVOLUTION OF APPROVED DESIGN CHANGES
Commissioning
of BOP & NGCC Commissioning of ASU &
Gasification and CCwSG

29
Index
1. The ELCOGAS IGCC power plant
2. Lessons learnt for the future
2.1 What is gasification?
2.2 Gasification flexibility
2.3 Engineering plant modifications
2.4 “Demonstration project”
2.5 CO2 capture experience

30
“Demonstration project“
Investment costs at ELCOGAS. Learning
100%
50%30%
1998 2000 2002 2004 2006 2008 2010 2012 2014 2016
Year
Co
st
(%)
REGULATORY SUPPORT is
essential in a technology
demonstration project at
commercial scale First Generation Developed technology
Extra cost
30 – 50 %
Investment
Total production cost

31
Index
1. The ELCOGAS plant
2. Lessons learnt for the future
2.1 What is gasification?
2.2 Gasification flexibility
2.3 Engineering plant modifications
2.4 “Demonstration project”
2.5 CO2 capture experience

32
Source: DOE/NETL CCS RD&D ROADMAP (December 2010)
CO2 capture: Real experience at ELCOGAS
Comparison between costs of CO2 capture technologies
30 for ELCOGAS
retrofitting
With acid
CO2
capture &
current
status of
technology
~125
~25

33
With SWEET catalyst
With SOUR catalyst
CO2 capture in IGCC plants
Fuel preparation
Gasification
Filtration and wet
scrubbing
Desulphurization and sulphur
recovery
Unity of CO2
capture
Combined cycle
S CO2
Fuel preparation
Gasification
Filtration and wet
scrubbing
Unity of CO2
capture
Combined cycle
CO2 + H2S
Real experience at ELCOGAS: results and learning
Based on our CO2 capture pilot plant, we have scaled the cost of a CO2 capture unit at
scale 1:1 about 350 M€. Approximately, it represents the cost of the desulphurization and
sulphur recovery units in an IGCC w/o CO2 capture.
By installing an IGCC with CO2 acid capture to store or use CO2 together with ~1.5% H2S,
the investment costs are similar to those w/o CO2 capture. And the only penalty is the
decreasing efficiency: From 42 33% currently
and from 50 44% near future
(1.5%)

Summary
• Technology at commercial demonstration scale power plant requires a long term regulatory frame
• IGCC with or without CCS is a promising technology with the minimum variable costs and the best environmental performance and it can be adapted to multifuel and polygeneration
• Following IGCC generation must learn from existing plants
• Main burden for deployment is high investment requires a long term regulatory frame
34

35
Coal gasification in Spain – the future of sustainable coal
Francisco García Peña – ELCOGAS Puertollano IGCC plant
12-14 November 2013 (Brussels)
THANK YOU FOR YOUR
ATTENTION