12 2015 chemcomm iminecof si - the royal society of chemistry · to 70 ˚c for 3 days, after which...
TRANSCRIPT

S-1
Insight Into the Crystallization of Amorphous Imine-Linked Polymer Networks to 2D Covalent Organic Frameworks
Brian J. Smith, Anna C. Overholts, Nicky Hwang, and William R. Dichtel*
Department of Chemistry and Chemical Biology, Cornell University, Baker Laboratory, Ithaca, New York, 14853-1301 USA
Supporting Information
Table of Contents
I. Materials and Instrumentation S–2
II. Experimental Protocols S–3
III. Additional Characterization
A. Powder X-ray diffraction data S–5
B. N2 Isotherm and BET surface area determination S–7
C. SEM S–12
Correspondence Address
Professor William R. Dichtel Department of Chemistry and Chemical Biology
Cornell University Baker Laboratory
Ithaca, NY 14853-1301 (USA) Tel: (+1)-607-254-2356 Fax: (+1)-607-255-4137
Email: [email protected]
Electronic Supplementary Material (ESI) for ChemComm.This journal is © The Royal Society of Chemistry 2016

S-2
I. Materials and Instrumentation Materials. Reagents were purchased from commercial sources and used without
further purification. MeOH and toluene were purchased from commercial sources
and purified using a custom-built alumina-column based solvent purification
system. Other solvents were purchased from commercial sources and dried over
activated 3Å molecular sieves.
Instrumentation. Infrared spectra of solid samples were recorded using a
ThermoNicolet iS10 FT-IR spectrometer with a diamond ATR attachment and are
uncorrected.
Surface area measurements were conducted on a Micromeritics ASAP
2020 Accelerated Surface Area and Porosimetry Analyzer using samples
degassed at 90 °C for 24 h and backfilled with N2. N2 isotherms were generated
by incremental exposure to ultra high purity nitrogen up to 1 atm in a liquid
nitrogen (77 K) bath and surface parameters were determined using BET
adsorption models included in the instrument software (Micromeritics ASAP 2020
V4.00).
Powder X-ray diffraction (PXRD) patterns were obtained on a Scintag
Theta-Theta Powder X-Ray Diffractometer in reflectance Bragg-Brentano
geometry employing Cu Kα line focused radiation at 2200 W (40 kV, 40 mA)
power and equipped with a Ge crystal detector fitted with a 0.3 mm radiation
entrance slit. Samples were mounted on zero background sample holders by
dropping powders from a spatula and then leveling the sample surface with a
glass microscope slide. No sample grinding or sieving was used prior to analysis.
Crystallite size was determined by applying the Scherrer equation to the powder
patterns using MDI JADE.
Scanning electron microscopy was performed on a LEO 1550 FESEM
(Keck SEM) operating at 2.00 kV and a working distance of 3 – 4 mm with an
aperture size of 20 µm. Samples were prepared by adsorption onto a silicon
wafer, which was then attached to a flat aluminum platform sample holder. The

S-3
sample was then placed directly into the instrument. No metal coating was
applied.
Sonication was performed with a Branson 3510 ultrasonic cleaner with a
power output of 100W and a frequency of 42 kHz.
The Accelrys Materials Studio (version 5.5) program suite was used to
simulate the powder diffraction. The structures were optimized using the
Geometry Optimization routine including energy minimization with cell
parameters optimization, using the parameters from the Universal Force Field.
The PXRD was calculated for the optimized structures with the Reflex Plus
module.
II. Experimental Protocols General conditions for homogeneous synthesis of TAPB-PDA COF. 1,3,5-tris(4-aminophenyl)benzene (55 mg, 0.16 mmol) and terephthaldehyde (31
mg, 0.23 mmol) were combined in a scintillation vial with a dioxane / mesitylene
solution (4:1 v/v, 6.3 mL). The solution was heated to 70 ˚C for 3 minutes to
ensure dissolution and then cooled to room temperature. Distilled H2O (1.2 mL)
was added to the solution, followed by glacial CH3CO2H (1.8 mL). The resulting
suspension was sealed and heated to 70 ˚C for 72 hrs. The COF solid was
isolated by filtration, rinsed with toluene, and subsequently dried under vacuum,
yielding a yellow powder. (66 mg, 85 % yield)
Conditional survey of acetic acid and water for TAPB-PDA COF synthesis. A stock solution of the monomers in dioxane / mesitylene solution (4:1 v/v) was
prepared as described above. Various mixtures of distilled H2O, glacial
CH3CO2H, and additional dioxane / mesitylene were added to the stock solution
(1.0 mL) to obtain a final volume of 1.7 mL for each experiment (0.015 M [TAPB],
0–0.3 mL water, 0–0.4 mL glacial acetic acid). Each reaction mixture was heated
to 70 ˚C for 3 days, after which the COF or amorphous polymer precipitates were
isolated as described above and subsequently characterized by PXRD.

S-4
Homogeneous synthesis of TAPB-PDA amorphous network. 1,3,5-tris(4-aminophenyl)benzene (100 mg, 0.28 mmol) and terephthaldehyde
(57 mg, 0.43 mmol) were combined in a scintillation vial with dioxane /
mesitylene solution (4:1 v/v, 11.4 mL), and heated to 70 ˚C for 3 min to ensure
dissolution and then cooled to room temperature. Distilled H2O (2.3 mL) was
added to the solution, followed by glacial CH3CO2H (3.4 mL). The resulting solid
was isolated by filtration after 15 min, rinsed with toluene, and subsequently dried
under vacuum, yielding a yellow powder. (0.41 mg, 95 % yield)
Conversion of amorphous network to TAPB-PDA COF. The TAPB-PDA
amorphous network (80 mg) was added to a scintillation vial with dioxane /
mesitylene solution (4:1 v/v, 6.4 mL). Distilled H2O (1.3 mL) was added to the
solution, followed by glacial CH3CO2H (1.9 mL). The resulting suspension was
heated to 70 ˚C for 48 hours, under atmospheric pressure. The COF solid was
isolated by filtration, rinsed with toluene, and subsequently dried under vacuum,
yielding a yellow powder. (60 mg, 75% yield)
S-5
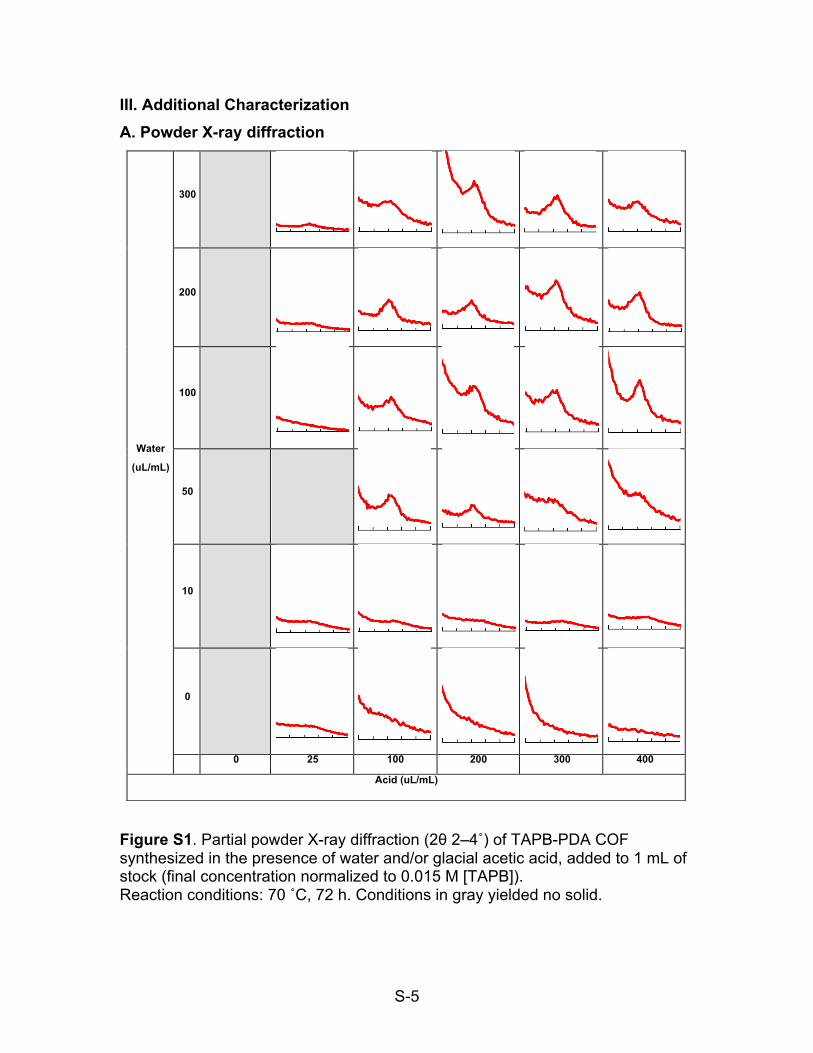
III. Additional Characterization A. Powder X-ray diffraction
Figure S1. Partial powder X-ray diffraction (2θ 2–4˚) of TAPB-PDA COF synthesized in the presence of water and/or glacial acetic acid, added to 1 mL of stock (final concentration normalized to 0.015 M [TAPB]). Reaction conditions: 70 ˚C, 72 h. Conditions in gray yielded no solid.
!
Water
(uL/mL)
300
200
100
50
10
0
0 25 100 200 300 400
Acid (uL/mL)

S-6
Figure S2. Powder X-ray diffraction of initial amorphous imine network and TAPB-PDA COF after resubjection to the reaction conditions (70 ˚C, 48 h).
Figure S3. Powder X-ray diffraction of initial amorphous imine network after resubjection to the reaction conditions (room temperature, 6 days).
Inte
nsity
121086422-Theta (º)
Amorphous
TAPB-PDA COF
Inte
nsity
121086422-Theta (º)

S-7
B. N2 Isotherm and BET surface area determination
Figure S4. N2 adsorption isotherm (77 K) and surface area data analysis of TAPB-PDA COF synthesized from homogeneous conditions.
0
50
100
150
200
250
300
350
0 0.2 0.4 0.6 0.8 1
cm³/g
STP
P/P0
Adsorption
Desorption
0.16
0.14
0.12
0.10
0.08
0.06
0.04
0.02
0.00
Incr
emen
tal P
ore
Volu
me
50454035302520Pore Width (A)
0.E+00
2.E+04
4.E+04
6.E+04
8.E+04
1.E+05
1.E+05
1.E+05
2.E+05
0 0.2 0.4 0.6 0.8 1
Q(P
0-P)
P/P0
0.E+00
2.E-04
4.E-04
6.E-04
8.E-04
1.E-03
1.E-03
1.E-03
2.E-03
2.E-03
0 0.1 0.2 0.3
(P/P
o)/(Q
*(1-
P/P
o)
P/P0
BET Surface Area P/P0 (m2 g-1) R2
0.05 – 0.20 610 0.999 0.05 – 0.22 625 0.997 0.05 – 0.24 657 0.990 0.05 – 0.27 750 0.931
S-8
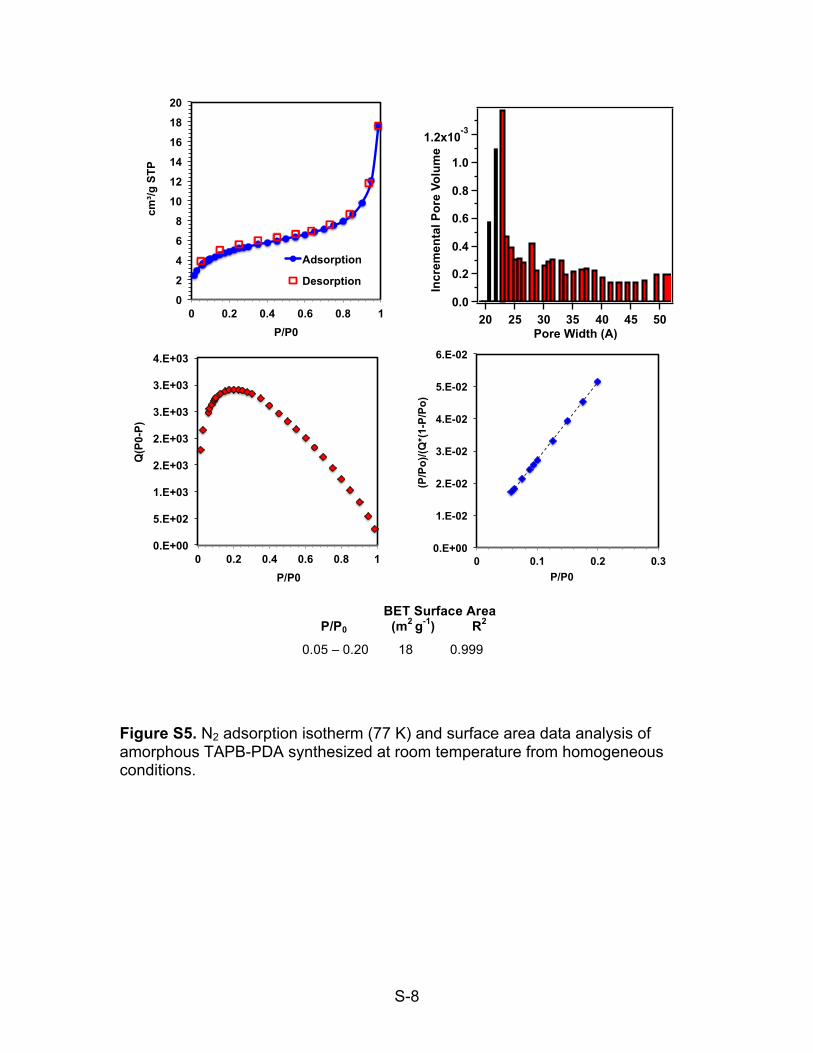
Figure S5. N2 adsorption isotherm (77 K) and surface area data analysis of amorphous TAPB-PDA synthesized at room temperature from homogeneous conditions.
0
2
4
6
8
10
12
14
16
18
20
0 0.2 0.4 0.6 0.8 1
cm³/g
STP
P/P0
Adsorption
Desorption
1.2x10⁻³
1.0
0.8
0.6
0.4
0.2
0.0
Incr
emen
tal P
ore
Volu
me
50454035302520Pore Width (A)
0.E+00
5.E+02
1.E+03
2.E+03
2.E+03
3.E+03
3.E+03
4.E+03
0 0.2 0.4 0.6 0.8 1
Q(P
0-P)
P/P0
0.E+00
1.E-02
2.E-02
3.E-02
4.E-02
5.E-02
6.E-02
0 0.1 0.2 0.3
(P/P
o)/(Q
*(1-
P/P
o)
P/P0
BET Surface Area P/P0 (m2 g-1) R2
0.05 – 0.20 18 0.999

S-9
Figure S6. N2 adsorption isotherm (77 K) and surface area data analysis of amorphous TAPB-PDA resubjection to the reaction conditions (70 ˚C, 24 h).
0
10
20
30
40
50
60
70
80
90
0 0.2 0.4 0.6 0.8 1
cm³/g
STP
P/P0
Adsorption
Desorption
14x10-3
12
10
8
6
4
2
0
Incr
emen
tal P
ore
Volu
me
50454035302520Pore Width (A)
0.E+00
5.E+03
1.E+04
2.E+04
2.E+04
3.E+04
0 0.2 0.4 0.6 0.8 1
Q(P
0-P)
P/P0
0.E+00
5.E-04
1.E-03
2.E-03
2.E-03
3.E-03
3.E-03
4.E-03
4.E-03
5.E-03
0 0.1 0.2 0.3 0.4
(P/P
o)/(Q
*(1-
P/P
o)
P/P0
BET Surface Area P/P0 (m2 g-1) R2
0.05 – 0.22 126 0.999 0.05 – 0.24 132 0.991 0.05 – 0.29 136 0.992

S-10
Figure S7. N2 adsorption isotherm (77 K) and surface area data analysis of amorphous TAPB-PDA resubjection to the reaction conditions (70 ˚C, 48 h).
0
20
40
60
80
100
120
140
160
180
0 0.2 0.4 0.6 0.8 1
cm³/g
STP
P/P0
Adsorption
Desorption
50x10-3
40
30
20
10
0
Incr
emen
tal P
ore
Volu
me
50454035302520Pore Width (A)
0.E+00
1.E+04
2.E+04
3.E+04
4.E+04
5.E+04
6.E+04
0 0.2 0.4 0.6 0.8 1
Q(P
0-P)
P/P0
0.E+00
2.E-03
4.E-03
6.E-03
8.E-03
1.E-02
1.E-02
0 0.1 0.2 0.3 0.4
(P/P
o)/(Q
*(1-
P/P
o)
P/P0
BET Surface Area P/P0 (m2 g-1) R2
0.05 – 0.20 283 0.999 0.05 – 0.22 291 0.997 0.05 – 0.24 311 0.983 0.05 – 0.29 330 0.977

S-11
Figure S8. N2 adsorption isotherm (77 K) and surface area data analysis of amorphous TAPB-PDA resubjection to the reaction conditions (room temperature, 6 days).
0
20
40
60
80
100
120
140
160
180
0 0.2 0.4 0.6 0.8 1
cm³/g
STP
P/P0
Adsorption
Desorption
40x10-3
30
20
10
0
Incr
emen
tal P
ore
Volu
me
50454035302520Pore Width (A)
0.E+00
1.E+04
2.E+04
3.E+04
4.E+04
5.E+04
6.E+04
0 0.2 0.4 0.6 0.8 1
Q(P
0-P)
P/P0
0.E+00
1.E-03
2.E-03
3.E-03
4.E-03
5.E-03
0 0.1 0.2 0.3 0.4
(P/P
o)/(Q
*(1-
P/P
o)
P/P0
BET Surface Area P/P0 (m2 g-1) R2
0.05 – 0.20 284 0.999 0.05 – 0.22 291 0.998 0.05 – 0.24 310 0.986 0.05 – 0.29 330 0.981
S-12
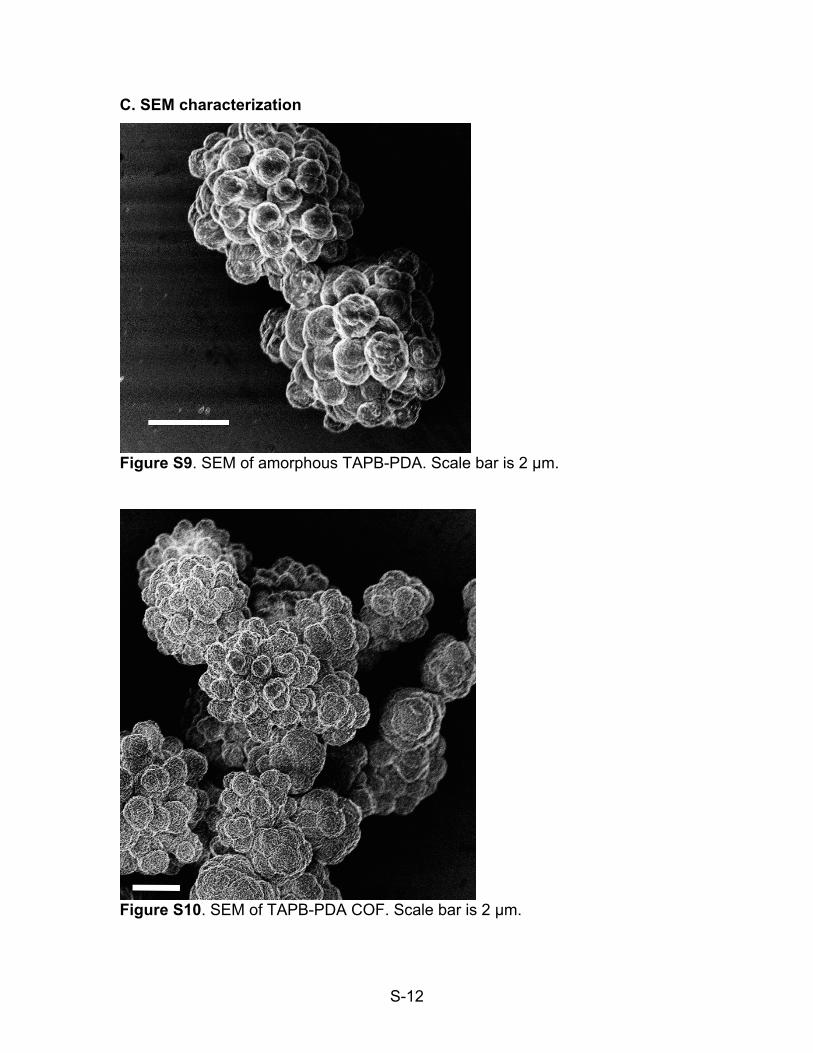
C. SEM characterization
Figure S9. SEM of amorphous TAPB-PDA. Scale bar is 2 µm.
Figure S10. SEM of TAPB-PDA COF. Scale bar is 2 µm.

S-13
Figure S11. SEM of TAPB-PDA COF. Scale bar is 200 nm.