12 economic indicators and measurements - weebly · concept review macroeconomics is the study of...
TRANSCRIPT

CONCEPT REVIEW
Macroeconomics is the study of the economy as a whole and howmajor sectors of the economy interact.
CHAPTER 12 KEY CONCEPT
National income accounting uses statistical measures of income,spending, and output to help people understand what is happeningto a country’s economy.
WHY THE CONCEPT MATTERS
Your economic decisions—combined with those of millions ofother people—determine the fate of the nation’s economy. Can youafford to buy a new car? Is now a good time to change jobs? Shouldyou take a risk in the stock market or keep your money safe in thebank? Understanding what is happening to the country’s economywill help you make better economic decisions.
CHAPTER
How has free enterprise transformedPoland’s economy? See the Case Studyon pages 376–377.
349Economic Indicators and Measurements
12
More at ClassZone.com
Economic Indicatorsand Measurements
SECTION 1Gross Domestic
Product andOther Indicators
SECTION 2Business Cycles
SECTION 3StimulatingEconomicGrowth
CASE STUDYPoland: Economic
Freedom andEconomicGrowth
Go to ECONOMICS UPDATE forchapter updates and current newson the economy of Poland. (SeeCase Study, pp. 376–377.)
Go to ANIMATED ECONOMICS forinteractive lessons on the graphsand tables in this chapter.
Go to INTERACTIVE REVIEW forconcept review and activities.

1SECT ION
350 Chapter 12
OBJECT IVES KEY TERMS TAKING NOTES
As you read Section 1, complete ahierarchy chart like the one belowto record what you learn aboutnational income accounting.Use the Graphic Organizer atInteractive Review @ ClassZone.com
In Section 1, you will
• define GDP and describe howit is measured
• explain how GDP has certainlimitations
• identify other national incomeaccounting measures
national income accounting, p. 350gross domestic product (GDP), p. 350nominal GDP, p. 352real GDP, p. 352nonmarket activities, p. 354underground economy, p. 354gross national product (GNP), p. 355net national product (NNP), p. 355national income (NI), p. 355personal income (PI), p. 355disposable personal income (DPI), p. 355
What Is GDP?
KEY CONCEPTS
As you have read, microeconomics and macroeconomics look at the economythrough different lenses. While microeconomics examines the actions of individualsand single markets, macroeconomics examines the economy as a whole. Macroecon-omists analyze the economy using national income accounting, statistical measuresthat track the income, spending, and output of a nation. The most important ofthose measures is gross domestic product (GDP), the market value of all final goodsand services produced within a nation in a given time period.
The Components of GDP
To be included in GDP, a good or service hasto fulfill three requirements. First, it has to befinal rather than intermediate. For example,the fabric used to make a shirt is an inter-mediate good; the shirt itself is a final good.Second, the good or service must be producedduring the time period, regardless of when it issold. For example, cars made this year but soldnext year would be counted in this year’s GDP.Finally, the good or service must be producedwithin the nation’s borders. Products made inforeign countries by U.S. companies are notincluded in the U.S. GDP.
Gross Domestic Product andOther Indicators
National incomeaccounting is a wayof evaluating a country’seconomy using statisticalmeasures of its income,spending, and output.
Gross domesticproduct (GDP) isthe market value of allfinal goods and servicesproduced within a nationin a given time period.
QUICK REFERENCE
Products Included in GDPCars made in the United States are an exampleof goods counted toward U.S. gross domesticproduct (GDP).
National IncomeAccounting
GDP

0
1
1
2
2
3
4
5
6
7
8
9
10
Key:
Consumption (C)
Investment (I)
Net Exports (X)
GovernmentSpending (G)
Source: U.S. Bureau of Economic Analysis, 2005 data
Gro
ss D
om
esti
c Pr
od
uct
(in
tri
llio
ns
of
do
llars
)
C I G
X
FIGURE 12.1 COMPONENTS OF U.S. GROSS DOMESTIC PRODUCT
Find an update on the U.S.GDP at ClassZone.com
351Economic Indicators and MeasurementsEconomic Indicators and Measurements
Calculating GDP
Although there are several different ways to calculate GDP, economists often use theexpenditures approach. With this method, they group national spending on final goodsand services according to the four sectors of the economy: spending by households, orconsumption; spending by businesses, or investment; government spending; and totalexports minus total imports, or net exports. Economists identify consumption withthe letter C; investment with the letter I; government spending with the letter G; andnet exports with the letter X. To calculate GDP, economists add the expenditures fromall sectors together: C+I+G+X=GDP.
Consumption includes all spending by households on durable goods, nondurablegoods, and services. You drive to the movies in a durable good (an item that doesnot wear out quickly). You purchase a service when you pay for the movie (since youare not buying to own something). And you obtain a nondurable good (a good thatis used up relatively soon after purchase) when you buy popcorn.
Investment, which measures what businesses spend, has two categories. One is fixedinvestment, which includes new construction and purchases of such capital goods asequipment, machinery, and tools. The other is inventory investment. This category,also called unconsumed output, is made up of the unsold goods that businesses keepon hand.
Government spending includes all the expenditures of federal, state, and local gov-ernments on goods and services. Examples include spending for defense, highways,
ANALYZE GRAPHS1. In 2005, net exports was a negative number. What does this say about
the relative amounts of exports and imports?
2. Did households, businesses, or the government contribute the most toU.S. GDP in 2005?

2
4
6
8
10
12
14
1955 1965 1975 1985 1995 20051960 1970 1980 1990 2000
Year
Gro
ss D
om
esti
c Pr
od
uct
(in
tri
llio
ns
of
do
llars
)
FIGURE 12.2 U.S. NOMINAL AND REALGROSS DOMESTIC PRODUCT
NOMINAL GDP
REAL GDP (IN 2000 DOLLARS)
Source: U.S. Bureau of Economic Analysis
352 Chapter 12
and public education. However, government spending on transfer payments, such associal security and unemployment benefits, is not included. These payments allowthe recipients to buy goods and services, and these are counted as consumption.
Net exports, the final component of GDP, represents foreign trade. This componenttakes into account the goods and services produced in the United States but soldin foreign countries—in other words, exports. However, U.S. consumers and busi-nesses also buy, or import, goods made in foreign countries. Cars, car parts, andcrude oil are the largest imports in dollar value. The GDP counts only net exports—the value of U.S. exports minus the value of U.S. imports.
Two Types of GDP
Economists use GDP to gauge how well a country’s economy is doing. When GDPis growing, an economy creates more jobs and more business opportunities. WhenGDP declines, jobs and more business opportunities become less plentiful. To geta clearer picture of a country’s economic health, economists calculate two forms ofGDP—nominal and real.
The most basic form is nominal GDP, which is stated in the price levels for theyear in which the GDP was measured. If prices never changed, nominal GDP wouldbe sufficient. But prices tend to increase over time. In Figure 12.2, find the linethat represents nominal GDP. If you estimate the difference from 1990 to 2005, thenominal GDP of the United States about doubled. However, during this time priceswent up, adding dollars to GDP without adding value to the nation’s output.
To factor out rising prices, economists use real GDP, which is nominal GDPadjusted for changes in prices. Real GDP is an estimate of the GDP if prices were to
ANALYZE GRAPHS1. About how much did nominal GDP increase from 1990 to 2000?
2. About how much did real GDP increase over the same period?
3. Why do the two lines cross at the year 2000?
Nominal GDP statesGDP in terms of thecurrent value of goods andservices.
Real GDP states GDPcorrected for changes inprices from year to year.
QUICK REFERENCE

353Economic Indicators and Measurements
remain constant from year to year. To find real GDP, economists compare nominalGDP to a base year. Look again at Figure 12.2, which uses 2000 as a base year. Sincereal GDP eliminates price differences, the line for real GDP rises more graduallythan the line for nominal GDP. Real GDP provides a more accurate measure of eco-nomic performance.
APPLICATION Applying Economic Concepts
A. If output remained the same, how would a year of falling prices affect nominal GDP?How would it affect real GDP?
MATH CHALLENGE
F I G U R E 12 .3 Understanding Nominal and Real GDP
To better understand nominal and real GDP, imaginea country that produces only one good: TVs. If youknow the price of TVs and the number produced, youcan calculate that country’s nominal and real GDP.Use the table to find the data for these calculations.
Step 1: Calculate nominal GDP for 2004. NominalGDP is the product of the number of TVs producedand the price of TVs that year.
The table shows that nominal GDP grew each year. If you judged only by nominalGDP, the economy of this country would seem to be growing.
Step 2: Analyze the nominal GDP figures. Why did nominal GDP increase from2004 to 2005? The number of TVs produced increased. Why did nominal GDPincrease from 2005 to 2006? The price of TVs increased.
The output of the country’s economy grew from 2004 to 2005, but it stayed thesame from 2005 to 2006, despite the increase in prices. Calculating real GDPproduces a better estimate of how much a country’s economy is growing.
Step 3: Calculate real GDP for 2006. Real GDP is the product of the number of TVsproduced in the current year and the price of TVs in the base year. In this case, use2004 as the base year.
Since 2004 is the base year, nominal and real GDP are the same for 2004. Real GDPallows you to compare the output of the country’s economy in different years.
2004 2005 2006
TVsProduced
500 600 600
TV Price $100 $100 $120
NominalGDP
$50,000 $60,000 $72,000
Real GDP,base: 2004
$50,000 $60,000 $60,000
Numberproduced
� Price in that year �Nominal
GDP500 � $100 � $50,000
Numberproduced
�Price in thebase year
� Real GDP 600 � $100 � $60,000

354 Chapter 12
What GDP Does Not Measure
KEY CONCEPTS
Although GDP provides an important estimate of how well the economy is performing,it does not measure all output. It does not measure nonmarket activities, such as homechildcare or performing one’s own home repairs. GDP also does not measure outputfrom the underground economy, market activities that go unreported because theyare illegal or because those involved want to avoid taxation. Further, GDP does notmeasure “quality of life” issues related to economic output.
Nonmarket Activities
Some productive activities do not take placein economic markets. For example, there is noeffective way to measure the output of plumb-ers who install or repair plumbing systems intheir own homes or people who do volunteerwork for schools or hospitals. By far the biggestnonmarket activity, also left out of GDP, con-sists of the many services—cooking, cleaning,childcare—provided by homemakers.
Underground Economy
Also missing from GDP is the undergroundsector of the economy. Some activities are keptunderground because they are illegal—drug dealing, smuggling, gambling, andselling stolen goods, for example. When goods are rationed or otherwise restricted,illegal trading occurs on what is called the black market. Other underground activi-ties are themselves legal, but the way the payment is handled is not. For example,a plumber who does repairs for a neighbor might receive payment in cash and notdeclare it as taxable income. Estimates suggest that the underground economy wouldmake up 8 to 10 percent of the U.S. GDP.
Quality of Life
Countries with high GDPs have high living standards. But GDP does not show howthe goods and services are distributed. The United States has the largest GDP of anycountry, but more than 10 percent of its people still live in poverty. GDP also doesnot express what products are being built and services offered: for example, are theremore jails being built than schools?
APPLICATION Explaining an Economic Concept
B. If you get paid in cash to baby-sit, mow lawns, or do other chores for neighbors, areyou part of the underground economy? Why or why not?
Nonmarket activitiesare services that havepotential economic valuebut are performed withoutcharge.
Undergroundeconomy describesmarket activities that gounreported because theyare illegal or because thoseinvolved want to avoidtaxation.
QUICK REFERENCE
Nonmarket Activities Housework isan example of a productive activity notmeasured by GDP.

355Economic Indicators and Measurements
Other Economic Performance Measures
KEY CONCEPTS
GDP is not the only measure that economists use to gauge economic performance.Several other measures are derived by making adjustments to GDP.• Gross national product (GNP) is the market value of all final goods and services a
country produces in a given time period. GNP equals GDP plus the income fromgoods and services produced by U.S. companies and citizens in foreign countriesbut minus the income foreign companies and citizens earn here.
• Net national product (NNP) is GNP minus depreciation of capital stock—in otherwords, the value of final goods and services less the value of capital goods thatbecame worn out during the time period.
• National income (NI) is the total income earned in a nation from the production ofgoods and services in a given time period. It is calculated by subtracting indirectbusiness taxes, such as property and sales taxes, from NNP.
• Personal income (PI) is the income received by a country’s people from all sourcesin a given time period. It can be calculated from NI by subtracting social securitytaxes, corporate profit taxes, and corporate profits not paid to stockholders and byadding social security, unemployment, and welfare payments.
• Disposable personal income (DPI) is personal income minus personal income taxes.It shows how much money is actually available for consumer spending.
APPLICATION Making Inferences
C. Under what circumstances might a country’s GNP be greater than its GDP?
Gross nationalproduct (GNP) isthe market value of allfinal goods and servicesproduced by a country.
Net national product(NNP) is the value of finalgoods and services less thevalue of capital goods thathave become worn out.
National income (NI)is the total income earnedin a nation from theproduction of goods andservices.
Personal income (PI)is the income received bya country’s people from allsources.
Disposable personalincome (DPI) is personalincome minus taxes.
QUICK REFERENCE
F I G U R E 12 .4 National Income Accounting
GDP + income earned abroad by U.S. businesses and citizens– income earned in U.S. by foreign businesses and citizens
= GNP – depreciation of capital stock
= NNP – indirect business taxes
= NI – income earned but not received+ income received but not earned
= PI – personal taxes
= DPI
ANALYZE CHARTSWhat three figures do you need in order to calculate personal income (PI)?

ECONOMICSSKILLBUILDER
F I G U R E 12 .5 COMPONENTS OF U.S. GDP(IN BILLIONS OF DOLLARS)
For more on synthesizing economic data,see the Skillbuilder Handbook, page R23.
Year ConsumptionExpenditure
InvestmentExpenditure
GovernmentExpenditure
Net ExportExpenditure
NominalGDP
1980 1,757 479 566 13 2,789
1985 2,720 736 879 115 4,220
1990 3,840 861 1,180 78 5,803
1995 4,976 1,144 1,369 91 7,398
2000 6,739 1,736 1,722 380 9,817
2005 8,746 2,105 2,363 727 12,487
356 Chapter 12
Synthesizing Economic DataSynthesizing is a skill used by economists to interpret economic trends. Synthesizinginvolves interpreting various data to form an overview of economic performance.A synthesis is often stated as a broad summary statement.
PRACTICING THE SKILL National income accounting involves the collection andanalysis of data on key economic variables. Economists synthesize the data to arriveat an overview of national economic performance. The table below presents data forvariables used to determine gross domestic product (GDP), a key factor in nationalincome accounting.
Determine how thetypes of data relate toone another. For 1990,calculating the sum ofthe four expendituresyields $5,803 billion,the nominal GDP for1990.
THINKING ECONOMICALLY Synthesizing
1. What trend can be seen in U.S. nominal GDP? What can you tell from this about thegrowth of the U.S. economy? Do you need more information?
2. Which expenditure accounts for most of GDP?
3. Does the proportion of this expenditure to the other two positive expendituresremain about the same in the six years shown here? Briefly explain how youestimated this.
Read the column headscarefully. The four typesof expenditures are usedto determine GDP.
Read the title to learn the mainidea of the table. This table showsthe components of U.S. GDP forselected years.
Check the source ofthe data to evaluateits reliability. Look for patterns in the data.
For example, notice that netexports have been negative.
Source: U.S. Bureau of Economic Analysis

ClassZone.com
357
ECONOMICS IN PR ACTICE
SECTION 1 AssessmentREVIEWING KEY CONC EP TS
2. What are the four components of GDP?
3. What is an example of a durable good? a nondurable good?
4. Name two economic activities that GDP does not measure.
5. Why are transfer payments not included as a government expenditurewhen calculating GDP?
6. Using Your Notes Write a briefsummary of the methods usedto calculate national income andthe purposes of each accountingmethod. Refer to your completedhierarchy chart.
Use the Graphic Organizer at Interactive Review @ ClassZone.com
7. Drawing Conclusions List some things that have become moreexpensive during your lifetime. Explain how a rise in price levelaffects nominal GDP and real GDP.
8. Making Inferences If consumption is especially high comparedwith other years, what might you generalize about the health ofthe economy?
9. Explaining an Economic Concept What is the undergroundeconomy? What impact does it have on a nation’s GDP?
10. Drawing Conclusions Imagine that a new country is discoveredon an island in the middle of the Pacific Ocean. The country’speople have never left the island, and no foreigners have everbeen there. What would the relationship be between thecountry’s GDP and its GNP? Why?
11. Challenge How would the following affect GDP?a. Government transfer payments increase.b. Student sells used CD to record store.c. Car owner pays auto repair shop $500 to fix his car.
Identifying Intermediate andFinal GoodsLook at the following list of goodsand who purchased them.
Categorize EconomicInformation Decide whether eachgood is an intermediate good or afinal good.
Challenge Why is it important tomake a distinction in national incomeaccounting between intermediateand final goods?
Goods Purchaser
copier paper accounting firm
refrigerator home consumer
stainless steel manufacturer
eggs home consumer
eggsfactory that makesfrozen bakedgoods
battery car owner
paint furniture maker
1. Explain the relationship between the terms in each of these pairs.
a. nominal GDPreal GDP
c. personal incomedisposable personalincome
b. gross national productnet national product
C RIT IC AL THINKING
National IncomeAccounting
GDP

2SECT ION
358 Chapter 12
OBJECT IVES KEY TERMS TAKING NOTES
As you read Section 2, complete acluster diagram like the one belowto record what you learn aboutbusiness cycles. Use the GraphicOrganizer at Interactive Review@ ClassZone.com
In Section 2, you will
• describe the phases of thebusiness cycle
• discuss aggregate demand andaggregate supply
• identify the causes of thechanges in the business cycle
• explain how economistspredict business cycle changes
• outline major business cyclesin U.S. history
business cycle, p. 358economic growth, p. 358recession, p. 359depression, p. 359stagflation, p. 359aggregate demand, p. 360aggregate supply, p. 360macroeconomic equilibrium, p. 361leading indicators, p. 364coincident indicators, p. 364lagging indicators, p. 364
What Is the Business Cycle?
KEY CONCEPTS
Economic changes often follow a broad pattern. During the 1990s, the U.S. econ-omy expanded. In 2001, the economy slowed down. It then returned to a period ofgrowth. Such changes are an example of the business cycle, a series of periods ofexpanding and contracting economic activity. The business cycle is measured byincreases or decreases in real GDP. The cycle has four distinct stages: expansion,peak, contraction, and trough.
STAGE 1 Expansion
In the expansion phase, real GDP grows from a low point, or trough, as you can see inthe graph in Figure 12.6. The expansion is a period of economic growth, an increasein a nation’s real gross domestic product(GDP). During an expansion, jobs arerelatively easy to find, so unemploymentgoes down. More and more resources areneeded to keep up with spending demand.As resources become more scarce, theirprices rise. The length of each phase mayvary both within a cycle and from cycle tocycle. The longest expansion in U.S. his-tory took place over the course of ten yearsfrom 1991 to 2001.
Business Cycles
The business cycleis the series of growingand shrinking periodsof economic activity,measured by increases ordecreases in real GDP.
Economic growth isthe increase in a nation’sreal GDP over a periodof time.
QUICK REFERENCE
BusinessCycle
stages
Business Cycles Workersand businesses ride the upsand downs of the economy.

359Economic Indicators and MeasurementsEconomic Indicators and Measurements
STAGE 2 Peak
The point at which real GDP is the highest represents the peak of the business cycle.As prices rise and resources tighten, businesses become less profitable. From thatpoint on, real GDP declines as businesses curtail production.
STAGE 3 Contraction
The contraction phase begins after the peak. As producers cut back, resourcesbecome less scarce and prices tend to stabilize or fall. Unemployment rises becauseemployers produce less. Sometimes the contraction phase becomes a recession, acontraction lasting two or more quarters (six months or more). On rare occasions,as in the 1930s, a contraction turns into a depression, an extended period of highunemployment and limited business activity. While prices usually remain about thesame or go down during the contraction phase, sometimes they go up. These areperiods of stagflation—stagnation in business activity and inflation of prices.
STAGE 4 Trough
The final phase of the business cycle is the trough, the point at which real GDP andemployment stop declining. A business cycle is complete when it has gone throughall four phases, from trough to trough or from peak to peak.
APPLICATION Explaining an Economic Concept
A. In terms of the business cycle, what is unusual about stagflation?
QUICK REFERENCE
Recession is a prolongedeconomic contraction last-ing two or more quarters(six months or more).
Depression is anextended period of highunemployment andreduced business activity.
Stagflation describesperiods during which pricesrise at the same time thatthere is a slowdown inbusiness activity.
QUICK REFERENCE
Time
Rea
l GD
P
FIGURE 12.6 THE BUSINESS CYCLE
ANALYZE CHARTS1. What stage occurred before point A?
2. What stage will occur after point D?
3. How might the business cycle curve change if nominal GDP was used instead ofreal GDP?
a In the expansion phase,real GDP grows rapidly.
b The peak is where realGDP reaches its highestpoint in the cycle.
c In the contraction phase,real GDP declines.
d The trough marks theend of the contraction.
b
a
dc

FIGURES 12.7 AND 12.8 AGGREGATE DEMAND AND SUPPLY CURVES
FIGURE 12.8 AGGREGATE SUPPLYFIGURE 12.7 AGGREGATE DEMAND
Pric
e le
vel
Real GDP
Pric
e le
vel
Real GDP
AS
AD
360 Chapter 12
Aggregate Demand and Supply
KEY CONCEPTS
One way to understand business cycles is through the concepts of demand andsupply. In this case the concepts apply not to a single product or business but to theeconomy as a whole.
Aggregate Demand
Aggregate demand is the total amount of goods and services that households, busi-nesses, government, and foreign purchasers will buy at each and every price level.In Figure 12.7, the vertical axis, labeled “Price level,” shows the average price of allgoods and services. The horizontal axis, labeled “Real GDP,” shows the economy’stotal output. The aggregate demand curve (AD) is downward sloping. As the pricelevel decreases the purchasing power of money increases.
Aggregate Supply
Aggregate supply is the total amount of goods and services that producers will pro-vide at each and every price level. Note that in Figure 12.8 the aggregate supply curve(AS) does not look like the supply curves in Chapter 5. The aggregate supply curveis almost horizontal when real GDP is low—during times of recession or depres-sion—because businesses try not to raise their prices when the economy is weak.The middle part of the aggregate supply curve slopes upward, with prices increasingas real GDP increases. But during times of high inflation, prices rise without con-tributing to real GDP, and the aggregate supply curve becomes almost vertical.
Aggregate demand isthe sum of all the demandin the economy.
Aggregate supply isthe sum of all the supply inthe economy.
QUICK REFERENCE
ANALYZE GRAPHS1. What does a normal demand or supply graph use
as an x-axis? What does it use as a y-axis?
2. Why are the x and y axes different for theaggregate demand and supply graphs?
Use an interactive aggregatedemand and aggregate supplygraph at ClassZone.com

AS3 AS1 AS2AS
AD1
AD3
AD2
AD
FIGURES 12.9 AND 12.10 CHANGES IN AGGREGATE DEMAND AND SUPPLY
FIGURE 12.10 CHANGE IN AGGREGATESUPPLY
FIGURE 12.9 CHANGE IN AGGREGATEDEMAND
Pric
e le
vel
Real GDP
Pric
e le
vel
Real GDP
P2
P1
P3
Q3 Q1 Q2 Q3 Q1Q2
P2P1P3
361Economic Indicators and Measurements
Macroeconomic Equilibrium
When the quantity of aggregate demand equals the quantity of aggregate supply,the economy reaches macroeconomic equilibrium. Figures 12.9 and 12.10 illustrate avariety of different possibilities, but let’s consider one particular example shown inFigure 12.9. Macroeconomic equilibrium occurs where the aggregate demand curve(AD1) intersects the aggregate supply curve (AS). P1 indicates the equilibrium pricelevel, and Q1 shows the equilibrium level of real GDP.
Think about business cycles. An increase in aggregate demand shifts the aggre-gate demand curve to the right (AD2). Aggregate demand becomes greater at allprice levels, and equilibrium real GDP rises (Q2), marking an expansion phase. Ifaggregate demand were to decrease, the aggregate demand curve would shift to theleft (AD3). This would result in a lower equilibrium real GDP (Q3)—in other words,an economic contraction.
Shifts in aggregate supply affect real GDP in a similar way, as you can see inFigure 12.10. An increase in aggregate supply shifts the aggregate supply curve tothe right (AS2). As aggregate supply increases, the price level goes down (P2) andequilibrium real GDP rises (Q2), marking an expansion phase. If aggregate supplywere to decrease, the aggregate supply curve would shift to the left (AS3). The resultwould be a higher price level (P3) and lower equilibrium real GDP (Q3)—in otherwords, stagflation.
APPLICATION Analyzing Cause and Effect
B. Assuming aggregate demand remains the same, why does the price level go up whenaggregate supply decreases?
ANALYZE GRAPHS1. As aggregate demand decreases, what happens to price level and real GDP?
2. As aggregate supply decreases, what happens to price level and real GDP?
Macroeconomicequilibrium is thepoint where the quantityof aggregate demandequals the quantity ofaggregate supply.
QUICK REFERENCEQUICK REFERENCE

362 Chapter 12
Why Do Business Cycles Occur?
KEY CONCEPTS
You have seen that shifts in aggregate demand and aggregate supply indicate changesin the business cycle. But what causes these shifts? Four factors are especially impor-tant: (1) decisions made by businesses, (2) changes in interest rates, (3) the expecta-tions of consumers, and (4) external shocks to the economy. These factors involve the“ripple effect,” the cause-and-effect interactions that ripple through the economy.
FACTOR 1 Business Decisions
When businesses decide to decrease or increase production, their decisions can havefar-reaching effects. If enough businesses make similar decisions, it can lead to achange in the business cycle.
Demand slump Consider the ripple effectof a decision by businesses in the record-ing industry. In response to a slump indemand, the producers decide to reduceproduction of compact discs. First, theyreduce the number of hours worked attheir compact disc manufacturing facili-ties. Some workers get laid off, otherswork shorter hours. In a related move,the recording businesses cut back on theirinvestment in new CD manufacturingequipment. That decision will lead to adecrease in the demand for machinery,which puts producers of the machinery in the same situation that the recording busi-nesses were in. The machinery businesses will also cut back on production and lay offworkers. The recording industry businesses also decide to reduce the number of newrecordings they commission, thereby reducing the income of musicians, recordingengineers, record promoters, and other associated workers. All of the workers thatare now unemployed or working less must cut back on their purchases.
The single decision by the recording industry businesses had numerous conse-quences. By itself, it might not be enough to change the business cycle for the entirecountry. But if enough businesses make similar decisions, a contraction in the busi-ness cycle might result.
New technology Alternatively, business decisions can also increase aggregate sup-ply and fuel an expansion. For example, suppose computer chip manufacturersadopt a new technology that greatly reduces production costs. Those manufacturersbecome more productive—the supply of their products increases and the cost oftheir products goes down. Businesses that make products that use computer chipscan make their products more cheaply. Other businesses may now be able to makenew products with the more readily available computer chips. All of these busi-nesses hire more workers to handle the increased production. The aggregate supplyincreases, and the economy experiences an expansion.
Find an update on factorsaffecting the business cycleat ClassZone.com
363Economic Indicators and Measurements
FACTOR 2 Changes in Interest Rates
Another event that has a ripple effect in the economy and causes shifts in aggregatedemand and supply is a change in interest rates. Rising interest rates, for example,make it more costly for consumers to borrow money to make purchases—from tele-visions to cars to houses. This decreased purchasing power lowers the level of aggre-gate demand and promotes a contraction in the economy. When interest rates fall,the opposite happens. Aggregate demand rises, promoting an expansion.
Consider what may happen to businesses when interest rates rise. With thehigher cost of borrowing money, businesses may cut back on their investment incapital goods. As you saw earlier, such a cutback would lead to less business activityfor the producers of capital goods. As the aggregate supply decreases, a contractionin the economy is likely. But falling interest rates would lead to an increase in aggre-gate supply and an economic expansion.
Higher or lower interest rates also affect the housing market. When interest ratesare low, people are inclined to purchase housing rather than rent, so housing salesand all related economic activities increase, contributing to an economic expansion.When interest rates rise, the high cost of loans limits mortgage eligibility, so morepeople rent. Housing sales slow down, contributing to an economic contraction.
FACTOR 3 Consumer Expectations
Every month, 5,000 households are surveyed to find out how people are feelingabout the economy, and the results are published in the Consumer Confidence Sur-vey report. Why? The way consumers are feeling about prices, business activity, andjob prospects influences their economic choices, and their choices can bring aboutchanges in aggregate demand. For example, when consumers are confident about thefuture and believe that they are economically secure, they tend to consume more,driving up aggregate demand and encouraging an economic expansion.
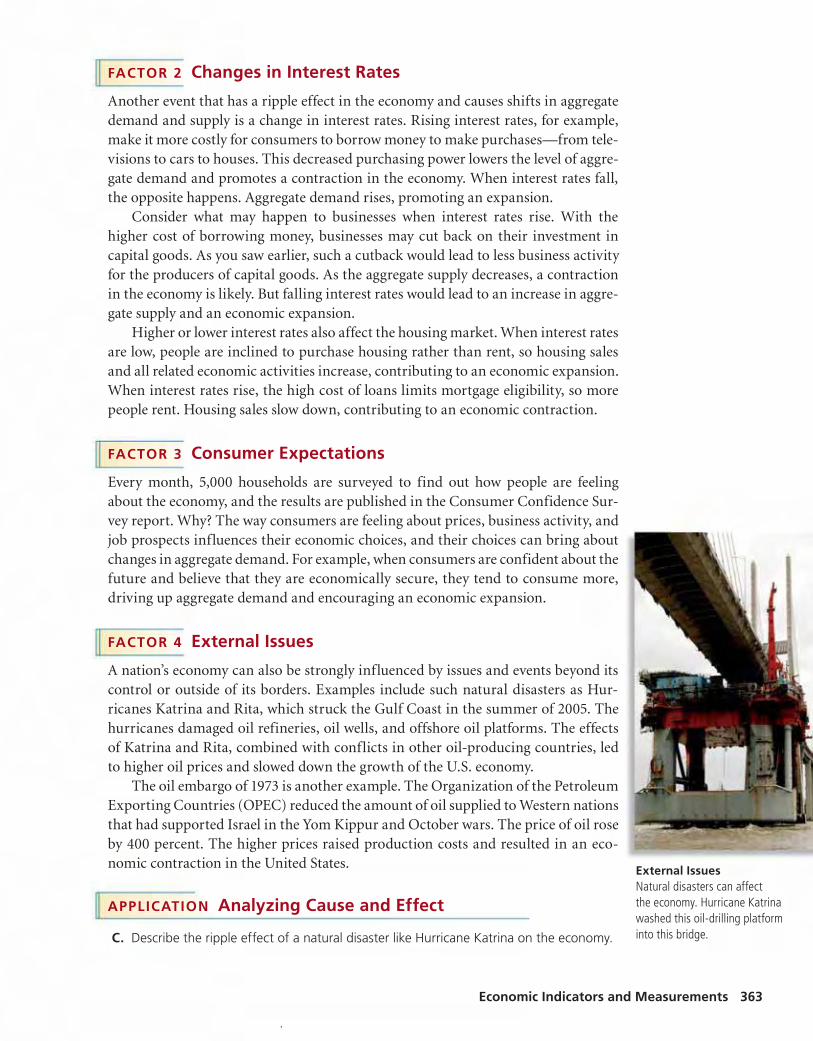
FACTOR 4 External Issues
A nation’s economy can also be strongly influenced by issues and events beyond itscontrol or outside of its borders. Examples include such natural disasters as Hur-ricanes Katrina and Rita, which struck the Gulf Coast in the summer of 2005. Thehurricanes damaged oil refineries, oil wells, and offshore oil platforms. The effectsof Katrina and Rita, combined with conflicts in other oil-producing countries, ledto higher oil prices and slowed down the growth of the U.S. economy.
The oil embargo of 1973 is another example. The Organization of the PetroleumExporting Countries (OPEC) reduced the amount of oil supplied to Western nationsthat had supported Israel in the Yom Kippur and October wars. The price of oil roseby 400 percent. The higher prices raised production costs and resulted in an eco-nomic contraction in the United States.
APPLICATION Analyzing Cause and Effect
C. Describe the ripple effect of a natural disaster like Hurricane Katrina on the economy.
.
External IssuesNatural disasters can affectthe economy. Hurricane Katrinawashed this oil-drilling platforminto this bridge.

10.5
11.0
11.5
12.0
8.5
9.0
9.5
10.0
1998
Sources: The Conference Board; U.S. Bureau of Economic Analysis; National Bureau of Economic Research
1999 2000 2001 2002 2003 2004
INDEX OF LEIFIRST QUARTER GDPSECOND QUARTER GDPTHIRD QUARTER GDPFOURTH QUARTER GDPRECESSION (MAR.-NOV. 2001)
FIGURE 12.11 U.S. LEADING ECONOMIC INDICATORS (LEI ) AND REAL GDP
Rea
l GD
P (i
n t
rilli
on
s o
f 20
00 d
olla
rs)
Year and quarter
Ind
ex of LEI
364 Chapter 12
Predicting Business Cycles
KEY CONCEPTS
Economists try to predict changes in the business cycle to help businesses and thegovernment make informed economic choices. They base their predictions on setsof economic indicators.• Leading indicators are measures of economic performance that usually change six
to nine months before real GDP changes. Examples include new building permits,orders for capital goods and consumer goods, consumer expectations, averagemanufacturing workweek, stock prices, and the money supply. Economists look fortrends in these indicators that last several months before they predict a change.
• Coincident indicators are measures of economic performance that usually change atthe same time as real GDP changes. These indicators include such items as employ-ment, sales volume, and personal income.
• Lagging indicators are measures of economic performance that usually changeafter real GDP changes. Such indicators are useful for confirming the end of anexpansion or contraction in the business cycle. They include length of unemploy-ment and the ratio of consumer credit to personal income.
APPLICATION Using a Decision-Making Process
D. If you were the manager of an electronics store, how might you use the news thatleading indicators suggest a contraction in the economy in six months?
Leading indicatorsare measures of economicperformance that usuallychange before real GDPchanges.
Coincident indicatorsare measures of economicperformance that usuallychange at the same timeas real GDP changes.
Lagging indicatorsare measures of economicperformance that usuallychange after real GDPchanges.
QUICK REFERENCE
ANALYZE GRAPHS1. Find a period of at least four quarters in which the index of leading economic indicators accurately
predicted a change in real gross domestic product.
2. Do changes in the real gross domestic product always echo changes in the index of leading economicindicators? What does this say about predicting changes in the nation’s economy?

365Economic Indicators and Measurements
Business Cycles in U.S. History
KEY CONCEPTS
The agency that tracks economic indicators and business cycles in the United Statesis the National Bureau of Economic Research (NBER). It measures contractionsfrom peak to trough and expansions from trough to peak. NBER identified about 20extended contractions, or recessions, in the American economy in the 20th century.The worst of these by far was the Great Depression.
The Great Depression
“Back in those dark depression days,” President Ronald Reaganonce recalled, “I saw my father on a Christmas Eve open whathe thought was a Christmas greeting from his boss. Instead, itwas the blue slip telling him he no longer had a job. The memoryof him sitting there holding that slip of paper and then sayingin a half whisper, ‘That’s quite a Christmas present’ –it will staywith me as long as I live.” Millions of people who lived throughthe Great Depression were haunted by such memories. For morethan a decade, beginning with the stock market crash in 1929, theUnited States and much of the world suffered a terrible economiccontraction. Not until the United States entered World War II in1941 did the American economy begin a full recovery.
Between the years 1929 and 1933, when the depression was atits worst, U.S. real GDP declined by about a third. Sales in somebig businesses, including General Motors Corporation, declinedby as much as 50 percent. In the resulting cutbacks, millions ofworkers lost their jobs. The unemployment rate skyrocketed from1929 to 1933, leaving one in four American workers jobless. Busi-nesses failed at a higher than usual rate, and banks failed at atremendously high rate. The number of bank closings, either tem-porary or permanent, soared from 659 in 1929 to 4,000 in 1933.
The New Deal
President Herbert Hoover, who had been elected in 1928, wasnot able to bring about a recovery. Franklin D. Roosevelt, accept-ing the nomination to run for president against Hoover in 1932,promised Americans “a new deal,” and the programs he enactedafter winning the election came to be known by that name. Roose-velt’s New Deal programs focused on federal spending to help the economy revive.Through a number of government agencies created just for this purpose, the Ameri-can economy came under closer government regulation and many Americans wereput back to work—employed by the federal government itself. Spending by the fed-eral government rose from about 3 percent of GDP in the 1920s to about 10 percentin the mid-1930s.
The Great DepressionMillions of Americans werethrown into poverty duringthe 1930s. These peoplereceived soup from acharity kitchen.
In this cartoon, Franklin D.Roosevelt is surroundedby children representingprograms created as partof the New Deal.
366 Chapter 12
Economists debate whether the New Deal programs led to sustained economicgrowth. But when the United States entered World War II in 1941, spending on thewar effort also helped the economy to recover. Unemployment plunged to 1.2 per-cent by 1944.
Business Cycles Since the Great Depression
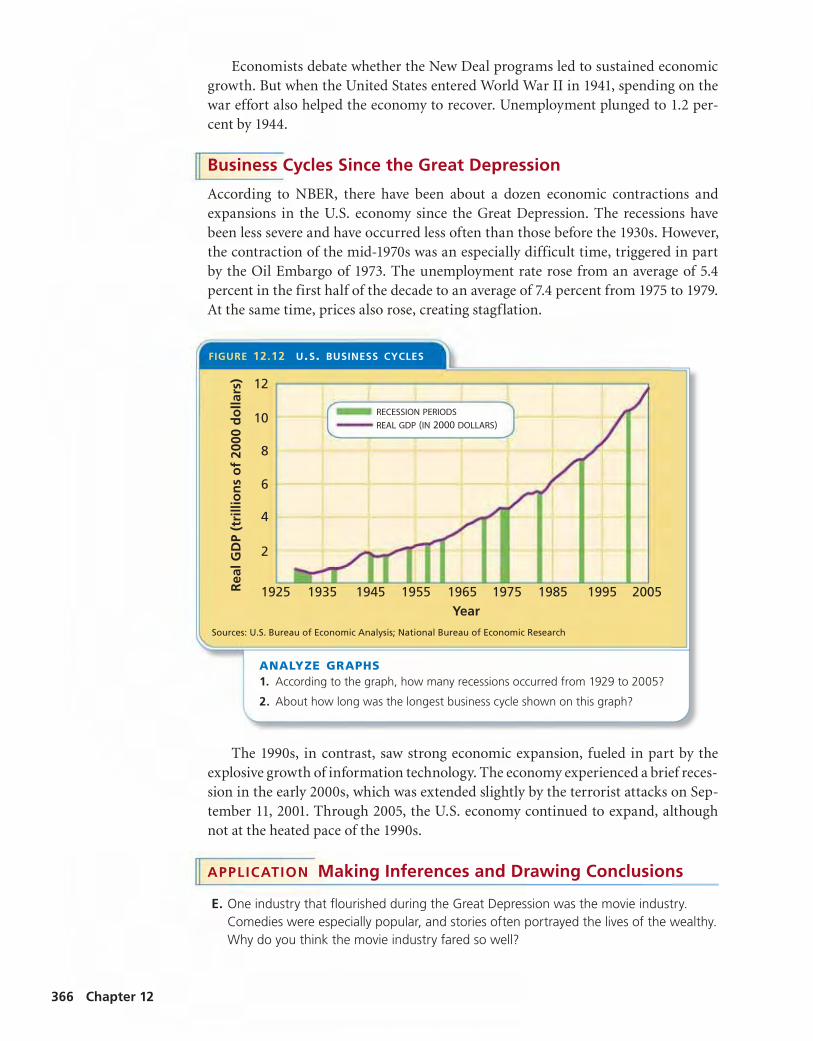
According to NBER, there have been about a dozen economic contractions andexpansions in the U.S. economy since the Great Depression. The recessions havebeen less severe and have occurred less often than those before the 1930s. However,the contraction of the mid-1970s was an especially difficult time, triggered in partby the Oil Embargo of 1973. The unemployment rate rose from an average of 5.4percent in the first half of the decade to an average of 7.4 percent from 1975 to 1979.At the same time, prices also rose, creating stagflation.
The 1990s, in contrast, saw strong economic expansion, fueled in part by theexplosive growth of information technology. The economy experienced a brief reces-sion in the early 2000s, which was extended slightly by the terrorist attacks on Sep-tember 11, 2001. Through 2005, the U.S. economy continued to expand, althoughnot at the heated pace of the 1990s.
APPLICATION Making Inferences and Drawing Conclusions
E. One industry that flourished during the Great Depression was the movie industry.Comedies were especially popular, and stories often portrayed the lives of the wealthy.Why do you think the movie industry fared so well?
2
4
6
8
10
12
1925 1935 1945 1955 1965 1985 1995 20051975Year
Rea
l GD
P (t
rilli
on
s o
f 20
00 d
olla
rs)
FIGURE 12.12 U.S. BUSINESS CYCLES
Sources: U.S. Bureau of Economic Analysis; National Bureau of Economic Research
RECESSION PERIODS
REAL GDP (IN 2000 DOLLARS)
ANALYZE GRAPHS1. According to the graph, how many recessions occurred from 1929 to 2005?
2. About how long was the longest business cycle shown on this graph?

ClassZone.com
367
AS1
AD1
Pric
e le
vel
Real GDP
P1
Q1
MACROECONOMIC EQUILIBRIUM
ECONOMICS IN PR ACTICE
SECTION 2 AssessmentREVIEWING KEY CONC EP TS
2. Between which two points of the business cycle is a contractionmeasured?
3. What is the difference between demand and aggregate demand?
4. Name four factors that can trigger changes in the business cycle.
5. Name three coincident indicators of the Great Depression.
6. Using Your Notes Write a briefstatement of your expectations forthe economy from the point of viewof the consumer. Use your completedcluster diagram and make referencesto what you have learned about thebusiness cycle.
Use the Graphic Organizer at Interactive Review @ ClassZone.com
7. Comparing and Contrasting Economic Information Whatwere the similarities and differences between the GreatDepression and the recession in the 1970s?
8. Solving Economic Problems Did President Roosevelt’s NewDeal focus on generating aggregate demand, or was its mainfocus on increasing aggregate supply? Explain.
9. Analyzing Cause and Effect Are the components that areconsidered leading economic indicators causes or effects ofchanges in the business cycle?
10. Challenge In the 1990s many people speculated that theeconomy had been transformed by new technologies. PaulA. Volcker, former chairman of the U.S. Federal Reserve Bank,described it this way: “The speed of communication, the speed ofinformation transfer, the cheapness of communication, the easeof moving things around the world are a difference in kind as wellas degree.” Do you think that business cycles are inevitable? Canthey ever be eliminated entirely? Explain your answer.
Interpreting GraphsThe graph shows an economy at itsmacroeconomic equilibrium, wherethe aggregate demand curve (AD1)intersects the aggregate supply curve(AS1). P1 indicates the equilibrium pricelevel, and Q1 shows the equilibriumlevel of real GDP.
Draw Aggregate Demand andAggregate Supply CurvesRead the following scenarios. Copythe graph onto your own paper, thengraph the changes that would occurin the Scenario 1 in blue. Graph thechanges that would occur in theScenario 2 in red.
Scenario 1: In a booming economy,interest rates begin to rise.Manufacturers and other producers,wary of borrowing money at higherrates, begin to cut back on production.
Scenario 2: Consumer confidence ishigh. Most people are optimistic abouttheir job prospects and security, andthey are willing to spend moneyon luxuries.
Challenge As a consumer, howmight your confidence be affected inScenario 1?
1. Explain the relationship between the terms in each of these pairs.
a. contractionexpansion
c. leading indicatorslagging indicators
b. aggregate demandaggregate supply
BusinessCycle
stages
C RIT IC AL THINKING
Use @ ClassZone.comto complete this activity.
3SECT ION
368 Chapter 12
OBJECT IVES KEY TERMS TAKING NOTES
As you read Section 3, completea summary chart like the onebelow to record what you learnabout economic growth. Use theGraphic Organizer at InteractiveReview @ ClassZone.com
In Section 3, you will
• explain how economistsmeasure growth
• analyze the causes ofeconomic growth
• discuss how productivity andeconomic growth are related
real GDP per capita, p. 369
labor input, p. 371
capital deepening, p. 371
productivity, p. 372
multifactor productivity, p. 372
What Is Economic Growth?
KEY CONCEPTS
In Section 2 you learned about the business cycle, the pattern of expansion and con-traction in a nation’s economy. In this section you will learn more about economicgrowth, as measured by changes in real gross domestic product (GDP).
Gauging Economic Growth
Before Adam Smith (whom you learned about in Chapter 1, Section 4), many peoplebelieved that population growth and higher taxation were the secrets to economicgrowth. The theory held that more people paying more taxes was the best way tofill a nation’s treasury. Another view, called mercantilism, argued that increasednational wealth came through exporting more goods than a country imports. Inthis way, the country would gain gold or silver currency from other countries.
Adam Smith, however, saw that the real “wealth of nations” lay in their productivecapacities. Taxes could be so high that they limit the amount of funds available forbusiness investment and consumer spending, thereby reducing economic growth.In Smith’s view, foreign trade allows a country to focus its resources on what it doesbest. The more efficiently a nation uses its resources, the more productive it will beand the larger its economy will grow. Smith’s views proved to be accurate, and theyserve as the basis for modern economics.
The best measure of economic growth is not simply the amount of money anation has or how much its population increases, but rather the increase in its realGDP. The rate at which real GDP changes is a good indicator of how well a country’sresources are being utilized.
Stimulating EconomicGrowth
What Is Economic
Growth?

5,000
10,000
15,000
20,000
25,000
30,000
35,000
40,000
19651960 1970 1975 1980 1985 1990 1995 2000 2005
Rea
l GD
P p
er c
apit
a (2
002
do
llars
)
FIGURE 12.13 U.S. REAL GDP PER CAPITA
Source: U.S. Bureau of Labor Statistics
369Economic Indicators and MeasurementsEconomic Indicators and Measurements
Population and Economic Growth
Population growth influences economic growth. A country’s real GDP might begrowing, but if its population is growing at an even faster rate, the increase in realGDP might simply reflect more workers contributing to the economy. Think of apotluck dinner. If each person brings one dish, the amount of food per person willbe the same whether you invite 10 people or 100.
To get a clearer picture of economic growth, economists use a measure calledreal GDP per capita, which is real GDP divided by total population. Real GDP percapita reflects each person’s share of real GDP. In terms of the potluck dinner, ifeach person brings more than one dish to the next potluck, the amount of food perperson will have increased.
Real GDP per capita is the usual measure of a nation’s standard of living. Nationswith higher real GDP per capita tend to have populations that are better educatedand healthier. However, real GDP per capita does not mean that each person gets thatamount of money. Some people will get more, others less. It also does not measurequality of life. For example, people might have to work longer hours to achieve higherrates of economic growth, leaving them with less leisure time.
APPLICATION Explaining an Economic Concept
A. Why does a nation’s real GDP have to increase at a faster rate than its population forsignificant economic growth to take place?
ANALYZE GRAPHS1. About how much was real GDP per capita in 1990?
2. About how many years did it take for real GDP per capita to double from its levelin 1960?
Real GDP per capita isreal GDP divided by totalpopulation.
QUICK REFERENCE
Find an update on U.S.real GDP per capita atClassZone.com

370
What Determines Economic Growth?
KEY CONCEPTS
What drives economic growth? Why are some nations growing at a faster pace thanothers? Four key factors influence the rate of economic growth—natural resources,human resources, capital, and technology and innovation.
FACTOR 1 Natural Resources
One factor in economic growth is access to natural resources, especially arable land,water, forests, oil, and mineral resources. However, some countries, such as Japan,have very limited natural resources, yet their economies have grown rapidly. Others,such as India, which has the fourth-largest reserve of coal in the world and arableland covering more than half its territory, have developed more slowly.
CONNECTING ACROSS THE GLOBE1. Synthesizing Economic Information What role do natural resources play in a country’s economic
strength? Explain your answer.
2. Drawing Conclusions Figure 12.14 illustrates oil production and consumption in Nigeria and Japan.What would happen to each country’s economy if it produced less oil? What if each produced more?
A GLOBAL PERSPECTIVEPERSPECTIVE
0
1
2
3
4
5
6
Bar
rels
per
day
(in
mill
ion
s)
consumption
production
JapanNigeria
FIGURE 12.14 OIL PRODUCTION ANDCONSUMPTION
Source: U.S. Central Intelligence Agency, 2003 data
Do Natural Resources Guarantee Wealth?Not necessarily. In fact, countries with abundantnatural resources generally do not perform aswell economically as countries with fewer naturalresources—a phenomenon economists refer toas “the resource curse.” In Nigeria, for example,although oil is plentiful, personal income is low. GDPper capita is about $1,400 (in U.S. dollars). Poverty iswidespread, with an estimated 60 percent of Nigeria’spopulation below the poverty line—and Nigeria hasthe largest population of any African country.
At the other end of the spectrum is Japan. Althoughthe country has few natural resources, the strength ofJapan’s economy is second only to that of the UnitedStates. GDP per capita is about $30,000 (in U.S. dollars).What Nigeria lacks, but Japan has, are the basic structuresof a free market economy—private ownership, theprofit motive, an effective government, and economiccompetition. These economic institutions are moreimportant than natural resources for generatingeconomic growth. Japan, with few natural resources,achieved economic success by developing alternativesources of wealth—industry and foreign trade.

371Economic Indicators and Measurements
FACTOR 2 Human Resources
Another key factor in economic growth is the labor force. Economists measure thispartly through labor input—the size of the labor force multiplied by the length ofthe workweek. The steady declines in the length of the workweek in most countriessince the early 1900s have been more than made up for by the growth in the popula-tion, so labor input has grown. Perhaps even more important than the raw numbers,however, is the level of human capital—the skills and knowledge—that the laborforce brings to its tasks. Some economists believe that human capital is the singlemost important component in economic growth.
FACTOR 3 Capital
You learned in Chapter 1 that natural resources, labor, and capital come togetherthrough the creativity of an entrepreneur to produce goods and services. Capitalis critical to this process and to economic growth. More and better capital goodsincrease output: the more machines a factory has and the better designed they are,the more goods the factory can churn out. Multiply this by the number of factoriesacross a nation and the increased output equals higher GDP.
The economy also grows when more capital is available per worker. An increasein the capital to labor ratio is called capital deepening. In other words, workers areprovided with more and better equipment to work with. The Industrial Revolutionis a prime example of capital deepening. Sewing machines, for example, allowedclothing manufacturers to make more clothing per worker than if the workers hadbeen sewing by hand.
FACTOR 4 Technology and Innovation
Technology and innovation are also important factors in economicgrowth. These factors promote the efficient use of other resources,which in turn leads to increased output. Some of the key technologicaldevelopments that have contributed to economic growth include steampower, electricity, and the automobile.
Innovations can also increase economic growth. Something assimple as adjusting an order form can contribute to economic growthby reducing the amount of time needed to complete a task. Otherinnovations might improve customer service or reduce the amount ofmaterial needed to create a product.
Information technology has had a strong impact on economicgrowth. Technological advances in producing the information tech-nology itself have led to a dramatic decline in prices. With lowerprices for technology, firms are engaging in capital deepeningwithout having to spend more money.
APPLICATION Writing About Economics
B. Using the four factors, explain how developing countries like Nigeria might improvetheir economic growth.
Labor input is thesize of the labor forcemultiplied by the length ofthe workweek.
QUICK REFERENCE
Technology andInnovationTechnological advancementshave increased economicgrowth.
Capital deepening isan increase in the ratio ofcapital to labor.
QUICK REFERENCE

372 Chapter 12
Productivity and Economic Growth
KEY CONCEPTS
Productivity refers to the amount of output produced from a set amount of inputs.When the same amount of inputs produces more output, productivity has increased.In Chapter 9, you learned about labor productivity—the amount of goods or servicesproduced by a worker in an hour. But the broader sense of productivity includes theproductivity of both labor and capital.
For example, imagine that you begin building bookshelves. The inputs wouldinclude your labor plus capital, in the form of the workshop, hammers, glue, andother supplies. At first, it may take you a week to complete one bookshelf. In theprocess, you may waste materials as you make mistakes, and you may find that someof your tools are not ideal for the task. But after you have built several bookshelvesand acquired the right tools for the job, your productivity increases. Using the sameamount of input, you might now be able to produce two bookshelves per week.
This section concerns the productivity of a country’s entire economy. As a countrybecomes more productive, its economy is likely to grow.
How Is Productivity Measured?
To measure the productivity of a single business, you would compare the inputs tothe outputs. Using the bookshelf example, you would compare the amount of capitaland number of hours worked to the number of bookshelves produced. But how canwe measure the productivity of a nation’s economy, which is made up of millions ofdifferent people and businesses? Economists use a measurement called multifactor
productivity, the ratio between an industry’s economic output and its labor and capitalinputs. By collecting multifactor productivity data on a country’s major industries andbusiness sectors, economists can estimate the productivity of the entire economy.
What Contributes to Productivity?
Several factors contribute to changes in productivity.
Quality of Labor A better educated, healthier workforce tends to be more produc-tive. Using the bookshelf example, if you were to take classes in woodworking, yourenhanced knowledge would enable you to produce more and better shelves. In gen-eral, the more educated the workforce, the more productive it is. As for health, peopleare usually more productive when they feel well than when they feel sluggish or ill.
Technological Innovation Historically, as during the Industrial Revolution, newmachines and technologies helped countries produce more output from the sameamount of inputs. In recent times, the desktop computer and computer technologygenerally have generated productivity gains.
Energy Costs Gas, electricity, and other fuels power the technologies that increaseproductivity. When energy costs rise, those tools become more expensive to use andproductivity declines. By the same token, when energy costs fall, using advancedtools becomes less expensive and productivity rises.
Productivity is the ratioof the amount of outputproduced to the amountof input.
QUICK REFERENCE
Multifactor productiv-ity is the ratio between theamount of output producedby an industry or businesssector and the amount ofinputs used.
QUICK REFERENCE

373Economic Indicators and Measurements
Financial Markets The easier it is for funds to flow to where they are needed, themore productive the economy becomes. Banks, stock markets, and similar institu-tions allow a country’s funds to be put to their best use. When such institutions donot exist or when they do not function efficiently, productivity is reduced.
How Are Productivity and Growth Related?
Economic growth is a measure of change in production. It does not consider howmuch effort or how many resources it took to produce that quantity of production.Productivity, on the other hand, is a measure of efficiency. It reflects the amount ofeffort and resources it took to produce a certain quantity.
A country could experience economic growth—as measured by real GDP—without increasing its productivity. Such growth would be tied to an increase in thequantity of natural resources, labor, capital, or technology. If the productivity of acountry increases, its real GDP can grow without increasing the quantity of inputs.
As shown in Figure 12.15, productivity in the United States grew at a steady pacefrom 1950 to 2000. Among other things, a better educated labor force and advancesin information technology contributed to the increase. The dips in the graph repre-sent productivity setbacks, such as tighter financial markets during recessions.
APPLICATION Drawing Conclusions
C. Some countries have limited natural resources but high economic growth. Does thisprove that worldwide economic growth is unlimited by natural resources?Why or why not?
FIGURE 12.15 U.S. PRIVATE BUSINESSMULTIFACTOR PRODUCTIVITY
Source: U.S. Bureau of Labor Statistics
Rea
l val
ue-
add
ed o
utp
ut
(in
dex
yea
r 20
00=
100)
30
40
10
20
1955 1965 1975 1985 19951950 1960 1970 1980 1990 2000
50
60
Year
708090
100
ANALYZE GRAPHS1. What happened to productivity in the three years after the 1973 oil embargo? Why?
2. Compare this graph with Figure 12.13 on page 369, which shows real per capitaGDP. How closely is economic growth related to productivity?

374 Chapter 12
Thomas Robert Malthus:The Population Problem
In the late 1700s, many European thinkers and writers predicted a future of peace andharmony in which poverty and hunger would be eliminated. Discussing humanity’sfuture with his father led Thomas Robert Malthus to question whether the prevail-ing view was perhaps too rosy. Malthus saw a problem that others had overlooked,namely, that the world’s population seemed likely to outgrow the available supply offood. He published his ideas in 1798 in “An Essay on the Principle of Population asIt Affects the Future Improvement of Society.”
A Natural Limit to Economic Growth?
Malthus’s essay argued that human population wouldincrease geometrically—that is, it would double—every 25 years. Malthus also estimated that foodproduction would only increase arithmetically—thatis, by the same amount each time—over that timeperiod. Figure 12.16 uses hypothetical numbers toillustrate the problem. As time went on, agriculturewould produce less food per person, and millionswould be thrown into poverty and starvation.
“An Essay on the Principle of Population” caused atremendous backlash. People could not accept that therosy future they had imagined might not come to pass.Malthus and his essay were widely attacked and criti-cized—but no one could ignore his argument.
Malthus’s estimates turned out to be flawed.Human population increased at a slower pace thanhe predicted. World population was about 1 billionin 1800, but it took until 1930 toreach 2 billion. Agricultural pro-ductivity rose dramatically withthe introduction of mechanizedfarming and advances in fertiliza-tion and pest control. Althoughworld population acceleratedaround 1950, reaching about 6.5billion by 2005, agricultural pro-duction kept pace with the grow-ing population.
APPLICATION Applying Economic Concepts
D. How is Malthus’s population problem an example of the problem of scarcity?
Thomas Robert MalthusMalthus predicted a populationexplosion that would result inpoverty and famine.
ECONOMICS PACESET TER
Thomas RobertMalthus
Career: British economist
Born: February 17, 1766
Died: December 23, 1834
Major Accomplish-ment: Calling attentionto the issue of populationgrowth
Major Work: Essay onthe Principle of Population(1798, revised 1803)
Famous Quotation:“Population, whenunchecked, increases ingeometrical ratio. Subsis-tence increases only in anarithmetical ratio.”
Influenced:David RicardoCharles Darwin
FAST FACTS
FIGURE 12.16 MALTHUS’S POPULATION PROBLEM
ElapsedYears
Bushels ofWheat (inmillions)
Population(in millions)
Bushelsper Person
0 10 10 1.00
25 20 20 1.00
50 30 40 0.75
75 40 80 0.50
100 50 160 0.31
Find an update onThomas Robert Malthusat ClassZone.com

ClassZone.com
375
ECONOMICS IN PR ACTICE
SECTION 3 AssessmentREVIEWING KEY CONC EP TS
2. Name the key measurement of economic growth.
3. What four factors drive economic growth?
4. How are productivity and growth related?
5. Briefly explain the problem Malthus identified.
6. Using Your Notes Write apersuasive paragraph arguingone side or the other ofeconomic growth possibilities.Refer to your completedsummary chart.
Use the Graphic Organizerat Interactive Review @ ClassZone.com
7. Solving Economic Problems In 2000, the world’s populationwas about 6 billion, and about 800 million of those people didnot have enough to eat. By 2050, the world’s population isexpected to grow to about 9 billion. What steps should we takenow to avoid having more than 1 billion people without enoughto eat by 2050? Employ the ideas you learned about in thissection in formulating your solution.
8. Explaining an Economic Concept Why is real GDP per capitaa useful measure? Why couldn’t real GDP or GDP per capita beused for the same purpose?
9. Analyzing Cause and Effect Globalization opens internationalboundaries to companies, creating markets that stretch aroundthe world. What role might global competition play in thedevelopment of innovations?
10. Challenge Going to school is your job. Your product is increasingyour knowledge, and your grades are the main measure of this.Increasing your productivity would result in better grades—andmore free time. Adapt the factors that contribute to economicproductivity to explain how you might increase your productivityas a student.
Stimulating Economic GrowthGovernment policies affect economicgrowth. Some policies haveimmediate effects that last for a shorttime. Other policies take longer toshow results but have lasting impact.
Create a Healthy EconomyReflecting on what you learned inthis section, consider the followingpossible government actions.
• open a protected wilderness areafor coal mining
• increase funding for scholarshipsfor low-income students
• provide tax breaks for companiespurchasing new equipment
• strengthen laws protecting therights of inventors
Explain how each potential actionmight lead to economic growth.
Challenge Estimate the costs andthe benefits of each action. Whichactions would have the most lastingpositive effect on the economy?
1. Explain the differences between the terms in each of these pairs.
a. economic growthreal GDP per capita
b. capital deepeninglabor input
C RIT IC AL THINKING
What Is Economic
Growth?
A busy factory is one route toeconomic growth.

Find an update on this CaseStudy at ClassZone.com
376 Chapter 12
Case Study
Poland: Economic Freedomand Economic GrowthBackground Communists ruled Poland and controlled its economy from 1948to 1989. After holding its first free elections in 1990, Poland made rapid progresstoward full democracy and a free market economy. Economic reforms includedending government price controls, privatizing industries formerly controlled bythe government, and entering the international marketplace. As Poland movedaway from government control of the economy, it experienced a surge in economicgrowth—outdistancing many other former Communist countries in eastern andcentral Europe. In 2004, Poland became a member of the European Union, furtherincreasing its economic potential.
What’s the issue? How successful is Poland’s economy? Read these documentsto learn about the challenges and rewards of the country’s economic transition.
A.OnlineNewsArticle
Wroclaw, a city insouthwest Poland,offers one exampleof the country’ssuccess throughembracing globalcapitalism. Thisarticle describesthat phenomenon.
Wroclaw, Poland: Europe’sNext Appliance Capital?Appliance Manufacturers Pour into SouthwestPoland
Money and companies are pouring in—not just theprestige nameplates like Bombardier, Siemens, Whirlpool,Toyota, and Volvo, but also the network of suppliers thatinevitably follows them. At first, most of the new jobswere of the semi-skilled variety. Now they have beenfollowed by design and engineering work that aims totap into the largest concentration of university students inEastern Europe.
“Everyone is coming, and they are coming very fast,”reports Josu Ugarte . . . who heads the appliancemanufacturing operations here of Mondragon, the giantSpanish industrial cooperative. He predicts, confidently,that the region around Wroclaw will soon surpassNorthern Italy as Europe’s appliance capital. . . .
The secret isn’t just lower wages. It’s also the attitudeof workers who take pride and are willing to do what isnecessary to succeed, even if it means outsourcing partsproduction or working on weekends or altering vacationschedules. . . .
Source: “Europe’s Capitalism Curtain” WashingtonPost.com July 23, 2004
Thinking Economically How has Poland’s human capital contributed to thecountry’s economic growth?
Many manufacturershave opened factories inWroclaw, Poland. ThisVolvo factory producesbuses.

377Economic Indicators and Measurements
THINKING ECONOMICALLY Synthesizing
1. Which economic measurements and indicators are evident in documents A and C? Explain whatthey convey about the strengths and weaknesses of Poland’s economy.
2. What factors have driven Poland’s economic growth?
3. Compare documents A and C, written about six months apart. What continued economic trendsand new economic strengths do they describe?
B. PoliticalCartoon
Poland’s farmers weresceptical about thebenefits of EuropeanUnion membership.This cartoon reflectstheir change of heartas agricultural exportsincreased and theyreceived new subsidiesfrom the EuropeanUnion.
Thinking Economically Does the cartoon emphasize thefree market benefits of the European Union or other benefits?
Reaping the European Union HarvestHow the new central European members learnt to stop worrying andlove the European Union
After grumbling furiously about dangers to their sovereignty and their social values whenthey joined the European Union in May, Poles are discovering themselves now to beamong the Union’s most loyal citizens. Some three-quarters say they are happy with EUmembership—and no wonder. In its first eight months of membership Poland got some
2.5 billion [ is the euro, the currency of the European Union] ($3.4 billion) from the EUbudget, or roughly twice what it paid in, according to the newspaper Rzeczpospolita. Ruralincomes have risen by one-third for small farmers and two-thirds for big ones, reversingeight years of stagnation and decline, thanks to munificent EU subsidies and an influx offoreign buyers offering high prices for Polish meat and fruit.
Poland’s total exports rose by more than 30% in the first nine months of 2004, helpedby the abolition of customs formalities. EU rules have opened the skies to budget airlines,boosting tourist numbers by 20% last year. Higher-than-expected tax revenues have meantlower-than-expected budget deficits. . . .
Source: The Economist, January 8, 2005
Joining theEuropeanUnion broughttremendousgrowth to Poland’seconomy. Thisarticle explainssome of theelements that ledto the success.
Thinking Economically According to the document, how has membership in the EUhelped Poland’s economic growth?
C. MagazineArticle
Source: The Economist

Complete the following activity either on yourown paper or online at ClassZone.com
378 Chapter 12
CHAPTER 12 AssessmentREVIEWING KEY CONC EP TS
Review this chapter using interactiveactivities at ClassZone.com
aggregate demandaggregate supplybusiness cyclecapital deepeningcoincident indicatorsdepressiondisposable personal income (DPI)economic growthgross domestic product (GDP)gross national product (GNP)lagging indicatorsleading indicators
macroeconomic equilibriumnational income (NI)national income accountingnet national product (NNP)nominal GDPnonmarket activitiesper capita real GDPpersonal income (PI)real GDPrecessionstagflationunderground economy
1 , the market value of all goods and servicesproduced in a nation, is one of the key measure-ments used in 2 . 3 is especially useful becauseit gives the market value of all goods and servicescorrected for price level changes. Another veryuseful measurement is 4 , which shows theactual amount of money people have to spend.
The economy goes through regular changescalled the 5 . Economists watch 6 , such asbuilding permits issued and stock prices, topredict changes in the economy. Low points in theeconomy are usually self-correcting, but in timesof a 7 , such as the one that happened in the1930s, government intervention may be needed.
Several factors influence 8 , including anincrease in capital. 9 , an increase in the ratiobetween capital and labor, increases productivity,helping the economy grow. Economists use 10 , real GDP divided by whole population,
to distinguish an increase in population from ahigher level of economic output.
Choose the key concept that best completesthe sentence. Not all key concepts will be used.
Gross Domestic Product and Other Indicators(pp. 350–357)
1. What is the purpose of national incomeaccounting?
2. In what way is GDP a baseline for other economicindicators?
Business Cycles (pp. 358–367)
3. What do leading indicators say about the economy?
4. Explain how a business decision might have a rippleeffect that would tilt the economy on a new phaseof the business cycle.
Stimulating Economic Growth (pp. 368–377)
5. Explain how a country with few natural resourcescan still have economic growth.
6. What are the four key factors that influence economicgrowth?
The table below shows the size of the undergroundeconomies of selected countries.
7. Is there a relationship between GDP per capita andthe size of a country’s underground economy?
8. If a country incorporated its underground economyinto the main economy, what would happen to itsGDP per capita? Why?
APPLYING ECONOMIC CONC EP TS
• Online Summary• Quizzes• Vocabulary Flip Cards
• Graphic Organizers• Review and Study Notes
FIGURE 12.17 UNDERGROUND ECONOMIES INSELECTED COUNTRIES
Country GDP Per Capita(in U.S. dollars)
UndergroundEconomy as
Percent of GDP
Egypt 3,900 69
Thailand 8,300 70
Russia 11,100 44
Chile 11,300 19
Singapore 28,100 14
Italy 29,200 27
Switzerland 32,300 9
United States 41,800 10
Sources: International Monetary Fund, U.S. CentralIntelligence Agency, 1998-2005 data

Economic Indicators and Measurements 379
S I M U L AT I O NC RIT IC AL THINKING
9. Creating Graphs Copy the blank graph onto yourown paper. Then use the data in the table to createa line graph showing the percent change in U.S. realgross domestic product from 1999 through 2003.
Use @ ClassZone.comto complete this activity.
10. Analyzing and Interpreting Data Which yearhad the highest growth? The lowest?
11. Analyzing Cause and Effect The governmentenacted tax cuts and issued child tax credit refundsin 2003. What component of GDP would likely haveincreased because of these?
12. Distinguishing Fact from Opinion Does the graphsupport or counter the idea that the September 11,2001 terrorist attacks caused a recession?
13. Challenge How could GDP grow by 5 percent ayear but leave the economy no better off—or evenworse off? Give two different explanations.
Surveying Consumer ConfidenceThe Consumer Confidence Survey is one poll usedto determine consumer expectations. Another is theABC/Washington Post Consumer Comfort Index, whichmakes 1,000 phone calls to adults each month and asksthe following questions:
• National Economy: “Would you describe the state ofthe nation’s economy these days as excellent, good, notso good, or poor?”
• Personal Finances: “Would you describe the stateof your own personal finances these days as excellent,good, not so good, or poor?”
• Buying Climate: “Considering the cost of things todayand your own personal finances, would you say now isan excellent time, a good time, a not so good time, or apoor time to buy the things you want and need?”
To understand the consumer comfort index better, takea survey of your class.
Step 1. Break into five small groups and discuss each ofthe questions. The point is to share your thoughts, notto debate who is right or wrong.
Step 2. Return to your desk and write down youranswers to each of the questions anonymously.
Step 3. Collect the anonymous answers from thewhole class. Have one person tabulate the answers toeach question on the board.
Step 4. Now calculate the consumer confidence of yourclass. For each question, add up the number of positiveresponses (either “excellent” or “good”). Then subtractthe number of negative responses (either “not so good”or “poor”). Divide by the total number of students andmultiply by 100.
Add the result from all three questions together, andthen divide by three. That will yield an overall comfortlevel. A level of 100 would mean everyone is satisfiedwith everything. A level of �100 would mean thateveryone felt negatively about everything.
Step 5. Discuss the result. Does it seem to accuratelyreflect the mood of the class? What would happen tothe nation’s GDP if all consumers felt as you do?
FIGURE 12.18 PERCENT CHANGE IN REAL GDP FROMPRECEDING PERIOD
Year and quarter
Perc
ent
chan
ge
–2.0
0
2.0
4.0
6.0
8.0
2001 2002 20031999 2000
Year Quarter 1 Quarter 2 Quarter 3 Quarter 4
1999 3.4 3.4 4.8 7.3
2000 1.0 6.4 –0.5 2.1
2001 –0.5 1.2 –1.4 1.6
2002 2.7 2.2 2.4 0.2
2003 1.7 3.7 7.2 3.6
Source: U.S. Bureau of Economic Analysis