12- - nasa · although the koroll and mulpuru results offer important chemical kinetic insight on...
TRANSCRIPT

/ I'19 1- 12-
Effects of HaO, COa, and N2 Air Contaminants on Critical Airside Strain
Rates for Extinction of Hydrogen-Air Counterflow Diffusion Flames
By G. L. Pellett,* L. C. Wilson, G. B. Northam,** and Rosemary Guerra ++
Hypersonic Propulsion Branch (MS 168)
NASA Langley Research Center, Hampton, VA 23665-5225
ABSTRACT
Coaxial tubular opposed jet burners (2.7, 5.0 and 7.0 mm i.d. OJB) were used to form dish shaped counterflow diffusion flames (CFDF), centered by opposing laminar jets of Ha (N2 diluted in some cases) and both clean and contaminated "air" (02/N2 mixtures) in an argon bath at 1 atm. Jet velocities for flame extinction (Blowoff) and restoration (Restore) limits are shown versus wide ranges of contaminant (0 to 20 mole %) and Oa (16% to 30%) concentrations in the air jet, and also input Ha concentration (30% to 100%). Blowoff, a sudden breaking of CFDF to a stable ring shape, occurs in highly stretched stagnation flows and is generally believed to measure kinetically limited flame reactivity. Restore, a sudden restoration of central flame, is a relatively new phenomenon which exhibits a Ha-dependent hysteresis from Blowoff. Both 2.7 and 7.0 mm OJB jet velocities at Blowoff were converted to critical radial strain rates, a; resultant Sair were 3 to 5 times smaller than recently published numerical results for 100%, 50%, and 21% Ha/N2 fuel inputs and normal air. Whereas measured afuel doubled over the range 80 to 100% Ha, aair was constant. The 5air for pure Ha is considered a valid relative measure of kinetically controlled 02 consumption by a Ha-air CFDF just before extinction. Furthermore, Sair is a more fundamental measure of CFDF extinction than previously used fuel velocity (or strain rate), which mainly satisfies jet momentum balance for centering an OJB flame.
For 25% 02 "air" mixtures, mole-for-mole replacement of 25% N2 contaminant by steam increased U(air) or "flame strength" at Blowoff by about 5%. This result is consistent with laminar burning velocity (Su) results from analogous substitution of steam (25%) for N2 in a premixed stoichiometric Ha-Oa-N2(or steam) flame, shown by Koroll and Mulpuru to promote a 10% increase in experimental and calculated So, due to enhanced third body (M) efficiency of water in: H + 02 + M ---> HOa + M. When the OJB results were compared with Liu and MacFarlanes's experimental Su of premixed stoichiometric 5k + air + steam (where N2 + steam > 55.7 mole %), a crossover occurred, i.e. steam enhanced OJB "flame strength" at extinction relative to Su. This finding remains consistent with Koroll and Mulpuru's extensive Su results, however, which show a crossover at 45% inert in stoichiometric Ha-Oa-inert flames; i.e. substitution of steam for Nz (> 55.7% inert) decreases Su, due to dominance of thermodynamic effects at lower 02 levels. Overall, the relative effect of steam, compared to N2, on extinction of Ha vs. air + steam CFDF is about one-half the incremental. effect on Su of stoichiometric Ha + Oa ^ N2 + steam mixtures over a wide range of concentrations. In contrast, COa contamination significantly reduced U(air) at extinction relative to steam. Finally, unpublished analyses of previous OJB data on extinction of }k/N2 jets vs. contaminated air yielded characterizations of the U(air) intercept, at unity Ha mole fraction, as functions of N, CO2, and also NO, CO concentrations in air; results were generally consistent with recent data derived from pure Ha jets.
NOMENCLATURE
X(i) = mole fraction of incoming species i in fuel or air jet. Ha/Oa = incoming ratio of mole Ha/mole 0 in air. M(Ha) = average mass flux, over tube cross section, of incoming Ha in fuel mix, g Ha/cm2-s. C(i) = mole percentage of contaminant i in incoming air jet. Dc = normalized linear percent decrease of U(air) or M(H2) per mole percent contaminant. U(air) = average velocity of air jet at tube exit, cm/s.
t Research Scientist, Hypersonic Propulsion branch, Fluid echanics Division.
** Combustion Diagnostics Group Leader, Hypersonic Pro pulsion Branch, Fluid echanics Division.
+ Research Test Operations Associate, Lockheed Engineering and Sciences Company. L ) t q ++ Former HS Graduate Student, George Washington University. Currentl y , Rocketdy ne Corporation.
This paper is approved for public release; distribution is unlimited.
23
https://ntrs.nasa.gov/search.jsp?R=19910007813 2018-07-28T23:06:40+00:00Z

BACKGROUND AND INTRODUCTION
Because of recent interest in National Aero-Space Plane technological developments, there is need to understand the influence of certain facility related (typically combustion produced) air contaminants on the ignition and extinction of H2-air diffusion flames in high speed shear flows. For example, because ground-based testing of H2-air scramjet combustors requires high enthalpy supersonic air, which typically is grossly contaminated with CO and/or HzO, flameholding of highly stretched 82-air diffusion flames in local recirculation regions may be perturbed relative to inlet air from the free atmosphere. Specifically, the presence of up to 30% 820, 10% CO2, and 3% NO are of concern when Ha and hydrocarbon (HC) vitiated air, and arc jet facilities are used. For example, rlier studies of the effects of contaminants on Ha ignition and combustion,' using shock tube
ignition techniques, 2 jet stirred combustor residence time studies, and laminar burning velocity measurements in conical flames 4-6 have relevance to ignition and combustion limits for mixtures,1 but not for unpremixed combustion.
An opposed jet burner (OJB) technique was previously developed at NASA LaRC to characterize the effects of key air contaminants on strain (flame stretch) induced extinction limits of 82 diluted Ha
versus air counterfiow diffusion flames (CFDF). Extensive measurements of critical jet mass flow rates which led to sudden extinction of central flame formed by a N2-diluted Ha jet opposed by air, were reported for clean and contaminated airs. Resulting critical jet input velocities, U(air) and U(fuel) can be generalized for application to practical systems by estimating corresponding axial-input and radial-output strain rates (velocity gradients). Although the author's previous exclusive use of input hydrogen mass fluxes, M(82), and molar Ha/Oa input ratios was technically adequate for characterizing extinction (Blowoff) and reignition (Restore) of these flames as a function of Ha mole fraction in the fuel jet, X(Ha), it tended to obscure the fundamental nature of the results, as described below.
Recent LDA axial velocity measurements using the authors' 7 mm OJB, considerations of input jet momentum balances, and reduction and crossplotting of earlier data highlighted a basic recognition that, whereas U(fuel) at extinction generally doubled over the fuel input range of 0.8 < X(Ha) < 1, U(air) remained virtually constant. This led to a hypothesis that chemical kinetics control the combustion rate of 02 in this constant air velocity region. 6 Because the molar Ha/02 input ratio greatly exceeds the stoichiometric ratio of 2 in this regime, overall Ha is in excess and the supply of hydrogen to the reaction zone (predicted and observed ° on the airside of the stagnation surface) is achieved by molecular and thermal diffusion of Ha and H. Thus an exponential increase in fuel jet velocity as X(H) increases simply satisfies the fuel-air jet momentum balance to stabilize the flame centrally. As a correlary to this new interpretation, it follows that U(air) should be the preferred yardstick for measuring the effects of air contaminant concentration on CFDF extinction. For more dilute Ha jets, X(82) < 0.8, diffusion of Ha in the fuel jet may become progressively important and the reaction zone may locate closer to the stagnation surface -- further velocity and composition profile measurements are needed to better define this regime so that models of CFDF can be more fully validated.
Problem Definition Regarding Effects of Steam, and Ob.jectives of this Paper
Recently it has become clear that steam has an anomolous and extraordinary effect on flame structure and laminar burning velocity, Su, of Ha-Oz mixtures. 6 In early studies of Ha (and HC) combustion, 9,10 steam was usually considered to behave as a simple diluent which lowers So by acting as a heat sink, thereby reducing flame temperature. However beginning with Kuehi's pioneering study in 1962 of the positive effect of added water, relative to N2, on Su of Ha-air mixtures, 4 followed by recent detailed measurements of Su for heated mixtures of Ha-air-steam by Liu
and MacFarlane, 5 and finally a recent and thorough experimental and theoretical study by Koroll and Mulpuru, 6 we now know that progressive reductions in So due to steam addition are not commensurate with changes in the heat capacity of the mixture. In fact, steam enhances Su by up to 16% when it simply replaces Na diluent in a mixture; and furthermore we know the principal chemical kinetic reasons for this effect.
Although the Koroll and Mulpuru results offer important chemical kinetic insight on the effect of steam in premixed H-O flames (discussed in greater detail below), comparable experimental and/or analytic studies of the possible effects of steam on extinction of simple or highly stretched Ha-air diffusion flames have not been published, except for a recent study, by some of the present
authors, of 820 effects based on changes in hydrogen mass flux.
Thus the objectives of the present paper are first: To review the relevant literature on CFDF;
and summarize our recent findings that air jet velocities (strain rates) at blowoff of Ha-air flames provide a more direct and fundamental measure of kinetic effects on flame extinction than fuel Jet velocities, which indirectly measure jet momentum balance. Second, new data are presented on the specific effects of 820, CO2, N, and 02 air additives on resultant air jet velocities (strain rates) at extinction. Finally, the extinction results are compared with published burning velocity measurements on the effects of steam in premixed flames, in an attempt to generalize the results.
24
REVIEW OF LITERATURE
Ovvosed Jet and Other Counterf low Diffusion Flames
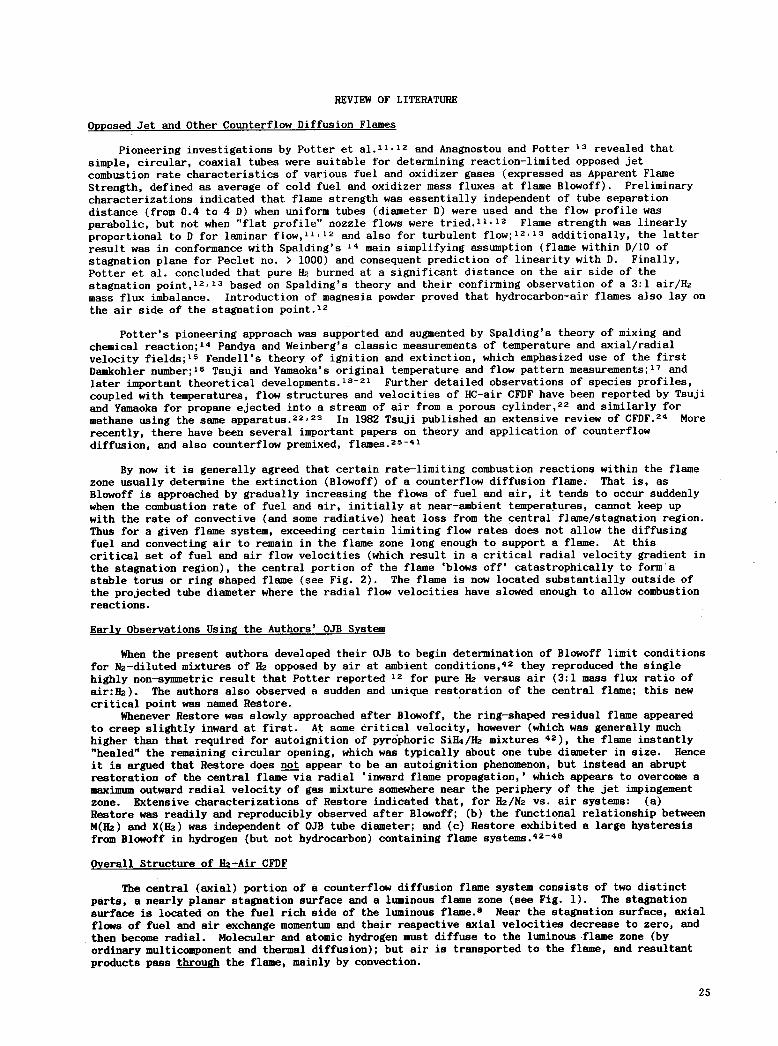
Pioneering investigations by Potter et •1.12 and Anagnostou and Potter 3 revealed that simple, circular, coaxial tubes were suitable for determining reaction-limited opposed jet combustion rate characteristics of various fuel and oxidizer gases (expressed as Apparent Flame Strength, defined as average of cold fuel and oxidizer mass fluxes at flame Blowoff). Preliminary characterizations indicated that flame strength was essentially independent of tube separation distance (from 0.4 to 4 0) when uniform tubes (diameter 0) were used and the flow profile was parabolic, but not when "flat profile" nozzle flows were tried."'' 2 Flame strength was linearly proportional to 0 for laminar f low, 11 ' 12 and also for turbulent flow;' 2 '' 3 additionally, the latter result was in conformance with Spalding's ' main simplifying assumption (flame within 0/10 of stagnation plane for Peclet no. > 1000) and consequent prediction of linearity with D. Finally, Potter et al. concluded that pure H2 burned at a significant distance on the air side of the stagnation point,12 l3 based on Spalding's theory and their confirming observation of a 3:1 air/H2 mass flux imbalance. Introduction of magnesia powder proved that hydrocarbon-air flames also lay on the air side of the stagnation point.'2
Potter's pioneering approach was supported and augmented by Spalding's theory of mixing and chemical reaction;' 4 Pandya and Weinberg's classic measurements of temperature and axial/radial
velocity fields;' 5 Fendell's theory of ignition and extinction, which emphasized use of the first Damkohler number;' 6 Tsuji and Yamaoka's original temperature and flow pattern measurements;' 7 and
later important theoretical developments. 18 - 2 ' Further detailed observations of species profiles, coupled with temperatures, flow structures and velocities of HC-air CFDF have been reported by Tsuji and Yamaoka for propane ejected into a stream of air from a porous cylinder, 22 and similarly for methane using the same apparatus. 22 ' 23 In 1982 Tsuji published an extensive review of CFDF. 24 More recently, there have been several important papers on theory and application of counterflow diffusion, and also counterf low premixed, flames.25-4'
By now it is generally agreed that certain rate-limiting combustion reactions within the flame zone usually determine the extinction (Blowoff) of a counterflow diffusion flame. That is, as Blowoff is approached by gradually increasing the flows of fuel and air, it tends to occur suddenly when the combustion rate of fuel and air, initially at near-ambient temperatures, cannot keep up with the rate of convective (and some radiative) heat loss from the central flame/stagnation region. Thus for a given flame system, exceeding certain limiting flow rates does not allow the diffusing fuel and convecting air to remain in the flame zone long enough to support a flame. At this critical set of fuel and air flow velocities (which result in a critical radial velocity gradient in the stagnation region), the central portion of the flame 'blows off' catastrophically to form a stable torus or ring shaped flame (see Fig. 2). The flame is now located substantially outside of the projected tube diameter where the radial flow velocities have slowed enough to allow combustion reactions.
Early Observations Using the Authors' OJTB System
When the present authors developed their OJB to begin determination of Blowoff limit conditions for N2-diluted mixtures of Ha opposed by air at ambient conditions, 42 they reproduced the single highly non-symmetric result that Potter reported 12 for pure Ha versus air (3:1 mass flux ratio of air:H2). The authors also observed a sudden and unique restoration of the central flame; this new critical point was named Restore.
Whenever Restore was slowly approached after Blowoff, the ring-shaped residual flame appeared to creep slightly inward at first. At some áritical velocity, however (which was generally much higher than that required for autoignition of pyrophoric SiH4/H2 mixtures 42), the flame instantly "healed" the remaining circular opening, which was typically about one tube diameter in size. Hence it is argued that Restore does not appear to be an autoignition phenomenon, but instead an abrupt restoration of the central flame via radial 'inward flame propagation,' which appears to overcome a maximum outward radial velocity of gas mixture somewhere near the periphery of the jet impingement zone. Extensive characterizations of Restore indicated that, for H2/N2 vs. air systems: (a) Restore was readily and reproducibly observed after Blowoff; (b) the functional relationship between M(Ha) and X(H2) was independent of OJB tube diameter; and (c) Restore exhibited a large hysteresis from Blowoff in hydrogen (but not hydrocarbon) containing flame systems.42-48
Overall Structure of Ha-Air CFDF
The central (axial) portion of a counterflow diffusion flame system consists of two distinct parts, a nearly planar stagnation surface and a luminous flame zone (see Fig. 1). The stagnation surface is located on the fuel rich side of the luminous flame. 8 Near the stagnation surface, axial flows of fuel and air exchange momentum and their respective axial velocities decrease to zero, and than become radial. Molecular and atomic hydrogen must diffuse to the luminous flame zone (by ordinary multicomponent and thermal diffusion); but air is transported to the flame, and resultant products pass through the flame, mainly by convection.
25

As the flows move radially away from the central stagnation point, their velocities first increase approximately linearly out to the tube edge and then decrease rapidly as they move away from the tube, thus giving a maximum radial velocity near the projected tube diameter. This flow is schematically illustrated in Fig. 2, where the tracing of any blowoff line, from the origin (tube center) out to the tube diameter (for either of 2 different tubes), shows a linear increase in radial velocity, and then an abrupt decrease in radial velocity as the flow moves away from the tube edge.
AXIAL-RADIAL FLOWFIELD FOR OJB COMBUSTION RADIAL. VELOCITY PROFILES FOR BLOWO(B) AND RESTORE(R) Oxidizer I
Central zone of U.
distributed flame radial = velocity
Stagnation
plane
("?"
'-CoId flow
plane stagnation
• Location of torus flame after B IFlat plate
• Radial velocity gradient at B U
U r • Radial flame propagation rateatR
Arrows indicate relocation of flame front -. - Ruced intermediate .
after B. before R •'' OJB 2 • L d. of OJB I tubes
d2 • id. ofOJB2tubes
OJB I
4-Ur - - - \
very rapid) d 112 d212
x, Radial distance from jet axis
Fig. 2. Hypothesized radial velocity profiles for Blowoff and Restore, for two different OJB tube sizes.
Fuel
Fig. 1. Schematic of laminar flowfield for a wide, flat, counterfiow Hz-air diffusion flame.
Effects of Steam on Laminar Burning Velocity, So, of Premixed H2-02-N2 or HzO
Kuehl was the first to observe the anomolous changes in Su, using a premixed stoichiometric Hz-air flame, that occur when water vapor is substituted for part of the N2 in air (mixtures were at 0.25 atm and initially 700 K). He used a converging rectangular nozzle technique to establish a laminar flame with essentially parallel flame fronts. Kuehi found that steam addition caused only about one-third the reduction in Su observed with equivalent volume additions of N2. Empirical analysis of the data clearly indicated that when team was substituted for N2, on a mole-for-mole basis, there was an increase in Su which was a linear function of steam concentration; in fact, the positive slopes of interpolated data were approximately equal for six unit Oz concentrations over the range 16 to 21 mole percent. Based partly on arguments of reduced equilibrium temperature and radical concentrations, and also on radiation heat transfer considerations, Kuehl postulated that steam accelerates burning, relative to N2 addition, by increasing radiative heat transport from hot combustion products to water vapor in the unburnt gas.
More than twenty years later, Liu and MacFarlane measured Su of Hz-air and Hz-air-steam mixtures as a function of temperature and composition of the unburned gases, using laser-Doppler anemometry and schlieren photography in conjunction with a constant-velocity nozzle (Mache-Hebra) burner (with 3 mm throat). A correlation equation was derived (used later in this paper) from the observed Su data (285 measurements), covering concentration ranges of 18-65 volume percent Hz and 0-15 volume percent steam, and an initial temperature range of 23-250 O(
Most recently, Koroll and Mulpuru 6 conducted a comparative study of the effects of various diluents on Su of Hz-02 mixtures, and focused on the extraordinary effect of steam on So and flame structure. Their So data were obtained by the previously-used nozzle-burner (but with a more ideal 5 mm nozzle throat) cone angle method, 5 with particle tracking by laser Doppler anemometry (velocimetry), for a wide range of stoichiometries and diluent fractions (He, Ar, N2, and steam). The experimental technique produced an independent set of So measurements at 373 K for six steam concentrations and a relatively wide range of Hz-air (and 02) mixture ratios; the data range was extended from the previous 15% to 50% steam (inerting occurs at 55% with air, and at 79% with 02 oxidant).
26

A simple correlation was obtained by Koroll and Mulpuru which accurately predicted the physical effects of inert diluents, namely flame cooling and heat transport, on burning velocity: Su(ao/a)" 2 = Suo(l-X/XL), where a is the thermal diffusivity, X is the mole fraction of diluent, XL
is the diluent fraction sufficient to inert the mixture, and the subscript o denotes the undiluted mixture. Whereas the correlation accurately fitted all their Su data for He, Ar, and N2 diluted mixtures, it under-estimated their Su data for steam diluent by as much as 20, and thus indicated that steam positively influenced the burning velocity by mechanisms other than flame coolin g and heat transport.
Using a one-dimensional flame model, Koroll and Mulpuru 6 calculated the detailed changes to flame structure caused by addition of steam, and determined that steam significantly alters the chemical kinetics and effects a redistribution of heat release in the flame. They concluded that this redistribution is caused almost entirely by the unusually high third-body efficiency of steam (6.0) in the exothermic reaction: H + 02 + M ---) 1102 + M. Because steam greatly increases the rate of this reaction (third body efficiency is higher by a factor of 15 compared to N2 or 02), it also has a small additional effect on a cycle of exothermic reactions involving 1102 with H, OH, and 0 in the preheat region of the flame. The result is shown to be a steeper temperature profile at the leading edge, a thinner flame, and an increased burning velocity. Because the postulated chemical kinetic effect appeared to account for essentially all the observed increase in Su, Koroll and Mulpuru concluded that the radient heat transport mechanism proposed by Kuehl must have a vanishingly small role.
EXPERIMENTAL PROCEDURE
Each OJB system (total of 3) consisted of two uniform, equal diameter (D) relatively long (50-100 0) opposed tubes. Measured mass flow rates typically ranged from 500 to 10000 SCCM (standard cubic centimeters per minute), and Reynolds numbers (based on 0) were always less than 2000. Thus the input flows should have been laminar throughout, with a well developed parabolic velocity profile. Three sets of OJB tubes were used (2.7 mm i.d. nickel, and 5.0 and 7.0 mm i.d. pyrex ) in order to include a complete range of jet velocities (strain rates) leading up to extinction of pure 112-air (2.7 mm). All measurements were made at atmospheric pressure in an argon-bathed plexiglass box partly open at the top (1987 set of 2.7 mm data), polycarbonate box partly open at the top (1988 set of 2.7 nun data), an alumina-silica fiberboard box with a porous sintered plate over the top (1989, 2.7 mm data), or polycarbonate box partly open at the top (7 mm). Radial movements of the tubes were mechanically restricted, but minor axial adjustments in separation distance were occasionally made (typically 2 to 3 D), which did not affect the results. The OJB systems, with tubes oriented either vertically (7 mm) or horizontally (all 3 sizes), were continuously purged with argon through a fibrous diffuser pad at the bottom of each box. Argon (sometimes slightly heated) prevented secondary combustion of excess fuel outside the central impingement zone; hence the argon bath improved visibility of the central flame, decreased local heating and buoyancy effects, and prevented attachment of a very dilute Ha flame to the air jet.
A schematic of the flow system is shown in Fig. 3. The fuel most generally used was N2-diluted Ha, and the mixture was prepared using a digital mass flow metering system, using two flow meters in series for each fuel-combustible, fuel-diluent, and air flow. If the air was to be contaminated with water, the air supply flowed through a two-stage water bubbler system, equipped with stainless steel frits and immersed in a temperature-controlled bath. The air supply tube was resistively heated and insulated in order to prevent condensation of moisture within the line. The fuel tube was similarly heated to preserve continuity. The OJB tube wall temperatures were measured by thermocouples, and corresponding exit gas temperatures were usually estimated by use of prior calibrations. Final gas temperatures ranged from 85 to 100 OC (and slightly higher) for all experiments, .except for the ambient temperature baseline data.
The temperature of the bubbler bath was set prior to each series of runs; the dew point of the exit flow associated with this temperature established the water content of the air mixture. An EG&G Model 911 Digital Humidity Analyzer was used under matching experimental conditions to measure the dew point and dry bulb temperature of air streams at the OJB tube exit. Dew point temperatures of the air jet were measured corresponding to the full range of bubbler bath temperatures. An analysis of the dew point data was given in Ref. 48.
For obtaining a typical pair of Blowoff and Restore data points at a fixed air contaminant level, the mass flow rate of Ha was varied (or held at a constant value if the flow of N2 fuel diluent was varied instead) and also the flow rate for air (plus contaminant) was simultaneously and gradually increased until Blowoff occurred; then flows were gradually decreased until Restore occurred. Critical mass flow rates of Ha, N2, air, and contaminant were recorded, along with tube wall temperatures and (sometimes) exit gas temperatures, for both Blowoff and Restore.
27
CLEAN AIR, RESULTS AND DISCUSSION
Review of Early Observations usin g 5 mm OJB
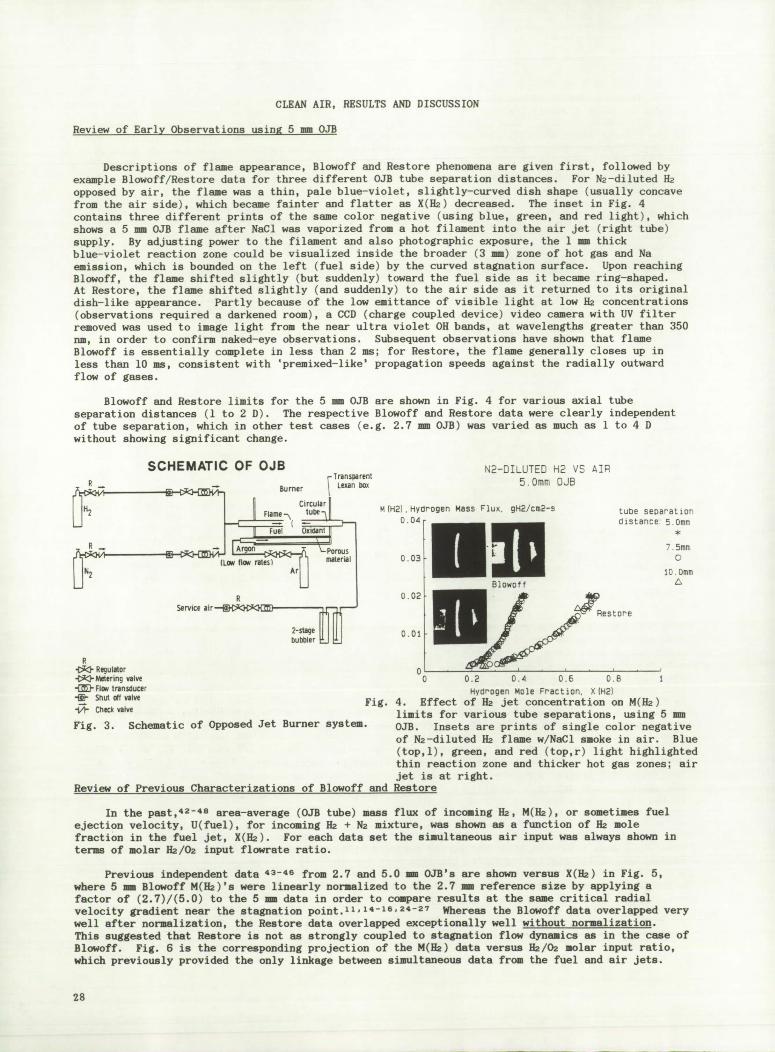
Descriptions of flame appearance, Blowoff and Restore phenomena are given first, followed by example Blowoff/Restore data for three different OJB tube separation distances. For N2-diluted FLu opposed by air, the flame was a thin, pale blue-violet, slightly-curved dish shape (usually concave from the air side), which became fainter and flatter as X(H2) decreased. The inset in Fig. 4 contains three different prints of the same color negative (using blue, green, and red light), which shows a 5 mm OJB flame after NaCl was vaporized from a hot filament into the air jet (right tube) supply. By adjusting power to the filament and also photographic exposure, the 1 mm thick blue-violet reaction zone could be visualized inside the broader (3 mm) zone of hot gas and Na emission, which is bounded on the left (fuel side) by the curved stagnation surface. Upon reaching Blowoff, the flame shifted slightly (but suddenly) toward the fuel side as it became ring-shaped. At Restore, the flame shifted slightly (and suddenly) to the air side as it returned to its original dish-like appearance. Partly because of the low emittance of visible light at low Ha concentrations (observations required a darkened room), a CCD (charge coupled device) video camera with UV filter removed was used to image light from the near ultra violet OH bands, at wavelengths greater than 350 nm, in order to confirm naked-eye observations. Subsequent observations have shown that flame Blowoff is essentially complete in less than 2 ms; for Restore, the flame generally closes up in less than 10 ma, consistent with 'premixed-like' propagation speeds against the radially outward flow of gases.
Blowoff and Restore limits for the 5 mm OJB are shown in Fig. 4 for various axial tube separation distances (1 to 2 D). The respective Blowoff and Restore data were clearly independent of tube separation, which in other test cases (e.g. 2.7 mm OJB) was varied as much as 1 to 4 D without showing significant change.
SCHEMATIC OF OJB S
rTrinsparefll Burner Lexin box
Circular Flame—\ tube
F
daft Porous
Armatereal
airR
2-ear bubbler
N2-DILUTED H2 VS AIR
5.0mm CJB
M (H2) . Hydrogen Mass 1ux. 9H2/crs2-s
o 041
o 03
Blowoff
0.01LU /
tube seOarataon tstance lOon
*
• 5mm 0
10. 0mm A
Restore
Rulator 0 lMetering valve 0 0.2 0.4 0.6 0.8 1
-JFlou transducer Hydrogen Mole Fraction. X H2) Shut utf valve
Fig. 4. Effect of H jet concentration on M(H) -Vi- Chech valve limits for various tube separations, using 5 mm rig. 3. Schematic of Opposed Jet Burner system. OJB. Insets are prints of single color negative
of N2-diluted H2 flame w/NaCl smoke in air. Blue (top,l), green, and red (top,r) light highlighted thin reaction zone and thicker hot gas zones; air jet is at right.
Review of Previous Characterizations of Blowoff and Restore
In the past, 4248 area-average (OJB tube) mass flux of incoming Ha, M(H2), or sometimes fuel ejection velocity, U(fuel), for incoming H + N2 mixture, was shown as a function of Ha mole fraction in the fuel jet, X(H2). For each data set the simultaneous air input was always shown in terms of molar Ha/Oa input flowrate ratio.
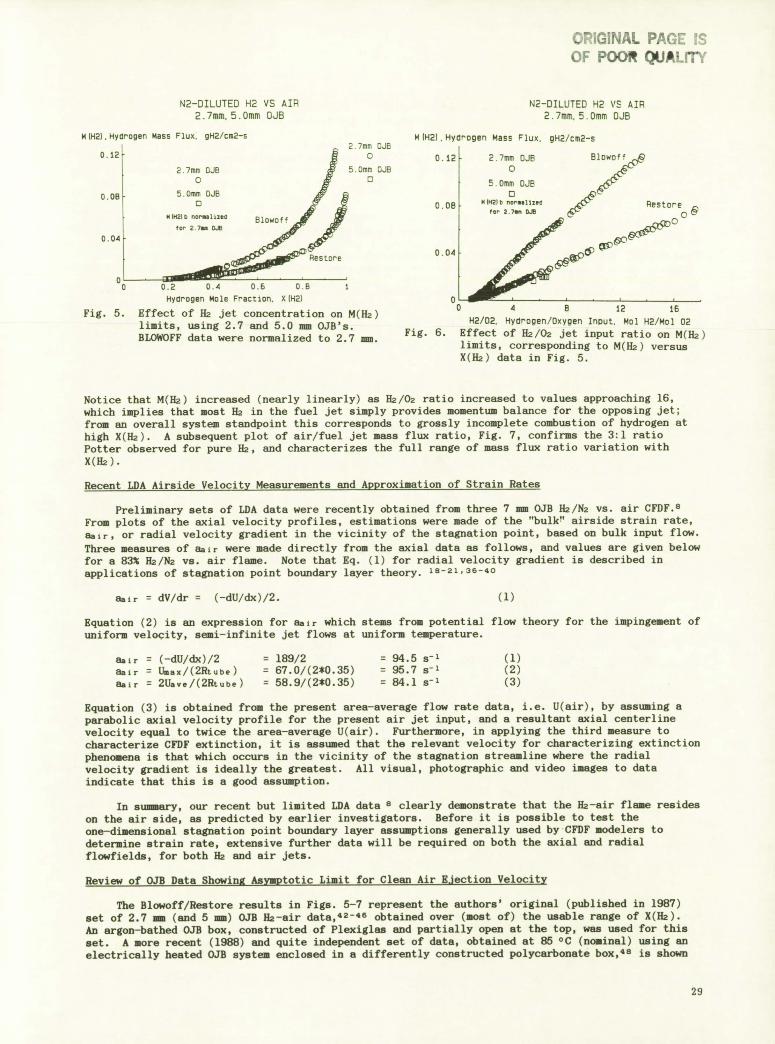
Previous independent data 4346 from 2.7 and 5.0 OJE's are shown versus X(Ha) in Fig. 5, where 5 mm Blowoff M(Ha)'s were linearly normalized to the 2.7 mm reference size by applying a factor of (2.7)/(5.0) to the 5 mm data in order to compare results at the same critical radial velocity gradient near the stagnation point.' 1 '' 416 ' 2427 Whereas the Blowoff data overlapped very well after normalization, the Restore data overlapped exceptionally well without normalization. This suggested that Restore is not as strongly coupled to stagnation flow dynamics as in the case of Blowoff. Fig. 6 is the corresponding projection of the M(Ra) data versus Ha/Oz molar input ratio, which previously provided the only linkage between simultaneous data from the fuel and air jets.
28
GNiL PAC': :s; OF POOR QUAliTY
N2-DILUTED H2 VS AIR
N2-DILUTED H2 VS AIR
2.7mm,5.Omm OJB
2.7riun,5.Omm OJB
N 012) . Hydrogen Mass Flux. gH2/cm2—s
0.12
N (He) . Hydrogen Mass Flux, gH2/cm2—s 2.7mm OJE
0 0.12 5.0mm OJB
0
0.06
0.04
00
Fig. 5.
2.7mm OJB 0
5.0mm OJE 0
0.06) $41H2}b nW.a1iZed Blowoff
to'. 2.7 0
Restore 0.04
0.2 0.4 0.6 0.8 1
Hydrogen Mole Fraction. X(H2) 0
Effect of 112 jet concentration on M(H2) limits, using 2.7 and 5.0 mm OJB's.
Fi 6 BLOWOFF data were normalized to 2.7 mm. g.
0 2.7mm tUB
5.0mm 0.11 0
MIH2b flo,.uli200 ' Restore to'. 2.7w, 0.5
4 8 12 16
H2/02. Hydrogen/Oxygen InDut, Mol H2/Mol 02
Effect of 112/02 jet input ratio on M(}12) limits, corresponding to M(H2) versus X(H) data in Fig. 5.
Notice that M(H2) increased (nearly linearly) as 112/02 ratio increased to values approaching 16, which implies that most 112 in the fuel jet simply provides momentum balance for the opposing jet; from an overall system standpoint this corresponds to grossly incomplete combustion of hydrogen at high X(H). A subsequent plot of air/fuel jet mass flux ratio, Fig. 7, confirms the 3:1 ratio Potter observed for pure 112, and characterizes the full range of mass flux ratio variation with X(H2).
Recent LDA Airside Velocity Measurements and Approximation of Strain Rates
Preliminary sets of LDA data were recently obtained from three 7 mm OJB H2/N2 vs. air CFDF.8 From plots of the axial velocity profiles, estimations were made of the "bulk" airside strain rate, aair, or radial velocity gradient in the vicinity of the stagnation point, based on bulk input flow.
Three measures of aair were made directly from the axial data as follows, and values are given below for a 83% H2/N2 vs. air flame. Note that Eq. (1) for radial velocity gradient is described in applications of stagnation point boundary layer theory. 18-21,3640
Sair = dy/dr = (-dU/dx)/2. (1)
Equation (2) is an expression for as!,- which stems from potential flow theory for the impingement of uniform velovity, semi-infinite jet flows at uniform temperature.
Sair = (-dU/dx)/2 189/2 94.5 s-' (1) Qair = Usax/(2Rtube) = 67.0/(2*0.35) = 95.7 s° (2) asir = 2IJave/(2Rtube) = 58.9/(2*O.35) = 84.1 s- (3)
Equation (3) is obtained from the present area-average flow rate data, i.e. U(air), by assuming a parabolic axial velocity profile for the present air jet input, and a resultant axial centerline velocity equal to twice the area-average U(air). Furthermore, in applying the third measure to characterize CFDF extinction, it is assumed that the relevant velocity for characterizing extinction phenomena is that which occurs in the vicinity of the stagnation streamline where the radial velocity gradient is ideally the greatest. All visual, photographic and video images to data indicate that this is a good assumption.
In summary, our recent but limited LDA data clearly demonstrate that the 112-air flame resides on the air side, as predicted by earlier investigators. Before it is possible to test the one-dimensional stagnation point boundary layer assumptions generally used by CFDF modelers to determine strain rate, extensive further data will be required on both the axial and radial flowfields, for both 112 and air jets.
Review of OJB Data Showing Asymptotic Limit for Clean Air Ejection Velocity
The Blowoff/Restore results in Figs. 5-7 represent the authors' original (published in 1987) set of 2.7 i (and 5 mm) OJB Hz-air data, 42 - 46 obtained over (most of) the usable range of X(112). An argon-bathed OJB box, constructed of Plexiglas and partially open at the top, was used for this set. A more recent (1988) and quite independent set of data, obtained at 85 OC (nominal) using an electrically heated OJB system enclosed in a differently constructed polycarbonate box, 48 is shown
29

MIAIR)/M(H2.N2). Jet Mass Ratio 4
2.7mm Jet 0
Blowoff -6-
Rest ore -6-
MIH2), Mass Flux, gH2/cm2-s 0.16
0.12
0.08
0.04
M(H2), Mass Flux, gH2/cin2-s 0.16
0.12
0.08
0.04
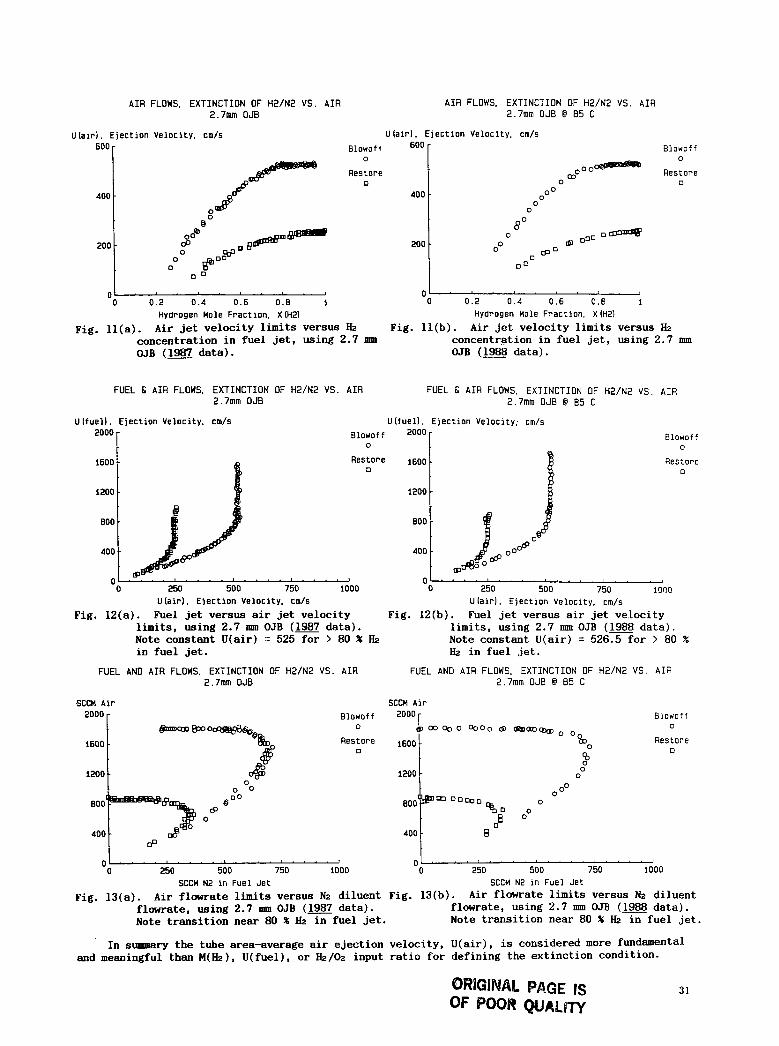
in Fig. 8 for M(H2) as a function of X(H2), and in Fig. 9 for M(H2) as a function of H2/02 molar input ratio. The corresponding fuel ejection velocity is shown in Fig. 10. Note that previously derived 43-46,48 exponential and linear least square curve fits in Figs. 8 and 9 are reasonably good; furthermore they can be solved algebraically to show that (indirectly deduced) U(air) versus X(112) approached (approximately) a horizontal asymptotic value for pure Ha (shown later). However, rflots of the actual U(air) data as functions of X(Ha), shown in Figs. 11(a) and 11(b) for the respective 1987 and 1988 data sets, clearly indicate that a truly quasi-steady state asymptotic value was obtained for Blowoff in which U(air) was effectively constant for X(Ha) > 0.80. Restore appears to behave similarly.
Cross plots of U(fuel) versus U(air), shown in Figs. 12(a) and 12(b) for the respective data sets, are even more revealing. The Blowoff curves clearly show two highly reproducible regimes: For U(fuel) ranging 0 to 800 cm/s (and 0.30 < X(Ha) < 0.80), U(fuel) increases monotonically with U(air), with a limiting slope of unity in the vicinity of the origin. Further increase in U(fuel) causes a sharp transition to an asymptotically constant U(air) value. After the transition, U(fuel) more than doubled as X(Ha) increased from 0.80 to 1, and U(air) remained constant at 525 and 527 cm/s for the respective data sets. An alternate perspective on this highly reproducible transition of Blowoff (and Restore) data is shown in Figs. 13(a) and 13(b), where air flowrate is plotted as a function of N2 diluent flowrate. The hook-shaped curve provides a unique characterization of the transition for both Blowoff and Restore. Finally, plots of air/fuel jet momentum ratios for the two sets of 2.7 mm data 8 were not as good as those obtained with the 7 nun OJB 8, but the trends were quite reproducible.
N2-OILUTED H2 VS. AIR FUEL FLOWS, EXTINCTION OF H2/N2 VS. AIR 2.7mm, 5.0mm OJB 2.7mm DJB 8 85 C
0 0.2 0.4 0.6 0.8 1
___________________________________________ Hydrogen Mole Fraction, X(H2)
0 0.2 0.4 0.6 0.8 1 Fig. 8. Effect of Ha jet concentration on M(Ha) Hydrogen Mole Fraction, X(H2) limits, using 2.7 nun OJB (1988 data,
Fig. 7. Air/fuel jet mass flux ratios, correspond- resistively heated tubes). Note
ing to limit data in Figs. 5 and 6. Note exponential LS data fits.
that Ha-air CFDF is unique compared to HC-air CFDF.
FUEL £ AIR FLOWS, EXTINCTION OF H2/f42 VS. AIR 2.7mm OJE 8 85 C
FUEL FLOWS, EXTINCTION OF H2/N2 VS. AIR 2.7mm OJB 8 85 C
U(fuel), Ejection Velocity. cm/s 2000
Blowoff I -6--
Restore 1600 F -6--
12001-
B00 oOo,,
400
0 4 8 12 16
12/02. Hydrogen/Oxygen Input, Mol H2/Mol 02
Fig. 9. Effect of 82/02 jet input ratio on M(Ha) limits, corresponding to M(Ha) versus X(Ha) data in Fig. 8. Note large excess of hydrogen.
Blowof f 0
Restore 0
0' 0 0.2 0.4 0.6 0.8 1
Hydrogen Mole Fraction, X(H2)
Fig. 10. Fuel jet velocity limits versus Ha concentration in fuel jet, using 2.7 mm OJB (1988 data). Data are derived from Fig. 8.
30
AIR FLOWS. EXTINCTION OF H2/N2 VS. AIR AIR FLOWS. EXTINCTION OF H2/N2 VS. AIR 2.7mm DJB 2.7mm OJB 8 85 C
U (air). Ejection Velocity. cm/s Ulair). Ejection Velocity, cm/s
600 Blowoft 600 Blowoff
Restore0
Restore
400 400
80
0o 0
200 200 0 0 0
0 0 0
00
C 0 0 0.2 0.4 0.6 0.8 1 0 0.2 0.4 0.6 0.8 1
Hydrogen Mole Fraction. X (H2) Hydrogen Mole Fraction, X (H2)
Fig. 11(a). Air jet velocity limits versus 112 Fig. 11(b). Air jet velocity limits versus 112
concentration in fuel jet, using 2.7 mm concentration in fuel jet, using 2.7 mm
0313 (1987 data). OJB (1988 data).
FUEL & AIR FLOWS. EXTINCTION OF H2/N2 VS. AIR FUEL & AIR FLOWS. EXTINCTION OF H2/N2 VS. AIR 2.7mm OJB 2.7mm OJB 8 85 C
U (fuel), Ejection Velocity. cm/s Utfuel), Ejection Velocity, cm/s
2000 Blowoff 2000Blowof
0 0
1600 , Restore 1600 Restore
0 0
1200 1200
:: :: L 0 250 500 750 1000 0 250 500 750 i00
Ulair). Ejection Velocity. cm/s U(air). Ejection Velocity. cm/s
Fig. 12(a). Fuel jet versus air jet velocity Fig. 12(b). Fuel jet versus air jet velocity
limits, using 2.7 mm OJB (1987 data). limits, using 2.7 mm OJB (1988 data).
Note constant U(air) = 525 for > 80 112 Note constant U(air) = 526.5 for > 80 ?
in fuel jet. 112 in fuel jet.
FUEL AND AIR FLOWS. EXTINCTION OF H2/N2 VS. AIR FUEL AND AIR FLOWS. EXTINCTION OF H2/N2 VS. AIR 2.7mm OJB 2.7mm OJO 8 85 C
SCCM Air SCCM Air
2000 Blowoff 20001 Blowoff
0 00 00 0 0000 0
1600 Restore 1600 Restore
0 0
1200
0
1200
00 o0
800500
800°° O0Q 0 0
cp %o a
c0 E 0 0 0
400 400 00
250 500 750 •1000 O_250 500 70 •l000
SCCH N2 in Fuel Jet SCCM N2 in Fuel Jet
Fig. 13(a). Air flowrate limits versus N2 diluent Fig. 13(b). Air flowrate limits versus N2 diluent
flowrate, using 2.7 mm OJB (1987 data). flowrate, using 2.7 mm OJB (1988 data).
Note transition near 80 112 in fuel jet. Note transition near 80 Ifs in fuel jet.
In summary the tube area—average air ejection velocity, U(air), is considered more fundamental and meaningful than M(H2), U(fuel), or 112/02 input ratio for defining the extinction condition.
ORGNAL PAGE tS OF POOk QUALITY
Air and Fuel Strain Rates: Comparison w/Calculations
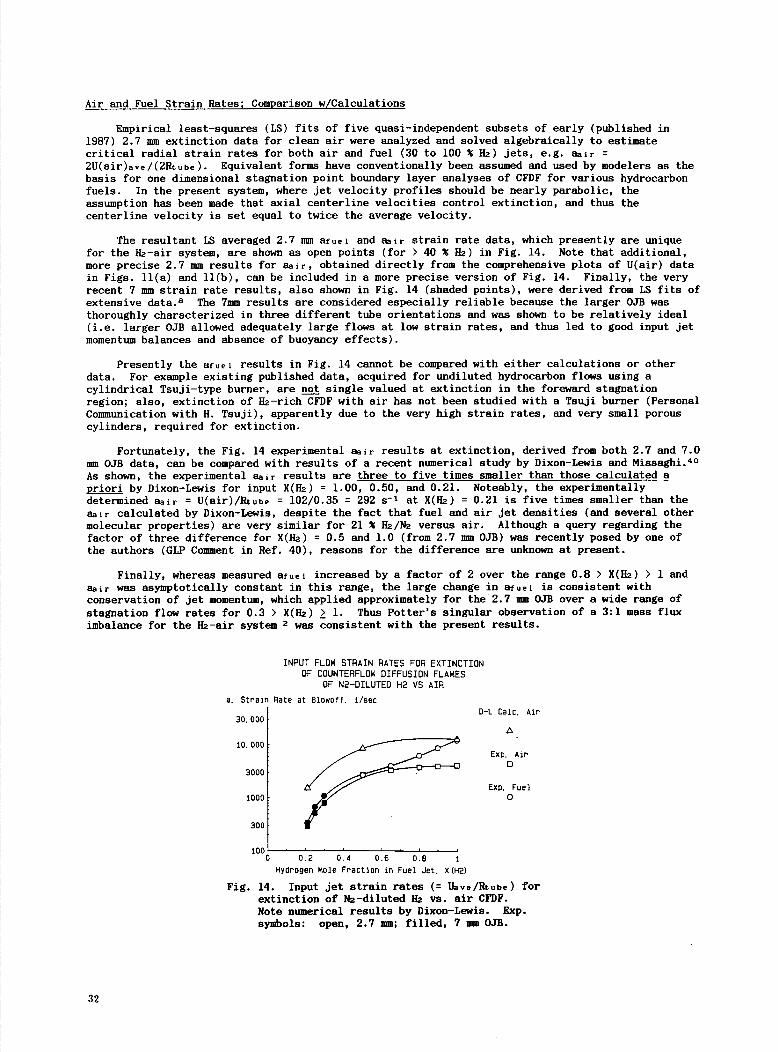
Empirical least-squares (LS) fits of five quasi-independent subsets of early (published in 1987) 2.7 mm extinction data for clean air were analyzed and solved algebraically to estimate critical radial strain rates for both air and fuel (30 to 100 % 112) jets, e.g. aair = 2U(air)ave/(2Rtube). Equivalent forms have conventionally been assumed and used by modelers as the basis for one dimensional stagnation point boundary layer analyses of CFDF for various hydrocarbon fuels. In the present system, where jet velocity profiles should be nearly parabolic, the assumption has been made that axial centerline velocities control extinction, and thus the centerline velocity is set equal to twice the average velocity.
The resultant LS averaged 2.7 nun afuel and 8air strain rate data, which presently are unique for the H2-air system, are shown as open points (for > 40 % 112) in Fig. 14. Note that additional, more precise 2.7 nun results for aair, obtained directly from the comprehensive plots of U(air) data in Figs. 11(a) and 11(b), can be included in a more precise version of Fig. 14. Finally, the very recent 7 mm strain rate results, also shown in Fig. 14 (shaded points), were derived from LS fits of extensive data. 8 The 7mm results are considered especially reliable because the larger OJE was thoroughly characterized in three different tube orientations and was shown to be relatively ideal (i.e. larger OJB allowed adequately large flows at low strain rates, and thus led to good input jet momentum balances and absence of buoyancy effects).
Presently the afuel results in Fig. 14 cannot be compared with either calculations or other data. For example existing published data, acquired for undiluted hydrocarbon flows using a cylindrical Tsuji-type burner, are not single valued at extinction in the foreward stagnation region; also, extinction of 112-rich CFDF with air has not been studied with a Tsuji burner (Personal Communication with 11. Tsuji), apparently due to the very high strain rates, and very small porous cylinders, required for extinction.
Fortunately, the Fig. 14 experimental aair results at extinction, derived from both 2.7 and 7.0 nun OJB data, can be compared with results of a recent numerical study by Dixon-Lewis and Missaghi.4° As shown, the experimental aar results are three to five times smaller than those calculated a priori by Dixon-Lewis for input X(112) = 1.00, 0.50, and 0.21. Noteably, the experimentally determined aajr = U(air)/Rtube = 102/0.35 = 292 s' at X(}k) = 0.21 is five times smaller than the air calculated by Dixon-Lewis, despite the fact that fuel and air jet densities (and several other molecular properties) are very similar for 21 H2/N2 versus air. Although a query regarding the factor of three difference for X(H2) = 0.5 and 1.0 (from 2.7 nun OJB) was recently posed by one of the authors (GLP Comment in Ref. 40), reasons for the difference are unknown at present.
Finally, whereas measured afuel increased by a factor of 2 over the range 0.8 > X(112) > 1 and aa,- was asymptotically constant in this range, the large change in afuel is consistent with conservation of jet momentum, which applied approximately for the 2.7 mm OJB over a wide range of stagnation flow rates for 0.3 > X(H) > 1. Thus Potter's singular observation of a 3:1 mass flux imbalance for the 112-air system 2 was consistent with the present results.
INPUT FLOW STRAIN RATES FOR EXTINCTION OF COUNTEAFLOW DIFFUSION FLAMES
OF N2-DILUTED 112 VS AIR
a. Strain nate at Blowoff. 1/secD-L CaIc. Air
10. 000 1Exp. Air
0
30 000
3000
Exp, Fuel 0 1000
300
1000 0.2 0.4 0.6 0.6
Hydrogen Hole Fraction in Fuel Jet. XIH2)
Fig. 14. Input jet strain rates ( Uave/Rtube) for extinction of N2-diluted 112 vs. air CFDF. Note numerical results by Dixon-Lewis. Exp. symbols: open, 2.7 mm; filled, 7 nun OJB.
32

CONTAMINATED AIR, RESULTS AND DISCUSSION
Before the contaminated air CFDF results are presented, note that an oxygen displacement/inert gas effect occurred in all of the OJB extinction experiments when air was diluted by contaminant. The effect can be isolated and quantified by the addition of N2 to air, and by using various 02/N2 mixtures. Nitrogen is preferred because of its predominance in air, relative chemical inertness, and also its use in premixed H2-02-N2-steam flames 4-6 (later comparisons). Mole fraction expressions for a simplified standard air mixture are:
X(02) = 0.2095 x {l-X(contaminant)}, X(N2) = ( 1 - 0.2095) x {l-X(contaminant)}.
Note that 16.8 mole % 02 and 83.2% N2 are obtained when a final mixture contains 80% dry air and 20% added N2.
Extinction of 112 vs. N2 + "Air"
In Fig. 15, three sets of U(air) vs. C(N2) data were obtained from respective series of 2.7 mm OJB experiments at Blowoff, using pure 112 opposed by N2 contaminated "air" for each of three "airs" having different initial 02 composition. The "airs" were laboratory service air (used exclusively to represent ambient air, assumed to contain 20.95% 02), and respective commercial cylinders (Air Products, one each) containing 02/Nz mixtures certified at 25.0% and 29.9% 02. The Fig. 15 results demonstrate that 02 concentration had a large effect on U(air) at flame extinction; i.e. for each "air," and also through the 02 displacement effect. The linear least-squares (LS) data fits are good over the 0 to 20 % contaminant range. Table I shows the LS (a) intercepts and (b) negative slopes normalized to 100, DM2 { percent decrease:: in U(air) for each 1% added Nz (% decrease)/(mole %l42)}. Respective LS slopes and intercepts are crossplotted and analyzed later (Fig. 18).
TABLE I. Summary of: Least-squares intercepts for U(air)C...0)
and negative slopes, Dc, normalized to U(air).0 = 100.
Thus each Dc represents the linear sensitivity of U(air)
to ntaminant C in units of (% decrease)/(mole % C added).
Contaminant Initial % 02 = 20.95 25.0 29.9 (Exp. dates) ________________
N 2 , Fig. 15 DN 1.620 1.451 1.200
(12/87; 4/89; 9/89) ______________________ U(air) - N2-0 506.3 642.3 830.0
H20, Fig. 17 DRO 1.530 1.431 1.322
(3/89) U(air)800 495.1 654.4 858.3
CO2 , Fig. 19 Dco 2.196 - -
(12/87); 4/89) U(air)0 507.0 - -
N , Fig. 20 2 D 1.727 - - N2 (12/87) U(air)NO 514.8 - -
820, Fig. 21 D80 2.248 - -
(12/87-1/88) U(air)800 537.9 - -
CO2 , Fig. 22 DCO2 2.297 - -
(12/87) U(air)00 515.5 - -
N 2 , Fig. 232
1.867 - -
(summer '86) U(air)NO 561.4 - -
CO2 , Fig. 23 - 0002 2.581 - -
(spring '87) U(air)COO 563.0 - -
clean air, Fig. 11(a) U(air)X(H )1 2
525.0 - - (summer '86)
clean air, Fig. 11(b) U(air)X(H).., 526.5 - -
(fall '87) _________________
33
U(Air). Ejection Velocity. cm/sec. 1000
in unoliutec -air-
29.90 02800
29.0% 02
600
22.95% 02
400
200
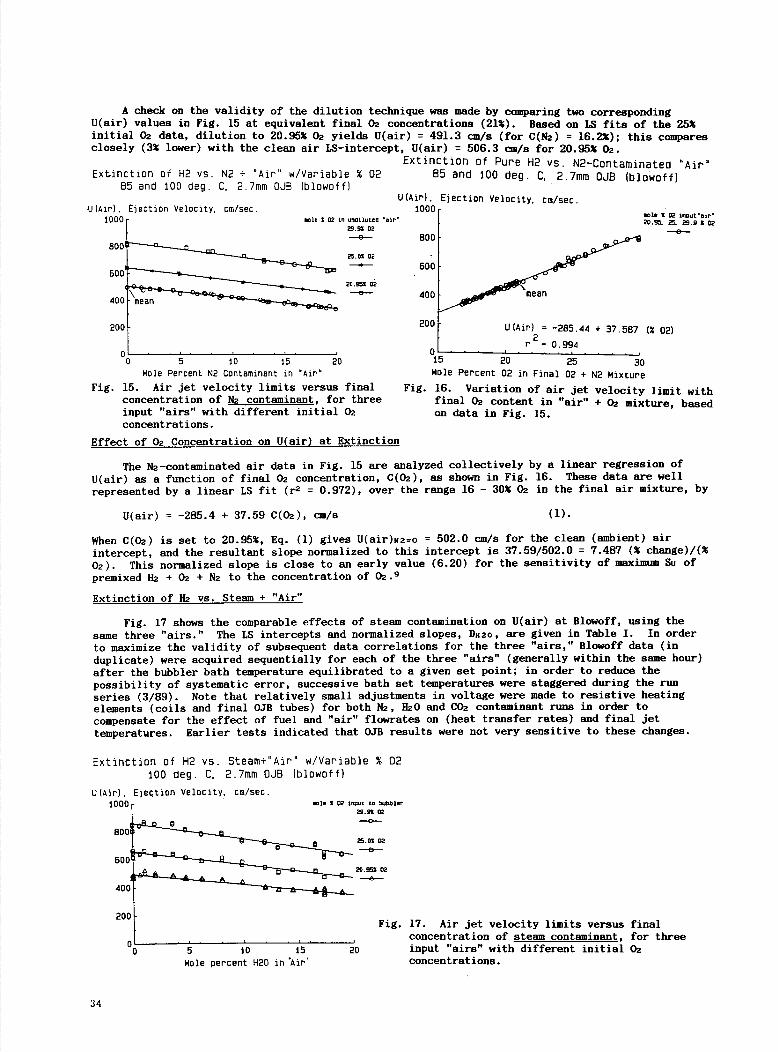
A check on the validity of the dilution technique was made by comparing two corresponding U(air) values in Fig. 15 at equivalent final 02 concentrations (21*). Based on LS fits of the 25* initial 02 data, dilution to 20.95* Oi yields U(air) 491.3 cm/s (for C(N2) = 16.2%); this compares closely (3* lower) with the clean air LS-intercept, U(air) = 506.3 au/s for 20.95* 02.
Extinction of Pure H2 vs. N2-Contaminated Air' Extinction of H2 vs. N2 + Air w/Variable % 02 85 and 100 deg. C, 2.7mm OJB (blowoff)
85 and 100 deg. C. 2.7mm OJE (blowoff)
•U(Air). Ejection Velocity. cm/sec.
5 10 15 20 Mole Percent N2 Contaminant in 'Air'
Fig. 15. Air jet velocity limits versus final Fig concentration of N2 contaminant, for three input "airs" with different initial 02 concentrations.
Effect of 02 Concentration on U(air) at Extinction
(% 02)
0' 15 20 25 30 Mole Percent 02 in Final 02 + N2 Mixture
16. Variation of air jet velocity limit with final Oa content in "air" + 02 mixture, based on data in Fig. 15.
1e 0 02 input',i,. 20.95. s m.g 2 02
—0--
The Hi-contaminated air data in Fig. 15 are analyzed collectively by a linear regression of U(air) as a function of final 02 concentration, C(Oi), as shown in Fig. 16. These data are well represented by a linear LS fit Cr2 = 0.972), over the range 16 - 30* 02 in the final air mixture, by
U(air) = -285.4 ^ 37.59 C(Oz), cm/s (1).
When C(02) is set to 20.95*, Eq. (1) gives U(air)N2=o = 502.0 cm/s for the clean (ambient) air intercept, and the resultant slope normalized to this intercept is 37.59/502.0 = 7.487 (* change)/(%
02). This normalized slope is close to an early value (6.20) for the sensitivity of maximum Su of
premixed 112 + Oz + N2 to the concentration of Oz.°
Extinction of 112 vs. Steam + "Air"
Fig. 17 shows the comparable effects of steam contamination on U(air) at Blowoff, using the same three "airs." The LS intercepts and normalized slopes, DH2O, are given in Table I. In order to maximize the validity of subsequent data correlations for the three "airs," Blowoff data (in duplicate) were acquired sequentially for each of the three "airs" (generally within the same hour) after the bubbler bath temperature equilibrated to a given set point; in order to reduce the poèsibility of systematic error, successive bath set temperatures were staggered during the run series (3/89). Note that relatively small adjustments in voltage were made to resistive heating elements (coils and final OJB tubes) for both N2, 1120 and COx contaminant runs in order to compensate for the effect of fuel and "air" flowrates on (heat transfer rates) and final jet temperatures. Earlier tests indicated that OJB results were not very sensitive to these changes.
Extinction of H2 vs. Steam+"Air' w/Variable % 02 100 deg. C. 2.7mm OJB (blowoff)
U(Air), Ejection Velocity. cm/sec.
5 10 15 20
Mole percent 1120 in 'Air'
Fig. 17. Air jet velocity limits versus final concentration of steam contaminant, for three input "airs" with different initial 02 concentrations.
29.9% 02 —0--
29.0% 02 —0-
20.95% 02 —e-
34
U (air. clean), cm/s 900
750
600
-°N2 or - 0 H20. Normalized Slope 1.7
H20 -e-
N2 1.6
1.5
1.4
1.3
120
N2
U)Air), Ejection Velocity. cm/sec. 1000 BLOWOFF
---
BOO
600
400
200
Comprehensive LS Empirical Fits of U(air) for N2 and thO Contaminants
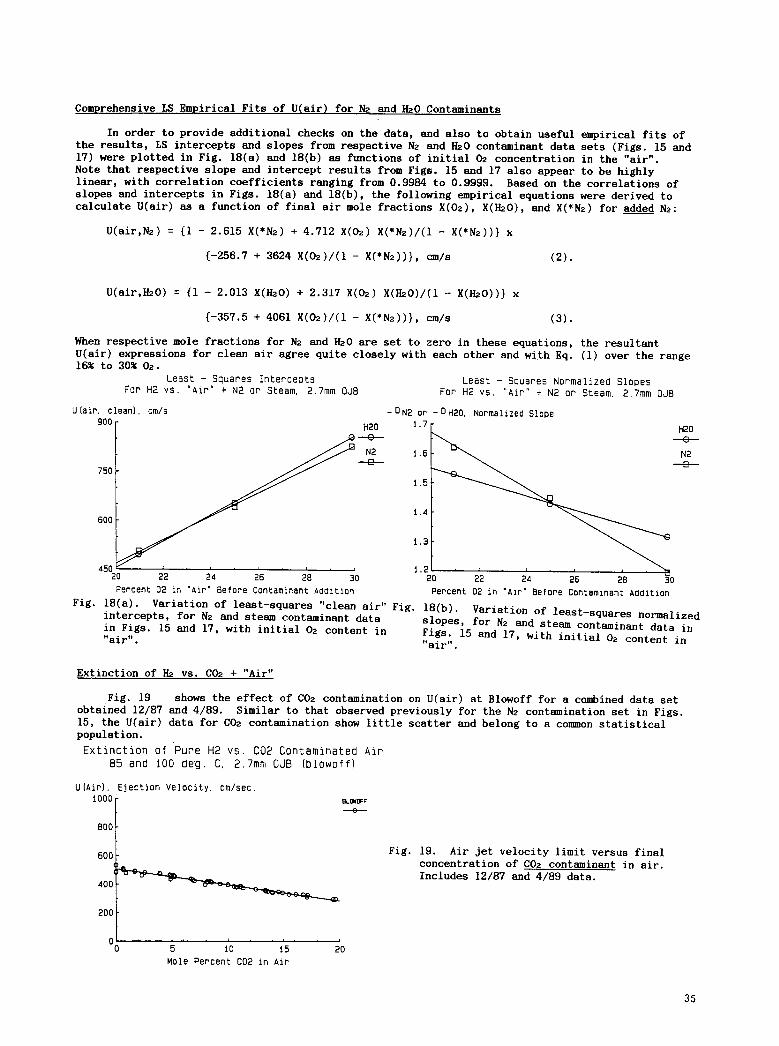
In order to provide additional checks on the data, and also to obtain useful empirical fits of the results, LS intercepts and slopes from respective N2 and H20 contaminant data sets (Figs. 15 and 17) were plotted in Fig. 18(a) and 18(b) as functions of initial 02 concentration in the "air". Note that respective slope and intercept results from Figs. 15 and 17 also appear to be highly linear, with correlation coefficients ranging from 0.9984 to 0.9999. Based on the correlations of slopes and intercepts in Figs. 18(a) and 18(b), the following empirical equations were derived to calculate U(air) as a function of final air mole fractions X(0z), X(H20), and X(*N2) for added N2:
U(air,N2) = (1 - 2.615 X(*N2 ) + 4.712 X(Oz) X(*N2 )/(l - X(*N2 ))) x
(-256.7 + 3624 X(02)/(l - X(*N2 ))}, cm/s (2).
U(air,HzO) = (1 - 2.013 X(H20) + 2.317 X(02) X(1120)/(1 - X(HaO))} x
(-357.5 + 4061 X(02)/(1 - X(*N 2 ))}, cm/s (3).
When respective mole fractions for N2 and H20 are set to zero in these equations, the resultant U(air) expressions for clean air agree quite closely with each other and with Eq. (1) over the range 16% to 30% 02.
Least - Squares tntercepts Least - Squares Normalized Slopes For H2 vs. 'Air' 4- N2 or Steam, 2.7mm OJB For H2 vs. 'Air" + N2 or Steers, 2.7mm DJB
45020 22 24 26 28 30 Percent 02 in 'Air" Before Contaminant Addition
Fig. 18(a). Variation of least —squares "clean air" Fig intercepts, for N2 and steam contaminant data in Figs. 15 and 17, with initial 02 content in "air".
Extinction of H2 vs. C0 + "Air"
I. ' 1.222. 24 26 28 30
Percent 02 in 'Air Before Contaminant ADO ition
18(b). Variation of least-squares normalized slopes, for N2 and steam contaminant data in Figs. 15 and 17, with initial 02 content in "air".
Fig. 19 shows the effect of CO2 contamination on U(air) at Blowoff for a combined data set obtained 12/87 and 4/89. Similar to that observed previously for the N2 contamination set in Figs. 15, the U(air) data for CO2 contamination show little scatter and belong to a coimuon statistical population.
Extinction of Pure H2 vs. CO2 Contaminated Air B5 and 100 deg. C, 2.7mm OJB (blowoff)
Fig. 19. Air jet velocity limit versus final concentration of CO2 contaminant in air. Includes 12/87 and 4/89 data.
0' 0 5 10 15 20
Mo'e Percent CO2 in Air
35

U(Air), Ejection Velocity. cm/sec. 1000
BLOW DF
BOO
600
400
200
U(AirI, Ejection Velocity, cm/sec. 1000 BLOWOF
-0-
BOO
600
400
200
12/87 Extinction Data, 112 vs. N2, 1120, and CO2 Contaminated Air
Figures 20-22 show the respective effects of N2, 1120, and CO2 air contaminants on U(air) at Blowoff for three 2.7 mm OJB data sets obtained during a one month period (12/87). Respective intercepts and normalized slopes are summarized in Table I. Note that all results in this section are designated 85 o data. The air and fuel preheat coils, and the nickel OJB tubes, were resistively heated, but the temperature was not controlled as high as more recently (> 100 °C, 3/89
- 9/89). Occasional condensation of 1120 in the air line during the 12/87 runs had to be overcome by external heating of an aluminum block near the OJB tube end.
Extinction of Pure H2 vs. N2-Contaminated Air Extinction of Pure H2 vs. Steam Contaminated Air 85 aeg. C, 2.7mm OJB (blowoff) 85 deg. C, 2.7mm QJB (blowoff)
U(Air), Ejection Velocity, cm/sec. 1000
800
500
400
200
o20
Mole Percent N2 Contaminant in Air
Fig. 20. Air jet velocity limit versus final concentration of N contaminant in air. Includes 12/87 data only.
BLOKOFF
-0-
O0 5 10 15 20
Mole Percent H20 in Air
Fig. 21. Air jet velocity limit versus final concentration of steam contaminant in air. Includes 12/87 and 1/88 data only.
Extinction of Pure H2 vs. CO2 Contaminated Air 85 deg. C. 2.7mm OJB (blowoff)
O .10 15 20
Mole Percent CO2 in Air
Fig. 22. Air jet velocity limit versus final concentration of CO2 contaminant in air. Includes 12/87 data only.
Extinction of N2-Diluted 112 vs. Contaminated Air
Our earliest studies of air contaminants focused on the extinction of 2.7 ann OJB flames formed by jets of N2 diluted H versus air containing 0 to 10 mole percent NO, N2, CO, and CO2. 4346
These data were originally analyzed to determine the effects of contaminant concentration on M(Ik), using exponential data fits at various X(H2) ranging 0.6 to 1. For the present study we retrieved the original data files and plotted U(air) as a function of X(H2). These plots (unpublished data) were very similar to Figs. 11(a) and 11(b), except that (a) asymptotic data levels for U(air) varied with air contaminant, and (b) the "apparent" U(air) = 0 intercepts on the X(112) axis generally became larger with increasing contaminant.
36

tair). Velocity at Pure H2 Intercept. cm/s
60C N2
-e-
0O2
50C
40(
Linear LS fits of the data, for X(H2) > 0.80, were used to represent the asymptotic U(air) data levels, and to calculate LS intercepts at X(H2) = 1.0. The LS intercepts, which represent U(air) for pure H2, are plotted versus mole percent contaminant, C, for N2 and COz in Fig. 23; linear LS lines were then drawn through these (previously averaged) points (5 each). The resultant intercepts, 'grand average' intercepts at C = 0, and normalized slopes are tabulated in Table II.
Table II. Effects of Air Contaminants on LS-Intercept and Normalized Slope, for Extinction of N2-Diluted Hz vs. Contaminated Air, 2.7 mm OJB.
{Data obtained on single apparatus from 4/86 to 4/87)
LS, Clean LS, Grand Normalized
Air Base Average Slope, Dc Contaminant U(air)x(H2)=1 U(air)c=o -lOOd{U(air)}/d(CO}
NO 570.0 567.5 2.182 N2 566.4 561.4 1.867 CO 566.4 559.4 0.941 CO 573.1 563.0 2.581
Clean (1987) 525.0 Clean (1988) 526.5
CONTAMINANT EFFECTS ON LS-INTERCEPTS AT X (H2) 1
300' 0 2 6 B 10 12
Percent Contaminant. C
Fig. 23. Effects of N2 and CO2 contaminants on air jet velocity for the pure Hz case, based on least-squares intercepts of Hz-diluted H vs. air data, letting X(Hz) = 1.
Comparison with Effects of Steam on 112 + air Su Combustion Limits
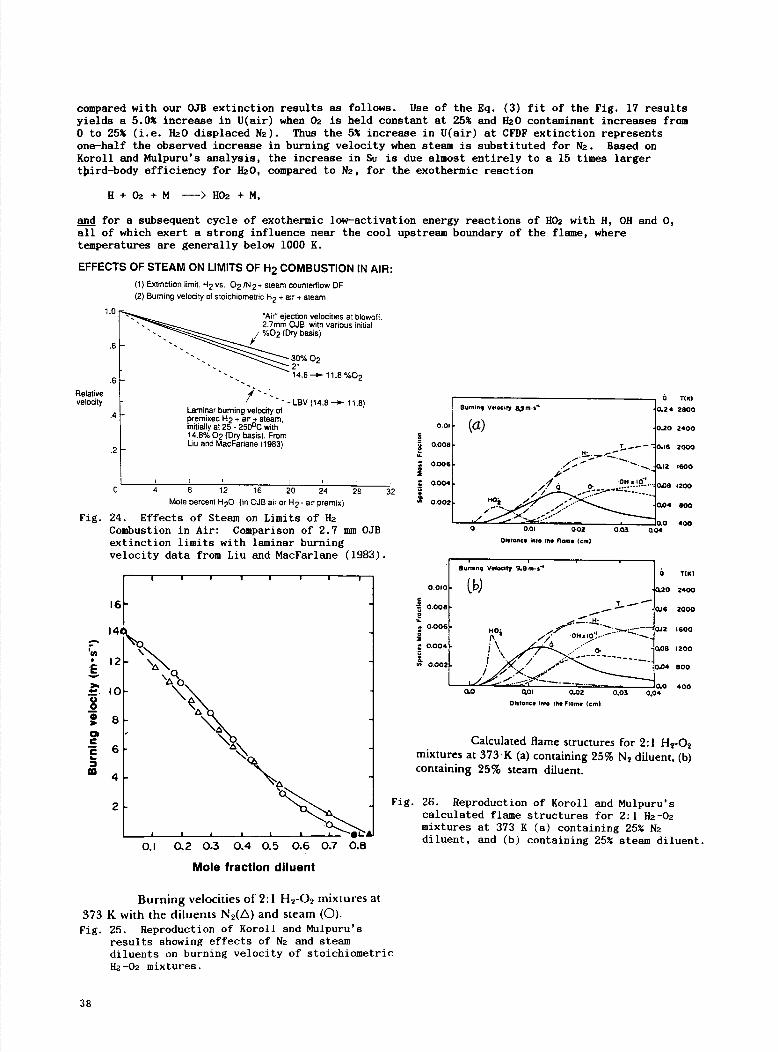
Fig. 24 compares the relative effects of steam on (a) U(air) extinction limits for Hz vs. air + steam, to (b) laminar burning velocity Su of premixed Hz + air + steam. The comparison is based on Eq. (3) for the OJB results, and on Liu and MacFarlane's empirical fit of their Su data. To retain an "equivalent" dilution schedule for the two cases, the initial 14.7 mole * 02 (dry basis) is progressively diluted to 11.8 * 02 after steam has attained 20*. The relative effects on U(air) of using 21 and 30 initial * 02 are also shown. Clearly, the relative decrease in Su due to steam addition is about 1.5 times greater than the relative decrease in U(air) extinction limit u p to 20* steam; and the relative decay of U(air) is not very sensitive to initial * 02.
Comparison with Effects of Steam on 112 + 02 + Inert Su Combustion Limits
The effects of steam on U(air) can also be compared with detailed Su measurements and calculations reported by Koroll and Mulpuru, 6 Figs. 25 and 26. For stoichiometric mixtures containing (mole basis) 50* 112, 25* 02, and either 25* N2 or 25* jiO, Su increased by 10.7* (experimental) and 10.1* (calculated) when 25* N2 was replaced by 25* HO. These results are
37
'8,
>5
U 0 0
C C
0.1 0.2 0.3 0.4 0.5 0.6 0.7 0.8
Mole fraction diluent
compared with our OJB extinction results as follows. Use of the Eq. (3) fit of the Fig. 17 results yields a 5.O increase in U(air) when 02 is held constant at 25 and 020 contaminant increases from o to 25 (i.e. MaO displaced N2). Thus the 5 increase in U(air) at CFDF extinction represents one-half the observed increase in burning velocity when steam is substituted for N2. Based on Koroll and Mulpuru's analysis, the increase in So is due almost entirely to a 15 times larger tsird-body efficiency for 020, compared to N2, for the exothermic reaction
H+02 +M --->002 -FM,
and for a subsequent cycle of exothermic low-activation energy reactions of 1102 with H, OH and 0, all of which exert a strong influence near the cool upstream boundary of the flame, where temperatures are generally below 1000 K.
EFFECTS OF STEAM ON LIMITS OF H2 COMBUSTION IN AIR: (1) Extinction limit. H2 vs. 02 /N2 steam countertlow DF (2)Buming velocity of stoichiometrie H 2 .. air + steam
1.0 - "Air ejection velocities at blowof 1. 2.7mm OJB. with various initial
.8 -
/ %02 (Dry basis)
5555
SS__
14.8-a.- 11.8 %02 .6
Relative-
- _______________________________________________ 0 Tte) velocity / - LBV (14.8 -a.- 11.8) Laminarbumtngvelocttyof
. 8 Vi 'vU 1 0.24 2800 4 premised H2 + air + steam, 1
initially at 25 - 250°C with 0.01 (ta) 0.20 2400 14.8% 02 (Dry basis). From S
.2Liu and MacFarlane (1983) 0 0.008 .._- 0.16 2000
0006 / - - - - 0.12 600 I:.-
0 4 8 12 16 20 24 28 32/fO !-008l200
Mole percent H20 (In OJB air or H2 - air premix) £ 0.002- - 004 800
Fig. 24. Effects of Steam on Limits of Ma ' _-__._
Combustion in Air: Comparison of 2.7 mm OJB 0 001 0.02. 400
0.03 004
extinction limits with laminar burning 011,41w. ate Its F1an, Nat)
velocity data from Liu and MacFarlane (1983). _____________________________Ownlnq Velocity S.8n,.,'
0.00 (b) 0.20 2400
0.008 - 0J6 2000 12
0.006 ,-,-.- •, 0J2 600 ,.,'OtIoiO..-
0.004 . 0...--1_9.. - 0.08 200
OoO2
0.0 0,01 0,02 0.03 0.04 Distant, intO lb. Film. tcml
Calculated flame structures for 2:1 H2-02 mixtures at 373K (a) containing 25% N 2 diluent, (b) containing 25% steam diluent.
Fig. 26. Reproduction of Koroll and Mulpuru's calculated flame structures for 2:1 02-02 mixtures at 373 K (a) containing 25 Nz diluent, and (b) containing 25 steam diluent.
Burning velocities of 2:1 H 2-02 mixtures at 373 K with the diluents N 2(L) and steam (0). Fig. 25. Reproduction of Koroll and Mulpuru's
results showing effects of N2 and steam diluents on burning velocity of stoichiometric 02-02 mixtures.
38
SU*IARY AND CONCLUSIONS
Coaxial tubular opposed jet burners (2.7, 5.0 and 7.0 nun i.d. OJB) were used to form dish shaped counterfiow diffusion flames (CFDF), centered by opposing laminar jets of 112 (N2 diluted in some cases) and both clean and contaminated "air" (O2/N2 mixtures) in an argon bath at 1 atm. Jet velocities for flame extinction (Blowoff) and restoration (Restore) limits are shown versus wide ranges of contaminant (0 to 20 mole %) and 02 (16% to 30%) concentrations in the air jet, and also input 112 concentration (30% to 100%). Blowoff, a sudden breaking of CFDF to a stable ring shape, occurs in highly stretched stagnation flows and is generally believed to measure kinetically limited flame reactivity. Restore, a sudden restoration of central flame, is a relatively new phenomenon which exhibits a 11.2-dependent hysteresis from Blowoff. Both 2.7 and 7.0 mm OJB jet velocities at Blowoff were converted to critical radial strain rates, a; resultant aair were 3 to 5 times smaller than recently published numerical results for 100%, 50%, and 21% 112/N2 fuel inputs and normal air. Whereas measured aueI doubled over the range 80 to 100% 112, 5air was constant. The Sair for pure 112 is considered a valid relative measure of kinetically controlled 02 consumption by a 112-air CFDF just before extinction. Furthermore, aair is a more fundamental measure of CFDF extinction than previously used fuel velocity (or strain rate), which mainly satisfies jet momentum balance for centering an OJB flame.
For 25% 02 "air" mixtures, mole-for-mole replacement of 25% N2 contaminant by steam increased U(air) or "flame strength" at Blowoff by about 5%. This result is consistent with laminar burning velocity (Su) results from analogous substitution of steam (25%) for N2 in a premixed stoichiometric }12-02-Nz(or steam) flame, shown by Koroll and Mulpuru to promote a 10% increase in experimental and calculated Su, due to enhanced third body (M) efficiency of water in: H + 02 + M ---> H02 + M. When the OJB results were compared with Liu and MacFarlanes's experimental Su of premixed stoichiometric 112 + air + steam (where N2 + steam > 55.7 mole %), a crossover occurred, i.e. steam enhanced OJB "flame strength" at extinction relative to Su. This finding remains consistent with Koroll and Mulpuru's extensive Su results, however, which show a crossover at 45% inert in stoichiometric 112-02-inert flames; i.e. substitution of steam for N2 (> 55.7% inert) decreases Su, due to dominance of thermodynamic effects at lower Oz levels. Overall, the relative effect of steam, compared to N2, on extinction of 112 vs. air + steam CFDF is about one-half the incremental effect on Su of stoichiometric 112 + 02 + N2 + steam mixtures over a wide range of concentrations. In contrast, CO2 contamination significantly reduced U(air) at extinction relative to steam. Finally, unpublished analyses of previous OJB data on extinction of H2/N2 jets vs. contaminated air yielded characterizations of the U(air) intercept, at unity Ha mole fraction, as functions of N2, CO2, and also NO, CO concentrations in air; results were generally consistent with recent data derived from pure Ha jets.
ACKNOWLEDGEMENTS
The authors are grateful to K. M. Isaac and Y. H. Ho, University of Missouri--Rolla, for valuable discussions on CFDF theory and application, and for numerical results obtained prior to publication of their very recent report "Analysis of Opposed Jet Hydrogen-air Counter Flow Diffusion Flame." We also gratefully acknowledge assistance by Hung-Chou Tai, Governors School Student, with analysis and plotting of data.
REFERENCES
1. Edelman, R. B.; and Spadaccini, L. J.: Theoretical Effects of Vitiated Air Contamination 'w Ground Testing of Hypersonic Air Breathing Engines. Presented as Paper 69-456 at AIAA 5th Propulsion Joint Specialist Conference, U.S. Air Force Academy, Cob. June 9-13, 1969.
Slack, H.; and Grillo, A.: Investigation of Hydrogen-Air Ignition Sensitized by Nitric Oxide and by Nitrogen Dioxide. NASA CR-2896, 1977.
3. Rogers, 11. Clayton; Schexnayder, Charles J. Jr.: Chemical Kinetic Analysis of Hydrogen-Air Ignition and Reaction Times. NASA TP-1856, July 1981.
4. Kuehi, D. K.: Effects of Water on the Burning Velocity of Hydrogen-Air Flames. AIlS Journal, 32, pp. 1724-1726, 1962.
5. Liu, D. 0. S. and MacFarlane, Il.: Laminar Burning Velocities of Hydrogen-Air and Hydrogen-Air-Steam Flames. Combustion and Flame, 49, pp. 59-71, 1983.
Koroll, G. W. and Mulpuru, S. R.: The Effect of Dilution with Steam on the Burning Velocity and Structure of Premixed Hydrogen Flames. Twenty-First Symposium (Internationafl on Combustion, The Combustion Institute, pp. 1811-1819, 1986
39
7. Huber, P. W.; Schexnayder, C. J. Jr.; and McClinton, C. H.: Criteria for Self-Ignition of Supersonic Hydrogen-Air Mixtures. NASA TP-1457, Aug. 1979.
8. Pellett, G. 1.; Northam, G. B.; Wilson, L. G.; Jarrett, 0., Jr.; Antcliff, H. R.; Dancey, C. L.; and Wang, J. A.: Opposed Jet Diffusion Flames of Nitrogen-Diluted Hydrogen vs. Air: Axial LDA and CARS Surveys; Fuel/Air Strain Rates at Extinction.: AIAA Preprint AIAA-89-2522, 19 pp. July 1989.
9. Dugger, G. L.; Simon, D. M.; and Gerstein, M.: Basic Considerations in the Combustion of Hydrocarbon Fuels with Air. NACA Report 1300, 1959.
10. Drell, I. L. and Belles, F.: Survey of Hydrogen Combustion Properties. National Advisory Committee for Aeronautics, Report 1383, 34 pp., 1958.
11. Potter, A. E., Jr. and Butler, J. N.: Am. Rocket Soc. J., 29, 54-56 (1959).
12. Potter, A. E.; Heimel, S.; Butler, J. N.: Apparent Flame Strength. A Measure of Maximum Reaction Rate in Diffusion Flames. Eighth Symposium (International) on Combustion, Williams and Wilkins, Baltimore, pp. 1027-1034, 1962.
13. Anagnostou, E. and Potter, A. E.: Flame Strength of Propane-Oxygen Flames at Low Pressures in Turbulent Flow. Ninth Symposium (International) on Combustion. Academic Press, New York, pp. 1-6, 1963.
14. Spalding, D. B.: Theory of Mixing and Chemical Reaction in the Opposed-Jet Diffusion Flame. ARS Journal, 31, pp. 763-771, 1961.
15. Pandya, T. P. and Weinberg, F. J.: The Structure of Flat, Counter-flow Diffusion Flames. Proceedings of the Royal Society, London, 279, pp. 544-561, 1964.
16. Fendell, Francis: Ignition and Extinction in Combustion of Initially Unmixed Reactants. J. Fluid. Mech., 21, part 2, pp. 281-303, 1965.
17. Tsuji, Hiroshi; Yamaoka, Ichiro: The Counterflow Diffusion Flame in the Forward Stagnation Region of a Porous Cylinder. Eleventh Symposium (International) on Combustion, The Combustion Institute, pp. 979-984, 1967.
18. Jam, V. K. and Makunda, H. S.: On the Ignition and Extinction Problems in Forced Convection Systems. mt. J. Heat Mass Transfer, 11, pp. 491-508, 1968.
19. Jam, V. K. and Makunda, H. S.: The Extinction Problem in an Opposed Jet Diffusion Flame with Competitive Reactions. Combustion Sci. and Tech., 1, pp. 105-117, 1969.
20. Liu, T. M. and Libby, Paul A.: Boundary Layer at a Stagnation Point with Hydrogen Injection. Combustion Sci. and Tech., 2, pp. 131-144, 1970.
21. Linan, Amable: The Asymptotic Structure of Counterflow Diffusion Flames for Large Activation Energies. Acta Astronautica, 1, pp. 1007-1039, 1974.
22. Tsu.ji, Hiroshi and Yamaoka, Ichiro: The Structure of Counterflow Diffusion Flames in the Forward Stagnation Region of a Porous Cylinder. Twelfth Symposium (International) on Combustion, The Combustion Institute, pp. 997-1005, 1969.
23. Tsuji, Hiroshi and Yamaoka, Ichiro: Structure Analysis of Counterf low Diffusion Flames in the Forward Stagnation Region of a Porous Cylinder. Thirteenth Symposium (International) on Combustion, The Combustion Institute, pp. 723-731, 1971.
24. Tsuji, Hiroshi: Counteruiow Diffusion Flames. Prog. Energy Combust. Sci., 8, pp. 93-119, 1982.
25. Hahn, W. A., and Wendt, J. 0. L.: The Flat Laminar Opposed Jet Diffusion Flame: A Novel Tool for Kinetic Studies of Trace Species Formation. Chemical Eng. Conimun., 9, pp. 121-136, 1981.
26. Hahn, W. A. and Wendt, J. 0. L.: NOx Formation in Flat, Laminar Opposed Jet Methane Diffusion Flames. Eighteenth Symposium (International) on Combustion, The Combustion Institute, pp. 121-131, 1981.
27. Hahn, W. A. and Wendt, J. 0. L.: Analysis of the Flat Laminar Opposed Jet Diffusion Flame with Finite Rate Detailed Chemical Kinetics. Combustion Science and Technology, 27, pp. 1-17, 1981.
40
28. Ishizuka, Satoru and Tsuji, Hiroshi: An Experimental Study of Effect of Inert Gases on Extinction of Laminar Diffusion Flames. Eighteenth Symposium (International) on Combustion,
The Combustion Institute, pp. 695-703, 1981.
29. Tsuji, Hiroshi and Yamaoka, Ichiro: Structure and Extinction of Near-Limit Flames in a Stagnation Flow. Nineteenth Symposium (International) on Combustion, The Combustion Institute,
pp. 1533-1540, 1982.
30. Sato, Junichi: Effects of Lewis Number on Extinction Behavior of Premixed Flames in a Stagnation Flow. Nineteenth Symposium (International) on Combustion, The Combustion Institute,
pp. 1541-1548, 1982.
31. Yamaoka, Ichiro; Tsuji, Hiroshi: Determination of Burning Velocity Using Counterl low Flames. Twentieth Symposium (International) on Combustion, The Combustion Institute, pp. 1883-1892,
1984.
32. Dixon-Lewis, G.; David, T.; Gaskell, P. H.; Fukutani, S.; Jinno, H.; Miller, J. A.; Kee, R. J.; Smooke, M. D.; Peters, N.; Effelsberg, E.; Warnatz, J.; and Behrendt, F.: Calculation of the Structure and Extinction Limit of a Methane-Air Counterf low Diffusion Flame in the Forward Stagnation Region of a Porous Cylinder. Twentieth Symposium (International) on Combustion.
The Combustion Institute, pp. 1893-1904, 1984.
33. Hamins, A and Seshadri, K.: Structure of Counterfiow Diffusion Flames Burning Multicomponent Fuels. Twentieth Symposium (International) on Combustion. The Combustion Institute, pp. 1905-1913, 1984.
34. Wu, C. K.; and Law, C. K.: (add title) Twentieth Symposium (International) on Combustion, The Combustion Institute, Pittsburgh, pp. 1941-1949, 1984,
35. Yu, G.; Law, C. K.; and Wu, C. K.: (add title) Combustion and Flame, 63, 339-347 (1986).
36. Dixon-Lewis, G; David, T.; Gaskell, P. H.: Structure and Properties of Methane-air and Hydrogen-air Counterfiow Diffusion Flames. Archivum Combustionis, 6, No. 1, pp. 3-21, 1986.
37. Smooke, M. D.; Pun, I. K.; and Seshadri, K.: A Comparison Between Numerical Calculations and Experimental Measurements of the Structure of a Counterflow Diffusion Flame Burning Diluted Methane in Diluted Air. Report ME-10l-86, Dept. of Mechanical Engineering, Yale Univ., Feb. 1986.
38. Olson, S. L. and T'ien, J. S.: A Theoretical Analysis of the Extinction Limits of a Methane-Air Opposed-Jet Diffusion Flame in the Absence of Buoyancy-Driven Flows. Presented at Eastern Section/Combustion Institute Meeting, May 5 - 6, 1986.
39. Key, R. J.; Miller, J. A.; Evans, 6. H.; and Dixon-Lewis, G.: A Computational Model of the Structure and Extinction of Strained, Opposed Flow, Premixed Methane-Air Flames. Presented at Twenty-Second Symposium (International) on Combustion, Seattle, WA, August 14-18, 1988.
40. Dixon-Lewis, G. and Missaghi, M.: Structure arid Extinction Limits of Counterf low Diffusion Flames of Hydrogen-Nitrogen mixtures in Air. Presented at Twenty-Second Symposium (International) on Combustion, Seattle, WA, August 14-18, 1988.
41. Posillico, C. J. and Lederman, S.: AIAA Journal, 27, no. 1, 67-78 (1989).
42. Pellett, G. L.; Northam, G. B.; Guerra, R.; Wilson, L. G.: Opposed Jet Burner Studies of Silane-Methane, Silane-Hydrogen, and Hydrogen Diffusion Flames with Air. CPIA Publication 457,
Vol. 1, pp. 391-404, Oct. 1986.
43. Guerra, R.; Pellett, G. L.; Wilson, L. G.; Northam, G. B.: Opposed Jet Burner Studies of
Hydrogen Combustion with Pure and N2, NO Contaminated Air. AIAA Preprint no. AIAA-87-0090, 11
pp, Jan. 1987.
44. Guerra, R.; Pellett, G. L.; Wilson, L. G.; Northam, G. B.: Opposed Jet Burner Studies of Effects of CO, CO2, and N2 Air Contaminants on Hydrogen-air Diffusion Flames. AIAA Preprint no. AIAA-87-1960, 14 pp, July 1987.
45. Pellett, G. L.; Guerra, R.; Wilson, L. 6.; and Northam, G. B.: A Simple Laboratory Technique for Screening Facility Contaminant Effects on the Maximum Burning Rate of Hydrogen-Air Diffusion Flames. Presented at Third National Aero-Space Plane Technology Symposium, NASA Ames Research Center, Moffett Field, CA, pp 49-1 to 49-22, June 2-4, 1987.
41
46. Guerra, Rosemary: Effects of NO, CO, CO2, and N2 Air-Contaminants on Hydrogen-air Diffusion Flames. MS Thesis submitted to The School of Engineering and Applied Science of The George Washington University, 81 pp., August 1987.
47. Pellett, G. L.; Guerra, Rosemary; Wilson, L. G.; Reeves, H. H.; and Northam, G. B.: Combustion Rate Limits of Hydrogen Plus Hydrocarbon Fuel--Air Diffusion Flames from an Opposed Jet Burner Technique. Presented at 24th JANNAF Combustion Meeting, Monterey, CA, Oct. 5-8, 1987.
48. Pellett, G. L.; Jentzen, M. E.; Wilson, L. G.; and Northam, G. B.: Effects of Water-Contaminated Air on Blowoff Limits of Opposed Jet Hydrogen-Air Diffusion Flames. AIAA Preprint no. AIAA-88-3295, 10 pp., July, 1988.
42