1,2,†,* sohrab p. shah europe pmc funders group . author
TRANSCRIPT
The genomic and transcriptomic architecture of 2,000 breasttumours reveals novel subgroups
Christina Curtis1,2,†,*, Sohrab P. Shah3,4,*, Suet-Feung Chin1,2,*, Gulisa Turashvili3,4,*,Oscar M. Rueda1,2, Mark J. Dunning2, Doug Speed2,5,†, Andy G. Lynch1,2, ShamithSamarajiwa1,2, Yinyin Yuan1,2, Stefan Gräf1,2, Gavin Ha3, Gholamreza Haffari3, AliBashashati3, Roslin Russell2, Steven McKinney3,4, METABRIC Group‡, Anita Langerød6,Andrew Green7, Elena Provenzano8, Gordon Wishart8, Sarah Pinder9, Peter Watson3,4,10,Florian Markowetz1,2, Leigh Murphy10, Ian Ellis7, Arnie Purushotham9,11, Anne-LiseBørresen-Dale6,12, James D. Brenton2,13, Simon Tavaré1,2,5,14, Carlos Caldas1,2,8,13, andSamuel Aparicio3,4
1Department of Oncology, University of Cambridge, Hills Road, Cambridge CB2 2XZ, UK.2Cancer Research UK, Cambridge Research Institute, Li Ka Shing Centre, Robinson Way,Cambridge CB2 0RE, UK.3Department of Pathology and Laboratory Medicine, University of British Columbia, Vancouver,British Columbia V6T 2B5, Canada.4Molecular Oncology, British Columbia Cancer Research Centre, Vancouver, British ColumbiaV5Z 1L3, Canada.5Department of Applied Mathematics and Theoretical Physics, University of Cambridge, Centrefor Mathematical Sciences, Cambridge CB3 0WA, UK.6Department of Genetics, Institute for Cancer Research, Oslo University HospitalRadiumhospitalet, Montebello, 0310 Oslo, Norway.7Department of Histopathology, School of Molecular Medical Sciences, University of Nottingham,Nottingham NG5 1PB, UK.
©2012 Macmillan Publishers Limited. All rights reserved
Correspondence and requests for materials should be addressed to Ca.C. ([email protected]) or S.A. ([email protected])..†Present addresses: Department of Preventive Medicine, Keck School of Medicine, University of Southern California, Los Angeles,California 90033, USA (Ch.C.); University College London, Genetics Institute, WC1E 6BT, UK (D.S.).*These authors contributed equally to this work.‡Lists of participants and affiliations appear at the end of the paper.
Supplementary Information is linked to the online version of the paper at www.nature.com/nature.
Author Contributions Ch.C. led the analysis, designed experiments and wrote the manuscript. S.P.S. led the HMM-based analyses,expression outlier and TP53 analyses, and contributed to manuscript preparation. S.-F.C. generated data, designed and performedexperiments. G.T. generated data, provided histopathology expertise and analysed TP53 sequence data. O.M.R., M.J.D., D.S., A.G.L.,S.S., Y.Y., S.G., Ga.H., Gh.H., A.B., R.R., S.M. and F.M. performed analyses. G.T., A.G., E.P., S.P. and I.E. provided histopathologyexpertise. A.L. performed TP53 sequencing. A.-L.B.-D. oversaw TP53 sequencing. S.P., P.W., L.M., G.W., I.E., A.P., Ca.C. and S.A.contributed to sample selection. J.D.B. and S.T. contributed to study design. S.T. provided statistical expertise. The METABRICGroup contributed collectively to this study. Ca.C. and S.A. co-conceived and oversaw the study, and contributed to manuscriptpreparation and were responsible for final editing. Ca.C. and S.A. are joint senior authors and project co-leaders.
The authors declare no competing financial interests.
Author Information The associated genotype and expression data have been deposited at the European Genome-Phenome Archive(http://www.ebi.ac.uk/ega/), which is hosted by the European Bioinformatics Institute, under accession number EGAS00000000083.Reprints and permissions information is available at www.nature.com/reprints. Readers are welcome to comment on the onlineversion of this article at www.nature.com/nature.
Europe PMC Funders GroupAuthor ManuscriptNature. Author manuscript; available in PMC 2012 December 21.
Published in final edited form as:Nature. ; 486(7403): 346–352. doi:10.1038/nature10983.
Europe PM
C Funders A
uthor Manuscripts
Europe PM
C Funders A
uthor Manuscripts
8Cambridge Breast Unit, Addenbrooke’s Hospital, Cambridge University Hospital NHSFoundation Trust and NIHR Cambridge Biomedical Research Centre, Cambridge CB2 2QQ, UK.9King’s College London, Breakthrough Breast Cancer Research Unit, London WC2R 2LS, UK.10Manitoba Institute of Cell Biology, University of Manitoba, Manitoba R3E 0V9, Canada.11NIHR Comprehensive Biomedical Research Centre at Guy’s and St Thomas’ NHS FoundationTrust and King’s College London, London WC2R 2LS, UK.12Institute for Clinical Medicine, Faculty of Medicine, University of Oslo, 0316 Oslo, Norway.13Cambridge Experimental Cancer Medicine Centre, Cambridge CB2 0RE, UK.14Molecular and Computational Biology Program, University of Southern California, Los Angeles,California 90089, USA.
AbstractThe elucidation of breast cancer subgroups and their molecular drivers requires integrated viewsof the genome and transcriptome from representative numbers of patients. We present anintegrated analysis of copy number and gene expression in a discovery and validation set of 997and 995 primary breast tumours, respectively, with long-term clinical follow-up. Inherited variants(copy number variants and single nucleotide polymorphisms) and acquired somatic copy numberaberrations (CNAs) were associated with expression in ~40% of genes, with the landscapedominated by cis- and trans-acting CNAs. By delineating expression outlier genes driven in cis byCNAs, we identified putative cancer genes, including deletions in PPP2R2A, MTAP andMAP2K4. Unsupervised analysis of paired DNA–RNA profiles revealed novel subgroups withdistinct clinical outcomes, which reproduced in the validation cohort. These include a high-risk,oestrogen-receptor-positive 11q13/14 cis-acting subgroup and a favourable prognosis subgroupdevoid of CNAs. Trans-acting aberration hotspots were found to modulate subgroup-specific genenetworks, including a TCR deletion-mediated adaptive immune response in the ‘CNA-devoid’subgroup and a basal-specific chromosome 5 deletion-associated mitotic network. Our resultsprovide a novel molecular stratification of the breast cancer population, derived from the impact ofsomatic CNAs on the transcriptome.
Inherited genetic variation and acquired genomic aberrations contribute to breast cancerinitiation and progression. Although somatically acquired CNAs are the dominant feature ofsporadic breast cancers, the driver events that are selected for during tumorigenesis aredifficult to elucidate as they co-occur alongside a much larger landscape of random non-pathogenic passenger alterations1,2 and germline copy number variants (CNVs). Attempts todefine subtypes of breast cancer and to discern possible somatic drivers are still in theirrelative infancy3–6, in part because breast cancer represents multiple diseases, implying thatlarge numbers (many hundreds or thousands) of patients must be studied. Here we describean integrated genomic/transcriptomic analysis of breast cancers with long-term clinicaloutcomes composed of a discovery set of 997 primary tumours and a validation set of 995tumours from METABRIC (Molecular Taxonomy of Breast Cancer InternationalConsortium).
A breast cancer population genomic resourceWe assembled a collection of over 2,000 clinically annotated primary fresh-frozen breastcancer specimens from tumour banks in the UK and Canada (Supplementary Tables 1–3).Nearly all oestrogen receptor (ER)-positive and/or lymph node (LN)-negative patients didnot receive chemotherapy, whereas ER-negative and LN-positive patients did. Additionally,none of the HER2+ patients received trastuzumab. As such, the treatments were
Curtis et al. Page 2
Nature. Author manuscript; available in PMC 2012 December 21.
Europe PM
C Funders A
uthor Manuscripts
Europe PM
C Funders A
uthor Manuscripts
homogeneous with respect to clinically relevant groupings. An initial set of 997 tumourswas analysed as a discovery group and a further set of 995 tumours, for which complete datalater became available, was used to test the reproducibility of the integrative clusters(described below). An overview of the main analytical approaches is provided inSupplementary Fig. 1. Details concerning expression and copy number profiling, includingsample assignment to the PAM50 intrinsic subtypes3,4,7 (Supplementary Fig. 2), copynumber analysis (Supplementary Tables 4–8) and validation (Supplementary Figs 3 and 4and Supplementary Tables 9–11), and TP53 mutational profiling (Supplementary Fig. 5) aredescribed in the Supplementary Information.
Genome variation affects tumour expression architectureGenomic variants are considered to act in cis when a variant at a locus has an impact on itsown expression, or in trans when it is associated with genes at other sites in the genome. Wegenerated a map of CNAs, CNVs (Supplementary Fig. 6, Supplementary Tables 12–15) andsingle nucleotide polymorphisms (SNPs) in the breast cancer genome to distinguishgermline from somatic variants (see Methods), and to examine the impact of each of thesevariants on the expression landscape. Previous studies8 have shown that most heritable geneexpression traits are governed by a combination of cis (proximal) loci, defined here as thosewithin a 3-megabase (Mb) window surrounding the gene of interest, and trans (distal) loci,defined here as those outside that window. We assessed the relative influence of SNPs,CNVs and CNAs on tumour expression architecture, using each of these variants as apredictor (see Methods) to elucidate expression quantitative trait loci (eQTLs) amongpatients.
Both germline variants and somatic aberrations were found to influence tumour expressionarchitecture, having an impact on >39% (11,198/28,609) of expression probes genome-widebased on analysis of variance (ANOVA; see Methods), with roughly equal numbers of genesassociated in cis and trans. CNAs were associated with the greatest number of expressionprofiles (Fig. 1, Supplementary Figs 7–13 and Supplementary Tables 16–20), but wererivalled by SNPs to explain a greater proportion of expression variation on a per-gene basisgenome-wide, whereas the contribution from CNVs was more moderate (Fig. 1b andSupplementary Table 21). The true ratio of putative trans versus cis eQTLs is hard toestimate9; however, the large sample size used here allowed the detection of small effects,with 5,401 and 5,462 CNAs significantly (Šidák adjusted P value <0.0001) associated in cisor in trans, respectively. Whereas cis-associations tended to be stronger, the trans-acting locimodulated a larger number of messenger RNAs, as described below.
Expression outliers refine the breast cancer landscapeAs shown above, ~20% of loci exhibit CNA-expression associations in cis (SupplementaryFig. 14). To refine this landscape further and identify the putative driver genes, we usedprofiles of outlying expression (see Methods and ref. 10) and the high resolution andsensitivity of the Affymetrix SNP 6.0 platform to delineate candidate regions. This approachmarkedly reduces the complexity of the landscape to 45 regions (frequency > 5, Fig. 2) andnarrows the focus, highlighting novel regions that modulate expression. The fullenumeration of regions delineated by this approach and their subtype-specific associations(Supplementary Figs 15 and 16 and Supplementary Tables 22–24) includes both knowndrivers (for example, ZNF703 (ref. 11), PTEN (ref. 12), MYC, CCND1, MDM2, ERBB2,CCNE1 (ref. 13)) and putative driver aberrations (for example, MDM1, MDM4, CDK3,CDK4, CAMK1D, PI4KB, NCOR1).
The deletion landscape of breast cancer has been poorly explored, with the exception ofPTEN. We illustrate three additional regions of significance centred on PPP2R2A (8p21,
Curtis et al. Page 3
Nature. Author manuscript; available in PMC 2012 December 21.
Europe PM
C Funders A
uthor Manuscripts
Europe PM
C Funders A
uthor Manuscripts
Fig. 2, region 11), MTAP (9p21, Fig. 2, region 15) and MAP2K4 (17p11, Fig. 2, region 33),which exhibit heterozygous and homozygous deletions (Supplementary Figs 15, 17–19 andSupplementary Table 24) that drive expression of these loci. We observe breast cancersubtype-specific (enriched in mitotic ER-positive cancers) loss of transcript expression inPPP2R2A, a B-regulatory subunit of the PP2A mitotic exit holoenzyme complex. Somaticmutations in PPP2R1A have recently been reported in clear cell ovarian cancers andendometrioid cancers14,15, and methylation silencing of PPP2R2B has also been observed incolorectal cancers16. Thus, dysregulation of specific PPP2R2A functions in luminal B breastcancers adds a significant pathophysiology to this subtype.
MTAP (9p21, a component of methyladenosine salvage) is frequently co-deleted with theCDKN2A and CDKN2B tumour suppressor genes in a variety of cancers17 as we observehere (Supplementary Figs 17c and 18). The third deletion encompasses MAP2K4 (alsocalled MKK4) (17p11), a p38/Jun dual specificity serine/threonine protein kinase. MAP2K4has been proposed as a recessive cancer gene18, with mutations noted in cell lines19. Weshow, for the first time, the recurrent deletion of MAP2K4 (Supplementary Figs 17d and 19)concomitant with outlying expression (Supplementary Fig. 15) in predominantly ER-positive cases, and verify homozygous deletions (Supplementary Table 9) in primarytumours, strengthening the evidence for MAP2K4 as a tumour suppressor in breast cancer.
Trans-acting associations reveal distinct modulesWe next asked how trans-associated expression profiles are distributed across the genome.We mapped these in the expression landscape by examining the matrices of CNA–expression associations (see Methods). This revealed strong off-diagonal patterns at loci onchromosomes 1q, 7p, 8, 11q, 14q, 16, 17q and 20q (Fig. 3a), including both positive andnegative associations, as well as numerous trans-acting aberration hotspots (defined asCNAs associated with >30 mRNAs). Importantly, these aberration hotspots can be groupedinto pathway modules, which highlight known driver loci such as ERBB2 and MYC, as wellas novel loci associated with large trans expression modules (Supplementary Tables 25 and26). The T-cell-receptor (TCR) loci on chromosomes 7 (TRG) and 14 (TRA) represent twosuch hotspots that modulated 381 and 153 unique mRNAs, respectively, as well as 19 duallyregulated genes (Supplementary Fig. 20). These cognate mRNAs were highly enriched forT-cell activation and proliferation, dendritic cell presentation, and leukocyte activation,which indicate the induction of an adaptive immune response associated with tumour-infiltrating lymphocytes (Fig. 3b, Supplementary Fig. 20 and Supplementary Tables 27 and28), as described later.
In a second approach, we examined the genome-wide patterns of linear correlation betweencopy number and expression features (see Methods), and noted the alignment of several off-diagonal signals, including those on chromosome 1q, 8q, 11q, 14q and 16 (SupplementaryFig. 21). Additionally, a broad signal on chromosome 5 localizing to a deletion eventrestricted to the basal-like tumours was observed (Supplementary Fig. 21), but was notdetected with the eQTL framework, where discrete (as opposed to continuous) copy numbervalues were used. This basal-specific trans module is enriched for transcriptional changesinvolving cell cycle, DNA damage repair and apoptosis (Supplementary Table 29),reflecting the high mitotic index typically associated with basal-like tumours, described indetail below.
Integrative clustering reveals novel subgroupsUsing the discovery set of 997 breast cancers, we next asked whether novel biologicalsubgroups could be found by joint clustering of copy number and gene expression data. Onthe basis of our finding that cis-acting CNAs dominated the expression landscape, the top
Curtis et al. Page 4
Nature. Author manuscript; available in PMC 2012 December 21.
Europe PM
C Funders A
uthor Manuscripts
Europe PM
C Funders A
uthor Manuscripts
1,000 cis-associated genes across all subtypes (Supplementary Table 30) were used asfeatures for input to a joint latent variable framework for integrative clustering20 (seeMethods). Cluster analysis suggested 10 groups (based on Dunn’s index) (see Methods andSupplementary Figs 22 and 23), but for completeness, this result was compared with theresults for alternative numbers of clusters and clustering schemes (see Methods,Supplementary Figs 23–27 and Supplementary Tables 31–33). The 10 integrative clusters(labelled IntClust 1–10) were typified by well-defined copy number aberrations (Fig. 4,Supplementary Figs 22, 28–30 and Supplementary Tables 34–39), and split many of theintrinsic subtypes (Supplementary Figs 31–33). Kaplan–Meier plots of disease-specificsurvival and Cox proportional hazards models indicate subgroups with distinct clinicaloutcomes (Fig. 5, Supplementary Figs 34, 35 and Supplementary Tables 40 and 41). Tovalidate these results, we trained a classifier (754 features) for the integrative subtypes in thediscovery set using the nearest shrunken centroids approach21 (see Methods andSupplementary Tables 42 and 43), and then classified the independent validation set of 995cases into the 10 groups (Supplementary Table 44). The reproducibility of the clusters in thevalidation set is shown in three ways. First, classification of the validation set resulted in theassignment of a similar proportion of cases to the 10 subgroups, each of which exhibitednearly identical copy number profiles (Fig. 4). Second, the groups have substantially similarhazard ratios (Fig. 5b, Supplementary Fig. 35 and Supplementary Table 40). Third, thequality of the clusters in the validation set is emphasized by the in-group proportions (IGP)measure22 (Fig. 4).
Among the integrative clusters, we first note an ER-positive subgroup composed of11q13/14 cis-acting luminal tumours (IntClust 2, n = 45) that harbour other commonalterations. This subgroup exhibited a steep mortality trajectory with elevated hazard ratios(discovery set: 3.620, 95% confidence interval (1.905–6.878); validation set: 3.353, 95%confidence interval (1.381–8.141)), indicating that it represents a particularly high-risksubgroup. Several known and putative driver genes reside in this region, namely CCND1(11q13.3), EMSY (11q13.5), PAK1 (11q14.1) and RSF1 (11q14.1), which have beenpreviously linked to breast13,23 or ovarian cancer24. Both the copy number (Fig. 4) andexpression outlier landscapes (Fig. 2) suggest at least two separate amplicons at 11q13/14,one at CCND1 (11q13.3) and a separate peak from 11q13.5-11q14.1 spanning UVRAG–GAB2, centred around PAK1, RSF1, C11orf67 and INTS4, where it is more challenging todistinguish the driver24. Notably, the expression outlier profiles for this region are enrichedfor samples belonging to IntClust 2 (Fig. 2, inset region 23) and all 45 members of thissubgroup harboured amplifications of these genes, with high frequencies of amplificationalso observed for CCND1 (n = 39) and EMSY (n = 34). In light of these observations, the11q13/14 amplicon may be driven by a cassette of genes rather than a single oncogene.
Second, we note the existence of two subgroups marked by a paucity of copy number andcis-acting alterations. These subgroups cannot be explained by low cellularity tumours (seeMethods). One subgroup (IntClust3, n = 156) with low genomic instability (Fig. 4 andSupplementary Fig. 22) was composed predominantly of luminal A cases, and was enrichedfor histotypes that typically have good prognosis, including invasive lobular and tubularcarcinomas. The other subgroup (IntClust 4, n = 167) was also composed of favourableoutcome cases, but included both ER-positive and ER-negative cases and varied intrinsicsubtypes, and had an essentially flat copy number landscape, hence termed the ‘CNA-devoid’ subgroup. A significant proportion of cases within this subgroup exhibit extensivelymphocytic infiltration (Supplementary Table 45).
Third, several intermediate prognosis groups of predominantly ER-positive cancers wereidentified, including a 17q23/20q cis-acting luminal B subgroup (IntClust 1, n = 76), an8p12 cis-acting luminal subgroup (IntClust 6, n = 44), as well as an 8q cis-acting/20q-
Curtis et al. Page 5
Nature. Author manuscript; available in PMC 2012 December 21.
Europe PM
C Funders A
uthor Manuscripts
Europe PM
C Funders A
uthor Manuscripts
amplified mixed subgroup (IntClust 9, n = 67). Two luminal A subgroups with similar CNAprofiles and favourable outcome were noted. One subgroup is characterized by the classical1q gain/16q loss (IntClust 8, n = 143), which corresponds to a common translocationevent25, and the other lacks the 1q alteration, while maintaining the 16p gain/16q loss withhigher frequencies of 8q amplification (IntClust 7, n = 109). We also noted that the majorityof basal-like tumours formed a stable, mostly high-genomic instability subgroup (IntClust10, n = 96). This subgroup had relatively good long-term outcomes (after 5 years),consistent with ref. 26, and characteristic cis-acting alterations (5 loss/8q gain/10p gain/12pgain).
The ERBB2-amplified cancers composed of HER2-enriched (ER-negative) cases andluminal (ER-positive) cases appear as IntClust 5 (n = 94), thus refining the ERBB2 intrinsicsubtype by grouping additional patients that might benefit from targeted therapy. Patients inthis study were enrolled before the general availability of trastuzumab, and as expected thissubgroup exhibits the worst disease-specific survival at both 5 and 15 years and elevatedhazard ratios (discovery set: 3.899, 95% confidence interval (2.234–6.804); validation set:4.447, 95% confidence interval (2.284–8.661)).
Pathway deregulation in the integrative subgroupsFinally, we projected the molecular profiles of the integrative subgroups onto pathways toexamine possible biological themes among breast cancer subgroups (Supplementary Tables46 and 47) and the relative impact of cis and trans expression modules on the pathways. TheCNA-devoid (IntClust 4) group exhibits a strong immune and inflammation signatureinvolving the antigen presentation pathway, OX40 signalling, and cytotoxic T-lymphocyte-mediated apoptosis (Supplementary Fig. 36). Given that trans-acting deletion hotspots werelocalized to the TRG and TRA loci and were associated with an adaptive immune responsemodule, we asked whether these deletions contribute to alterations in this pathway. TheCNA-devoid subgroup (IntClust 4) was found to exhibit nearly twice as many deletions(typically heterozygous loss) at the TRG and TRA loci (~20% of cases) as compared to theother subtypes (with the exception of IntClust 10), and deletions of both TCR loci weresignificantly associated with severe lymphocytic infiltration (χ2 test, P < 10−9 and P < 10−8,respectively). Notably, these trans-associated mRNAs were significantly enriched in theimmune response signature of the CNA-devoid subgroup (Supplementary Fig. 36) as well asamong genes differentially expressed in CNA-devoid cases with severe lymphocyticinfiltration (Supplementary Fig. 37). We conclude that genomic copy number loss at theTCR loci drives a trans-acting immune response module that associates with lymphocyticinfiltration, and characterizes an otherwise genomically quiescent subgroup of ER-positiveand ER-negative patients with good prognosis. These observations suggest the presence ofmature T lymphocytes (with rearranged TCR loci), which may explain an immunologicalresponse to the cancer. In line with these findings, a recent study27 demonstrated theassociation between CD8+ lymphocytes and favourable prognosis.
Also among the trans-influenced groups is IntClust 10 (basal-like cancer enrichedsubgroup), which harbours chromosome 5q deletions (Supplementary Fig. 21). Numeroussignalling molecules, transcription factors and cell division genes were associated in transwith this deletion event in the basal cancers, including alterations in AURKB, BCL2, BUB1,CDCA3, CDCA4, CDC20, CDC45, CHEK1, FOXM1, HDAC2, IGF1R, KIF2C, KIFC1,MTHFD1L, RAD51AP1, TTK and UBE2C (Supplementary Fig. 38). Notably, TTK(MPS1), a dual specificity kinase that assists AURKB in chromosome alignment duringmitosis, and recently reported to promote aneuploidy in breast cancer28, was upregulated.These results indicate that 5q deletions modulate the coordinate transcriptional control ofgenomic and chromosomal instability and cell cycle regulation within this subgroup.
Curtis et al. Page 6
Nature. Author manuscript; available in PMC 2012 December 21.
Europe PM
C Funders A
uthor Manuscripts
Europe PM
C Funders A
uthor Manuscripts

In contrast to these subtype-specific trans-associated signatures, the high-risk 11q13/14subgroup was characterized by strong cis-acting associations. Like the basal cancers, thissubgroup also exhibited alterations in key cell-cycle-related genes (Supplementary Fig. 39),which probably have a role in its aggressive pathophysiology, but the nature of the signaturediffers. In particular, the regulation of the G1/S transition by BTG family proteins, whichinclude CCND1, PPP2R1B and E2F2, was significantly enriched in the 11q13/14 cis-actingsubgroup, but not the basal cancers, and this is consistent with CCND1 and the PPP2Rsubunit representing subtype-specific drivers in these tumours.
DiscussionWe have generated a robust, population-based molecular subgrouping of breast cancer basedon multiple genomic views. The size and nature of this cohort made it amenable to eQTLanalyses, which can aid the identification of loci that contribute to the disease phenotype29.CNAs and SNPs influenced expression variation, with CNAs dominating the landscape incis and trans. The joint clustering of CNAs and gene expression profiles further resolves theconsiderable heterogeneity of the expression-only subgroups, and highlights a high-risk11q13/14 cis-acting subgroup as well as several other strong cis-actingclusters and agenomically quiescent group. The reproducibility of subgroups with these molecular andclinical features in a validation cohort of 995 tumours suggests that by integrating multiplegenomic features it may be possible to derive more robust patient classifiers. We show here,for the first time, that subtype-specific trans-acting aberrations modulate concertedtranscriptional changes, such as the TCR deletion-mediated adaptive immune response thatcharacterizes the CNA-devoid subgroup and the chromosome 5 deletion-associated cellcycle program in the basal cancers.
The integrated CNA-expression landscape highlights a limited number of genomic regionsthat probably contain driver genes, including ZNF703, which we recently described as aluminal B specific driver11, as well as somatic deletion events affecting key subunits of thePP2A holoenzyme complex and MTAP, which have previously been under-explored inbreast cancer. The CNA-expression landscape also illuminates rare but potentiallysignificant events, including IGF1R, KRAS and EGFR amplifications and CDKN2B,BRCA2, RB1, ATM, SMAD4, NCOR1 and UTX homozygous deletions. Although some ofthese events have low overall frequencies (<1% patients) (Figs 2, Supplementary Fig. 15 andSupplementary Tables 22–24), they may have implications for understanding therapeuticresponses to targeted agents, particularly those targeting tyrosine kinases or phosphatases.
Finally, because the integrative subgroups occur at different frequencies in the overallpopulation, focusing sequencing efforts on representative numbers from these groups willhelp to establish a comprehensive breast cancer somatic landscape at sequence-levelresolution. For example, a significant number (~17%, n = 167 in the discovery cohort) ofbreast cancers are devoid of somatic CNAs, and are ripe for mutational profiling. Our workprovides a definitive framework for understanding how gene copy number aberrations affectgene expression in breast cancer and reveals novel subgroups that should be the target offuture investigation.
METHODS SUMMARYAll patient specimens were obtained with appropriate consent from the relevant institutionalreview board. DNA and RNA were isolated from samples and hybridized to the AffymetrixSNP 6.0 and Illumina HT-12 v3 platforms for genomic and transcriptional profiling,respectively. A detailed description of the experimental assays and analytical methods usedto analyse these data are available in the Supplementary Information.
Curtis et al. Page 7
Nature. Author manuscript; available in PMC 2012 December 21.
Europe PM
C Funders A
uthor Manuscripts
Europe PM
C Funders A
uthor Manuscripts
Supplementary MaterialRefer to Web version on PubMed Central for supplementary material.
AcknowledgmentsThe METABRIC project was funded by Cancer Research UK, the British Columbia Cancer Foundation andCanadian Breast Cancer Foundation BC/Yukon. The authors also acknowledge the support of the University ofCambridge, Hutchinson Whampoa, the NIHR Cambridge Biomedical Research Centre, the CambridgeExperimental Cancer Medicine Centre, the Centre for Translational Genomics (CTAG) Vancouver and the BCCABreast Cancer Outcomes Unit. S.P.S. is a Michael Smith Foundation for Health Research fellow. S.A. is supportedby a Canada Research Chair. This work was supported by the National Institutes of Health Centers of Excellence inGenomics Science grant P50 HG02790 (S.T.). The authors thank C. Perou and J.Parkerfor discussions on the use ofthe PAM50 centroids. Theyalso acknowledge the patients who donated tissue and the associated pseudo-anonymized clinical data for this project.
METABRIC GroupCo-chairs Carlos Caldas1,2, Samuel Aparicio3,4
Writing committee Christina Curtis1,2†, Sohrab P. Shah3,4, Carlos Caldas1,2, SamuelAparicio3,4
Steering committee James D. Brenton1,2, Ian Ellis5, David Huntsman3,4, Sarah Pinder6,Arnie Purushotham6, Leigh Murphy7, Carlos Caldas1,2, Samuel Aparicio3,4
Tissue and clinical data source sites: University of Cambridge/Cancer Research UKCambridge Research Institute Carlos Caldas (Principal Investigator)1,2; Helen Bardwell2,Suet-Feung Chin1,2, Christina Curtis1,2†, Zhihao Ding2, Stefan Gräf1,2, Linda Jones8, BinLiu1,2, Andy G. Lynch1,2, Irene Papatheodorou1,2, Stephen J. Sammut9, Gordon Wishart9;British Columbia Cancer Agency Samuel Aparicio (Principal Investigator)3,4, StevenChia4, Karen Gelmon4, David Huntsman3,4, Steven McKinney3,4, Caroline Speers4, GulisaTurashvili3,4, Peter Watson3,4,7; University of Nottingham: Ian Ellis (PrincipalInvestigator)5, Roger Blamey5, Andrew Green5, Douglas Macmillan5, Emad Rakha5;King’s College London Arnie Purushotham (Principal Investigator)6, Cheryl Gillett6, AnitaGrigoriadis6, Sarah Pinder6, Emanuele de Rinaldis6, Andy Tutt6; Manitoba Institute ofCell Biology Leigh Murphy (Principal Investigator)7, Michelle Parisien7, Sandra Troup7
Cancer genome/transcriptome characterization centres: University of Cambridge/Cancer Research UK Cambridge Research Institute Carlos Caldas (PrincipalInvestigator)1,2, Suet-Feung Chin (Team Leader)1,2, Derek Chan1, Claire Fielding2, Ana-Teresa Maia1,2, Sarah McGuire2, Michelle Osborne2, Sara M. Sayalero2, InmaculadaSpiteri2, James Hadfield2; British Columbia Cancer Agency Samuel Aparicio (PrincipalInvestigator)3,4, Gulisa Turashvili (Team Leader)3,4, Lynda Bell4, Katie Chow4, NadiaGale4, David Huntsman3,4, Maria Kovalik4, Ying Ng4, Leah Prentice4
Data analysis subgroup: University of Cambridge/Cancer Research UK CambridgeResearch Institute Carlos Caldas (Principal Investigator)1,2, Simon Tavaré (PrincipalInvestigator)1,2,10,11, Christina Curtis (Team Leader)1,2†, Mark J. Dunning2, Stefan Gräf1,2,Andy G. Lynch1,2, Oscar M. Rueda1,2, Roslin Russell2, Shamith Samarajiwa1,2, DougSpeed2,10; Florian Markowetz (Principal Investigator)1,2, Yinyin Yuan1,2; James D. Brenton(Principal Investigator)1,2; British Columbia Cancer Agency Samuel Aparicio (PrincipalInvestigator)3,4, Sohrab P. Shah (Team Leader)3,4, Ali Bashashati3, Gavin Ha3, GholamrezaHaffari3 & Steven McKinney3,4
Curtis et al. Page 8
Nature. Author manuscript; available in PMC 2012 December 21.
Europe PM
C Funders A
uthor Manuscripts
Europe PM
C Funders A
uthor Manuscripts

1Department of Oncology, University of Cambridge, Hills Road, Cambridge CB2 2XZ,UK. 2Cancer Research UK, Cambridge Research Institute, Li Ka Shing Centre, RobinsonWay, Cambridge CB2 0RE, UK. 3Department of Pathology and Laboratory Medicine,University of British Columbia, Vancouver, British Columbia V6T 2B5,Canada. 4Molecular Oncology, British Columbia Cancer Research Centre, Vancouver,British Columbia V5Z 1L3, Canada. 5Department of Histopathology, School of MolecularMedical Sciences, University of Nottingham, Nottingham NG5 1PB, UK. 6King’s CollegeLondon, Breakthrough Breast Cancer Research Unit, London, WC2R 2LS, UK. 7ManitobaInstitute of Cell Biology, University of Manitoba, Manitoba R3E 0V9, Canada. 8CambridgeExperimental Cancer Medicine Centre, Cambridge CB2 0RE, UK. 9Cambridge Breast Unit,Addenbrooke’s Hospital, Cambridge University Hospital NHS Foundation Trust and NIHRCambridge Biomedical Research Centre, Cambridge CB2 2QQ, UK. 10Department ofApplied Mathematics and Theoretical Physics, University of Cambridge, Centre forMathematical Sciences, Cambridge CB3 0WA, UK. 11Molecular and ComputationalBiology Program, University of Southern California, Los Angeles, California 90089, USA.†Present address: Department of Preventive Medicine, Keck School of Medicine, Universityof Southern California, Los Angeles, California 90033, USA.
References1. Leary RJ, et al. Integrated analysis of homozygous deletions, focal amplifications, and sequence
alterations in breast and colorectal cancers. Proc. Natl Acad. Sci. USA. 2008; 105:16224–16229.[PubMed: 18852474]
2. Bignell GR, et al. Signatures of mutation and selection in the cancer genome. Nature. 2010;463:893–898. [PubMed: 20164919]
3. Perou CM, et al. Molecular portraits of human breast tumours. Nature. 2000; 406:747–752.[PubMed: 10963602]
4. Sørlie T, et al. Gene expression patterns of breast carcinomas distinguish tumor subclasses withclinical implications. Proc. Natl Acad. Sci. USA. 2001; 98:10869–10874. [PubMed: 11553815]
5. Chin K, et al. Genomic and transcriptional aberrations linked to breast cancer pathophysiologies.Cancer Cell. 2006; 10:529–541. [PubMed: 17157792]
6. Chin SF, et al. High-resolution aCGH and expression profiling identifies a novel genomic subtypeof ER negative breast cancer. Genome Biol. 2007; 8:R215. [PubMed: 17925008]
7. Parker JS, et al. Supervised risk predictor of breast cancer based on intrinsic subtypes. J. Clin.Oncol. 2009; 27:1160–1167. [PubMed: 19204204]
8. Stranger BE, et al. Genome-wide associations of gene expression variation in humans. PLoS Genet.2005; 1:e78. [PubMed: 16362079]
9. Gilad Y, Rifkin SA, Pritchard JK. Revealing the architecture of gene regulation: the promise ofeQTL studies. Trends Genet. 2008; 24:408–415. [PubMed: 18597885]
10. Teschendorff AE, Naderi A, Barbosa-Morais NL, Caldas C. PACK: Profile analysis usingclustering and kurtosis to find molecular classifiers in cancer. Bioinformatics. 2006; 22:2269–2275. [PubMed: 16682424]
11. Holland D, et al. ZNF703 is a common Luminal B breast cancer oncogene that differentiallyregulates luminal and basal progenitors in human mammary epithelium. EMBO Mol. Med. 2011;3:167–180. [PubMed: 21337521]
12. Li J, et al. PTEN, a putative protein tyrosine phosphatase gene mutated in human brain, breast, andprostate cancer. Science. 1997; 275:1943–1947. [PubMed: 9072974]
13. Santarius T, Shiply J, Brewer D, Stratton MR, Cooper CS. A census of amplified andoverexpressed human cancer genes. Nature Rev. Cancer. 2010; 10:59–64. [PubMed: 20029424]
14. Jones S, et al. Frequent mutations of chromatin remodeling gene ARID1A in ovarian clear cellcarcinoma. Science. 2010; 330:228–231. [PubMed: 20826764]
15. McConechy MK, et al. Subtype-specific mutation of PPP2R1A in endometrial and ovariancarcinomas. J. Pathol. 2011; 223:567–573. [PubMed: 21381030]
Curtis et al. Page 9
Nature. Author manuscript; available in PMC 2012 December 21.
Europe PM
C Funders A
uthor Manuscripts
Europe PM
C Funders A
uthor Manuscripts
16. Tan J, et al. B55β-associated PP2A complex controls PDK1-directed MYC signaling andmodulates rapamycin sensitivity incolorectal cancer. Cancer Cell. 2010; 18:459–471. [PubMed:21075311]
17. Christopher SA, Diegelman P, Porter CW, Kruger WD. Methylthioadenosine phosphorylase, agene frequently codeleted with p16 (CDKN2A/ARF), acts as a tumor suppressor in a breast cancercell line. Cancer Res. 2002; 62:6639–6644. [PubMed: 12438261]
18. Teng DH, et al. Human mitogen-activated protein kinase kinase 4 as a candidate tumor suppressor.Cancer Res. 1997; 57:4177–4182. [PubMed: 9331070]
19. Hollestelle A, et al. Distinct gene mutation profiles among luminal-type and basal-type breastcancer cell lines. Breast Cancer Res. Treat. 2010; 121:53–64. [PubMed: 19593635]
20. Shen R, Olshen AB, Ladanyi M. Integrative clustering of multiple genomic data types using a jointlatent variable model with application to breast and lung cancer subtype analysis. Bioinformatics.2009; 25:2906–2912. [PubMed: 19759197]
21. Tibshirani R, Hastie T, Narasimhan B, Chu G. Diagnosis of multiple cancer types by shrunkencentroids of gene expression. Proc. Natl Acad. Sci. USA. 2002; 99:6567–6572. [PubMed:12011421]
22. Kapp AV, Tibshirani R. Are clusters found in one dataset present in another dataset? Biostatistics.2007; 8:9–31. [PubMed: 16613834]
23. Hughes-Davies L, et al. EMSY links the BRCA2 pathway to sporadic breast and ovarian cancer.Cell. 2003; 115:523–535. [PubMed: 14651845]
24. Brown LA, et al. Amplification of 11q13 in ovarian carcinoma. Genes Chromosom. Cancer. 2008;47:481–489. [PubMed: 18314909]
25. Russnes HG, et al. Genomic architecture characterizes tumor progression paths and fate in breastcancer patients. Sci. Transl. Med. 2010; 2:38ra47.
26. Blows FM, et al. Subtyping of breast cancer by immunohistochemistry to investigate a relationshipbetween subtype and short and long term survival: a collaborative analysis of data for 10,159 casesfrom 12 studies. PLoS Med. 2010; 7:e1000279. [PubMed: 20520800]
27. Mahmoud SMA, et al. Tumor-infiltrating CD8+ lymphocytes predict clinical outcome in breastcancer. J. Clin. Oncol. 2011; 29:1949–1955. [PubMed: 21483002]
28. Daniel J, Coulter J, Woo J-H, Wilsbach K, Gabrielson E. High levels of the Mps1 checkpointprotein are protective of aneuploidy in breast cancer cells. Proc. Natl Acad. Sci. USA. 2011;108:5384–5389. [PubMed: 21402910]
29. Chen Y, et al. Variations in DNA elucidate molecular networks that cause disease. Nature. 2008;452:429–435. [PubMed: 18344982]
Curtis et al. Page 10
Nature. Author manuscript; available in PMC 2012 December 21.
Europe PM
C Funders A
uthor Manuscripts
Europe PM
C Funders A
uthor Manuscripts
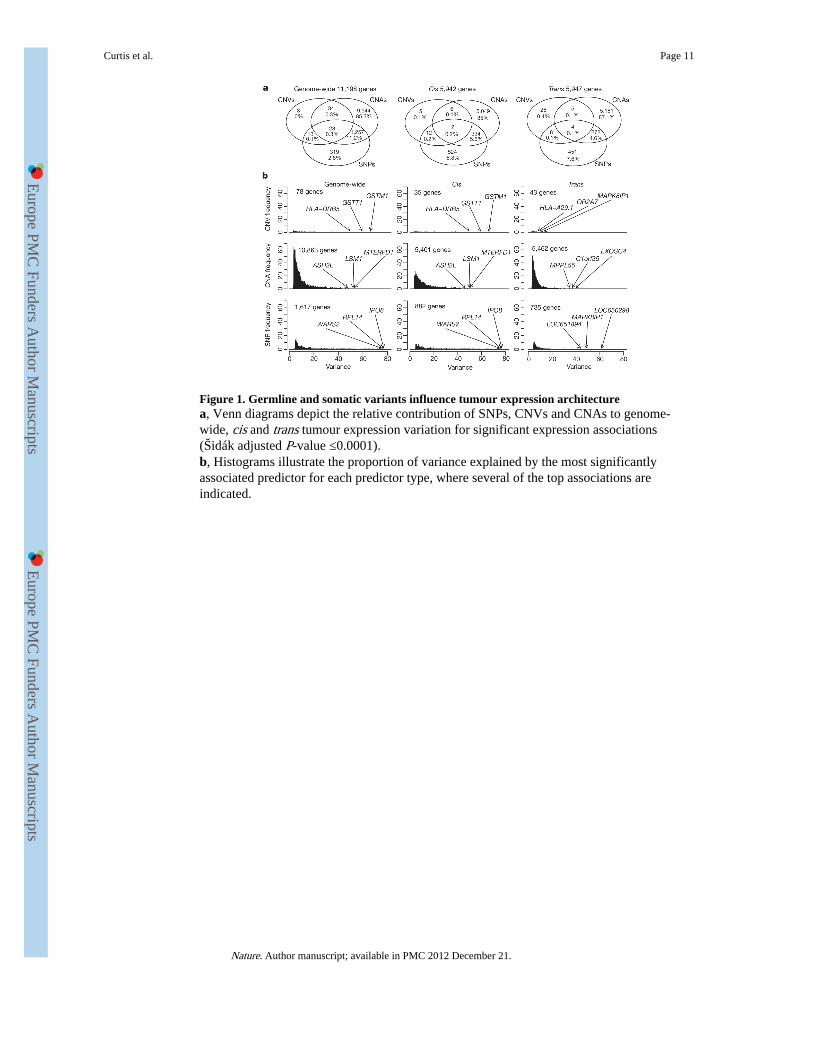
Figure 1. Germline and somatic variants influence tumour expression architecturea, Venn diagrams depict the relative contribution of SNPs, CNVs and CNAs to genome-wide, cis and trans tumour expression variation for significant expression associations(Šidák adjusted P-value ≤0.0001).b, Histograms illustrate the proportion of variance explained by the most significantlyassociated predictor for each predictor type, where several of the top associations areindicated.
Curtis et al. Page 11
Nature. Author manuscript; available in PMC 2012 December 21.
Europe PM
C Funders A
uthor Manuscripts
Europe PM
C Funders A
uthor Manuscripts
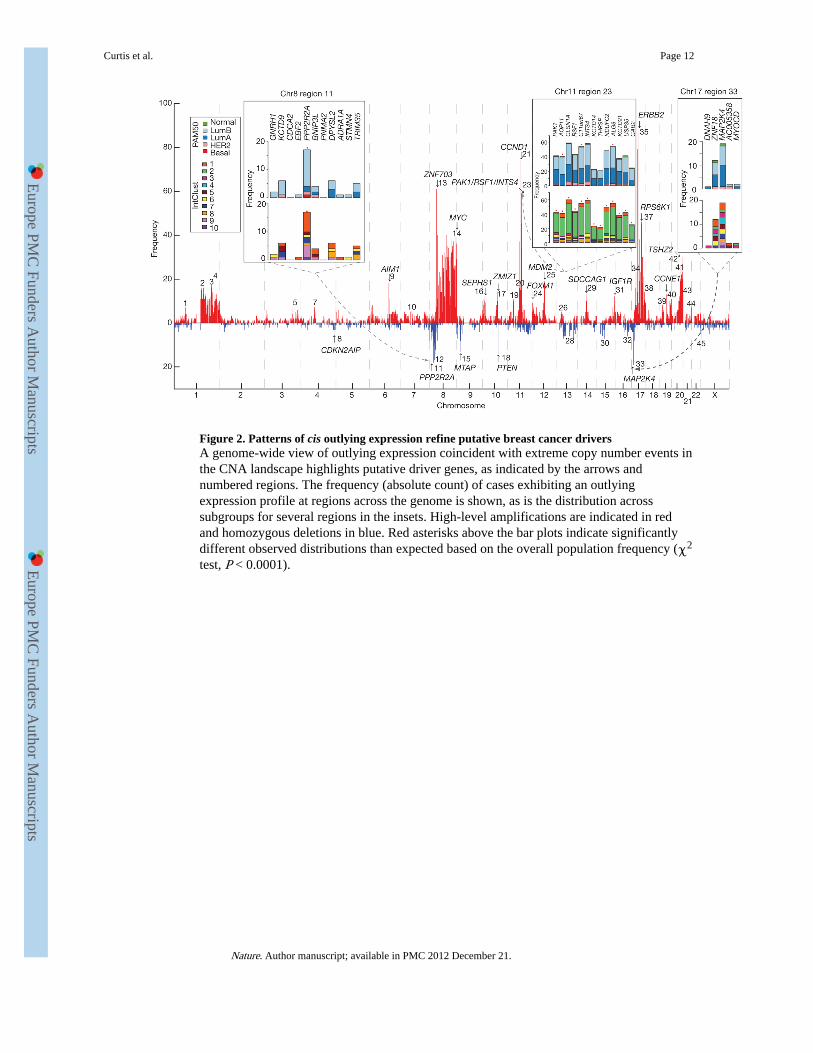
Figure 2. Patterns of cis outlying expression refine putative breast cancer driversA genome-wide view of outlying expression coincident with extreme copy number events inthe CNA landscape highlights putative driver genes, as indicated by the arrows andnumbered regions. The frequency (absolute count) of cases exhibiting an outlyingexpression profile at regions across the genome is shown, as is the distribution acrosssubgroups for several regions in the insets. High-level amplifications are indicated in redand homozygous deletions in blue. Red asterisks above the bar plots indicate significantlydifferent observed distributions than expected based on the overall population frequency (χ2
test, P < 0.0001).
Curtis et al. Page 12
Nature. Author manuscript; available in PMC 2012 December 21.
Europe PM
C Funders A
uthor Manuscripts
Europe PM
C Funders A
uthor Manuscripts
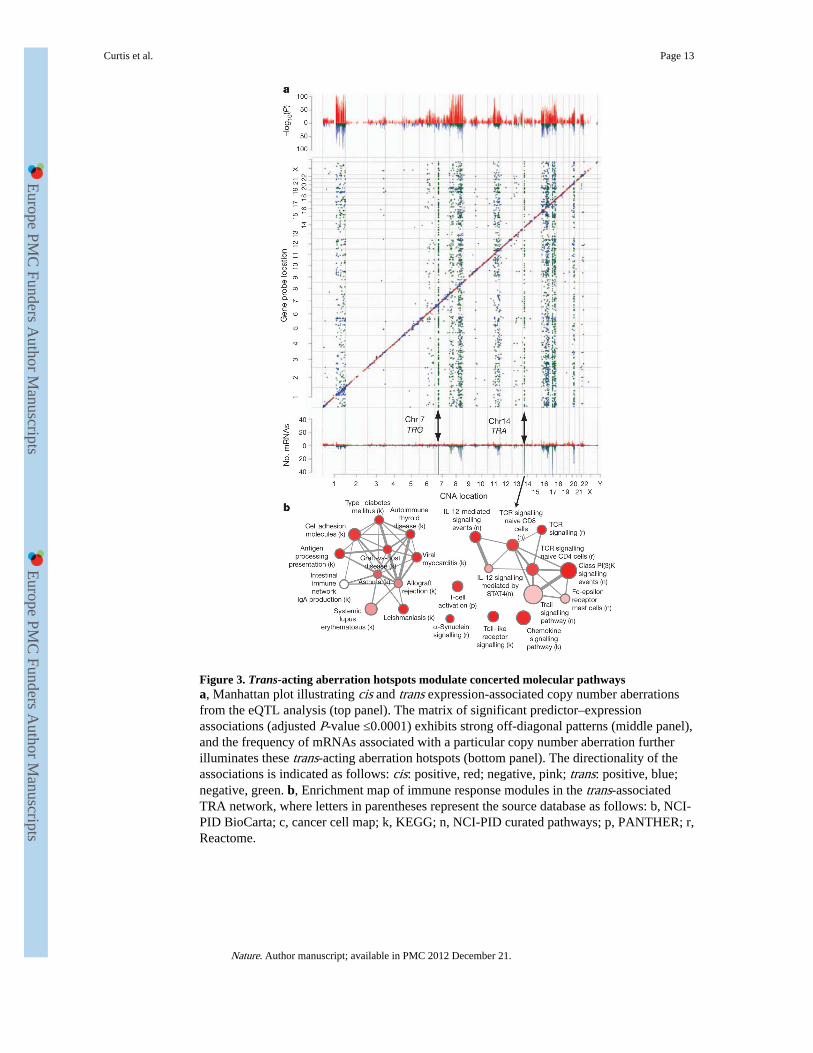
Figure 3. Trans-acting aberration hotspots modulate concerted molecular pathwaysa, Manhattan plot illustrating cis and trans expression-associated copy number aberrationsfrom the eQTL analysis (top panel). The matrix of significant predictor–expressionassociations (adjusted P-value ≤0.0001) exhibits strong off-diagonal patterns (middle panel),and the frequency of mRNAs associated with a particular copy number aberration furtherilluminates these trans-acting aberration hotspots (bottom panel). The directionality of theassociations is indicated as follows: cis: positive, red; negative, pink; trans: positive, blue;negative, green. b, Enrichment map of immune response modules in the trans-associatedTRA network, where letters in parentheses represent the source database as follows: b, NCI-PID BioCarta; c, cancer cell map; k, KEGG; n, NCI-PID curated pathways; p, PANTHER; r,Reactome.
Curtis et al. Page 13
Nature. Author manuscript; available in PMC 2012 December 21.
Europe PM
C Funders A
uthor Manuscripts
Europe PM
C Funders A
uthor Manuscripts
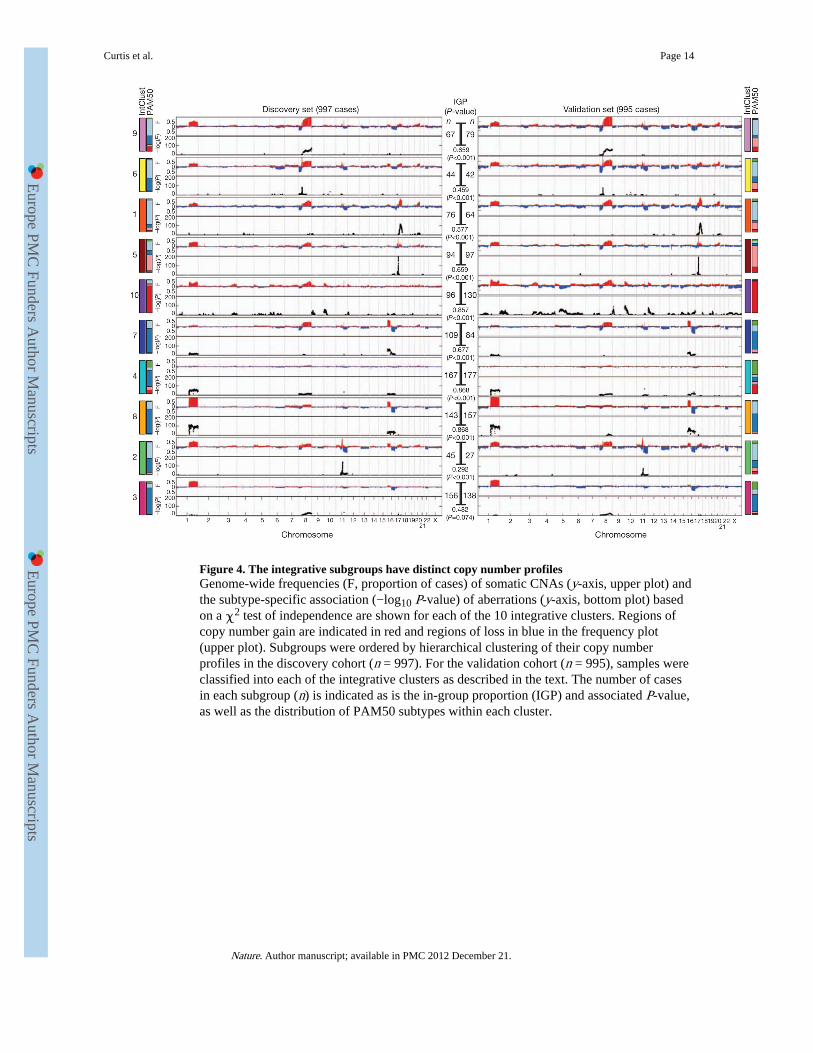
Figure 4. The integrative subgroups have distinct copy number profilesGenome-wide frequencies (F, proportion of cases) of somatic CNAs (y-axis, upper plot) andthe subtype-specific association (−log10 P-value) of aberrations (y-axis, bottom plot) basedon a χ2 test of independence are shown for each of the 10 integrative clusters. Regions ofcopy number gain are indicated in red and regions of loss in blue in the frequency plot(upper plot). Subgroups were ordered by hierarchical clustering of their copy numberprofiles in the discovery cohort (n = 997). For the validation cohort (n = 995), samples wereclassified into each of the integrative clusters as described in the text. The number of casesin each subgroup (n) is indicated as is the in-group proportion (IGP) and associated P-value,as well as the distribution of PAM50 subtypes within each cluster.
Curtis et al. Page 14
Nature. Author manuscript; available in PMC 2012 December 21.
Europe PM
C Funders A
uthor Manuscripts
Europe PM
C Funders A
uthor Manuscripts
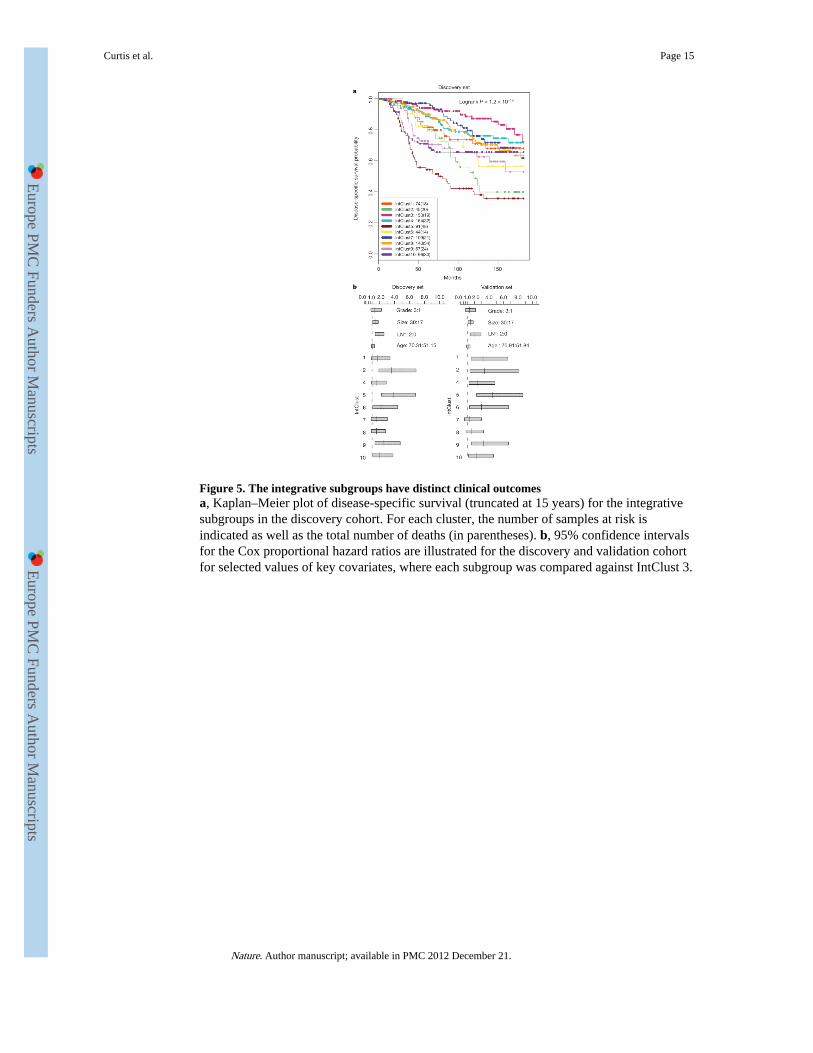
Figure 5. The integrative subgroups have distinct clinical outcomesa, Kaplan–Meier plot of disease-specific survival (truncated at 15 years) for the integrativesubgroups in the discovery cohort. For each cluster, the number of samples at risk isindicated as well as the total number of deaths (in parentheses). b, 95% confidence intervalsfor the Cox proportional hazard ratios are illustrated for the discovery and validation cohortfor selected values of key covariates, where each subgroup was compared against IntClust 3.
Curtis et al. Page 15
Nature. Author manuscript; available in PMC 2012 December 21.
Europe PM
C Funders A
uthor Manuscripts
Europe PM
C Funders A
uthor Manuscripts