13th jacques polak annual research conference … · counting the same unemployment reduction spell...
TRANSCRIPT

Employment Miracles
Caroline Freund The World Bank
Bob Rijkers
The World Bank
Paper presented at the 13th Jacques Polak Annual Research Conference Hosted by the International Monetary Fund Washington, DC─November 8–9, 2012 The views expressed in this paper are those of the author(s) only, and the presence
of them, or of links to them, on the IMF website does not imply that the IMF, its Executive Board, or its management endorses or shares the views expressed in the paper.
1133TTHH JJAACCQQUUEESS PPOOLLAAKK AANNNNUUAALL RREESSEEAARRCCHH CCOONNFFEERREENNCCEE NNOOVVEEMMBBEERR 88––99,, 22001122

1
Employment Miracles October 10, 2012
Caroline Freund Bob Rijkers
Abstract: How can policymakers engineer enduring reductions in unemployment? This paper addresses this question by documenting the incidence and determinants of employment miracles, defined as swift, substantial, and sustained reductions in unemployment. We identify 43 employment miracles over a period of nearly 3 decades in 94 countries. Employment miracles often coincide with an acceleration of growth and an improvement in macroeconomic conditions. Miracles are much more prevalent in countries with higher levels of unemployment and, ceteris paribus, more likely in countries with better regulation. An efficient legal system that enforces contracts expeditiously is a particularly important enabler of employment growth.
Key words: unemployment, governance, labor markets, labor demand, regulation
JEL codes: J23, J64, J65, K20, L20
Disclaimer: The views expressed here are those of the authors and do not necessarily represent the views of the World Bank, its Executive Board or member countries. We would like to thank Davide Furceri, John Giles, David Newhouse, Luis Serven, seminar participants at the World Bank, the IMF and the University of Oxford, and especially Aart Kraay for constructive comments. All errors are our own.
2
1 Introduction
Job creation is arguably the most pressing policy priority across the globe today. Despite a rich
literature on the determinants of unemployment and a lively debate on the intricate relationship
between labor market institutions and economic performance,1 defining a set of policies to engineer
enduring unemployment reductions remains elusive.
Rather than postulating a structural model of employment and its dynamics, this paper
adopts an empirical approach that tackles this question head on by first examining the incidence, and
subsequently the determinants of employment miracles, defined as swift, substantial and sustained
drops in unemployment. More specifically, an employment miracle is defined as an episode of
unemployment reduction over a four year period of at least three percentage points and at least a
quarter of its initial level that persists for a minimum of three years. In addition, we insist that
miracles start with a strict decline in unemployment and rule out overlap between them to avoid
counting the same unemployment reduction spell as two separate episodes.
Although employment miracles are difficult to predict ex ante, they are quite common, and
significantly more likely to occur in countries with better regulation ceteris paribus. This result
obtains using various alternative indicators of regulatory quality, and is robust to using alternative
definitions of the filter used to identify miracles, alternative parameterizations of the filter,
alternative estimation methods, and excluding miracles that are potentially driven by recovery from
war or crisis. The results are also confirmed by Bayesian Model Averaging methods, which
furthermore suggest that the efficacy of the legal system, enforcement of property rights, the control
of corruption and business regulations are particularly important enablers of employment creation.
When they happen, miracles tend to coincide with an acceleration of GDP growth, often
entailing a reversal of fortune, as well as a surge in trade, higher investment, and lower government
spending as a share of GDP. The regulatory environment also tends to improve during miracles.
Although causation is difficult to establish, the coincidence of miracles with improving
macroeconomic conditions is consistent with prudent macroeconomic management being
conducive to employment creation.
1 See, for example, Bentolila and Bertola, 1991, Layard et al., 1991, Nickell et al. 2005, Nickel and Layard, 1999, and Blanchard and Wolfers, 2000.
3
The results have additional implications for policymakers facing high unemployment and
seeking to reduce it. Sound regulation is associated with a double-dividend; countries with better
regulation not only tend to have lower unemployment on average, but are also more likely to
experience an employment miracle when confronted with stints of high unemployment. The
importance of an impartial legal system, secure property rights, and efficient contract enforcement
alongside lean regulation underscores the importance of implementation; creating an enabling
business environment is not simply about getting the rules right, but also about enforcing them.
This paper contributes to several strands of literature. A voluminous body of research
examines the (cross-country) determinants of unemployment, focusing on the role of institutions,
shocks, and crucially, the interaction between them as explanations for differences in the evolution
of unemployment across countries (Blanchard and Wolfers, 2005, Nickell, 1995, 1997).2 Which
institutions matter most (and how they interact) remains an open empirical question, yet their
importance in modulating how macroeconomic shocks reverberate through labor markets is well-
established. This paper aims to contribute to that literature by analyzing large and sustained declines
in unemployment, focusing on their potential drivers and how they start. In doing so, we help
differentiate between the drivers of secular changes in employment and those of cyclical labor
adjustment (see also Dunne et al., 1998). In the process, we also provide evidence on the
relationship between growth and employment creation. Moreover, by highlighting the association
between sound regulation, consistent implementation and employment creation, our results also
dovetail with the growing literature on their importance for development outcomes.3
The remainder of this paper is organized as follows; the next section explains how miracles
are identified. Section three examines the incidence, and correlates of, employment miracles, and
section four assesses to what extent employment miracles can be predicted, and provides evidence
2 A parallel literature uses micro-level data to examine firms’ factor adjustment (see e.g. Hammermesh and Pfann, 1996, and Bond and van Reenen, 2007) and how such adjustments affect aggregate labor market dynamics (Cooper et al., 2004, Caballero et al, 1997). 3 More cumbersome regulation can be damaging either because it is captured by incumbents or because it creates rent-seeking opportunities for government officials that are tasked with enforcing it. In either case, it hampers competition and impedes development. For example, De Soto (1990) shows that the economy of Peru, in the absence of property rights and well functioning legal systems, veered toward informality, creating many small producers that were not able to expand because they did not have legal rights to their property. As another example, Djankov et al (2002) show that more arduous entry regulation is associated with more corruption and informality across countries, as opposed to better quality products and improved competition as its proponents advocate. In follow-up work, Djankov et al (2008) also highlight the important of enforcement, by demonstrating that transparent contract enforcement is instrumental in preventing self-dealing—where agents exploit power to maintain excess share of profits, thus retarding investment and growth.
4
of a robust association between the quality of the overall regulatory framework and the incidence of
miracles. Section five examines which aspects of the regulatory framework matter most. Section six
concludes.
2 Identification and Incidence of Employment miracles
2.1 Identification: Parameters of the Filter
Following Hausmann et al. (2005) on growth accelerations and Freund (2005) on current account
reversals, we use an event study approach. We define an employment miracle to be a substantial
reduction of unemployment that is sustained for a protracted period of time and rule out overlap
between miracles. Specifically, a decline in the unemployment rate starting at period t qualifies as an
employment miracle if the following conditions are satisfied:4
(i) Unemployment declines at least 3 percentage points over a 4 year period
(ii) The decline in unemployment over this 4 year period is at least 25% of total initial
unemployment.
(iii) The drop in unemployment must remain below the critical unemployment reduction
thresholds for at least another 3 years.
(iv) Unemployment strictly declines in the first year of the miracle.
(v) An employment miracle did not commence in the previous 7 years (e.g. in the previous 7
years there was no year in which conditions i, ii, iii and iv were simultaneously met that
was not itself preceded by the onset of an employment miracle in the previous 7 years);
employment miracles are not contiguous.
Conditions i and ii ensure that the decline in unemployment is substantial. While any cutoff is
arbitrary, a decline of 3 percentage points over a four year period is crudely equivalent to a standard
deviation away from the mean 4 year change in unemployment. Condition ii ensures that the
treshold for an employment miracle is higher for countries with higher levels of unemployment; for
4 We also implemented two additional conditions, notably that unemployment declines were not driven by a single outlier alone, and that unemployment during the miracle was always strictly lower than unemployment at the onset of the miracle, but these conditions were not binding, in the sense that they were always satisfied when the other conditions were satisfied.
5
example, in a country with 40% initial unemployment, it needs to reduce by at least 10 percentage
points for that reduction to qualify as a miracle, whereas a country with an initial unemployment of
20% requires a reduction in unemployment of 5 percentage points or more. Also note that, by
construction, countries with lower than 3% initial unemployment cannot experience a miracle.
Condition iii requires that the decline in unemployment is sustained for at least three years, and does
not merely reflect cyclical fluctuations. Condition iv ensures that employment miracles commence
with a decline in unemployment, and condition v rules out counting the same unemployment
reduction spell as two separate miracles.
One potential concern is that unemployment could decline due to falling labor market
participation. We choose to focus on declines in unemployment, as opposed to increases in
employment as a share of working age population since participation can fall as countries become
richer, as more people of working age attend high school and university, retire prematurely.5 Still, to
control for this possibility, we also report results including only episodes where labor force
participation remains constant or increases and results remain robust.
The World Bank’s World Development Indicators 1980-2008 are our primary data-source; the
earliest year for which the onset of an employment miracle can be identified is 1980, whereas the last
year is 2001. In case information on unemployment is missing for one year, it is imputed using the
average of the unemployment rates in the preceding and the subsequent years for the purpose of
identifying miracles, but not in the subsequent analysis. Countries for which we do not have at least
8 consecutive annual observations on unemployment after imputing it are excluded. These
restrictions reduce the sample to 94 countries. Arguably as a result of lower labor market monitoring
capacity in poor countries, there are no low-income countries in our sample, only five countries
from Sub-Saharan Africa and merely two from South Asia. Thus, our results are most relevant for
middle income and industrialized countries.
2.2 Incidence
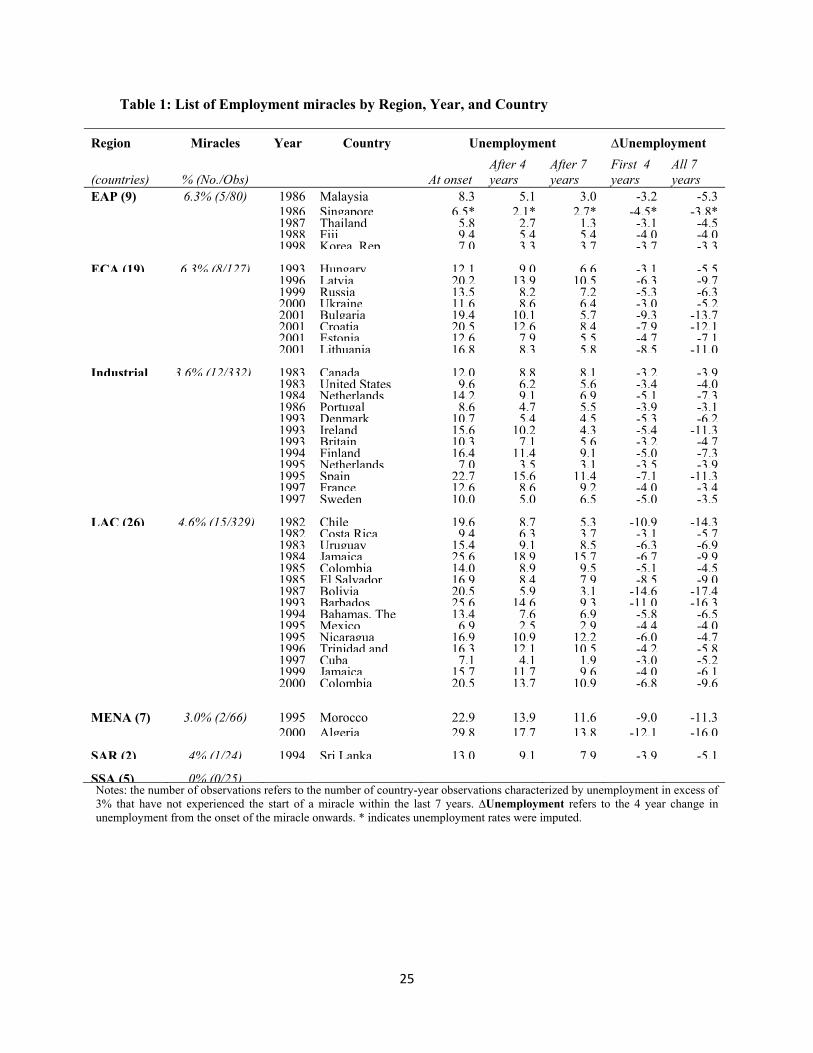
Miracles are prevalent, as is demonstrated by Table 1 which lists all 43 miracles that we identify by
region, country and year; almost half of all the countries in our sample (40 out of 94) have
5 In addition, employment to population ratios, typically measured as the population over the age of 15 (or 25) that is employed, are potentially (more) impacted by changing demographics (then unemployment rates are), such as those due to increases in life expectancy.
6
experienced at least one miracle. To arrive at the (unconditional) probability of experiencing an
employment miracle, we follow Hausmann et al. (2005) and divide the total number of miracles by
the total number of country-years for which an employment miracle could have been identified. The
latter is calculated by the total number of country-observations eliminating the 7-year window after
the onset of a miracle, since in this period employment miracles are not allowed to initiate by
construction. On average, each year, approximately one in 20 countries which are not in a miracle
already embark on an employment miracle.
Aside from the sheer number of miracles, the magnitude of the associated decline in
unemployment is striking; unemployment declines from an initial average of 14.5% to 8.8% and
then to 7.1% 4 and 7 years after the onset of the miracle respectively. Thus, at the end of the miracle
average unemployment was less than half of its initial value.
<TABLE 1: LIST OF EMPLOYMENT MIRACLES ABOUT HERE>
Leaving aside regions where we have very few observations, notably Sub-Saharan Africa and
South Asia, Table 1 demonstrates that the incidence of miracles does not vary dramatically across
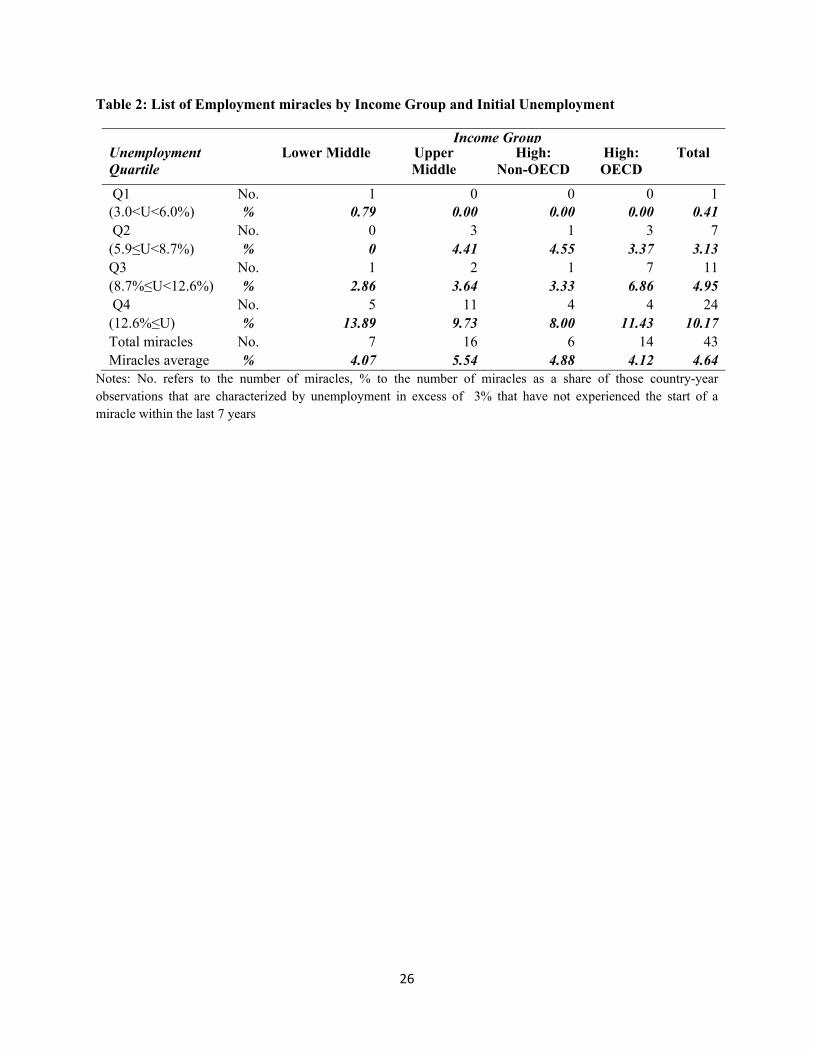
regions. Their incidence also does not vary strongly across income groups, yet appears to be
increasing with the initial level of unemployment as is indicated by Table 2, which lists the incidence
of employment miracles by initial unemployment quartile and income group. Only one country,
Thailand, in the lowest unemployment quartile experienced a miracle. This is perhaps not a surprise
once one considers that even supposedly well-functioning labor markets suffer some friction
unemployment (Blanchard and Katz, 1997). For example, the natural rate of unemployment in the
U.S., which arguably has one of world’s most flexible labor markets, has recently been estimated to
be in the range of 5.6 to 6.9% (Daly et al., 2011, forthcoming). In what follows, we exclude
observations with unemployment lower than 6% unemployment from the analysis for this reason.6
<TABLE 2: PREVALENCE BY LEVEL OF UNEMPLOYMENT AND INCOME>
The choice of parameters for the filter used to identify miracles is inevitably somewhat arbitrary.
For example, increasing the tresholds for unemployment declines by 10% and 20% reduces the 6 Nonetheless, in section 4.2 we will show that our main results are robust to including them.
7
number of miracles to 36 and 26, respectively.7 Conversely, relaxing the tresholds by 10% and 20%
increases the number of miracles to 49 and 54, respectively. As another example, adopting a more
stringent definition of sustainability by requiring that unemployment 7 years after the onset of the
miracle cannot be higher than its level 4 years after onset (that is, not allowing for rebounding of
unemployment in this period) reduces the number of miracles to 34. Ruling out the possibility that
employment miracles are driven by declines in labor force participation by insisting that the labor
force participation rate four years after the onset of the miracle is at least as high as at the beginning
of the miracle leaves 33 miracles. In section 4.2 it is shown that adopting these and other alternative
parameterizations of the filter does not alter the qualitative pattern of results.
3 Correlates and Antecedents of Miracles
Now that we have defined and identified miracles, we next characterize them by the evolution of
macro- and institutional variables.
3.1 Initial Conditions
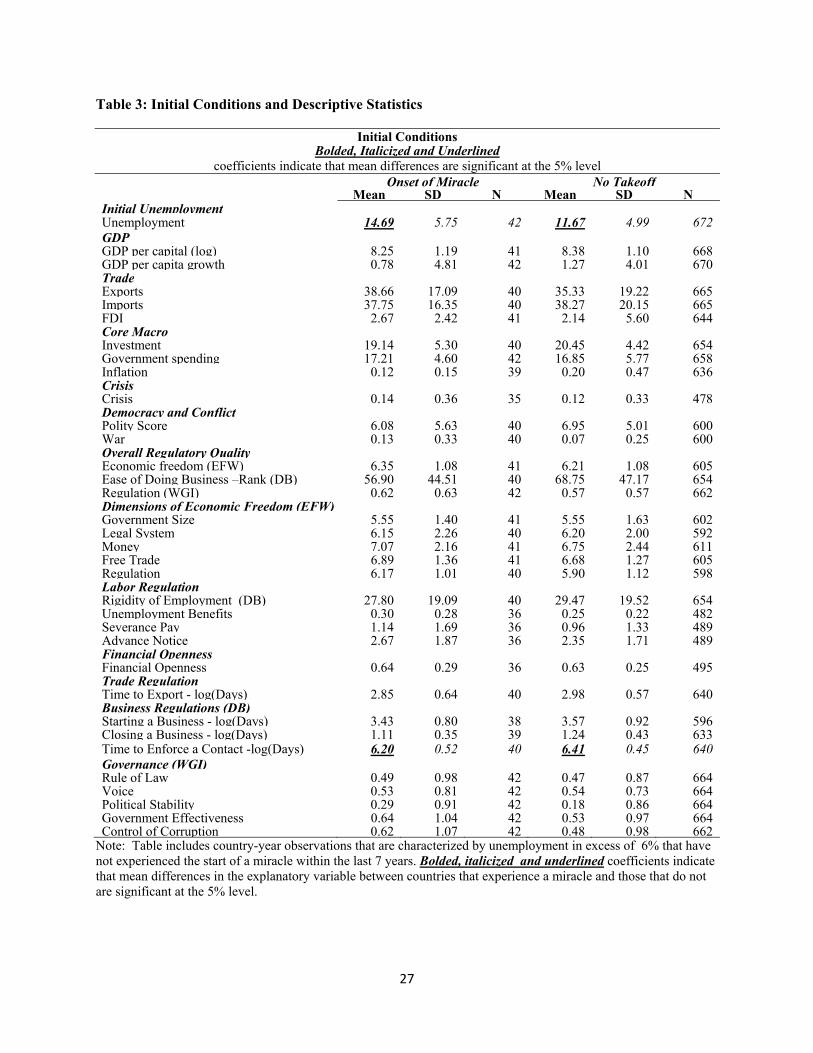
Table 3 presents descriptive statistics on initial conditions at the time of onset of a miracles
(columns 1) and compares those with the conditions prevailing in countries that are not currently in
a miracle and in which no miracle takes off (column 2).8 Bolded, italicized and underlined
coefficients in the table indicate that differences in initial conditions are statistically significant at the
5% level.
<TABLE 3: INITIAL CONDITIONS>
Consistent with the results demonstrated in Table 2, countries that witness miracles have
significantly higher initial unemployment, notably 14.7% on average, than countries in which
7 A 10% (20%) higher treshhold implies that unemployment should decrease by at least 3.3% (3.6%) and 27.5% (30%) of its initial value over the initial four year period. Conversely, a 10% (20%) lower tresholds implies that unemployment should decrease by at least 2.7% (2.4%) and 22.5% (20%) of its initial level during the four years after the onset of the miracle. 8 Note that we have excluded from the sample country-year observations for which identification of a miracle is not possible given data limitations.

8
miracles do not occur, with average unemployment at 11.6%. These numbers may seem high, but
recall that we have confined the sample to country-year observations experiencing unemployment
levels of at least 6%.
In spite of this differential in average initial unemployment, countries embarking on miracles
are remarkably similar to those that do not in other macroeconomic domains;9 they neither have
significantly different initial GDP levels, nor record significantly different growth rates at the time of
onset. They also do not have a significantly higher propensity to export, import and to receive FDI
inflows. Moreover, they do not differ from those that do not embark on miracles in terms of
average inflation and government spending as a share of GDP. In addition, they are not significantly
more or less democratic on average.
Countries that embark on miracles also do not score higher on indicators of the overall
regulatory framework. Our preferred proxy for overall regulatory quality is the economic freedom
index of the Fraser Institute, as it is time-varying. Since this indicator and its subcomponents are
only available every 5 years from 1980 until 2010, we linearly interpolate scores for the intervening
years. No statistically significant differences between countries that embark on miracles and ones
that do not are detected in any of the sub-components or the aggregate index itself.
We complement these broad indicators with specific indicators of labor regulation and
financial openness from the IMF, as well as with data on governance and regulation from the World
Worldwide Governance Indicators (Kaufmann et al., 2010) and the Doing Business Indicators. Since these last
two datasets are only available from 1996 and 2004 onwards, respectively, we follow Collier and
Goderis (2008) and extrapolate them backwards for years in which they were not available. Note
that this procedure implicitly assumes that these policies do not over time, whereas in reality they
may well have changed in response to (the absence of) miracles. In other words, they are potentially
endogenous. Collier and Goderis (2008), however, argue that because these indicators tend to
capture structural policies that change only slowly over time, the magnitude of potential endogeneity
bias is likely limited. Bearing in mind this caveat, table 3 suggests that countries embarking on
miracles are not characterized by more flexible labor laws, greater financial openness, a policy
environment especially conducive to trade, or superior governance. However, they are characterized
9 We also examined differences in average debt, savings, real interest rates, and the terms of trade, yet did not find any statistically significant differences in these either. Results are omitted to conserve space, but available from the authors upon request.

9
by expedited enforcement of contracts, which, on average, takes roughly 23% longer in countries
that do not embark on miracles.
Overall, the descriptive statistics suggest that countries embarking on miracles are not
dramatically different in terms of initial conditions, except for their business regulations and their
initial level of unemployment.
3.2 The Evolution of Key Explanatory Variables
Examining the evolution of key explanatory variables sheds light on the likely drivers of
miracles, which is important in view of the stark similarity in initial conditions reported in the
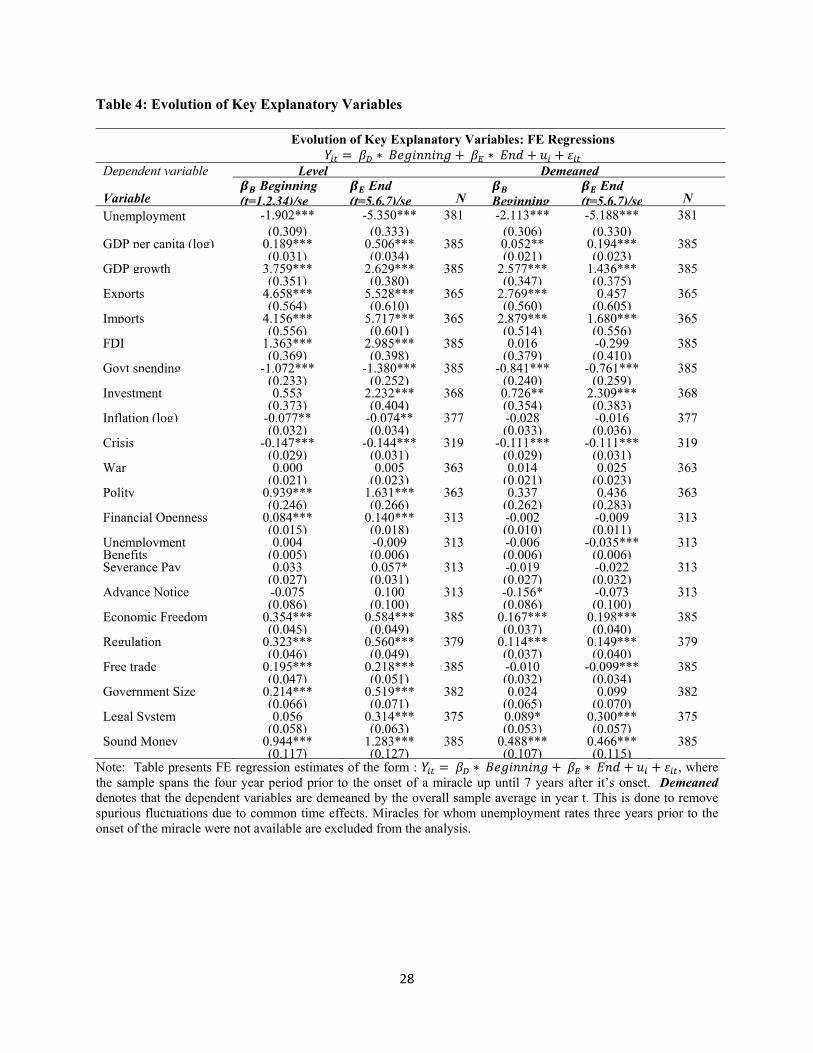
previous section. Table 4 presents regressions in which key explanatory variables are regressed on
dummies that indicate whether the country is currently in the first four years of a miracle (labeled
“Beginning”), or the subsequent three-year period (labeled “End”) to determine if there are
significant changes in these variables.10 The sample is confined to miracles for which information on
unemployment was available three years prior to the onset of the miracle. All regressions are
estimated using a standard Fixed-Effects estimator to remove time-invariant country characteristics.
Although this procedure controls for country-differences that are constant over time, it does
not control for global shocks, or the possibility that some variables, such as trade flows, might share
a common trend. To negate the possible impact of these,11 we also present regression estimates
where we use as dependent variable explanatory variables demeaned by the sample average of
observations available in the relevant year. This demeaning removes the impact of both covariate
shocks, such as global growth booms and crises, as well as time trends; the resulting coefficient
estimates thus provide information on how countries in miracles fare relative to other countries in
the sample.
<TABLE 4: EVOLUTION OF KEY VARIABLES>
Turning to the results, the reduction in unemployment that characterizes miracles coincides
with an acceleration of growth. This is illustrated by graphs A and B, which plot the evolution of
10 Note that we confine the sample to country-year observations that are either experiencing a miracle or about to embark on one within at most three years. 11 Note that these are routinely dealt with by including year dummies. However, since our sample only contains countries experiencing miracles, such year dummies would only capture shocks specific to countries witnessing miracles.
10
unemployment and GDP growth, respectively, demeaned by the sample average. Unemployment
tends to increase in the build-up to the onset of the miracle (graph A), reflecting the fact that
miracles often involve a reversal of fortune, which is typically accompanied by a distinct jump in
GDP growth (graph B) at the onset of the employment miracle.
The increase in GDP growth is accompanied by a significant increase in investment as a
share of GDP, whereas government spending as a share of GDP declines, suggesting that overall
macroeconomic conditions improve. In addition, countries experiencing a miracle are significantly
less likely to be experiencing a crisis then before the onset of a miracle; some miracles concur with
recovery from crisis. Moreover, miracles are accompanied by a significant surge in trade (see also
Freund and Pierola, 2008), exports and imports both increase significantly and roughly by the same
magnitude. Prima facie, these finding lend some credence to trade-led employment creation
strategies and underscore the importance of sound macroeconomic policy as an enabler of job
creation.
The regulatory environment appears to improve during miracles, as is indicated by the
positive and significant improvement in the Economic Freedom Index. This improvement persists
in the last three years of the miracle and is predominantly driven by significantly improved
regulation, improvements in the legal system and property rights and access to sound money
(reflecting inflation, its volatility, money growth, and the ability to own foreign currency bank
accounts – see the Appendix). These beneficial changes appear to persist throughout the second
phase of miracles. By contrast, no significant changes in financial openness and labor regulations as
proxied by advance notice and severance pay requirements as well as the generosity of
unemployment benefits are detected during either the first or the second phase of miracles.12
4 Predicting Miracles
We have seen how key variables evolve in the build up to, as well as throughout, miracles. Now, we
turn to potential predictors of miracles - perhaps the most relevant part for policymakers.
12 Note that countries not in a miracle appear to enhance the generosity of their unemployment benefits over time, such that, when looking at demeaned variables, countries embarking on miracles score significantly worse in the second phase; this reflects a deterioration in relative, rather than abolute performance driven by catch-up by countries not in a miracle.

11
4.1 Basic Results
We estimate a probit model, where the dependent variable takes the value 0 if there is
potential for a miracle to start in country i at time t but none has, and 1 if it starts in year t. Years in
which a miracle cannot begin (e.g. the seven years after onset) are excluded. The estimating equation
is:
Pr | Φ β
where is the vector of explanatory variables.
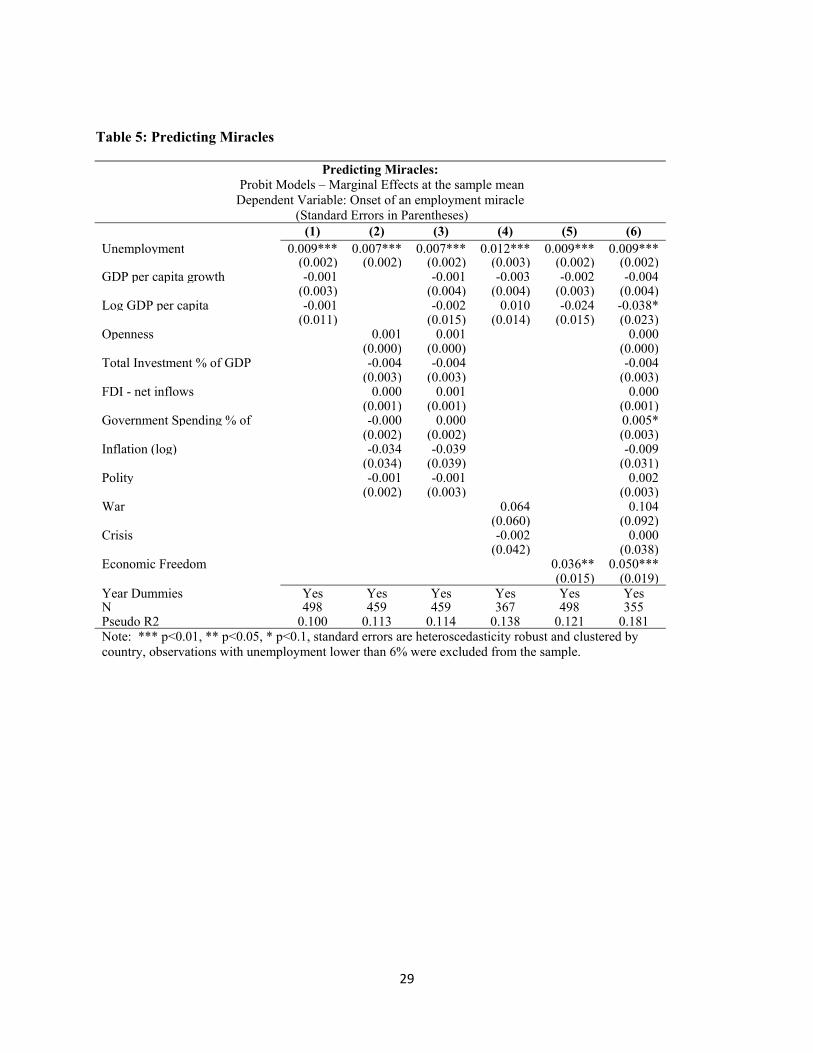
Table 5 presents various specifications of this model for countries with unemployment rates
of at least six percent that are not currently experiencing a miracle. All specifications control for
initial unemployment and include year dummies. Column 1 additionally controls for GDP per capita
and its growth, whereas column 2 instead controls for a host of macroeconomic indicators, notably
investment, openness, FDI, government consumption, inflation, as well as democracy, proxied by
the polity indicator (from Marshall et al., 2011). Column three simultaneously controls for both.
Column 4 instead controls for GDP per capita, its growth, initial unemployment and whether or not
a country is in crisis or at war. Column 5 examines the impact of regulation using the EFW indicator
of economic freedom as a proxy for the overall quality of regulation, controlling for GDP and its
growth as well as initial unemployment. Column six includes all additional explanatory variables.
<TABLE 5: PREDICTING MIRACLES>
Overall, while unemployment miracles are difficult to predict, there are some important
regularities. The models we present explain between 10-18% of the observed variance, which is not
low in these type of event studies.13 Of greater interest, the difficulty in predicting miracles is
reflected in the fact that few explanatory variables are statistically significant. Macro-conditions other
than unemployment do not predict the onset of miracles; the other macro variables including GDP
per capita and its growth, are never statistically significant, neither individually nor jointly.
13 For example, the models Hausmann et al. (2005) use to predict growth accelerations explain between 5 and 8% of the observed variance. The fairly low pseudo R2 also could be driven by rare-events bias (King and Zeng, 2001), which is addressed in the next section.
12
Simultaneously controlling for both, as is done in column 3, does not overturn this conclusion.
Column 4 demonstrates that countries at war are more likely to embark on a miracle. However, this
effect is only significant at the 10% level, and, moreover, not robust to including additional control
variables (see column 6).
In contrast, initial unemployment is a strong and significant predictor of the onset of
miracles. On average, a 1% point increase in initial unemployment increases the likelihood of the
incidence of a miracle by 0.7%-0.9%. Although this effect may not seem large in absolute terms, one
has to bear in mind that the unconditional probability of a miracle taking off is 5.8% for countries
with unemployment in excess of 6%. To put this into perspective, ceteris paribus, the odds of a
miracle happening in a country with 20% unemployment are approximately twice as high than it
happening in the average country in our sample,14 even though, to qualify as a miracle, it’s
unemployment must decrease by almost a full percentage point more due to the criterion that
unemployment must decrease by at least a quarter of its pre-miracle level (condition ii).
Turning to the results of focal interest, arguably the most important finding is that regulatory
quality is positively correlated with the incidence of miracles as is evidenced by the strongly
statistically significant coefficient on the index of economic freedom in columns 5. This finding is
robust to controlling for macro-variables, democracy, and whether or not a country is in crisis or at
war (column 6). Moreover, the magnitude of this association is remarkable; a one-standard deviation
improvement in regulatory quality (i.e. an increase of 1.08 in the Economic Freedom Index) is
associated with an increased probability of incidence of 3.6%-5.0%. Note that this is a conditional
association; recall that we did not find a significant positive bivariate correlation between the
incidence of employment miracles and indicators of overall regulatory quality because countries with
better regulation tend to have lower initial unemployment to start with.
4.2 Robustness
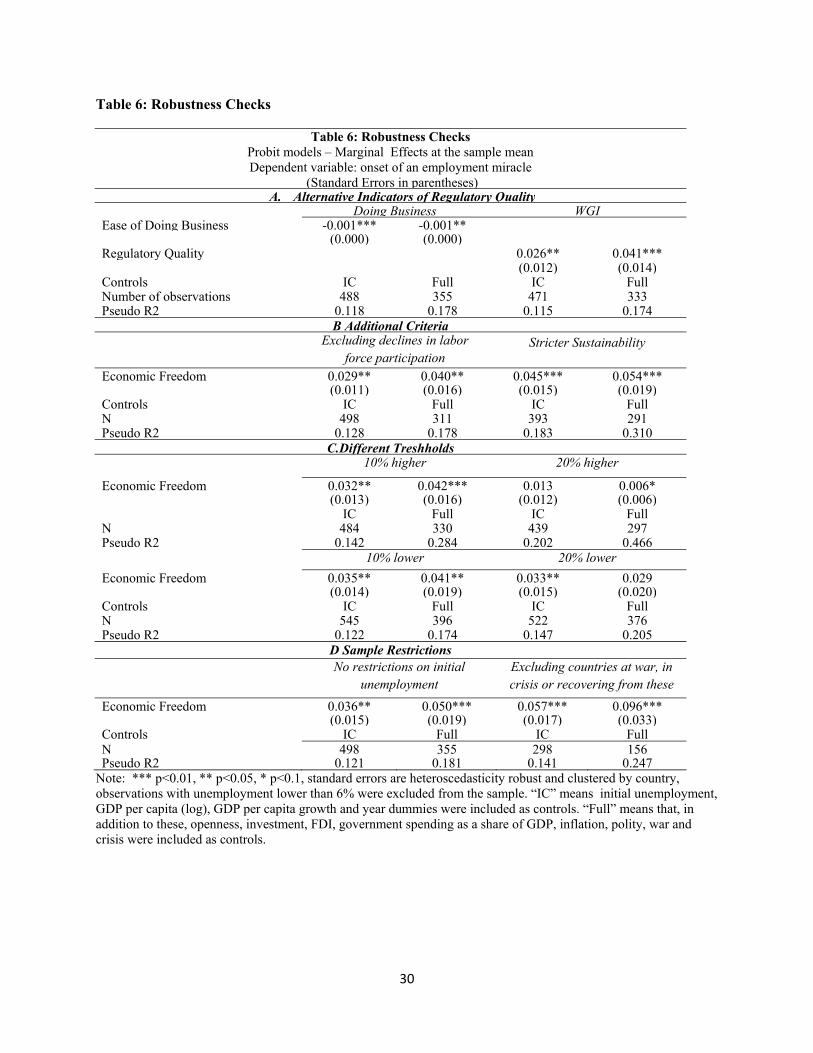
Tables 6 and 7 present robustness checks using specifications that replicate those in columns 5 and 6
in Table 5; that is, one that controls for initial unemployment, GDP per capita and GDP per capita
squared (referred to as the initial conditions, “IC”, specification), and one that includes all
explanatory variables (referred to as the “Full” specification), which we can only estimate on a
14 Recall that we are excluding observations with unemployment rates lower than 6%.
13
smaller sample for which all of these variables are available. To conserve space we only present the
coefficient estimates associated with our key variable of interest, notably economic freedom.
<TABLE 6: ROBUSTNESS CHECKS >
To start with, as alternative proxies for overall regulatory quality, the ease of doing business
rank from the Doing Business Indicators and the regulatory quality index from the World Governance
Indicators are used. The results presented in Row A of Table 6 are robust to using these alternative
proxies; the ease of doing business rank is consistently negatively correlated with the incidence of
miracles, indicating that worse regulation renders miracles less likely, while the indicator of
regulatory quality from the Worldwide Governance Indicators is significantly positively correlated with
their incidence.
Second, we examine the robustness of our results to using more stringent definitions of an
unemployment miracle by imposing additional criteria for the identification of a miracle. We begin
by ruling out the possibility that reductions in unemployment are driven by declines in labor force
participation. In particular, we impose as an additional criterion for the identification of a miracle
that labor force participation after the first four years of the unemployment miracle is at least as high
as it was at the start.15 While this reduces the number of miracles to 33, the Economic Freedom
Index remains a strongly significant predictor of the onset of miracles (see columns 1 and 2 in Row
B). Next, we impose a stricter definition of sustainability and require that unemployment does not
increase between four and seven years after onset of the miracle. This leaves 34 miracles. If
anything, adopting this more stringent definition of sustainability leads to a stronger correlation
between regulation and the incidence of miracles (see columns 3 and 4 in Row B).
Third, we assess the robustness of the results to using higher thresholds for unemployment
declines, which we increase and decrease by 10% and 20% respectively; the results, which are
presented in row C, are qualitatively robust to using these alternative thresholds, although changing
the thresholds by a wide margin diminishes the statistical significance of the conditional correlation
between regulation and the incidence of employment miracles.16
15 We also experimented with imposing the criterion that participation after 7 years was at least as high as at the onset of the miracle, which reduced the number of miracles to 34. The qualitative pattern of results is not shown here to conserve space, but was robust to using this alternative condition. 16 We also experimented with elongating the time horizons used to identify employment miracles. The results, which we do not present here to conserve space but are available upon request, remain robust to using such longer time horizons.

14
Fourth, we examine the robustness of our results to alternative sample restrictions. To start
with, the requirement that initial unemployment must be in excess of six percent is dropped. The
qualitative pattern of results does not change (see columns 1 and 2 in row D). Finally, we rule out
miracles being driven by recovery from war or crises by excluding countries which were at war or in
a crisis at any point during the past four years. Discarding these observations substantially
strengthens the association between regulation and the incidence of miracles.
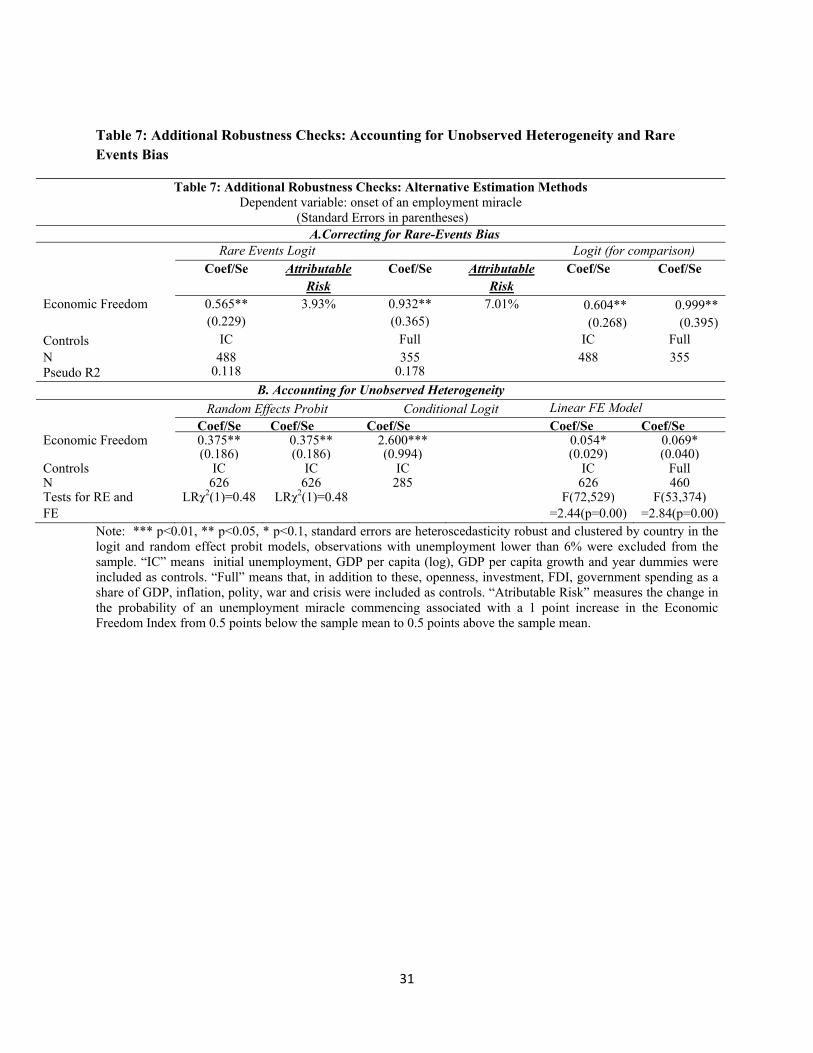
Fifth, table 7 examines the robustness of the results to using alternative estimations methods
that are better equipped to deal with unobserved heterogeneity and rare-occurrence bias. The latter
bias may arise because we are focusing on the onset of miracles; even though, at any given time a
substantial number of countries are experiencing an employment miracle, onset is of course more
rare. This may result in bias, which is typically downwards, due to both small sample selection bias
(which tends to bias coefficient estimates downwards) and not explicitly accounting for estimation
uncertainty (which tends to reduce the estimated variance, which in turn result in underestimation of
the likelihood of the occurrence of rare events). To address these issues, we re-estimate our models
using the modified logistic regression models proposed by King and Zeng (2001) that correct for
these potential problems. The results are presented in the top row of Table 7. Rare-events bias does
not appear to affect the coefficient estimate associated with regulation which, if anything, is lower
than in standard logistic regressions, which are presented in columns 5 and 6 for purposes of
comparability. Nonetheless, accounting for estimation uncertainty strengthens our results somewhat;
the attributable risk17 associated with a 1 point increase in the Economic Freedom Index is estimated
to be 3.9% in the specification that controls for initial conditions only and 6.0% in the specification
that includes all control variables. These increases in probability are a bit higher than the
corresponding marginal effects obtained using a standard probit model (recall the results presented
in columns 5 and 6 of table 5 which yielded marginal effects of 3.6% and 5.0% respectively).
<TABLE 7: ADDITIONAL ROBUSTNESS CHECKS >
Finally, we attempt to address potential bias due to unobserved heterogeneity, starting with
random effects probit models. The specifications presented in columns 1 and 2 of the bottom row
of Table 7 show that the results are robust to controlling for such random effects, and that the null
17 Attributable risk (or the first difference risk) is defined as the change in the probability as a function of a change in a covariate; see King and Zeng (2001).

15
hypothesis that they should not be included is not rejected. A well-documented drawback of the
random effects estimator is that it imposes that unobserved country-specific effects are not
correlated with the explanatory variables. To allow for the possibility that they are, we re-estimate
these models using Chamberlains fixed-effects logit, at the cost of having to exclude countries that
never experienced miracles from our sample. This in turn leads to convergence problems in the
model that includes all explanatory variables (the full specification). We also present standard linear
fixed effects estimates, which obviously do not appropriately account for the binary nature of the
data yet help shed light on the likely impact of unobserved time-invariant heterogeneity by using
information from countries that did not witness a miracle. Overall, our results suggest that such
heterogeneity is important, as is evidenced by F-tests that reject the null that country-fixed effects do
not matter in the linear fixed effects specifications. Nonetheless, such heterogeneity is unlikely the
key driver of the results we observe; the positive association between regulation and the incidence of
miracles remains significant both in the conditional logit and linear fixed effects models, albeit at the
10% level in the latter specifications. This is a strong result, since regulation evolves only slowly over
time, and because a one year horizon over which to identify the beneficial impacts of reforms is
fairly short.
To summarize, the relationship between regulation and employment miracles appears robust.
5 Which Policies Matter Most? Bayesian Model Averaging
The regulatory proxies used thus far are quite broad, and the positive association between regulation
and the incidence of miracles prompts the question: which aspects of regulation matter most? To
help answer this question and to assess the robustness of our previous results, we employ Bayesian
Model Averaging methods using subcomponents of the Economic Freedom Index as well as
alternative, more detailed, proxies for labor, trade, financial and business regulation, and indicators
of governance as potential predictors of the onset of miracles. Bayesian Model Averaging offers a
systematic method to deal with the uncertainty inherent in model selection by allowing one to assess
the posterior likelihood of models and coefficients, thereby helping us assess which variables are
most relevant (see Hoeting et al., 1999, for an introduction to Bayesian Model Averaging).18
18 One caveat to bear in mind when interpreting the results of BMA procedures is that their results can be very sensitive to measurement error (see Ciccone and Jarocinski, 2010).
16
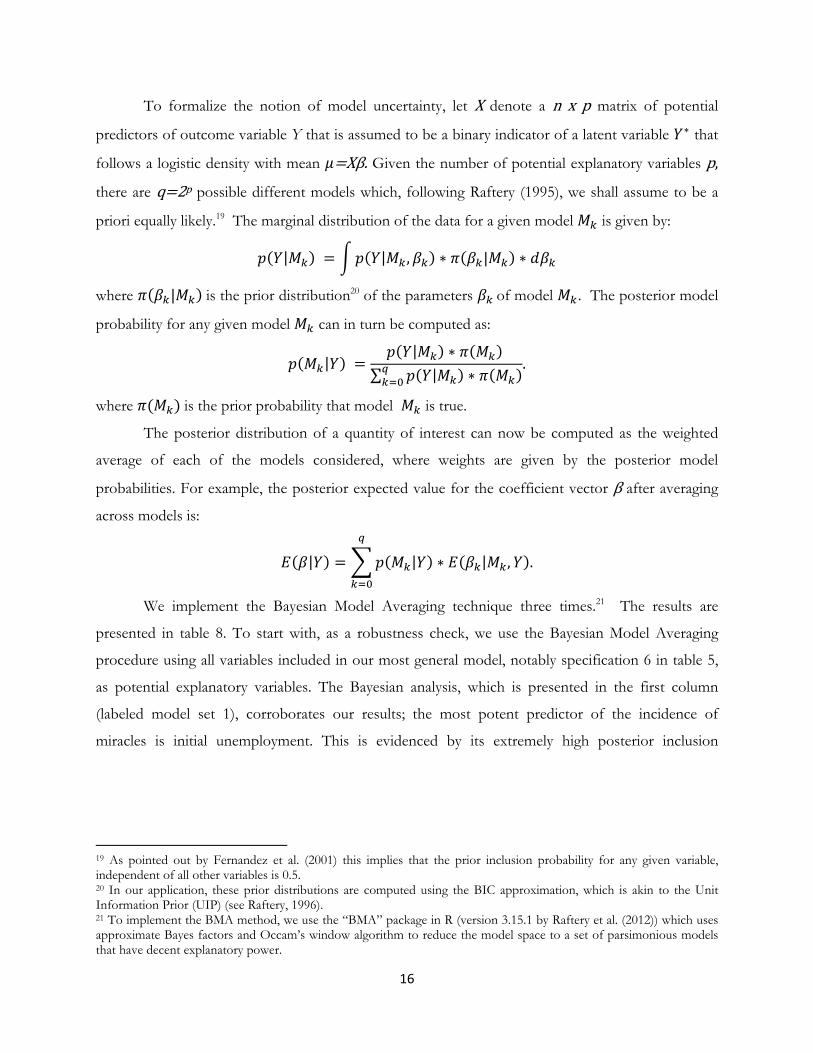
To formalize the notion of model uncertainty, let X denote a n x p matrix of potential
predictors of outcome variable Y that is assumed to be a binary indicator of a latent variable that
follows a logistic density with mean Xβ. Given the number of potential explanatory variables p,
there are q 2p possible different models which, following Raftery (1995), we shall assume to be a
priori equally likely.19 The marginal distribution of the data for a given model is given by:
| | , |
where | is the prior distribution20 of the parameters of model . The posterior model
probability for any given model can in turn be computed as:
| |
∑ |.
where is the prior probability that model is true.
The posterior distribution of a quantity of interest can now be computed as the weighted
average of each of the models considered, where weights are given by the posterior model
probabilities. For example, the posterior expected value for the coefficient vector β after averaging
across models is:
| | | , .
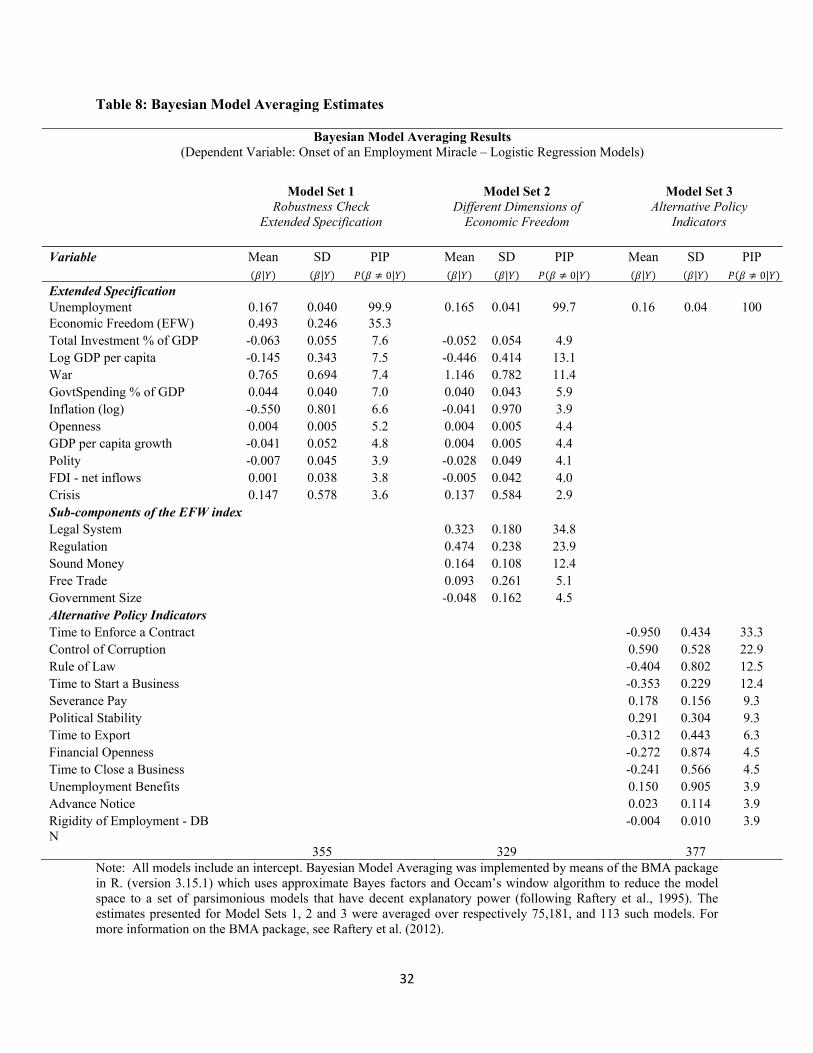
We implement the Bayesian Model Averaging technique three times.21 The results are
presented in table 8. To start with, as a robustness check, we use the Bayesian Model Averaging
procedure using all variables included in our most general model, notably specification 6 in table 5,
as potential explanatory variables. The Bayesian analysis, which is presented in the first column
(labeled model set 1), corroborates our results; the most potent predictor of the incidence of
miracles is initial unemployment. This is evidenced by its extremely high posterior inclusion
19 As pointed out by Fernandez et al. (2001) this implies that the prior inclusion probability for any given variable, independent of all other variables is 0.5. 20 In our application, these prior distributions are computed using the BIC approximation, which is akin to the Unit Information Prior (UIP) (see Raftery, 1996). 21 To implement the BMA method, we use the “BMA” package in R (version 3.15.1 by Raftery et al. (2012)) which uses approximate Bayes factors and Occam’s window algorithm to reduce the model space to a set of parsimonious models that have decent explanatory power.
17
probability (PIP) (99.9).22 The next best predictor, albeit with a substantially lower posterior
inclusion probability (35.3), is the Economic Freedom Index. The other explanatory variables
considered do not appear to be particularly useful predictors.23
Second, to assess which aspects of policy matter most we replicate this analysis, but now
replace the Economic Freedom Index by its component indicators, notably indices of the regulation
of business, credit and labor, the freedom to trade internationally, the size of the government, legal
system and the security of property rights, and access to sound money. The results, which are
presented in the second column (labeled model set 2), suggest that the legal system and property
rights and rules governing credit, business and labor, are the most important aspects of the business
environment. Note that while the posterior inclusion probability of the indicator of the legal system
is higher than that of regulation, the coefficient associated with regulation is much higher.
Third, to validate these results, and to further probe which aspects of regulation matter
most, we run a Bayesian Model Averaging analysis where we use as explanatory variables initial
unemployment and a host of alternative indicators of regulation.24 To proxy labor regulation we use
indicators of the severance pay and advance notice requirements as well as the generosity of
unemployment benefits from the IMF (Aleksynska et al., 2011) and the rigidity of employment index
from the World Bank Doing Business Indicators. The time it takes to export as recorded in the
Doing Business Indicators is used as a proxy for trade regulation, whereas the time it takes to open
and close a business and the time it takes to enforce a contract are used as proxies for business
regulation. We also include an indicator of financial regulation from Abiad et. al. (2008), as well as
indicators of political stability, the control of corruption and the rule of law from the Worldwide
Governance Indicators.25,26 The Bayesian Model Averaging analysis suggests that amongst them the time
22 The PIP is a measure of how important a predictor a variable is and is defined as the sum of the posterior probabilities of all models that include the variable in question; if models that include this variable are more likely, one can infer that the variable in question has predictive power. 23 In robustness checks not presented to conserve space but available upon request we also experimented with including additional explanatory variables, notably, literacy, mortality, demographic indicators, the exchange rate and domestic credit as a share of GDP, but none of these had substantial explanatory power. 24 One caveat to the results of this BMA procedure is that both the magnitude and the ranking of PIPs are somewhat sensitive to sample selection (estimation samples vary in size depending on the set of explanatory variables considered because not all indicators are available for each observation). Nonetheless, the finding that sound regulation is conducive to employment growth is qualitatively robust to using different samples. 25 In robustness checks not presented to conserve space we also experimented with additional explanatory variables such as credit extension to the private sector as a share of GDP, the stringency of minimum wage legislation, and voice and inclusion (from WGI), but the results did not suggest these to have substantial explanatory power. Results are not presented to conserve space, but available upon request from the authors. Other explanatory variables, such as the time

18
it takes to enforce a contract and the control of corruption are the most important predictors of the
incidence of miracles, albeit at much lower posterior inclusion probabilities than initial
unemployment. In particular, protracted contract enforcement is associated with a reduced
likelihood of miracles commencing. These findings are consistent with the results we obtained when
we used the subcomponents of the Economic Freedom Index, which also pointed towards the
importance of an efficacious legal system and secure property rights as important enabler of
employment growth. They also resonate with the descriptive statistics recorded in Table 3, which
demonstrated that countries that embark on miracles are characterized by both higher initial
unemployment and expedited contract enforcement relative to countries that do not. Interestingly,
the stringency of labor regulations and the generosity of unemployment benefits do not appear to
help predict the onset of employment miracles. Financial openness does not appear an important
determinant of employment miracles either.
6 Conclusion
By using an event-studies approach to examine how, historically, countries across the world have
generated employment miracles - episodes of swift, significant and sustained reductions in
unemployment - this paper aims to help policymakers identify policy levers to foster the creation of
enduring employment opportunities.
The frequency with which such miracles occur is encouraging. Each year approximately 1 in
every 20 countries not already in a miracle embark on such an unemployment reduction episode.
Moreover, the associated decline in unemployment is typically large, since, average unemployment
seven years after onset stood at less than half its initial level.
In spite of their prevalence, employment miracles are difficult to predict ex ante, reflected
inter alia in the low predictive power of models of their onset and the fact that countries embarking
on miracles are characterized by initial conditions very similar to those which do not in terms of
required to import (from DB) and government effectiveness (from WGI) were not used because they were extremely strongly correlated with other potential explanatory variables (notably the time required to export and the control of corruption respectively). 26 We did not simultaneously include the EFW subcomponents and these alternative indicators because the EFW indicators are in part derived from these subcomponents (nonetheless the results remain robust when we jointly include them).
19
growth, GDP, FDI inflows, exports, imports, investment, government spending, inflation,
democracy, and various proxies for regulatory quality. Nonetheless, countries that embark on
miracles tend to suffer higher unemployment and have de jure policies dictating more prompt
enforcement of contracts.
When they happen, miracles tend to coincide with an acceleration of growth, an overall
improvement in macroeconomic conditions manifested, inter alia, in higher trade flows, high
investment and lower government spending, as well as improvements in the regulatory framework.
In addition, the incidence of crises reduces significantly, suggesting that miracles sometimes concur
with recovery. Although we are not able to attribute causation, these findings point towards the
importance of prudent macroeconomic management in fostering sustainable employment growth.
Perhaps our most important finding is that miracles are ceteris paribus much more likely in
countries with better regulation. This relationship is robust to using alternative proxies for regulatory
quality, the imposition of additional criteria to identify employment miracles, alternative
parameterizations of the filter used to identify miracles, alternative estimation methods and various
different sample restrictions, and is crucially conditional on initial unemployment. On average,
countries embarking on miracles do not outperform countries that do not in terms of overall
regulatory performance. The reason is that countries with good regulation are less likely to have high
unemployment in the first place and consequently less likely to experience a miracle. However, if
they do end up with high unemployment, they are much more likely to escape from it.
The results are validated by Bayesian Model Averaging procedures which point towards
contract enforcement and the security of property rights as critical components of the business
environment and important enablers of employment growth. The relatively strong role for contract
enforcement relative to other indicators of governance, labor regulation and access to finance is
perhaps not too surprising if we consider that net job creation is typically accounted for by (young)
small firms (Haltiwanger et al, 2010), which are disproportionately reliant on lean regulation and
consistent implementation thereof in order to expand (Beck et al., 2005). The importance of
averting corruption is not entirely unexpected either, since excessive regulation goes hand in hand
with graft (Djankov et al 2002), taxing employers and making expansion more difficult, especially for
firms lacking connections to government officials.
20
References Abiad, Abdul, Enrica Detragiache and Thierry Tressel, “A New Database of Financial Reforms,” IMF Working Paper, WP/08/266 (2008).
Aleksynska, Mariay and Martin Schindler, “Labor Market Regulations in Low-, Middle- and High-Income Countries: A New Panel Database” IMF Working Paper, WP/11/154 (2011).
Beck, Thorsten, Asli Demirgüç-Kunt and Vojislav Maksimovic, "Financial and Legal Constraints to Growth: Does Firm Size Matter?," Journal of Finance, 60(1) (2005), 137-177, 02.
Bentolila, Samuel and Giuseppe Bertola, “Firing costs and labour demand: how bad is euro sclerosis?”, Review of Economic Studies, 57 (1990), 381–402.
Blanchard, Olivier and Lawrence Katz, “What we know and do not know about the natural rate of unemployment”, Journal of Economic Perspectives, 11 (1), (1997), 51–72
Blanchard, Olivier and Justin Wolfers, "The Role of Shocks and Institutions in the Rise of European Unemployment: The Aggregate Evidence", Economic Journal, 110(462), (2000), C1-33,.
Bond, Stephen and John Van Reenen "Microeconometric Models of Investment and Employment," Handbook of Econometrics in: J.J. Heckman & E.E. Leamer (ed.), Handbook of Econometrics, edition 1, volume 6, chapter 65, Elsevier (2007). Caballero, Ricardo J, Eduardo M. R.A. Engel, and John Haltiwanger, "Aggregate Employment Dynamics: Building from Microeconomic Evidence," American Economic Review, vol. 87(1), (1997), 115-37.
Cicone, Antonio and Marek Jarocinski, “Determinants of Economic Growth: Will Data Tell?” American Economic Journal: Macroeconomics 2 (2010): 2:4, 222–246
Collier, Paul and Benedikt Goderis, "Structural policies for shock-prone developing countries," Oxford Economic Papers 61(4), (2009), 703-726.
Cooper, Russel W., John C. Haltiwanger and Jonathan Willis "Dynamics of Labor Demand: Evidence from Plant-level Observations and Aggregate Implications," NBER Working Papers 10297 (2004).
Daly, Mary, Bart Hobijn, Ayşegül Şahin, and Rob Valletta “A Rising Natural Rate of Unemployment: Transitory or Permanent?” Journal of Economic Perspectives, (forthcoming).
Daly, Mary, Bart Hobijn, and Rob Valletta. “The Recent Evolution of the Natural Rate of Unemployment”, IZA Discussion Paper No. 5832, (2011).
De Soto, Hernando, The Other Path, (New York, NY: Harper and Row, 1990.)
21
Djankov, Simeon, Rafael La Porta, Florencio Lopez-De-Silanes and Andrei Shleifer, "The Regulation Of Entry", The Quarterly Journal of Economics, 117(1), (2002), 1-37. Djankov, Simeon, Rafael La Porta, Florencio Lopez-de-Silanes, and Andrei Shleifer, "The law and economics of self-dealing," Journal of Financial Economics, 88(3), (2008), 430-465. Dunne, Timothy, John Haltiwanger and Kenneth R. Troske, "Technology and Jobs: Secular Changes and Cyclical Dynamics," NBER Working Papers 5656 (1996). Economic Freedom House, Economic Freedom of the World: 2011 Annual Report (2011) Fernandez, Carmen, Eduardo Ley, and Mark F.J. Steel. “Model Uncertainty in Cross-Country Growth Regressions”, Journal of Applied Econometrics, (2001), pp 16, 563-576.
Freund, Caroline, “Current Account Adjustment in Industrial Countries” Journal of International Money and Finance 24, (2005) 1278-1298. Freund, Caroline and Martha-Denise Pierola, “Export Surges” Journal of Development Economics 97 (2) (2012), 387–395. Gwartney, John, Robert Lawson and Joshua Hall. Economic Freedom of the World: 2010 Annual Report (2010). Haltiwanger, John, Ron S. Jarmin and Javier Miranda. "Who Creates Jobs? Small vs. Large vs. Young," NBER Working Papers 16300 (2010).
Hamermesh, Daniel S., and Gerard A. Pfann, "Adjustment Costs in Factor Demand," Journal of Economic Literature, 34(3), (1996) 1264-1292.
Hoeting, Jennifer, David Madigan, Adrian Raftery, and Chris Volinsky, “Bayesian model averaging: A tutorial”, Statistical Science 14(4), (1999), 382-401. Kaufmann, Daniel, Aart Kraay and Massimo Mastruzzi "The Worldwide Governance Indicators : A Summary of Methodology, Data and Analytical Issues". World Bank Policy Research Working Paper No. 5430 (2010).
King, Gary and Langhe Zeng, “Logistic Regression in Rare Events Data” Political Analysis, (2001). 137-163.Lacina, Bethany and Nils Petter Gleditsch, Monitoring Trends in Global Combat: A New Dataset of Battle Deaths, European Journal of Population 21(2–3) (2005), 145–116
Laeven, Luc, and Fabian Valencia “Resolution of Banking Crises: The Good, the Bad, and the Ugly”, IMF Working Paper, WP/10/146, (2010).
Layard, Richard., Nickell, Stephen and Jackman, Richard. Unemployment: Macroeconomic Performance and the Labour Market, Oxford: Oxford University Press (1991).
22
Marshall, Monty G., Keith Jaggers and Ted Robert Gurr. 2011. Polity IV Project: Dataset Users’ Manual. Arlington: Polity IV Project.
Nickell, Stephen and Richard Layard, "Labor market institutions and economic performance," Handbook of Labor Economics, in: Orley Ashenfelter and David Card (ed.), Handbook of Labor Economics, edition 1, volume 3, chapter 46, (1999),.
Nickell, Stephen Luca Nunziata and Wolfgang Ochel, "Unemployment in the OECD Since the 1960s. What Do We Know?," Economic Journal, 115(500), (2005), 1-27.
Raftery, Adrian, “Bayesian model selection in social research”, Sociological Methodology 25, (1995), pp 111-163.
Raftery, Adrian, “Approximate Bayes Factors and Accounting for Model Uncertainty in Generalised Linear Models”, Biometrika, 83(2), (1996), 251-266.
Raftery, Adrian., Jennifer Hoeting, Chris Volinsky, Ian Painter and Ka Yee Yeung, (2012), BMA: Bayesian Model Averaging. R package version 3.15.1.URL: http://CRAN.R-project.org/package=BMA

23
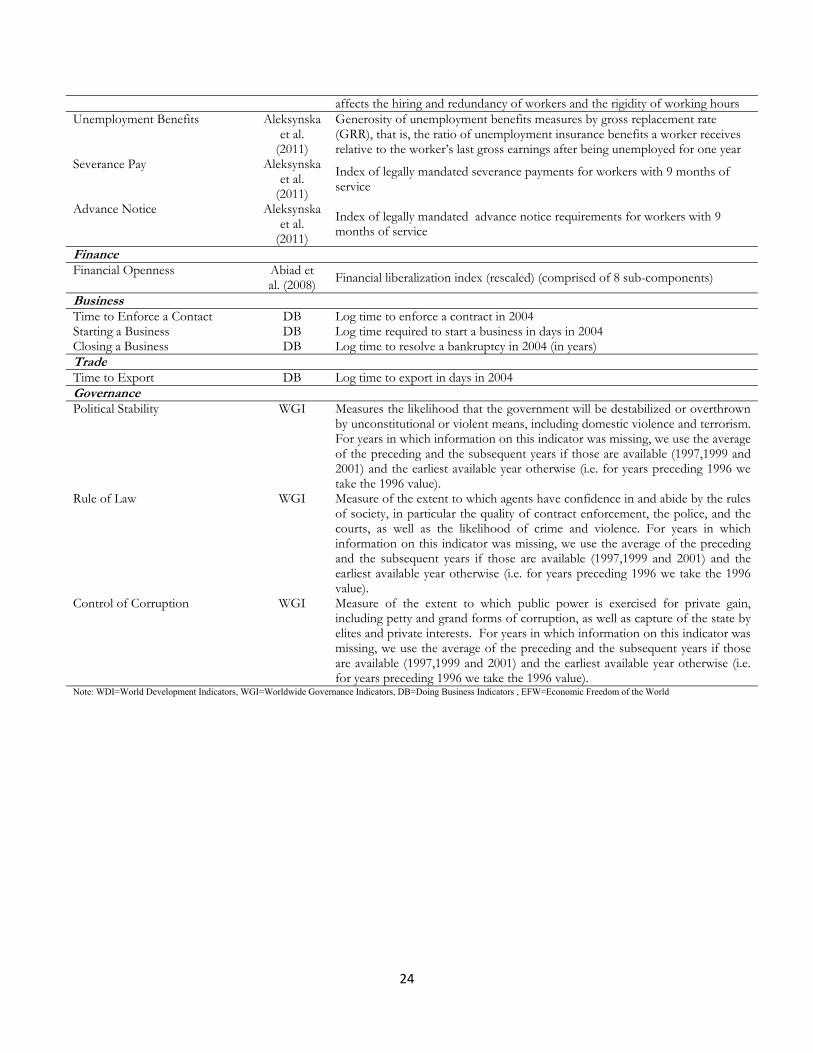
Data Appendix
Variable Name Source DescriptionUnemployment WDI Log GDP per capita WDI Natural logarithm of real GDP per capita based on purchasing power parity
(PPP). Data are in constant 2005 international dollars. GDP per capita growth WDI GDP per capita growth (% terms)Exports WDI Exports of goods and services (% of GDP)Imports WDI Imports of goods and services (% of GDP)Openness WDI (Exports+Imports)FDI WDI Foreign direct investment, net inflows (% of GDP) Investment WDI Gross fixed capital formation (% of GDP)Government Spending WDI General government final consumption expenditure (% of GDP)Inflation (log) WDI log((100+annual inflation(%))/100)Democracy Marshall et
al. (2011) Polity2: the combined polity score which is the difference between the democracy and autocracy indicators
War Lacina and Gleditsch
(2005)
Indicator variable taking value 1 if the country was engaged in a war (i.e. a conflict with at least 1,000 battle related death in a given year), and 0 otherwise
Crisis Laeven and
Valencia (2010)
Indicator of banking crises taking the value 1 if the country was experiencing a banking crisis and 0 otherwise.
Broad Indicators of Regulatory Quality Economic Freedom EFW Composite index of economic freedomEase of Doing Business Rank
DB Country’s rank score in the ease of doing business indicators in 2008 (extrapolated backwards over time) (1=most business friendly regulations)
Regulatory Quality
WGI
Measures the ability of the government to formulate and implement sound policies and regulations that permit and promote private sector development (with higher values corresponding to better outcomes). For years in which information on this indicator was missing, we use the average of the preceding and the subsequent years if those are available (1997,1999 and 2001) and the earliest available year otherwise (i.e. for years preceding 1996 we take the 1996 value).
Dimensions of Economic Freedom Government Size EFW Indicator of central government involvement in the economy (comprising
general government consumption spending, transfers and subsidies, government enterprises and investment and the top marginal tax rate)
Regulation EFW Indicator of credit (ownership of banks, foreign bank competition, private sector credit), labor (minimum wages, hiring and firing regulations, centralized collective bargaining, mandated cost of hiring and worker dismissal and conscription) and business regulation (price controls, administrative requirements, bureaucracy costs, starting a business, bribes, licensing restrictions, costs of tax compliance).
Legal System EFW Indicator of legal structure and the security of property rights, taking into account judicial independence, whether courts are impartial, property rights, military interference in the political process, integrity of the legal system, legal enforcement of contracts, and regulatory restrictions on sale of real property
Money EFW Indicator of the efficacy of money as a medium of exchange (comprising measures of money growth, inflation and its volatility, as well as the freedom to access foreign bank accounts).
Free Trade EFW Indicator of the ease with which goods can be traded across borders (comprising taxes on trade, regulatory trade barriers, size of the trade sector relative to expected, black-market exchange rates, capital market controls)
Labor Regulation Rigidity of Employment DB Measures flexibility in the regulation of employment in 2008, specifically as it
24
affects the hiring and redundancy of workers and the rigidity of working hoursUnemployment Benefits Aleksynska
et al. (2011)
Generosity of unemployment benefits measures by gross replacement rate (GRR), that is, the ratio of unemployment insurance benefits a worker receives relative to the worker’s last gross earnings after being unemployed for one year
Severance Pay Aleksynska et al.
(2011)
Index of legally mandated severance payments for workers with 9 months of service
Advance Notice Aleksynska et al.
(2011)
Index of legally mandated advance notice requirements for workers with 9 months of service
Finance Financial Openness Abiad et
al. (2008) Financial liberalization index (rescaled) (comprised of 8 sub-components)
Business Time to Enforce a Contact DB Log time to enforce a contract in 2004Starting a Business DB Log time required to start a business in days in 2004 Closing a Business DB Log time to resolve a bankruptcy in 2004 (in years) Trade Time to Export DB Log time to export in days in 2004Governance Political Stability WGI Measures the likelihood that the government will be destabilized or overthrown
by unconstitutional or violent means, including domestic violence and terrorism. For years in which information on this indicator was missing, we use the average of the preceding and the subsequent years if those are available (1997,1999 and 2001) and the earliest available year otherwise (i.e. for years preceding 1996 we take the 1996 value).
Rule of Law WGI Measure of the extent to which agents have confidence in and abide by the rules of society, in particular the quality of contract enforcement, the police, and the courts, as well as the likelihood of crime and violence. For years in which information on this indicator was missing, we use the average of the preceding and the subsequent years if those are available (1997,1999 and 2001) and the earliest available year otherwise (i.e. for years preceding 1996 we take the 1996 value).
Control of Corruption WGI Measure of the extent to which public power is exercised for private gain, including petty and grand forms of corruption, as well as capture of the state by elites and private interests. For years in which information on this indicator was missing, we use the average of the preceding and the subsequent years if those are available (1997,1999 and 2001) and the earliest available year otherwise (i.e. for years preceding 1996 we take the 1996 value).
Note: WDI=World Development Indicators, WGI=Worldwide Governance Indicators, DB=Doing Business Indicators , EFW=Economic Freedom of the World
25
Table 1: List of Employment miracles by Region, Year, and Country
Region Miracles Year Country Unemployment ∆Unemployment
(countries) % (No./Obs) At onset After 4 years
After 7 years
First 4 years
All 7 years
EAP (9) 6.3% (5/80) 1986 Malaysia 8.3 5.1 3.0 -3.2 -5.3 1986 Singapore 6.5* 2.1* 2.7* -4.5* -3.8*1987 Thailand 5.8 2.7 1.3 -3.1 -4.51988 Fiji 9.4 5.4 5.4 -4.0 -4.01998 Korea, Rep. 7.0 3.3 3.7 -3.7 -3.3
ECA (19) 6.3% (8/127) 1993 Hungary 12.1 9.0 6.6 -3.1 -5.51996 Latvia 20.2 13.9 10.5 -6.3 -9.71999 Russia 13.5 8.2 7.2 -5.3 -6.32000 Ukraine 11.6 8.6 6.4 -3.0 -5.22001 Bulgaria 19.4 10.1 5.7 -9.3 -13.72001 Croatia 20.5 12.6 8.4 -7.9 -12.12001 Estonia 12.6 7.9 5.5 -4.7 -7.12001 Lithuania 16.8 8.3 5.8 -8.5 -11.0
Industrial 3.6% (12/332) 1983 Canada 12.0 8.8 8.1 -3.2 -3.91983 United States 9.6 6.2 5.6 -3.4 -4.01984 Netherlands 14.2 9.1 6.9 -5.1 -7.31986 Portugal 8.6 4.7 5.5 -3.9 -3.11993 Denmark 10.7 5.4 4.5 -5.3 -6.21993 Ireland 15.6 10.2 4.3 -5.4 -11.31993 Britain 10.3 7.1 5.6 -3.2 -4.71994 Finland 16.4 11.4 9.1 -5.0 -7.31995 Netherlands 7.0 3.5 3.1 -3.5 -3.91995 Spain 22.7 15.6 11.4 -7.1 -11.31997 France 12.6 8.6 9.2 -4.0 -3.41997 Sweden 10.0 5.0 6.5 -5.0 -3.5
LAC (26) 4.6% (15/329) 1982 Chile 19.6 8.7 5.3 -10.9 -14.31982 Costa Rica 9.4 6.3 3.7 -3.1 -5.71983 Uruguay 15.4 9.1 8.5 -6.3 -6.91984 Jamaica 25.6 18.9 15.7 -6.7 -9.91985 Colombia 14.0 8.9 9.5 -5.1 -4.51985 El Salvador 16.9 8.4 7.9 -8.5 -9.01987 Bolivia 20.5 5.9 3.1 -14.6 -17.41993 Barbados 25.6 14.6 9.3 -11.0 -16.31994 Bahamas, The 13.4 7.6 6.9 -5.8 -6.51995 Mexico 6.9 2.5 2.9 -4.4 -4.01995 Nicaragua 16.9 10.9 12.2 -6.0 -4.71996 Trinidad and 16.3 12.1 10.5 -4.2 -5.81997 Cuba 7.1 4.1 1.9 -3.0 -5.21999 Jamaica 15.7 11.7 9.6 -4.0 -6.12000 Colombia 20.5 13.7 10.9 -6.8 -9.6
MENA (7) 3.0% (2/66) 1995 Morocco 22.9 13.9 11.6 -9.0 -11.3 2000 Algeria 29.8 17.7 13.8 -12.1 -16.0
SAR (2) 4% (1/24) 1994 Sri Lanka 13.0 9.1 7.9 -3.9 -5.1
SSA (5) 0% (0/25)Notes: the number of observations refers to the number of country-year observations characterized by unemployment in excess of 3% that have not experienced the start of a miracle within the last 7 years. ∆Unemployment refers to the 4 year change in unemployment from the onset of the miracle onwards. * indicates unemployment rates were imputed.
26
Table 2: List of Employment miracles by Income Group and Initial Unemployment
Income GroupUnemployment Quartile
Lower Middle Upper Middle
High: Non-OECD
High: OECD
Total
Q1 No. 1 0 0 0 1(3.0<U<6.0%) % 0.79 0.00 0.00 0.00 0.41 Q2 No. 0 3 1 3 7(5.9≤U<8.7%) % 0 4.41 4.55 3.37 3.13Q3 No. 1 2 1 7 11(8.7%≤U<12.6%) % 2.86 3.64 3.33 6.86 4.95 Q4 No. 5 11 4 4 24(12.6%≤U) % 13.89 9.73 8.00 11.43 10.17Total miracles No. 7 16 6 14 43Miracles average % 4.07 5.54 4.88 4.12 4.64
Notes: No. refers to the number of miracles, % to the number of miracles as a share of those country-year observations that are characterized by unemployment in excess of 3% that have not experienced the start of a miracle within the last 7 years
27
Table 3: Initial Conditions and Descriptive Statistics
Initial ConditionsBolded, Italicized and Underlined
coefficients indicate that mean differences are significant at the 5% level Onset of Miracle No Takeoff
Mean SD N Mean SD NInitial Unemployment Unemployment 14.69 5.75 42 11.67 4.99 672 GDP GDP per capital (log) 8.25 1.19 41 8.38 1.10 668GDP per capita growth 0.78 4.81 42 1.27 4.01 670Trade Exports 38.66 17.09 40 35.33 19.22 665Imports 37.75 16.35 40 38.27 20.15 665FDI 2.67 2.42 41 2.14 5.60 644Core Macro Investment 19.14 5.30 40 20.45 4.42 654Government spending 17.21 4.60 42 16.85 5.77 658Inflation 0.12 0.15 39 0.20 0.47 636Crisis Crisis 0.14 0.36 35 0.12 0.33 478Democracy and Conflict Polity Score 6.08 5.63 40 6.95 5.01 600War 0.13 0.33 40 0.07 0.25 600Overall Regulatory Quality Economic freedom (EFW) 6.35 1.08 41 6.21 1.08 605Ease of Doing Business –Rank (DB) 56.90 44.51 40 68.75 47.17 654Regulation (WGI) 0.62 0.63 42 0.57 0.57 662Dimensions of Economic Freedom (EFW)Government Size 5.55 1.40 41 5.55 1.63 602Legal System 6.15 2.26 40 6.20 2.00 592Money 7.07 2.16 41 6.75 2.44 611Free Trade 6.89 1.36 41 6.68 1.27 605Regulation 6.17 1.01 40 5.90 1.12 598Labor Regulation Rigidity of Employment (DB) 27.80 19.09 40 29.47 19.52 654Unemployment Benefits 0.30 0.28 36 0.25 0.22 482Severance Pay 1.14 1.69 36 0.96 1.33 489Advance Notice 2.67 1.87 36 2.35 1.71 489Financial Openness Financial Openness 0.64 0.29 36 0.63 0.25 495Trade Regulation Time to Export - log(Days) 2.85 0.64 40 2.98 0.57 640Business Regulations (DB) Starting a Business - log(Days) 3.43 0.80 38 3.57 0.92 596Closing a Business - log(Days) 1.11 0.35 39 1.24 0.43 633Time to Enforce a Contact -log(Days) 6.20 0.52 40 6.41 0.45 640 Governance (WGI) Rule of Law 0.49 0.98 42 0.47 0.87 664Voice 0.53 0.81 42 0.54 0.73 664Political Stability 0.29 0.91 42 0.18 0.86 664Government Effectiveness 0.64 1.04 42 0.53 0.97 664Control of Corruption 0.62 1.07 42 0.48 0.98 662
Note: Table includes country-year observations that are characterized by unemployment in excess of 6% that have not experienced the start of a miracle within the last 7 years. Bolded, italicized and underlined coefficients indicate that mean differences in the explanatory variable between countries that experience a miracle and those that do not are significant at the 5% level.
28
Table 4: Evolution of Key Explanatory Variables
Evolution of Key Explanatory Variables: FE Regressions
Dependent variable Level Demeaned
Variable Beginning
(t=1,2,34)/se End
(t=5,6,7)/se N
Beginning End
(t=5,6,7)/se N Unemployment -1.902*** -5.350*** 381 -2.113*** -5.188*** 381
(0.309) (0.333) (0.306) (0.330) GDP per capita (log) 0.189*** 0.506*** 385 0.052** 0.194*** 385
(0.031) (0.034) (0.021) (0.023) GDP growth 3.759*** 2.629*** 385 2.577*** 1.436*** 385
(0.351) (0.380) (0.347) (0.375) Exports 4.658*** 5.528*** 365 2.769*** 0.457 365
(0.564) (0.610) (0.560) (0.605) Imports 4.156*** 5.717*** 365 2.879*** 1.680*** 365
(0.556) (0.601) (0.514) (0.556) FDI 1.363*** 2.985*** 385 0.016 -0.299 385
(0.369) (0.398) (0.379) (0.410) Govt spending -1.072*** -1.380*** 385 -0.841*** -0.761*** 385
(0.233) (0.252) (0.240) (0.259) Investment 0.553 2.232*** 368 0.726** 2.309*** 368
(0.373) (0.404) (0.354) (0.383) Inflation (log) -0.077** -0.074** 377 -0.028 -0.016 377
(0.032) (0.034) (0.033) (0.036) Crisis -0.147*** -0.144*** 319 -0.111*** -0.111*** 319
(0.029) (0.031) (0.029) (0.031) War 0.000 0.005 363 0.014 0.025 363
(0.021) (0.023) (0.021) (0.023) Polity 0.939*** 1.631*** 363 0.337 0.436 363
(0.246) (0.266) (0.262) (0.283) Financial Openness 0.084*** 0.140*** 313 -0.002 -0.009 313
(0.015) (0.018) (0.010) (0.011) Unemployment 0.004 -0.009 313 -0.006 -0.035*** 313Benefits (0.005) (0.006) (0.006) (0.006) Severance Pay 0.033 0.057* 313 -0.019 -0.022 313
(0.027) (0.031) (0.027) (0.032) Advance Notice -0.075 0.100 313 -0.156* -0.073 313
(0.086) (0.100) (0.086) (0.100) Economic Freedom 0.354*** 0.584*** 385 0.167*** 0.198*** 385
(0.045) (0.049) (0.037) (0.040) Regulation 0.323*** 0.560*** 379 0.114*** 0.149*** 379
(0.046) (0.049) (0.037) (0.040) Free trade 0.195*** 0.218*** 385 -0.010 -0.099*** 385
(0.047) (0.051) (0.032) (0.034) Government Size 0.214*** 0.519*** 382 0.024 0.099 382
(0.066) (0.071) (0.065) (0.070) Legal System 0.056 0.314*** 375 0.089* 0.300*** 375
(0.058) (0.063) (0.053) (0.057) Sound Money 0.944*** 1.283*** 385 0.488*** 0.466*** 385 (0.117) (0.127) (0.107) (0.115)
Note: Table presents FE regression estimates of the form : , where the sample spans the four year period prior to the onset of a miracle up until 7 years after it’s onset. Demeaned denotes that the dependent variables are demeaned by the overall sample average in year t. This is done to remove spurious fluctuations due to common time effects. Miracles for whom unemployment rates three years prior to the onset of the miracle were not available are excluded from the analysis.
29
Table 5: Predicting Miracles
Predicting Miracles: Probit Models – Marginal Effects at the sample mean Dependent Variable: Onset of an employment miracle
(Standard Errors in Parentheses) (1) (2) (3) (4) (5) (6)
Unemployment 0.009*** 0.007*** 0.007*** 0.012*** 0.009*** 0.009***(0.002) (0.002) (0.002) (0.003) (0.002) (0.002)
GDP per capita growth -0.001 -0.001 -0.003 -0.002 -0.004(0.003) (0.004) (0.004) (0.003) (0.004)
Log GDP per capita -0.001 -0.002 0.010 -0.024 -0.038*(0.011) (0.015) (0.014) (0.015) (0.023)
Openness 0.001 0.001 0.000(0.000) (0.000) (0.000)
Total Investment % of GDP -0.004 -0.004 -0.004(0.003) (0.003) (0.003)
FDI - net inflows 0.000 0.001 0.000(0.001) (0.001) (0.001)
Government Spending % of -0.000 0.000 0.005*(0.002) (0.002) (0.003)
Inflation (log) -0.034 -0.039 -0.009(0.034) (0.039) (0.031)
Polity -0.001 -0.001 0.002(0.002) (0.003) (0.003)
War 0.064 0.104(0.060) (0.092)
Crisis -0.002 0.000(0.042) (0.038)
Economic Freedom 0.036** 0.050***(0.015) (0.019)
Year Dummies Yes Yes Yes Yes Yes Yes N 498 459 459 367 498 355 Pseudo R2 0.100 0.113 0.114 0.138 0.121 0.181 Note: *** p<0.01, ** p<0.05, * p<0.1, standard errors are heteroscedasticity robust and clustered by country, observations with unemployment lower than 6% were excluded from the sample.
30
Table 6: Robustness Checks
Table 6: Robustness Checks Probit models – Marginal Effects at the sample mean Dependent variable: onset of an employment miracle
(Standard Errors in parentheses)A. Alternative Indicators of Regulatory Quality
Doing Business WGI Ease of Doing Business -0.001*** -0.001**
(0.000) (0.000)Regulatory Quality 0.026** 0.041***
(0.012) (0.014)Controls IC Full IC Full Number of observations 488 355 471 333 Pseudo R2 0.118 0.178 0.115 0.174
B Additional Criteria
Excluding declines in labor
force participation Stricter Sustainability
Economic Freedom 0.029** 0.040** 0.045*** 0.054***(0.011) (0.016) (0.015) (0.019)
Controls IC Full IC Full N 498 311 393 291 Pseudo R2 0.128 0.178 0.183 0.310
C.Different Treshholds10% higher 20% higher
Economic Freedom 0.032** 0.042*** 0.013 0.006*(0.013) (0.016) (0.012) (0.006)
IC Full IC Full N 484 330 439 297 Pseudo R2 0.142 0.284 0.202 0.466
10% lower 20% lower
Economic Freedom 0.035** 0.041** 0.033** 0.029 (0.014) (0.019) (0.015) (0.020)
Controls IC Full IC Full N 545 396 522 376 Pseudo R2 0.122 0.174 0.147 0.205
D Sample Restrictions
No restrictions on initial unemployment
Excluding countries at war, in crisis or recovering from these
Economic Freedom 0.036** 0.050*** 0.057*** 0.096***(0.015) (0.019) (0.017) (0.033)
Controls IC Full IC Full N 498 355 298 156 Pseudo R2 0.121 0.181 0.141 0.247
Note: *** p<0.01, ** p<0.05, * p<0.1, standard errors are heteroscedasticity robust and clustered by country, observations with unemployment lower than 6% were excluded from the sample. “IC” means initial unemployment, GDP per capita (log), GDP per capita growth and year dummies were included as controls. “Full” means that, in addition to these, openness, investment, FDI, government spending as a share of GDP, inflation, polity, war and crisis were included as controls.
31
Table 7: Additional Robustness Checks: Accounting for Unobserved Heterogeneity and Rare Events Bias
Table 7: Additional Robustness Checks: Alternative Estimation Methods Dependent variable: onset of an employment miracle
(Standard Errors in parentheses) A.Correcting for Rare-Events Bias
Rare Events Logit Logit (for comparison)
Coef/Se Attributable
Risk Coef/Se Attributable
Risk Coef/Se Coef/Se
Economic Freedom 0.565** 3.93% 0.932** 7.01% 0.604** 0.999** (0.229) (0.365) (0.268) (0.395)
Controls IC Full IC Full N 488 355 488 355Pseudo R2 0.118 0.178
B. Accounting for Unobserved Heterogeneity
Random Effects Probit Conditional Logit Linear FE Model Coef/Se Coef/Se Coef/Se Coef/Se Coef/Se
Economic Freedom 0.375** 0.375** 2.600*** 0.054* 0.069*(0.186) (0.186) (0.994) (0.029) (0.040)
Controls IC IC IC IC FullN 626 626 285 626 460Tests for RE and LRχ2(1)=0.48 LRχ2(1)=0.48 F(72,529) F(53,374)FE =2.44(p=0.00) =2.84(p=0.00)
Note: *** p<0.01, ** p<0.05, * p<0.1, standard errors are heteroscedasticity robust and clustered by country in the logit and random effect probit models, observations with unemployment lower than 6% were excluded from the sample. “IC” means initial unemployment, GDP per capita (log), GDP per capita growth and year dummies were included as controls. “Full” means that, in addition to these, openness, investment, FDI, government spending as a share of GDP, inflation, polity, war and crisis were included as controls. “Atributable Risk” measures the change in the probability of an unemployment miracle commencing associated with a 1 point increase in the Economic Freedom Index from 0.5 points below the sample mean to 0.5 points above the sample mean.
32
Table 8: Bayesian Model Averaging Estimates
Bayesian Model Averaging Results (Dependent Variable: Onset of an Employment Miracle – Logistic Regression Models)
Model Set 1 Model Set 2 Model Set 3
Robustness Check
Extended Specification Different Dimensions of
Economic Freedom Alternative Policy
Indicators
Variable Mean SD PIP Mean SD PIP Mean SD PIP | | 0| | | 0| | | 0|
Extended Specification Unemployment 0.167 0.040 99.9 0.165 0.041 99.7 0.16 0.04 100 Economic Freedom (EFW) 0.493 0.246 35.3 Total Investment % of GDP -0.063 0.055 7.6 -0.052 0.054 4.9 Log GDP per capita -0.145 0.343 7.5 -0.446 0.414 13.1 War 0.765 0.694 7.4 1.146 0.782 11.4 GovtSpending % of GDP 0.044 0.040 7.0 0.040 0.043 5.9 Inflation (log) -0.550 0.801 6.6 -0.041 0.970 3.9 Openness 0.004 0.005 5.2 0.004 0.005 4.4 GDP per capita growth -0.041 0.052 4.8 0.004 0.005 4.4 Polity -0.007 0.045 3.9 -0.028 0.049 4.1 FDI - net inflows 0.001 0.038 3.8 -0.005 0.042 4.0 Crisis 0.147 0.578 3.6 0.137 0.584 2.9 Sub-components of the EFW index Legal System 0.323 0.180 34.8 Regulation 0.474 0.238 23.9 Sound Money 0.164 0.108 12.4 Free Trade 0.093 0.261 5.1 Government Size -0.048 0.162 4.5 Alternative Policy Indicators Time to Enforce a Contract -0.950 0.434 33.3 Control of Corruption 0.590 0.528 22.9 Rule of Law -0.404 0.802 12.5 Time to Start a Business -0.353 0.229 12.4 Severance Pay 0.178 0.156 9.3 Political Stability 0.291 0.304 9.3 Time to Export -0.312 0.443 6.3 Financial Openness -0.272 0.874 4.5 Time to Close a Business -0.241 0.566 4.5 Unemployment Benefits 0.150 0.905 3.9 Advance Notice 0.023 0.114 3.9 Rigidity of Employment - DB -0.004 0.010 3.9 N
355
329
377 Note: All models include an intercept. Bayesian Model Averaging was implemented by means of the BMA package in R. (version 3.15.1) which uses approximate Bayes factors and Occam’s window algorithm to reduce the model space to a set of parsimonious models that have decent explanatory power (following Raftery et al., 1995). The estimates presented for Model Sets 1, 2 and 3 were averaged over respectively 75,181, and 113 such models. For more information on the BMA package, see Raftery et al. (2012).
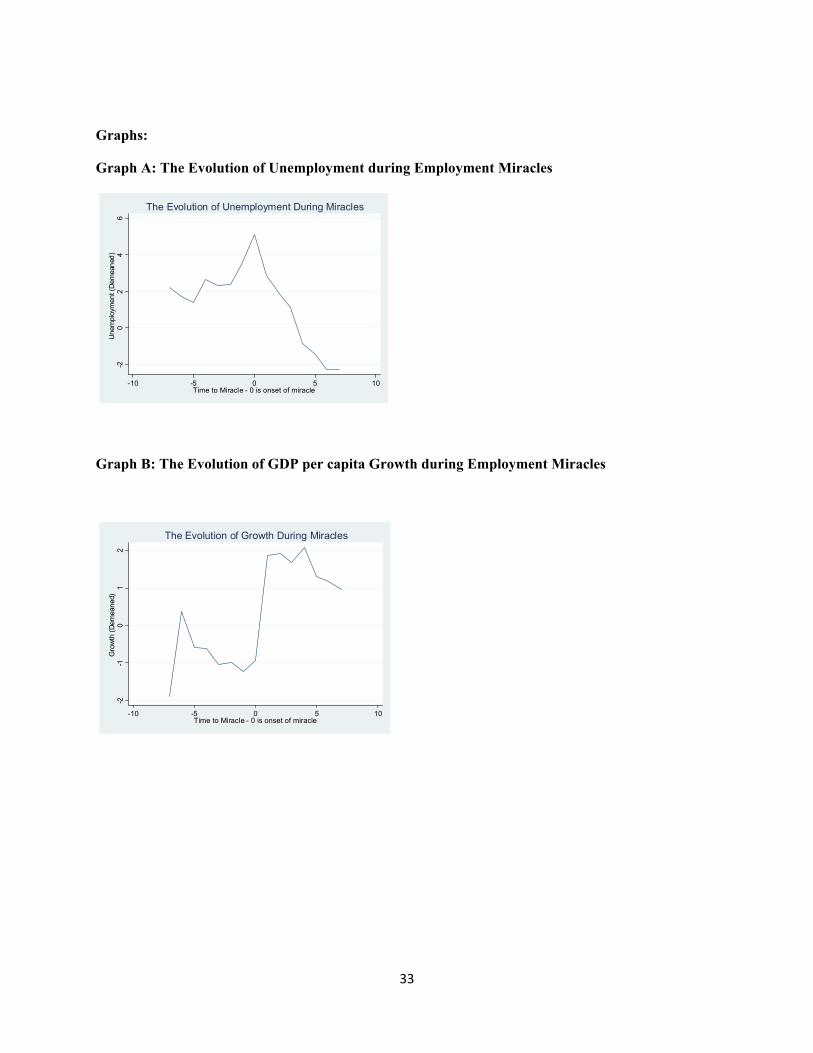
33
Graphs:
Graph A: The Evolution of Unemployment during Employment Miracles
Graph B: The Evolution of GDP per capita Growth during Employment Miracles
-20
24
6U
nem
ploy
men
t (D
emea
ned
)
-10 -5 0 5 10Time to Miracle - 0 is onset of miracle
The Evolution of Unemployment During Miracles
-2-1
01
2G
row
th (
Dem
eane
d)
-10 -5 0 5 10Time to Miracle - 0 is onset of miracle
The Evolution of Growth During Miracles