14 sept. 2006wqf-spills workgroup1 2005 ssos reported to wqcd: a cursory data scan ravi srivastava,...
TRANSCRIPT
14 Sept. 2006 WQF-Spills workgroup 1
2005 SSOs reported to WQCD: A Cursory Data Scan
Ravi Srivastava, Ph.D., P.E.Boxelder Sanitation District, Ft. Collins, CO
Gary Soldano, P.E.CDPHE-WQCD, Pueblo, CO

14 Sept. 2006 WQF-Spills workgroup 2
• Data Source: Gary Soldano, CDPHE-WQCD Pueblo Office, Pueblo– [email protected]
– 719-545-4650; fax 719-543-8441
• Data Analysis: Ravi Srivastava, Boxelder Sanitation District, Ft. Collins– [email protected]
– 970-498-0604; fax 970-498-0701
14 Sept. 2006 WQF-Spills workgroup 3
This Presentation
• Cursory analysis of 2005 SSO information• Attempting to ask questions like:
– When– How much volume discharged– For how long– How did it occur– Where– Who

14 Sept. 2006 WQF-Spills workgroup 4
Analyses
• Accepted data as is
• Did not examine data for completeness or accuracy
• Simple sorts/analyses to obtain answers to fundamental questions
• All analytical errors are responsibility of Ravi Srivastava

14 Sept. 2006 WQF-Spills workgroup 5
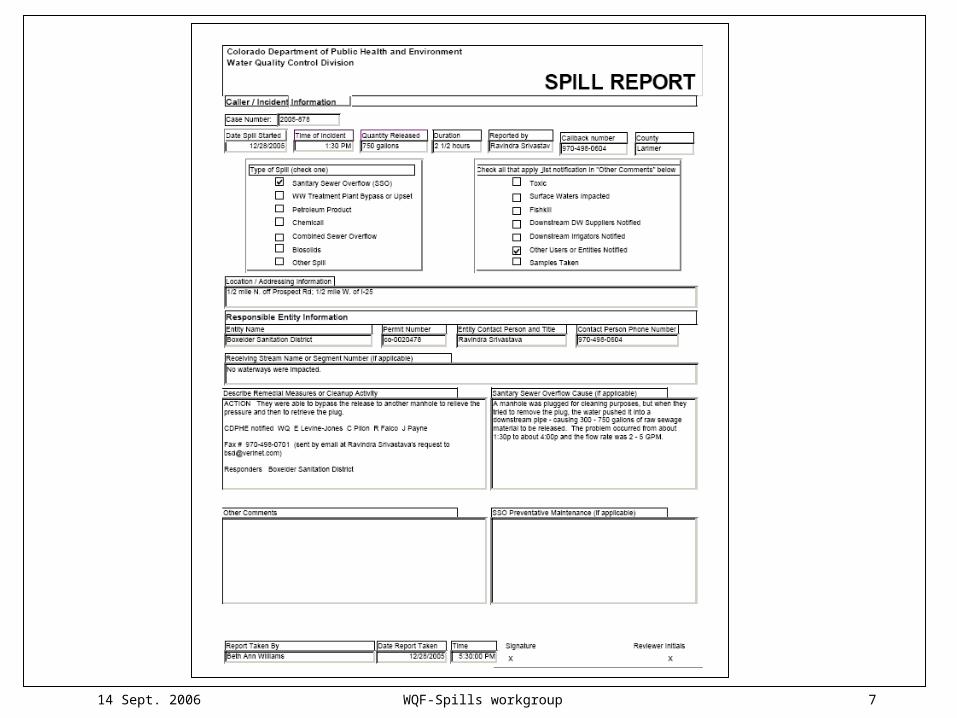
Reporting a Spill
• CDPHE Toll-Free 24-hour Environmental Emergency Spill Reporting Line1-877-518-5608
• On-call responder calls and asks questions
• Follow-up with forms to provide detailed information to WQCD

14 Sept. 2006 WQF-Spills workgroup 6
14 Sept. 2006 WQF-Spills workgroup 7

14 Sept. 2006 WQF-Spills workgroup 8

14 Sept. 2006 WQF-Spills workgroup 9
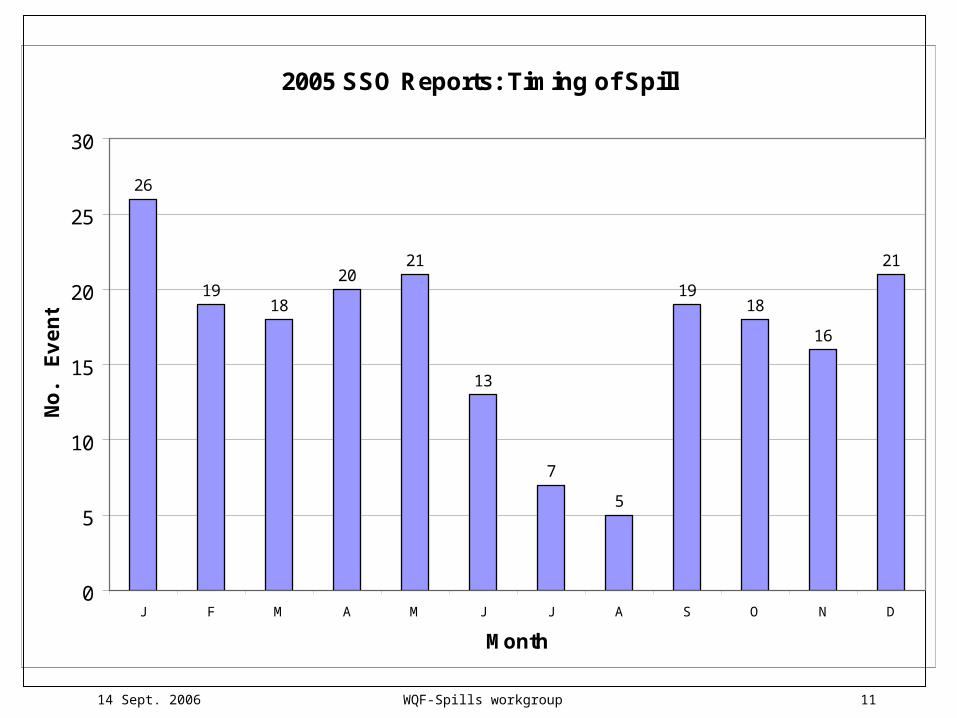
How Many SSOs? When?
• 203 SSOs reported during calendar year 2005
• Lowest # spills in June, July and August; no pattern in total volume of spills by season.

14 Sept. 2006 WQF-Spills workgroup 10
2005: Cumulative No. Reported SSOs
0
50
100
150
200
250
1-Jan 31-Jan 2-Mar 1-Apr 1-May 31-May 30-Jun 30-Jul 29-Aug 28-Sep 28-Oct 27-Nov 27-Dec
Date
Cu
mu
lati
ve #
SS
Os
14 Sept. 2006 WQF-Spills workgroup 11
2005 SSO Reports: Timing of Spill
26
1918
2021
13
7
5
1918
16
21
0
5
10
15
20
25
30
J F M A M J J A S O N D
Month
No
. Ev
en
ts

14 Sept. 2006 WQF-Spills workgroup 12

14 Sept. 2006 WQF-Spills workgroup 13
How Much Spilled?
• Volume from 2/3 gallon to over 2 million gallons; 12 reported with unknown volume
• 40% of SSOs in the 101-1000 gallons range, 30% in the 11-100 range.

14 Sept. 2006 WQF-Spills workgroup 14
2005: Cumulative Volume of Reported SSOs
0
1000000
2000000
3000000
4000000
5000000
6000000
7000000
1-Jan 31-Jan 2-Mar 1-Apr 1-May 31-May 30-Jun 30-Jul 29-Aug 28-Sep 28-Oct 27-Nov 27-Dec
Date
Cu
mu
lati
ve
# S
SO
s

14 Sept. 2006 WQF-Spills workgroup 15
2005: Volume of Reported SSOs
-
500,000
1,000,000
1,500,000
2,000,000
2,500,000
1-Jan 31-Jan 2-Mar 1-Apr 1-May 31-May 30-Jun 30-Jul 29-Aug 28-Sep 28-Oct 27-Nov 27-Dec
Date
Vo
lum
e (
ga
llon
s)

14 Sept. 2006 WQF-Spills workgroup 16
2005: Volume of Reported SSOs
0
1
10
100
1,000
10,000
100,000
1,000,000
10,000,000
1-Jan 31-Jan 2-Mar 1-Apr 1-May 31-May 30-Jun 30-Jul 29-Aug 28-Sep 28-Oct 27-Nov 27-Dec
Date
Vo
lum
e (g
allo
ns
)

14 Sept. 2006 WQF-Spills workgroup 17
2005: Frequency Distribution, Volume of Reported SSOs
0.1 1 10 100 1000 10000 100000 1000000 10000000

14 Sept. 2006 WQF-Spills workgroup 18
2005 SSO Reports: Volume of Spill
25
60
79
23
13
7
2
12
0
10
20
30
40
50
60
70
80
90
0 - 1 2 - 10 11 - 100 101 - 1000 1001 - 10000 10001 -100000
100001 -1000000
1000001 -10000000
unknown
Volume Ranges (gallons)
No
. Ev
en
ts

14 Sept. 2006 WQF-Spills workgroup 19
2005 SSO Reports: Volume of Spill
0 - 11%
2 - 102%
11 - 10030%
101 - 100040%
1001 - 1000011%
10001 - 1000006%
100001 - 10000003%
1000001 - 100000001%
unknown6%
14 Sept. 2006 WQF-Spills workgroup 20
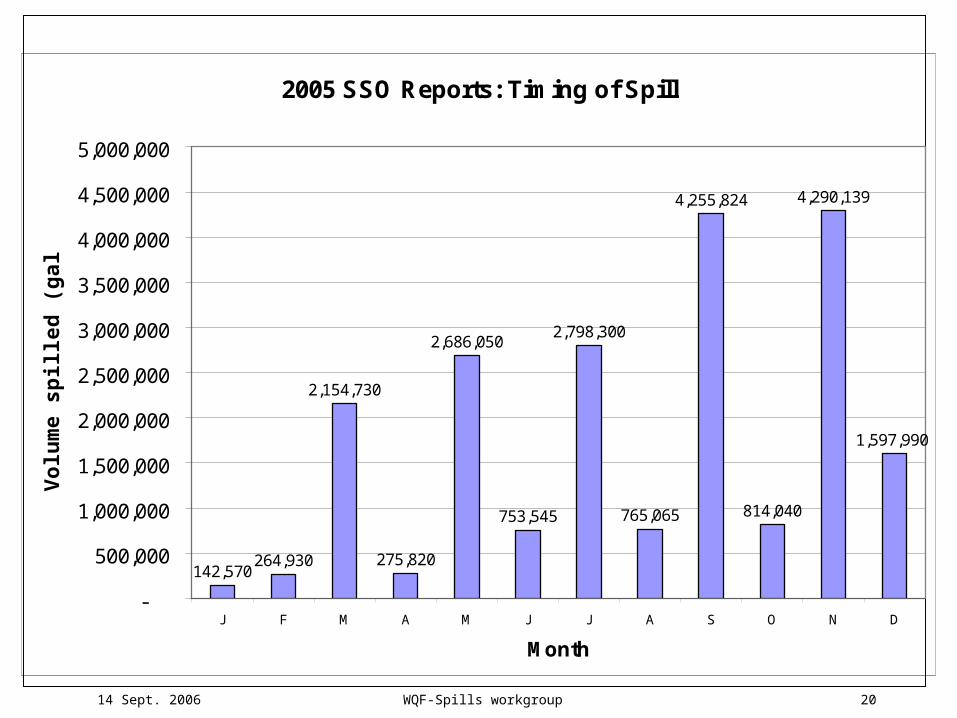
2005 SSO Reports: Timing of Spill
142,570264,930
2,154,730
275,820
2,686,050
753,545
2,798,300
765,065
4,255,824
814,040
4,290,139
1,597,990
-
500,000
1,000,000
1,500,000
2,000,000
2,500,000
3,000,000
3,500,000
4,000,000
4,500,000
5,000,000
J F M A M J J A S O N D
Month
Vo
lum
e s
pill
ed
(g
allo
ns
)

14 Sept. 2006 WQF-Spills workgroup 21
2005 SSO Reports: Volume of Spills, by TimeJ
1%
F1%
M10%
A1%
M13%
J4%
J13%
A4%
S20%
O4%
N21%
D8%
14 Sept. 2006 WQF-Spills workgroup 22
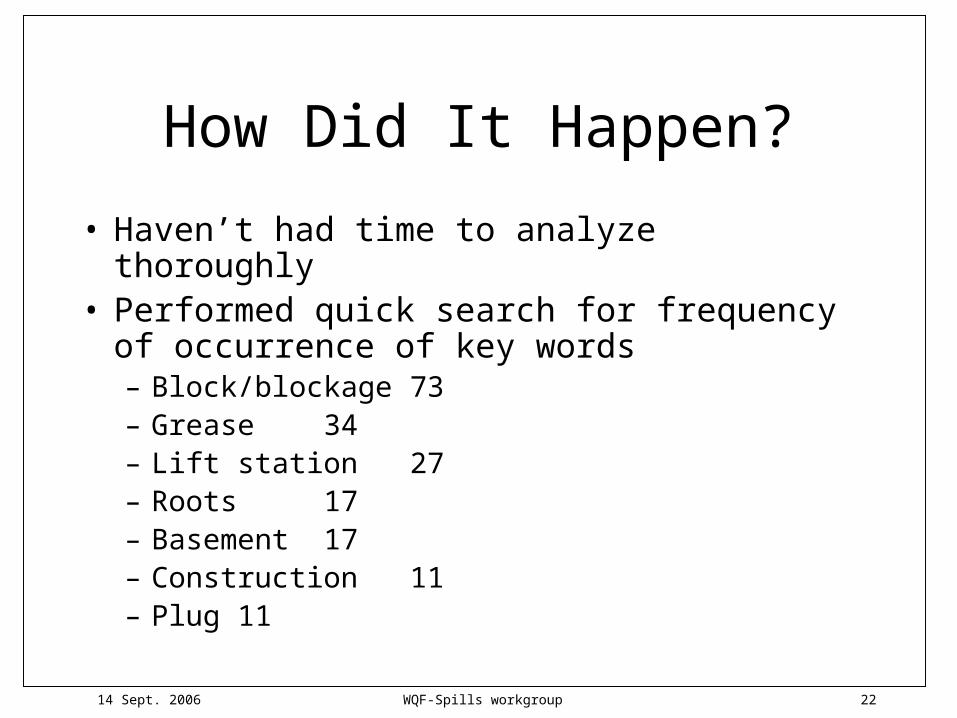
How Did It Happen?
• Haven’t had time to analyze thoroughly• Performed quick search for frequency of
occurrence of key words– Block/blockage 73– Grease 34– Lift station 27– Roots 17– Basement 17– Construction 11– Plug 11

14 Sept. 2006 WQF-Spills workgroup 23
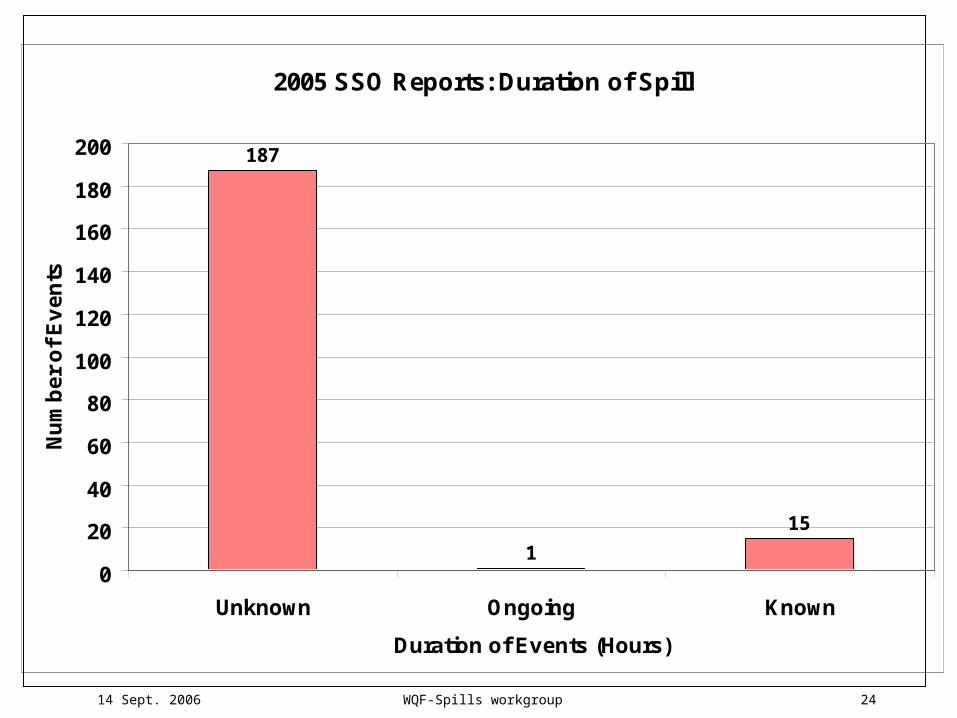
Spill Duration?
• Duration known for < 10% of reported events
• Vast majority of unknown duration
• Known duration range from < 1 hr to > 100 hr
14 Sept. 2006 WQF-Spills workgroup 24
2005 SSO Reports: Duration of Spill
187
1
15
0
20
40
60
80
100
120
140
160
180
200
Unknown Ongoing Known
Duration of Events (Hours)
Nu
mb
er
of
Ev
en
ts

14 Sept. 2006 WQF-Spills workgroup 25
2005 SSO Reports: Duration of Spill
6
7
1 1
0
1
2
3
4
5
6
7
8
0 - 1 1 - 10 10 - 100 100 - 250
Duration of Events (Hours)
Nu
mb
er
of
Ev
en
ts

14 Sept. 2006 WQF-Spills workgroup 26
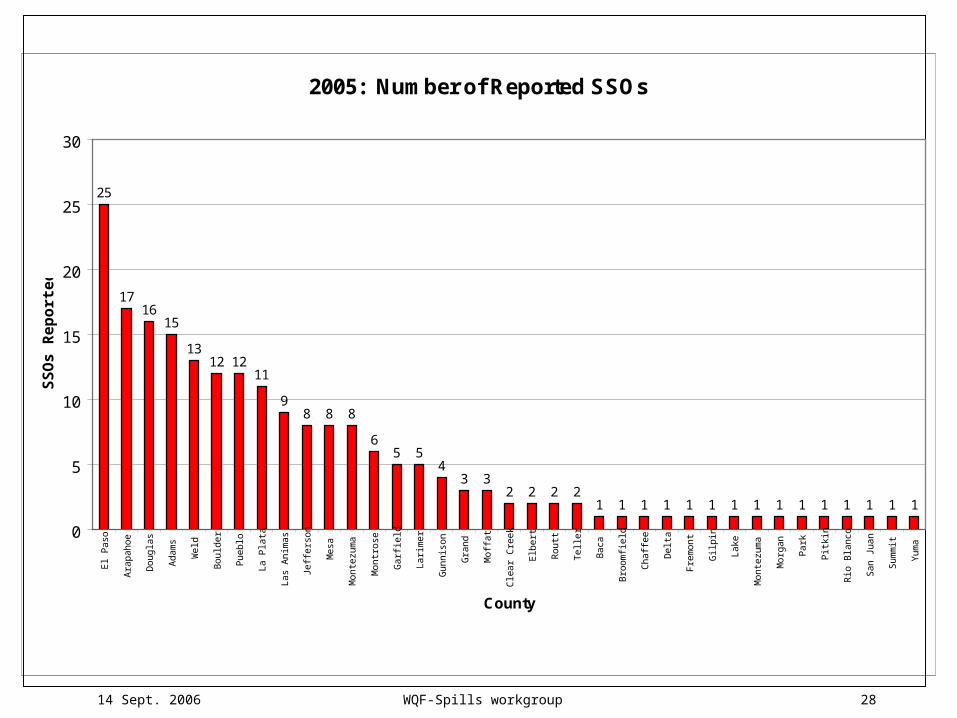
Where?
• El Paso, Arapahoe, Douglas, Adams, Weld counties are the top 5 by no. spills
• El Paso, Arapahoe, Gunnison, Larimer, and Las Animas are the top 5 by spill volumes

14 Sept. 2006 WQF-Spills workgroup 27
2005: Number of Reported SSOs
15
17
1
12
1 12
1
16
25
21
5
1
34
8
11
1
5
98
3
1
8
6
1 1 1
12
12
1 12
13
1
0
5
10
15
20
25
30
Ad
am
s
Ara
pa
ho
e
Ba
ca
Bo
uld
er
Bro
om
field
Ch
aff
ee
Cle
ar
Cre
ek
De
lta
Do
ug
las
El P
aso
Elb
ert
Fre
mo
nt
Ga
rfie
ld
Gilp
in
Gra
nd
Gu
nn
iso
n
Jeff
ers
on
La
Pla
ta
La
ke
La
rime
r
La
s A
nim
as
Me
sa
Mo
ffa
t
Mo
nte
zum
a
Mo
nte
zum
a
Mo
ntr
ose
Mo
rga
n
Pa
rk
Pitk
in
Pu
eb
lo
Rio
Bla
nco
Ro
utt
Sa
n J
ua
n
Su
mm
it
Telle
r
We
ld
Yu
ma
County
SS
Os
Rep
ort
ed
14 Sept. 2006 WQF-Spills workgroup 28
2005: Number of Reported SSOs
25
1716
15
1312 12
11
98 8 8
65 5
43 3
2 2 2 21 1 1 1 1 1 1 1 1 1 1 1 1 1 1
0
5
10
15
20
25
30
El P
aso
Ara
pa
ho
e
Do
ug
las
Ad
am
s
We
ld
Bo
uld
er
Pu
eb
lo
La
Pla
ta
La
s A
nim
as
Jeff
ers
on
Me
sa
Mo
nte
zum
a
Mo
ntr
ose
Ga
rfie
ld
La
rime
r
Gu
nn
iso
n
Gra
nd
Mo
ffa
t
Cle
ar
Cre
ek
Elb
ert
Ro
utt
Telle
r
Ba
ca
Bro
om
field
Ch
aff
ee
De
lta
Fre
mo
nt
Gilp
in
La
ke
Mo
nte
zum
a
Mo
rga
n
Pa
rk
Pitk
in
Rio
Bla
nco
Sa
n J
ua
n
Su
mm
it
Yu
ma
County
SS
Os
Rep
ort
ed

14 Sept. 2006 WQF-Spills workgroup 29
2005: Volume of Reported SSOs
48
,18
5
1,2
09
,82
0
50
0
4,1
00
25
40
,00
0
11,0
00
50
,00
0
14
,32
5
2,7
01
,52
4
6,0
00
10
0
5,7
00
1,2
00
1,6
20
75
0,1
00
11,0
65
1,9
50
56
8,9
50
28
2,8
10
17
,60
0
30
0
50
1,2
80
4,2
80
10
0
1,0
00
56
,97
5
4,1
00
70
0
50
0 80
0
3,0
00
3,4
70
85
,00
0
1
10
100
1,000
10,000
100,000
1,000,000
10,000,000
Ad
am
s
Ara
pa
ho
e
Ba
ca
Bo
uld
er
Bro
om
field
Ch
aff
ee
Cle
ar
Cre
ek
De
lta
Do
ug
las
El P
aso
Elb
ert
Fre
mo
nt
Ga
rfie
ld
Gilp
in
Gra
nd
Gu
nn
iso
n
Jeff
ers
on
La
Pla
ta
La
ke
La
rime
r
La
s A
nim
as
Me
sa
Mo
ffa
t
Mo
nte
zum
a
Mo
nte
zum
a
Mo
ntr
ose
Mo
rga
n
Pa
rk
Pitk
in
Pu
eb
lo
Rio
Bla
nco
Ro
utt
Sa
n J
ua
n
Su
mm
it
Telle
r
We
ld
Yu
ma
County
SS
Os
Rep
ort
ed

14 Sept. 2006 WQF-Spills workgroup 30
2005: Volume of Reported SSOs
2,7
01
,52
4
1,2
09
,82
0
75
0,1
00
56
8,9
50
28
2,8
10
85
,00
0
56
,97
5
50
,00
0
48
,18
5
40
,00
0
17
,60
0
14
,32
5
11,0
65
11,0
00
6,0
00
5,7
00
4,2
80
4,1
00
4,1
00
3,4
70
3,0
00
1,9
50
1,6
20
1,2
80
1,2
00
1,0
00
80
0
70
0
50
0
50
0
30
0
10
0
10
0
50
25
1
10
100
1,000
10,000
100,000
1,000,000
10,000,000
El P
aso
Ara
pa
ho
e
Gu
nn
iso
n
La
rime
r
La
s A
nim
as
Yu
ma
Pu
eb
lo
De
lta
Ad
am
s
Ch
aff
ee
Me
sa
Do
ug
las
Jeff
ers
on
Cle
ar
Cre
ek
Elb
ert
Ga
rfie
ld
Mo
ntr
ose
Bo
uld
er
Rio
Bla
nco
We
ld
Telle
r
La
Pla
ta
Gra
nd
Mo
nte
zum
a
Gilp
in
Pa
rk
Su
mm
it
Ro
utt
Ba
ca
Sa
n J
ua
n
Mo
ffa
t
Fre
mo
nt
Mo
rga
n
Mo
nte
zum
a
Bro
om
field
La
ke
Pitk
in
County
Vo
lum
e o
f S
SO
s R
epo
rted

14 Sept. 2006 WQF-Spills workgroup 31
Who?
• Top 5 entities with highest no. of SSOs reported– Colorado Springs Utilities,
– City of Durango,
– Cortez Sanitation District,
– City of Evans, and
– City of Trinidad
• 12 events were reported with unknown volume of SSOs

14 Sept. 2006 WQF-Spills workgroup 32
2005: Number of Reported SSOs
18
109 9
76
54 4
3 3 3 3 3 32 2 2 2 2 2 2 2 2 2 2
0
2
4
6
8
10
12
14
16
18
20
Co
lora
do
Sp
ring
s U
tiliti
es
Du
ran
go
, C
ity o
f
Co
rte
z S
an
itatio
n D
istr
ict
Eva
ns,
City
of
Trin
ida
d,
City
of
Mo
ntr
ose
, C
ity o
f
Pu
eb
lo,
City
of
Pa
rke
r W
ate
r &
Sa
nita
tion
Dis
tric
t
Un
kno
wn
Brig
hto
n,
City
of
Ca
stle
Ro
ck,
Tow
n o
f
Ea
st C
he
rry
Cre
ek
Va
lley
Wa
ter
& S
an
itatio
n
Me
tro
Wa
ste
wa
ter
Re
cla
ma
tion
Dis
tric
t
Mt.
Cre
ste
d B
utt
e W
ate
ra
nd
Sa
nita
tion
Th
orn
ton
, C
ity o
f
Au
rora
, C
ity o
f
Bo
on
e,
Tow
n o
f
Bo
uld
er,
City
of
Brig
hto
n,
City
of
- U
tiliti
es
Ce
ntr
al G
ran
d V
alle
yS
an
itatio
n
Fo
rt C
olli
ns,
City
of
Gra
nd
Ju
nct
ion
, C
ity o
f
Gre
ele
y, C
ity o
f
Lo
ng
mo
nt,
City
of
U.
S. A
rmy
- F
ort
Ca
rso
n
Wid
efie
ld W
ate
r &
Sa
nita
tion
Dis
tric
t
Entity
SS
Os
Rep
ort
ed

14 Sept. 2006 WQF-Spills workgroup 33
Who?
• Top 5 entities with highest volume of SSOs reported– US Army-Ft. Carson,
– East Cherry Creek Water and San,
– Mt. Crested Butte Water and San.,
– Colorado Springs Utilities,
– Ft. Collins Utilities Water Treatment
• 12 events were reported with unknown volume of SSOs

14 Sept. 2006 WQF-Spills workgroup 34
2005: Volume of Reported SSOs
2,0
00
,50
0
1,2
05
,05
0
75
0,0
00
48
7,2
24
41
7,0
00
28
2,7
60
20
0,0
00
15
0,3
00
85
,00
0
50
,30
0
50
,00
0
43
,60
0
40
,00
0
14
,00
0
12
,60
0
10
,00
0
6,0
00
6,0
00
5,8
00
5,0
00
5,0
00
4,2
80
4,1
00
3,0
00
3,0
00
2,7
00
2,5
00
2,2
80
2,0
00
-
500,000
1,000,000
1,500,000
2,000,000
2,500,000
U.
S. A
rmy
- F
ort
Ca
rso
n
Ea
st C
he
rry
Cre
ek
Wa
ter
an
d S
an
itatio
n D
istr
ict
Mt.
Cre
ste
d B
utt
e W
ate
r a
nd
Sa
nita
tion
Co
lora
do
Sp
ring
s U
tiliti
es
Ft.
Co
llin
s U
tiliti
es
Wa
ter
Tre
atm
en
t
Trin
ida
d,
City
of
Se
curit
y S
an
itatio
n D
istr
ict
Fo
rt C
olli
ns,
City
of
Yu
ma
, C
ity o
f -
Pu
blic
Wo
rks
Bo
on
e,
Tow
n o
f
Ce
da
red
ge
, To
wn
of
Brig
hto
n,
City
of
Bu
en
a V
ista
Sa
nita
tion
Dis
tric
t
Tow
n o
f F
ruita
Wid
efie
ld W
ate
r &
Sa
nita
tion
Dis
tric
t
Ro
xbo
rou
gh
Pa
rk M
etr
o D
istr
ict
Eco
Re
sou
rce
s, I
nc.
HC
L E
ng
ine
erin
g
Pu
eb
lo,
City
of
Ge
org
eto
wn
, To
wn
of
Go
ld C
ree
k W
ast
ew
ate
r T
rea
tme
nt
Pla
nt
Mo
ntr
ose
, C
ity o
f
Me
eke
r S
an
itatio
n D
istr
ict
Gle
nw
oo
d S
prin
gs,
City
of
Wo
od
lan
d P
ark
, To
wn
of
Co
ors
Bre
we
ry C
o.
Bo
uld
er,
City
of
Pa
rke
r W
ate
r &
Sa
nita
tion
Dis
tric
t
We
stm
inst
er,
City
of
Entity
Vo
lum
e R
epo
rted
(g
al.)

14 Sept. 2006 WQF-Spills workgroup 35
Looking Back
• Cursory analysis• Know a bit about when, where, how SSOs
occurred, how much spilled, duration of SSO, responsible party
• Data probably a partial subset of actual SSOs• Suspect
– underreporting on occurrence [see next graph]
– error in volume/duration

14 Sept. 2006 WQF-Spills workgroup 36
Reported SSOs in WQCD Database
1 0 0 2 623
5279 88
153
192 203
164
0
50
100
150
200
250
1994 1995 1996 1997 1998 1999 2000 2001 2002 2003 2004 2005 16-Aug-06