document1
DESCRIPTION
Jurnal shaking tableTRANSCRIPT

KSCE Journal of Civil Engineering (2015) 19(1):142-150
Copyright ⓒ2015 Korean Society of Civil Engineers
DOI 10.1007/s12205-014-1221-8
− 142 −
pISSN 1226-7988, eISSN 1976-3808
www.springer.com/12205
Structural Engineering
An Experimental Study on Shaking Table Tests on Models of
a Concrete Gravity Dam
Bupavech Phansri*, Sumetee Charoenwongmit**, Ekkachai Yooprasertchai***, Kyung-Ho Park****,
Pennung Warnitchai*****, and Dong-Hun Shin******
Received August 27, 2010/Revised June 9, 2013/Accepted January 11, 2014/Published Online July 7, 2014
··································································································································································································································
Abstract
This study deals with the shaking table tests for two small-scale models (Model #1 and Model #2) of a concrete gravity dam, whichhas been planned for the construction with the recommendation of the peak ground acceleration of the maximum credible earthquakeof 0.42 g. The development of bentonite-concrete mixture material, which matches the similitude requirements between theprototype and the model, is discussed. Two types of excitation, resonance test and ambient test, were conducted to investigate theresonant frequency, the maximum failure acceleration and the crack initiation/propagation. In both models, large amplification wasobserved at around 24-28 Hz. The crack initiated at the slope changing point and then propagated around the neck area. The crackfailures were occurred at the base acceleration of 0.55 g-0.65 g.
Keywords: concrete gravity dam, shaking table model test, bentonite-concrete mixture, crack
··································································································································································································································
1. Introduction
While concrete dams have been designed to withstand both
static and seismic loading, some concrete dams have been
damaged due to the strong ground motion, for example Koyna
Dam, India, 1967; Hsingfengkiang Dam, China, 1962; Sefid Rud
Dam, Iran, 1990.
For concrete gravity dams designed according to current design
criteria, the static and earthquake compressive stresses are
generally much less than the compressive strength of the concrete.
However, linear dynamic analyses of gravity dams show that the
earthquake ground motion can produce tensile stresses that
exceed the tensile strength of the mass concrete (Wieland, 2003;
Wieland et al., 2003). Therefore, the nonlinear tensile cracking
must be considered in the seismic response of concrete gravity
dams.
Shaking table model tests have been used to investigate the
nonlinear response effected by earthquake such as cracking, joint
opening, sliding behavior under high compression, and cavity in
the water (Bakhtin and Dumenko, 1979; Niwa and Clough,
1980; Donlon, 1989; Hall, 1989; Donlop and Hall, 1991; Lin et
al., 1993; Zadnik and Paskalov, 1992; Zadnik, 1994; Mir and
Taylor, 1995,1996; Ghobarah and Ghaemina, 1998; Harris et al.,
2000; Tinawi et al., 2000; Li et al., 2005; Ghaemmaghami and
Ghaemian, 2008). One of the main difficulties in the shaking
table tests is to development the model material which matches
the similitude requirements between the prototype and the model
by reducing the reduced strength and stiffness by the product of
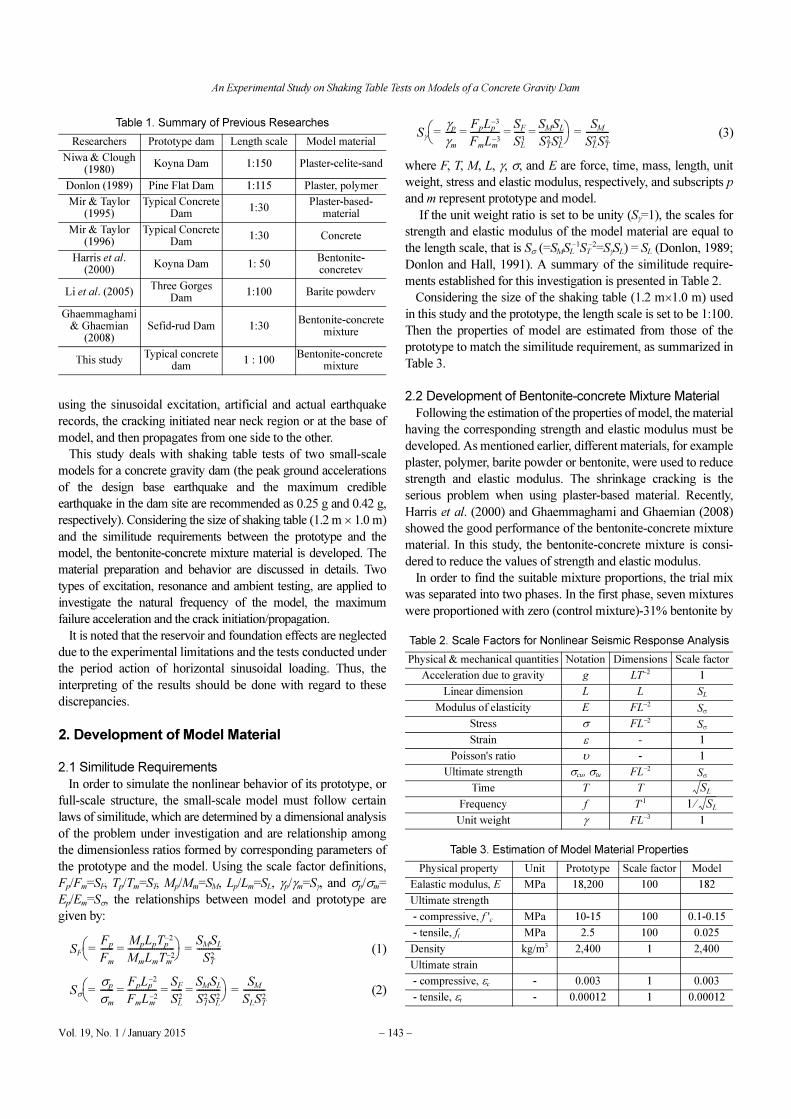
the density and length scale. Table 1 summarizes previous
studies in terms of model materials and length scale used to
satisfy the similitude requirements. It can be seen from Table 1
that different materials, such as plaster, polymer, barite powder,
bentonite, as well as concrete, were used with the length scale of
1:30-1:150. Of particular interest is the tensile behaviour of the
material, such as ultimate tensile strength and elastic modulus.
Although some previous researches reported the success in the
development of the proper material, the behaviour of bentonite-
concrete mixture material, used for small scale concrete dam
models in shaking table tests, has not been adequately addressed
in the literature, especially for the similitude requirements of
properties, such as tensile strength and elastic modulus.
The other important issue is the initiation of crack and its
propagation for the evaluation of seismic response of dams.
From the comparison of the crack patterns in the previous tests
TECHNICAL NOTE
*Lecturer, Civil Engineering Dept., Faculty of Engineer, Rajamangala University of Technology Lanna, Chiang Mai 50000, Thailand (E-mail: bupavech
@rmutl.ac.th)
**Engineer, Provincial Waterworks Authority Region 10, Bangkok 10210, Thailand (E-mail: [email protected])
***Doctoral Student, School of Engineering & Technology, Asian Institute of Technology, Pathumthani 12120, Thailand (E-mail: [email protected])
****Member, Engineer, Bon E&C Co. Ltd., Korea (Corresponding Author, E-mail: [email protected])
*****Associated Professor, School of Engineering & Technology, Asian Institute of Technology, Pathumthani 12120, Thailand (E-mail: [email protected])
******Member, Head Researcher, K-water Institute, Korea Water Resources Corporation, Daejeon 305-730, Korea (E-mail: [email protected])
An Experimental Study on Shaking Table Tests on Models of a Concrete Gravity Dam
Vol. 19, No. 1 / January 2015 − 143 −
using the sinusoidal excitation, artificial and actual earthquake
records, the cracking initiated near neck region or at the base of
model, and then propagates from one side to the other.
This study deals with shaking table tests of two small-scale
models for a concrete gravity dam (the peak ground accelerations
of the design base earthquake and the maximum credible
earthquake in the dam site are recommended as 0.25 g and 0.42 g,
respectively). Considering the size of shaking table (1.2 m × 1.0 m)
and the similitude requirements between the prototype and the
model, the bentonite-concrete mixture material is developed. The
material preparation and behavior are discussed in details. Two
types of excitation, resonance and ambient testing, are applied to
investigate the natural frequency of the model, the maximum
failure acceleration and the crack initiation/propagation.
It is noted that the reservoir and foundation effects are neglected
due to the experimental limitations and the tests conducted under
the period action of horizontal sinusoidal loading. Thus, the
interpreting of the results should be done with regard to these
discrepancies.
2. Development of Model Material
2.1 Similitude Requirements
In order to simulate the nonlinear behavior of its prototype, or
full-scale structure, the small-scale model must follow certain
laws of similitude, which are determined by a dimensional analysis
of the problem under investigation and are relationship among
the dimensionless ratios formed by corresponding parameters of
the prototype and the model. Using the scale factor definitions,
Fp/Fm=SF, Tp/Tm=ST, Mp/Mm=SM, Lp/Lm=SL, γp/γm=Sγ, and σp/σm=
Ep/Em=Sσ, the relationships between model and prototype are
given by:
(1)
(2)
(3)
where F, T, M, L, γ, σ, and E are force, time, mass, length, unit
weight, stress and elastic modulus, respectively, and subscripts p
and m represent prototype and model.
If the unit weight ratio is set to be unity (Sγ=1), the scales for
strength and elastic modulus of the model material are equal to
the length scale, that is Sσ (=SMSL−1ST
−2=SγSL) = SL (Donlon, 1989;
Donlon and Hall, 1991). A summary of the similitude require-
ments established for this investigation is presented in Table 2.
Considering the size of the shaking table (1.2 m×1.0 m) used
in this study and the prototype, the length scale is set to be 1:100.
Then the properties of model are estimated from those of the
prototype to match the similitude requirement, as summarized in
Table 3.
2.2 Development of Bentonite-concrete Mixture Material
Following the estimation of the properties of model, the material
having the corresponding strength and elastic modulus must be
developed. As mentioned earlier, different materials, for example
plaster, polymer, barite powder or bentonite, were used to reduce
strength and elastic modulus. The shrinkage cracking is the
serious problem when using plaster-based material. Recently,
Harris et al. (2000) and Ghaemmaghami and Ghaemian (2008)
showed the good performance of the bentonite-concrete mixture
material. In this study, the bentonite-concrete mixture is consi-
dered to reduce the values of strength and elastic modulus.
In order to find the suitable mixture proportions, the trial mix
was separated into two phases. In the first phase, seven mixtures
were proportioned with zero (control mixture)-31% bentonite by
SF
Fp
Fm
------=MpLpTp
2–
MmLmTm2–
---------------------=⎝ ⎠⎛ ⎞ SMSL
ST2
-----------=
Sσ
σp
σm
------=FpLp
2–
FmLm2–
-------------SF
SL2
-----SMSL
ST2SL
2-----------= = =⎝ ⎠
⎛ ⎞ SM
SLST2
----------=
Sγ
γp
γm
-----=FpLp
3–
FmLm3–
-------------SF
SL3
-----SMSL
ST2SL
3-----------= = =⎝ ⎠
⎛ ⎞ SM
SL2ST
2----------=
Table 1. Summary of Previous Researches
Researchers Prototype dam Length scale Model material
Niwa & Clough (1980)
Koyna Dam 1:150 Plaster-celite-sand
Donlon (1989) Pine Flat Dam 1:115 Plaster, polymer
Mir & Taylor (1995)
Typical Concrete Dam
1:30Plaster-based-
material
Mir & Taylor (1996)
Typical Concrete Dam
1:30 Concrete
Harris et al. (2000)
Koyna Dam 1: 50Bentonite-concretev
Li et al. (2005)Three Gorges
Dam1:100 Barite powderv
Ghaemmaghami & Ghaemian
(2008)Sefid-rud Dam 1:30
Bentonite-concrete mixture
This studyTypical concrete
dam1 : 100
Bentonite-concrete mixture
Table 2. Scale Factors for Nonlinear Seismic Response Analysis
Physical & mechanical quantities Notation Dimensions Scale factor
Acceleration due to gravity g LT−2 1
Linear dimension L L SL
Modulus of elasticity E FL−2Sσ
Stress σ FL−2Sσ
Strain ε - 1
Poisson's ratio υ - 1
Ultimate strength σcu, σtu FL−2Sσ
Time T T
Frequency f T-1
Unit weight γ FL−3 1
Table 3. Estimation of Model Material Properties
Physical property Unit Prototype Scale factor Model
Ealastic modulus, E MPa 18,200 100 182
Ultimate strength
- compressive, f 'c MPa 10-15 100 0.1-0.15
- tensile, ft MPa 2.5 100 0.025
Density kg/m3 2,400 1 2,400
Ultimate strain
- compressive, εc - 0.003 1 0.003
- tensile, εt - 0.00012 1 0.00012
SL
1 SL⁄

Bupavech Phansri, Sumetee Charoenwongmit, Ekkachai Yooprasertchai, Kyung-Ho Park, Pennung Warnitchai, and Dong-Hun Shin
− 144 − KSCE Journal of Civil Engineering
mass of cement plus bentonite. The binder (cement+bentonite)
content was reduced from 178 kg/m3 to around 119 kg/m3 for
Mix 5, 6, and 7 (Table 4). Cement, bentonite and aggregates were
obtained from local commercial suppliers.
The trial mixes were made in the laboratory. Standard 10 cm×20 cm cylinders were made from each batch to identify required
properties. Elastic modulus and Poisson's ratio are determined
from two strain gages (vertical and horizontal direction) at 7 and
28 day's age. They are calculated from stress-strain values
corresponding to an initial strain of 50×10−6 mm/mm and the
strain at 40 % of the ultimate compressive strength.
The influence of w/c ratio and % bentonite on material is
shown in Fig. 1. The percentage of bentonite largely effects on
the properties of material. Elastic modulus and strength decrease
with increasing w/c ratio. In order to match the requirements,
such as E = 182 MPa, ft = 0.025 MPa and fc' = 0.1-0.15 MPa,
about 31% of bentonite is needed. It is noted that 20-25% of
bentonite was used in the previous studies (Harris et al., 2000;
Ghaemmaghami and Ghaemian, 2008).
Based on these results, the second concrete mixture proportions
were prepared for small-scale dam models by varying other
components, for example, content of fine or coarse aggregate.
The mixture components are summarized in Table 5.
In this study, two dam models (Model #1 and Model #2) were
constructed. Three batches were mixed in each model and nine
standard 10cm×20cm cylinders were collected from each batch
to identify the physical properties and the stress-strain curves.
Compressive strength was obtained from compression test at 28
days after casting. Ultimate tensile strength of specimens was
obtained using two different methods: direct tensile method and
splitting tensile method. Stress-strain curves of tensile and com-
pressive tests are shown in Figs. 2 and 3, respectively. The
physical properties of the mixture are summarized in Table 6,
and Table 7 shows the comparison of relative errors of physical
properties in the previous studies and this study. In Table 6, the
values of the modulus of elasticity for tensile test were estimated
from the stress-strain curves of Specimen-1 and -2 in Fig. 2.
Of particular interest is the tensile behavior of the bentonite-
concrete mixture material. In Fig. 2, the stress-strain curves from
tensile tests show different behavior between plastic and brittle
behavior. Model #1 shows the behavior between softening-
plastic and brittle, while in Model #2 the strength suddenly drops
after the peak value. Although the value of ultimate tensile
strength is close to the target value, the values of ultimate tensile
Table 4. Bentonite-concrete Mixture Proportions
Mix 1 (kg/m3)
(Control)
Mix2 (kg/m3)
Mix3 (kg/m3)
Mix4 (kg/m3)
Mix5 (kg/m3)
Mix6 (kg/m3)
Mix7 (kg/m3)
Water 258 309 314 332 332 319 366
Cement 178 160 151 142 95 91.5 81.3
Bentonite 0 18 27 36 24 27.5 36.5
Bentonite(%)
0% 10% 15% 20% 20% 23% 31%
FineAggregate
866 798 797 773 810 811 1057
CoarseAggregate
873 806 804 780 820 820 1060
w/c 1.45 1.93 2.08 2.34 3.49 3.49 4.5
w/b 1.45 1.74 1.76 1.87 2.79 2.68 3.11
Weight (kg) 2175 2091 2093 2063 2081 2069 2601
Fig. 1. Influence of w/c Ratio and % Bentonite on Material (Trial
Mix): (a) Ultimate Compressive Strength and w/c Ratio, (b)
Ultimate Tensile Strength and w/c Ratio, (c) Modulus of Elas-
ticity and w/c Ratio
Table 5. Bentonite-concrete Mixture of Dam Models
Component
Actual model mix
Model mix(kg/m3)
Volume in mixper 0.065 m3 batch
Water 404.46 26
Cement 81.23 5.28
Bentonite 36.46 2.37
Fine Aggregate 1,056.92 68.70
Coarse Aggregate (No.4-3/8''): wet 1,060.00 68.90
w/c 4.98
w/b 3.44
Weight (kg) 2,639.08 171.54

An Experimental Study on Shaking Table Tests on Models of a Concrete Gravity Dam
Vol. 19, No. 1 / January 2015 − 145 −
strain and the modulus of elasticity are different. The modulus of
elasticity obtained from the compressive tests is 65-136 times
higher than that obtained from the tensile tests. These values of
modulus of elasticity show larger relative error than those in the
previous studies, as shown in Table 7. It can be described that
satisfying all the similitude requirements is quite difficult.
3. Experiment Set-up and Procedure
The small-scale model was constructed on the floor, mounted
on a shake table and excited in a single axis corresponding to a
horizontal motion along the upstream-downstream axis. The
shaking table was calibrated to determine the actual response
with the frequency range of 2-30 Hz. A sinusoidal excitation was
selected for practical reasons associated with the shaking table.
Fig. 4 shows the dam model mounted on the shaking table. The
base of model was fixed on the shaking table by using steel plate
connected with nut and steel bar. Instrumentation was designed
to measure displacements, strains and accelerations on the model
and from the input actuator. The locations of accelerometer,
strain guage and LVDT for two models are shown in Fig. 5.
The geometry and the mixture proportion for both Model #1
and Model #2 are same, while their tensile behaviors are
different as mentioned in the previous section. In Model #2, the
locations of strain gauges (STR) are changed near the neck
region to observe the cracking.
The test program consisted of two phases: (1) resonance test
Fig. 2. Stress-strain Curves from Tensile Tests: (a) Model #1, (b)
Model #2
Fig. 3. Stress-strain Curves from Compressive Tests: (a) Model
#1, (b) Model #2
Table 6. Properties of Dam Models
Physical & mechanical properties
UnitTargetValue
Actual modelmix at 28 days
Model 1 Model 2
Ultimate compressive strength, f 'c
MPa 0.1-0.15 0.317 0.399
Ultimate tensile strength, ft MPa 0.025
- Direct tensile 0.029 0.054
- Splitting tensile 0.0135 0.0103
Elastic modulus, E MPa 182
- Ec : Compressive test 1,798 906
- Et : Tensile test 13 14
Mass density, ρ kg/m3 2,400 1,907 1,937
Ultimate compressive strain, εc 0.003 0.00139 0.00262
Ultimate tensile strain, εt 0.00012 0.00495 0.00429
Poisson ratio - - 0.203 0.193
Table 7. Relative Error in Physical Properties
Physical & mechanical properties
Relative error (%)*
Harris et al. (2000)
Ghaemmaghami& Ghaemain
(2008)
This study
Model1
Model2
Ultimate compressive strength, f'c
90.1 34.5 153.6 219.2
Ultimate tensile strength, ft
- Direct tensile 16.0 116.0
- Splitting tensile 146.9 -47.7 -46.0 -58.8
Elastic modulus, E
- Ec : Compressive test -32.2 -26.5 887.7 397.7
- Et : Tensile test -92.8 -92.2
Mass density, ρ -10.0 -20.5 -19.3
Ultimate compressive strain, εc
100.0 -53.7 -12.7
Ultimate tensile strain, εt 4,025 3,475
*Relative error (%) = (actual value – target value)/(target value) × 100

Bupavech Phansri, Sumetee Charoenwongmit, Ekkachai Yooprasertchai, Kyung-Ho Park, Pennung Warnitchai, and Dong-Hun Shin
− 146 − KSCE Journal of Civil Engineering
and (2) ambient test. First, the resonance test was conducted to
determine the resonant frequency. The model response was
recorded at even frequencies from 2 to 30 Hz with a constant
input acceleration of 0.05 g. Second, the ambient test was con-
ducted to determine the maximum acceleration for the failure
and investigate the crack initiation/propagation. The model was
shaken up to the failure at the lowest resonant frequency, increas-
ing the acceleration amplitude from 0.05 g to failure. In each
step, the acceleration amplitude was increased by 0.0125 g and
held 5 seconds.
4. Test Results
4.1 Resonance Test: Fundamental Mode
The acceleration and normalized relative displacement at the
top of the model along the excitation axis at even frequencies
from 10 to 30 Hz are shown in Figs. 6 and 7, respectively. The
normalized relative displacement (NRD) is defined as:
(4)
In Model #1, the first amplification of acceleration and normalized
relative displacement is noticed around 14-16 Hz and the second
large amplification around 24-28 Hz. In Model #2, the amplifica-
tion is noticed from 14 Hz and large amplification is observed
around 24-28 Hz. This range of amplification can be expected
because of the different mode shapes, for example the same
direction of excitation or out of plane. Harris et al. (2000) showed
the different mode shapes, such as 14 Hz with out of plane and
28 Hz with the same direction of excitation, through the
numerical analysis. They conducted the shaking table test with
the fundamental mode of out of plane, 14 Hz (approximately 2
Hz frequency for the Koyna event).
Based on the resonance tests, two different sinusoidal motions
were chosen for ambient test: 14 Hz for Model #1 and 28 Hz for
NRD %( )
Disp. at the top LVDT 4–( ) Disp. at the bottom LVDT 1–( )–{ }
Disp. at the bottom LVDT 1–( )------------------------------------------------------------------------------------------------------------------------------------------------------ 100×=
Fig. 4. Model Mounted on the Shaking Table
Fig. 5. Instrumentation Locations (unit: m): (a) Model #1, (b) Model
#2
Fig. 6. Resonance Test: Horizontal Acceleration: (a) Model #1, (b)
Model #2

An Experimental Study on Shaking Table Tests on Models of a Concrete Gravity Dam
Vol. 19, No. 1 / January 2015 − 147 −
Model #2. Those are scaled to 1.4 Hz and 2.8 Hz frequency events.
In order to investigate the effect of different values of elastic
modulus on the mode shape and frequency, frequency extraction
analysis is conducted by using the finite element software
ABAQUS (2004). The results of mode shape and frequency are
summarized in Table 8. In Table 8, Prototype indicates the results
with real dam size and E=18,200 MPa, while Prototype(scale),
Model #1, and Model #2 indicate the results with the small scale
size and E=182, 13, and 14 MPa, respectively. The mode shapes
are very similar because of the same shape of each model. As
expected from similitude requirements, the frequency of Prototype
is less than ten times than that of Prototype(scale). For Model #1
and Model #2 the frequencies of the first and second modes are
7.55-7.77 Hz and 18.94-19.53 Hz, while 25.06 Hz and 62.84 Hz
for Prototype(scale). It is noted that the frequency of 28 Hz, used
for ambient test of Model #2, is very close to that of the first
mode in Prototype(scale). The frequency of 14 Hz, used for
ambient test of Model #1, is within the range of the frequencies
of the first and second modes in Model #1 and Model #2.
4.2 Ambient Test: Maximum Failure Acceleration and Crack
Initiation/Propagation
4.2.1 Model #1
Two typical acceleration plots at the base accelerations of 0.05
g and 0.0875 g are shown in Fig. 8. It can be seen that the base
acceleration is amplified at the top of the model. Unfortunately,
because of the set up error in measurement limit of the accelero-
meter, the maximum acceleration of the model could not be
observed until the failure. However, the maximum acceleration
at the base of model was anticipated from the input data which
showed about 0.55 g-0.60 g. Fig. 9 shows the crack pattern. The
crack initiated at the slope changing point and propagated around
Fig. 7. Resonance Test: Normalized Displacement at the Top of
Model: (a) Model #1, (b) Model #2
Table 8. Mode Shape and Frequency
ModeModeShape
Frequency (Hz)
Prototype(E=18,200
MPa)(ρ=2,400kg/m3)
Prototype(scale)(E=182 MPa)(ρ=2,400 kg/
m3)
Model #1(E=13 MPa)
(ρ=1,907kg/m3)
Model #2(E=14 MPa)
(ρ=1,937kg/m3)
1a 2.5057 25.057 7.5458 7.7732
2b 6.2837 62.837 18.938 19.530
3 7.2568 72.568 21.904 22.552
4 11.622 116.22 35.037 36.139
Note : ( )a,( )b show in the direction of acceleration load
Fig. 8. Amplification of Acceleration (Model #1): (a) Base Acceler-
ation of 0.05 g, (b) Base Acceleration of 0.0875 g

Bupavech Phansri, Sumetee Charoenwongmit, Ekkachai Yooprasertchai, Kyung-Ho Park, Pennung Warnitchai, and Dong-Hun Shin
− 148 − KSCE Journal of Civil Engineering
the neck of model.
4.2.2 Model #2
Model #2 was also tested up to failure using the same method
as Model #1. Two typical acceleration plots at the base accelera-
tion of 0.05 g and 0.625 g are shown in Fig. 10. The crack failure
occurred at the base acceleration of 0.625 g. The acceleration at
the top is about 0.06 g for the base acceleration of 0.05 g, which
shows an amplification factor of 1.2 from the base to the top of
the model. For the base acceleration of 0.625 g, the amplification
factor is 1.3.
Figure 11 shows the variations of acceleration and relative dis-
placement during the testing. It can be seen that the acceleration
at the top was amplified up to 0.8 g and relative displacement is
increased up to 0.9 mm. At the base acceleration of 0.625 g, the
crack was observed at the slope changing point of the model.
The crack propagated around the neck of model as shown in Fig.
12, same as the case of Model #1. Although the different
resonant frequencies were applied to the models (14 Hz for
Model #1 and 28 Hz for Model #2), the crack patterns in both
models were very similar.
4.3 Discussion on Stability of the Prototype Dam
Since tests conducted under the harmonic excitations without
the consideration of reservoir and foundation effects, the inter-
preting of the results for the seismic safety of the prototype dam
should be made with regard to these discrepancies. The sinusoidal
excitations can be useful to estimate the crack initiation and
Fig. 9. Crack Propagation (Model #1): (a) Front View, (b) Side View
Fig. 10. Amplification of Acceleration (Model #2): (a) Base Acceler-
ation of 0.05 g, (b) Base Acceleration of 0.625 g
Fig. 11. Amplification During Testing (Model #2): (a) Horizontal Ac-
celeration at the Base, (b) Horizontal Acceleration at the Top,
(c) Horizontal Relative Displacement

An Experimental Study on Shaking Table Tests on Models of a Concrete Gravity Dam
Vol. 19, No. 1 / January 2015 − 149 −
failure.
Ghaemmaghami and Ghaemian (2008) observed the failure of
dam model with 1.67 times greater than the peak acceleration in
Manjil earthquake record. Li et al. (2000) observed fully destroy
of the dam model when the acceleration reached 0.87 g (the
estimated peak horizontal acceleration at the site = 0.1 g) using
the Three Gorges seismic accelerogram. In both tests, the effects
of reservoir and foundation flexibility were neglected.
In this study, the crack was initially occurred by 0.55 g of the
base acceleration for Model #1 and 0.625 g for Model #2. These
values are 1.31-1.49 times greater than the recommended peak
ground acceleration of the maximum credible earthquake of 0.42
g, and 2.2-2.5 times greater than the recommended peak ground
acceleration of the design base earthquake of 0.25 g. Considering
that the testing conducted under the first frequency condition,
those results may demonstrate the safety of dam body due to the
earthquake. Due to the experimental limitations in this study,
however further study on the stability of the proposed dam
including the effects of reservoir, foundation, and earthquake
motion can be recommended.
Considering the effects of reservoir, foundation, and earthquake
motion, many researches (Aidi and Hall, 1989; Loli and Fenves,
1989; Bhattacharjee and Leger, 1993, 1994; Cervera et al., 1995;
Ghrib and Tinawi, 1995; Mao and Taylor, 1997; Ghaemian and
Ghobarah, 1999; Calayir and Karaton, 2005a,b; Mirzabozorg
and Ghaemian, 2005) have attempted to simulate the earthquake
response of concrete dams by using numerical methods. The
most case study of the earthquake response of concrete gravity
dam was Koyna gravity dam which subjected to an earthquake
of magnitude 6.5 on the Richter scale on December 11, 1967.
Most cases have considered the effect of dam-reservoir and/or
dam-foundation interaction by using the finite and/or boundary
element methods. The nonlinear behaviour of the concrete has
been considered by using the discrete crack model, the smeared
crack model, the continuum damage mechanics model and the
plastic damage model.
5. Conclusions
Experimental shaking table tests have been conducted for two
small-scale dam models, which were constructed by using the
bentonite-concrete mixture material to match the similitude re-
quirements between the prototype and the model. The
resonance and ambient tests were conducted to investigate the
fundamental frequency, the maximum failure acceleration and
the crack initiation/propagation. The following conclusions can
be drawn:
1. The bentonite-concrete mixture material was developed to
reduce strength and elastic modulus and match the simili-
tude requirements. Although the value of ultimate tensile
strength is close to the target value, the values of ultimate
tensile strain and elastic modulus show larger relative errors
than those in the previous studies.
2. From the resonance test, different amplification frequencies
were noticed. In Model #1, the first amplification of acceler-
ation and normalized relative displacement was noticed
around 14-16 Hz and the second large amplification around
24-28 Hz. In Model #2, the amplification was noticed from
14 Hz and the large amplification was observed at around
24-28 Hz. These are scaled to 1.4-2.8 Hz frequency event.
3. The crack was initially occurred by 0.55 g of the base accel-
eration for Model #1 and 0.625 g for Model #2, which are
2.2-2.5 times and 1.31-1.49 times greater than the recom-
mended peak ground accelerations of the design base earth-
quake of 0.25 g and the maximum credible earthquake of
0.42 g, respectively.
4. Although the different resonant frequencies were applied
(14 Hz for Model 1 and 28 Hz for Model 2), the crack patterns
in both models were very similar. The crack initiated at the
slope changing point and then propagated around the neck
area.
It should be noted that in this study the effects of reservoir,
foundation, and earthquake motions are neglected due to the
experimental limitations. While the tests conducted under the
period action of horizontal sinusoidal loading, the results in this
Fig. 12. Crack Propagation (Model #2): (a) Side View, (b) Back
View
Bupavech Phansri, Sumetee Charoenwongmit, Ekkachai Yooprasertchai, Kyung-Ho Park, Pennung Warnitchai, and Dong-Hun Shin
− 150 − KSCE Journal of Civil Engineering
study can be useful to demonstrate the safety of a dam body and
assess numerical models.
References
ABAQUS Inc. (2004). ABAQUS 6.5 Documentation.
Aidi, B. E. and Hall, J. F. (1989). “Non-linear earthquake response of
concrete gravity dams: Modelling.” Earthq. Eng. Struct. Dyn., Vol.
18, pp. 837-851.
Bakhtin, B. M. and Dumenko, V. I. (1979). “Seismic stability of a
concrete gravity dam having a lightweight profile.” Hydrotech.
Construct., Vol . 5, pp. 445-450.
Bhattacharjee, S.S. and Leger, P. (1993). “Seismic cracking and energy
dissipation in concrete gravity dam.” Earthq. Eng. Struct. Dyn., Vol.
22, No. 11, pp. 991-1007.
Bhattacharjee, S. S. and Leger, P. (1994). “Application of NLFM
models to predict cracking in concrete gravity dams.” J. Struct. Eng.,
Vol. 120, No. 4, pp. 1255-1271.
Calayir, Y. and Karaton, M. (2005a). “A continuum damage concrete
model for earthquake analysis of concrete gravity dam-reservoir
systems.” Soil Dyn. Earthq. Eng., Vol. 25, pp. 857-869.
Calayir, Y. and Karaton, M. (2005b). “Seismic fracture analysis of
concrete gravity dams including dam-reservoir interaction.” Comput.
Struct., Vol. 83, pp. 1595-1606.
Cervera, M., Oliver, J., and Faria, R. (1995). “Seismic evaluation of
concrete dams via continuum damage models.” Earthq. Eng. Struct.
Dyn., Vol. 24v, pp. 1225-1245.
Donlon, W. P. (1989). Experimental investigation of the nonlinear
seismic response of concrete gravity dams, Report No. 89-01,
Earthquake Engineering Research Laboratory, California Institute of
Technology, Pasadena.
Donlon, W. P. and Hall, J. F. (1991). “Shake table study of concrete
gravity dam monolith.” Earthq. Eng. Struct. Dyn., Vol. 20, pp. 769-
786.
Ghaemian, M. and Ghobarah, A. (1999). “Nonlinear seismic response
of concrete gravity dams with dam-reservoir interaction.” Eng.
Struct., Vol. 21, pp. 306-315.
Ghaemmaghami, A. R. and Ghaemian, M. (2008). “Experimental
seismic investigation of Sefid-Rud concrete buttress dam model on
shaking table.” Earthq. Eng. Struct. Dyn., Vol. 37, pp. 809-823.
Ghobarah, A. and Ghaemian, M. (1998). “Experimental study of small
scale dam models.” J. Eng. Mech., Vol. 124, No. 11, pp. 1241-1248.
Ghrib, F. and Tinawi, R. (1995). “An application of damage mechanics
for seismic analysis of concrete gravity dams.” Earthq. Eng. Struct.
Dyn., Vol. 24, pp. 157-173.
Hall, J. F. (1989). “The dynamic and earthquake behaviour of concrete
dams.” Soil Dyn. Earthq. Eng., Vol. 7, pp. 58-121.
Harris, D. W., Snorteland, N., Dolen, T., and Travers, F. (2000). “Shaking
table 2-D models of a concrete gravity dam.” Earthq. Eng. Struct.
Dyn., Vol. 29, pp. 769-787.
Li, Q. S., Li, Z. N., Li, G. Q., Meng, J. F., and Tang, J. (2005).
“Experimental and numerical seismic investigations of the Three
Gorges dam.” Eng. Struct., Vol. 27, pp. 501-513.
Lin, G., Zhou, J., and Fan, C. (1993). “Dynamic model rupture test and
safety evaluation of concrete gravity dams.” Dam Eng., Vol. 4, No.
3, pp. 769-786.
Loli, L. M. V. and Fenves, G. L. (1989). “Effect of concrete cracking on
the earthquake response of gravity dams.” Earthq. Eng. Struct. Dyn.,
Vol. 18, pp. 575-592.
Mao, M. and Taylor, C. A. (1997). “Non-linear seismic cracking
analysis of medium-height concrete gravity dams.” Comput. Struct.,
Vol. 64, pp. 1197-1204.
Mir, R. A. and Taylor, C. A. (1995). “An experimental investigation into
earthquake-induced failure of medium to low height concrete
gravity dam.” Earthq. Eng. Struct. Dyn., Vol. 24, pp. 373-393.
Mir, R. A. and Taylor, C. A. (1996). “An investigation into the base
sliding response of rigid concrete gravity dams to dynamic loading.”
Earthq. Eng. Struct. Dyn., Vol. 25, pp. 79-98.
Mirzabozorg, H. and Ghaemian, M. (2005). “Non-linear behavior of
mass concrete in three-dimensional problems using a smeared crack
approach.” Earthq. Eng. Struct. Dyn., Vol. 34, pp. 247-269.
Niwa, A. and Clough, R. W. (1980). Shaking table research on concrete
dam models, Report No. UCB/EERC-80-05, Earthquake Engineer-
ing Research Center, College of Engineering, University of
California, Berkeley, California.
Tinawi, R., Leger, P., Leclerc, M., and Cipolla, G. (2000). “Seismic
safety of gravity dams: from shake table experiments to numerical
analyses.” J. Struct. Eng., Vol. 126, No. 4, pp. 518-529.
Wieland, M. (2003). “Seismic aspects of dams.” Proceedings of the 21st
International Congress on Large Dams, ICOLD, Montreal, Canada.
Wieland, M., Brenner, P., and Sommer, P. (2003). “Earthquake resiliency
of large concrete dams: Damage, repair, and strengthening concepts.”
Q.83, Proceedings of the 21st International Congress on Large
Dams, ICOLD, Montreal, Canada.
Zadnik, B. (1994). “Motions of rigid unsymmetric bodies and coeffi-
cient of friction by earthquake excitations.” Struct. Eng. Mech., Vol.
2, No. 33, pp. 257-267.
Zadnik, B. and Paskalov, T. (1992). “Dam stability and time-dependent
coefficient of friction.” Proceedings of the 10th World Conference
on Earthquake Engineering, Balkema, Rotterdam, The Netherlands,
pp. 4633-4638.