16htc126 viewpoints sept gtp2
TRANSCRIPT
VIE
WP
OIN
TS
SEPTEMBER 2016, ISSUE 3
1
1 As of this writing, nearly $12 trillion in sovereign debt, globally, is trading at negative yields (source: Financial Times, “Negative Yield Government Debt Surges $1.3 trillion to $11.7 trillion”, Samson, Adam, 6/30/2016)
Low CostInvestment Management Fees
Investment management fees have always been an important consideration for investors, especially in today’s low return environment, which is dictated by historically low bond yields and reduced rates of economic growth domestically and negative yields globally.1 As such, return expectations for virtually all asset classes have been reduced in order to account for this lower yielding environment across the globe. Given this lower return assumption for all investors, and holding fees constant, a greater share of a portfolio’s return will be consumed by fees over time.
Investment Philosophy and Portfolio StrategyIn previous issues, we have outlined our approach to fixed income investing (Viewpoints #1) and explained more deeply the distinction between “active” and “passive” (index) equity investing (Viewpoints #2). In this issue, we bring these concepts together and present our overall investment approach at Houston Trust Company.
The Importance of Investment Objectives and AppropriatenessThere are multiple avenues to achieving investment success and we at Houston Trust Company are not dogmatic or inflexible. It is crucial, however, to take the time and expend the effort to understand the investment objectives of a client, take note of assets already in the account and create a customized portfolio to achieve the goals of the client. We recognize that there is not a “one size fits all” approach to investing, as each client’s individual circumstances, risk tolerance, and goals will be unique. However, we do emphasize certain core tenets as they pertain to our overall investment philosophy, which we have summarized as follows.
2
VIE
WP
OIN
TS
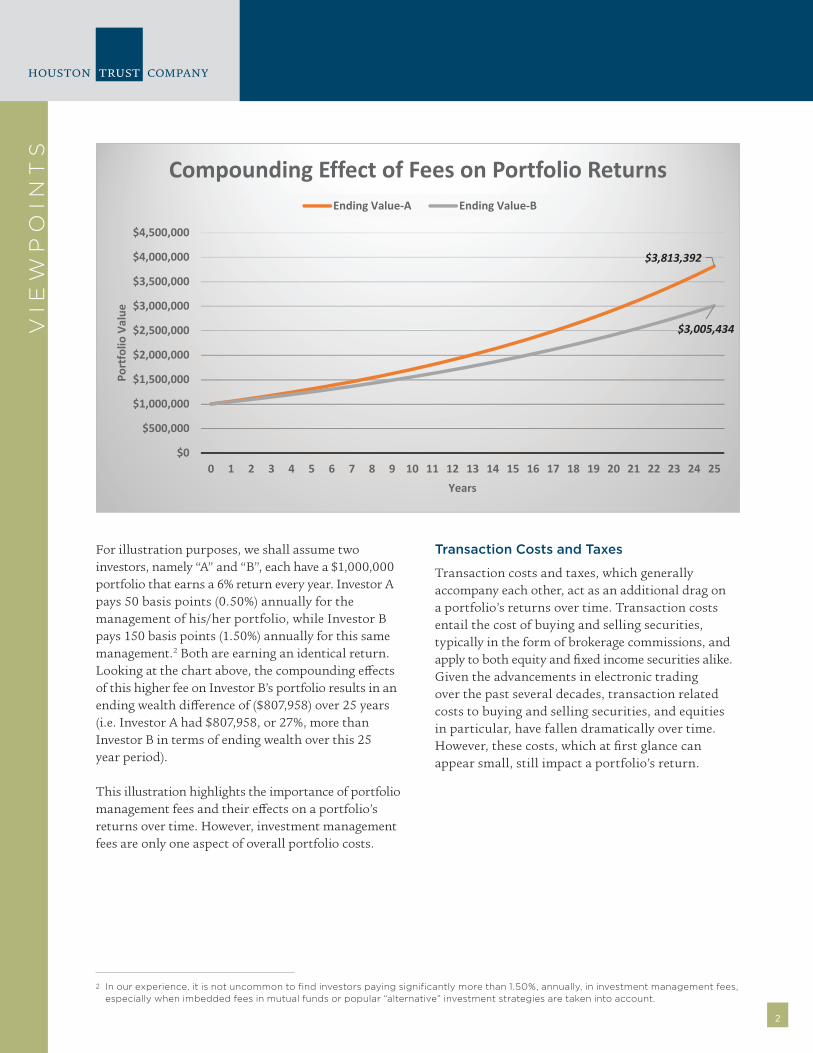
For illustration purposes, we shall assume two investors, namely “A” and “B”, each have a $1,000,000 portfolio that earns a 6% return every year. Investor A pays 50 basis points (0.50%) annually for the management of his/her portfolio, while Investor B pays 150 basis points (1.50%) annually for this same management.2 Both are earning an identical return.Looking at the chart above, the compounding effects of this higher fee on Investor B’s portfolio results in an ending wealth difference of ($807,958) over 25 years (i.e. Investor A had $807,958, or 27%, more than Investor B in terms of ending wealth over this 25 year period).
This illustration highlights the importance of portfolio management fees and their effects on a portfolio’s returns over time. However, investment management fees are only one aspect of overall portfolio costs.
an identical return2. Looking at the chart below, the compounding effects of this higher fee on Investor B’s portfolio results in an ending wealth difference of ($807,958) over 25 years (i.e. Investor A had $807,958, or 27%, more than Investor B in terms of ending wealth over this 25 year period):
This illustration highlights the importance of portfolio management fees, and their effects on a portfolio’s returns over time. However, investment management fees are only one leg of the overall (cost) stool.
b. Transaction Costs and Taxes
Transaction costs and taxes, which generally accompany each other, act as an additional drag on a portfolio’s returns over time. Transaction costs entail the cost of buying and selling securities, typically in the form of brokerage commissions, and apply to both equity and fixed income securities alike. Given the advancements in electronic trading over the past several decades, transaction related costs to buying and selling securities, and equities in particular, have fallen dramatically over time. However, these costs which, at first glance, can appear small, still impact a portfolio’s return. To illustrate this point, we have provided the example below which shows how these costs can quickly escalate as the turnover of the portfolio rises:
2 In our experience, it is not uncommon to find investors paying significantly more than 1.50%, annually, in investment management fees, especially when imbedded fees in mutual funds or popular “alternative” investment strategies are taken into account.
$3,813,392
$3,005,434
$0
$500,000
$1,000,000
$1,500,000
$2,000,000
$2,500,000
$3,000,000
$3,500,000
$4,000,000
$4,500,000
0 1 2 3 4 5 6 7 8 9 10 11 12 13 14 15 16 17 18 19 20 21 22 23 24 25
Portfolio
Value
Years
Compounding Effect of Fees on Portfolio ReturnsEnding Value‐A Ending Value‐B
2 In our experience, it is not uncommon to find investors paying significantly more than 1.50%, annually, in investment management fees, especially when imbedded fees in mutual funds or popular “alternative” investment strategies are taken into account.
Transaction Costs and Taxes
Transaction costs and taxes, which generally accompany each other, act as an additional drag on a portfolio’s returns over time. Transaction costs entail the cost of buying and selling securities, typically in the form of brokerage commissions, and apply to both equity and fixed income securities alike. Given the advancements in electronic trading over the past several decades, transaction related costs to buying and selling securities, and equities in particular, have fallen dramatically over time. However, these costs, which at first glance can appear small, still impact a portfolio’s return.
3
VIE
WP
OIN
TS
3 According to Jack Bogle, an approximation for the “all-in” costs borne by most investors is 227 basis points (2.27%) per annum when using actively managed funds. Bogle, John C., “The Arithmetic of “All-In Investment Expenses”, Financial Analyst Journal, Volume 70, 2014.
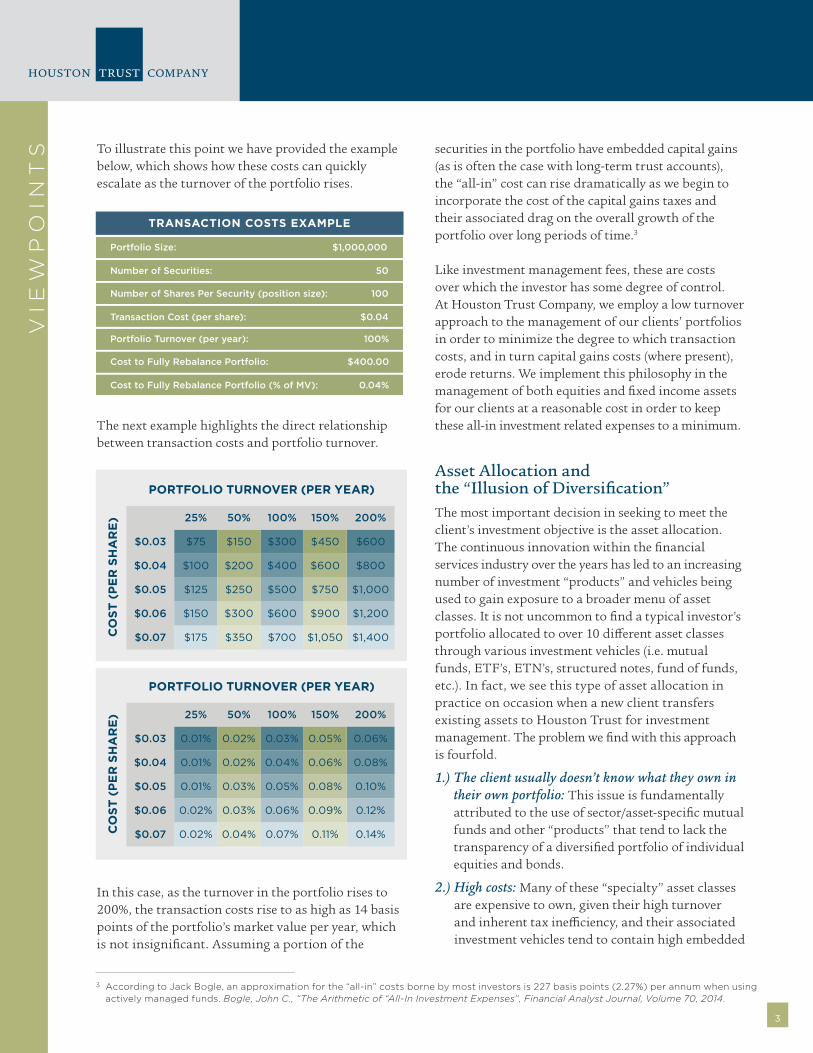
To illustrate this point we have provided the example below, which shows how these costs can quickly escalate as the turnover of the portfolio rises.
The next example highlights the direct relationship between transaction costs and portfolio turnover.
In this case, as the turnover in the portfolio rises to 200%, the transaction costs rise to as high as 14 basis points of the portfolio’s market value per year, which is not insignificant. Assuming a portion of the
25% 50% 100% 150% 200%
$0.03 $75 $150 $300 $450 $600
$0.04 $100 $200 $400 $600 $800
$0.05 $125 $250 $500 $750 $1,000
$0.06 $150 $300 $600 $900 $1,200
$0.07 $175 $350 $700 $1,050 $1,400
PORTFOLIO TURNOVER (PER YEAR)
25% 50% 100% 150% 200%
$0.03 0.01% 0.02% 0.03% 0.05% 0.06%
$0.04 0.01% 0.02% 0.04% 0.06% 0.08%
$0.05 0.01% 0.03% 0.05% 0.08% 0.10%
$0.06 0.02% 0.03% 0.06% 0.09% 0.12%
$0.07 0.02% 0.04% 0.07% 0.11% 0.14%
PORTFOLIO TURNOVER (PER YEAR)
CO
ST
(P
ER
SH
AR
E)
CO
ST
(P
ER
SH
AR
E)
Portfolio Size: $1,000,000
Number of Securities: 50
Number of Shares Per Security (position size): 100
Transaction Cost (per share): $0.04
Portfolio Turnover (per year): 100%
Cost to Fully Rebalance Portfolio: $400.00
Cost to Fully Rebalance Portfolio (% of MV): 0.04%
securities in the portfolio have embedded capital gains (as is often the case with long-term trust accounts), the “all-in” cost can rise dramatically as we begin to incorporate the cost of the capital gains taxes and their associated drag on the overall growth of the portfolio over long periods of time.3
Like investment management fees, these are costs over which the investor has some degree of control. At Houston Trust Company, we employ a low turnover approach to the management of our clients’ portfolios in order to minimize the degree to which transaction costs, and in turn capital gains costs (where present), erode returns. We implement this philosophy in the management of both equities and fixed income assets for our clients at a reasonable cost in order to keep these all-in investment related expenses to a minimum.
Asset Allocation and the “Illusion of Diversification”The most important decision in seeking to meet the client’s investment objective is the asset allocation. The continuous innovation within the financial services industry over the years has led to an increasing number of investment “products” and vehicles being used to gain exposure to a broader menu of asset classes. It is not uncommon to find a typical investor’s portfolio allocated to over 10 different asset classes through various investment vehicles (i.e. mutual funds, ETF’s, ETN’s, structured notes, fund of funds, etc.). In fact, we see this type of asset allocation in practice on occasion when a new client transfers existing assets to Houston Trust for investment management. The problem we find with this approach is fourfold.
1.) The client usually doesn’t know what they own in their own portfolio: This issue is fundamentally attributed to the use of sector/asset-specific mutual funds and other “products” that tend to lack the transparency of a diversified portfolio of individual equities and bonds.
2.) High costs: Many of these “specialty” asset classes are expensive to own, given their high turnover and inherent tax inefficiency, and their associated investment vehicles tend to contain high embedded
4
VIE
WP
OIN
TS management fees as well, relative to the more
traditional asset classes of stocks and bonds.
3.) Illiquidity in volatile markets: As we saw during the most recent financial crisis of 2007-2008, liquidity dried-up in many alternative asset classes. Investors in these asset classes who wished to liquidate their positions found that there was no counterparty willing to take the other side of their trade during this period of high volatility in global markets. Also, bid-ask spreads for all but the most highly-liquid securities widened considerably, further adding to the cost of trading and illiquidity, particularly in the more “exotic” or “alternative” asset classes.
4.) The diversification benefits of these asset classes tend to vanish in times of market stress: This scenario is what we refer to as the “illusion of diversification.” Many of these asset classes are
Zephyr StyleADVISORZephyr StyleADVISOR: Houston Trust Company
Calendar Year ReturnAs of December 2008
-60%
-50%
-40%
-30%
-20%
-10%
0%
10%
20%
30%
2008
S&P 500MSCI EAFE IndexRussell 2000Barclays U.S. Corporate High YieldBloomberg Commodity IndexBarclayHedge Hedge Fund IndexBarclayHedge Equity Long/Short IndexBarclayHedge Merger Arbitrage IndexDow Jones U.S. Select REITS&P GSCIDow Jones Emerging MarketsBarclayHedge Distressed Securities IndexCitigroup 3-month T-billBofA Merrill Lynch 1-3 Year US TreasuryBofA Merrill Lynch 3-5 Year US TreasuryBofA Merrill Lynch 10+ Year US Treasury
Created with Zephyr StyleADVISOR.
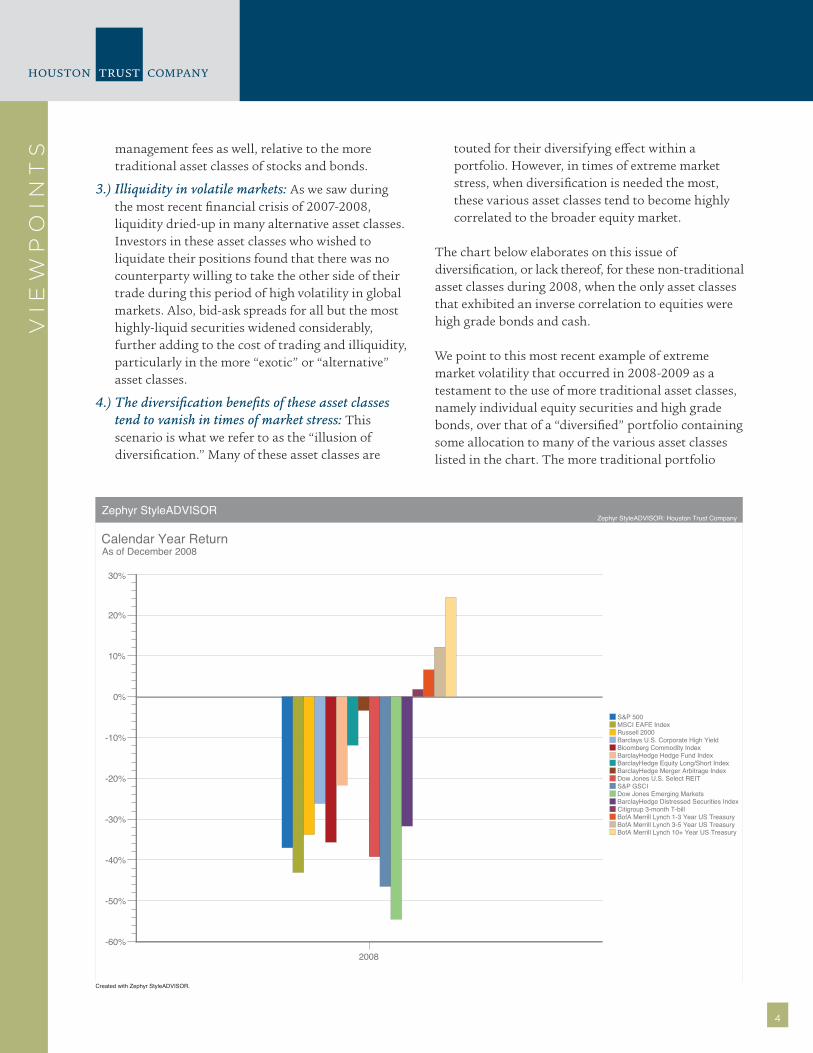
touted for their diversifying effect within a portfolio. However, in times of extreme market stress, when diversification is needed the most, these various asset classes tend to become highly correlated to the broader equity market.
The chart below elaborates on this issue of diversification, or lack thereof, for these non-traditional asset classes during 2008, when the only asset classes that exhibited an inverse correlation to equities were high grade bonds and cash.
We point to this most recent example of extreme market volatility that occurred in 2008-2009 as a testament to the use of more traditional asset classes, namely individual equity securities and high grade bonds, over that of a “diversified” portfolio containing some allocation to many of the various asset classes listed in the chart. The more traditional portfolio
5
VIE
WP
OIN
TS
4 Product and Portfolio Strategy Group, Eaton Vance, “Monthly Market Monitor”, July 2016
5 The Asset Allocation portfolio assumes the following weights: 25% S&P 500 Index, 15% MSCI EAFE Index, 5% MSCI Emerging Markets Index, 10% Russell 2000 Index, 25% Barclays Capital US Aggregate Bond Index, 5% Barclays Municipal Bond Index, 5% Barclays US Corporate High Yield Index, 5% S&P 500/LSTA Leveraged Loan Index, 5% Bloomberg Commodity Index.
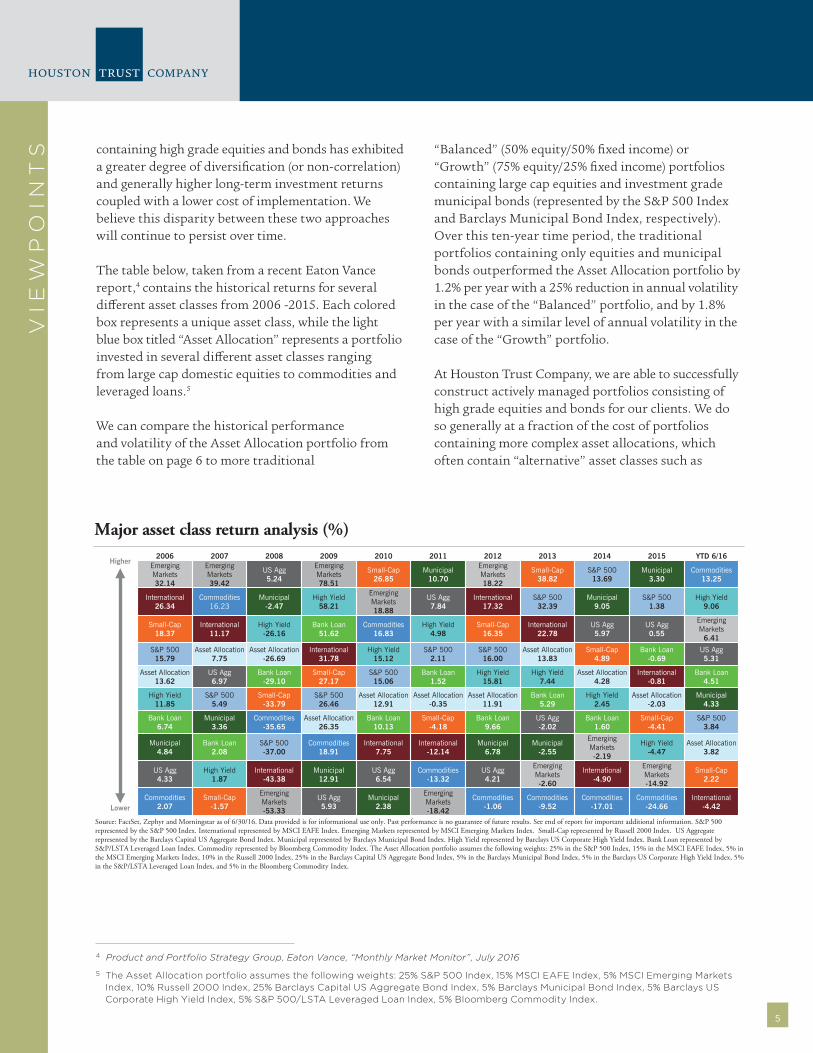
containing high grade equities and bonds has exhibited a greater degree of diversification (or non-correlation) and generally higher long-term investment returns coupled with a lower cost of implementation. We believe this disparity between these two approaches will continue to persist over time.
The table below, taken from a recent Eaton Vance report,4 contains the historical returns for several different asset classes from 2006 -2015. Each colored box represents a unique asset class, while the light blue box titled “Asset Allocation” represents a portfolio invested in several different asset classes ranging from large cap domestic equities to commodities and leveraged loans.5
We can compare the historical performance and volatility of the Asset Allocation portfolio from the table on page 6 to more traditional
Additional
Information
Asset A
llocation A
lternatives Equities
Trends &
Takeaways
Fixed income
EATON VANCE
Monthly Market Monitor | July 2016
Source: FactSet, Zephyr and Morningstar as of 6/30/16. Data provided is for informational use only. Past performance is no guarantee of future results. See end of report for important additional information. S&P 500 represented by the S&P 500 Index. International represented by MSCI EAFE Index. Emerging Markets represented by MSCI Emerging Markets Index. Small-Cap represented by Russell 2000 Index. US Aggregate represented by the Barclays Capital US Aggregate Bond Index. Municipal represented by Barclays Municipal Bond Index. High Yield represented by Barclays US Corporate High Yield Index. Bank Loan represented by S&P/LSTA Leveraged Loan Index. Commodity represented by Bloomberg Commodity Index. The Asset Allocation portfolio assumes the following weights: 25% in the S&P 500 Index, 15% in the MSCI EAFE Index, 5% in the MSCI Emerging Markets Index, 10% in the Russell 2000 Index, 25% in the Barclays Capital US Aggregate Bond Index, 5% in the Barclays Municipal Bond Index, 5% in the Barclays US Corporate High Yield Index, 5% in the S&P/LSTA Leveraged Loan Index, and 5% in the Bloomberg Commodity Index.
Major asset class return analysis (%) 2006 2007 2008 2009 2010 2011 2012 2013 2014 2015 YTD 6/16
Emerging Markets 32.14
Emerging Markets 39.42
US Agg 5.24
Emerging Markets 78.51
Small-Cap 26.85
Municipal 10.70
Emerging Markets 18.22
Small-Cap 38.82
S&P 500 13.69
Municipal 3.30
Commodities 13.25
International 26.34
Commodities 16.23
Municipal -2.47
High Yield 58.21
Emerging Markets 18.88
US Agg 7.84
International 17.32
S&P 500 32.39
Municipal 9.05
S&P 500 1.38
High Yield 9.06
Small-Cap 18.37
International 11.17
High Yield -26.16
Bank Loan 51.62
Commodities 16.83
High Yield 4.98
Small-Cap 16.35
International 22.78
US Agg 5.97
US Agg 0.55
Emerging Markets
6.41
S&P 500 15.79
Asset Allocation 7.75
Asset Allocation -26.69
International 31.78
High Yield 15.12
S&P 500 2.11
S&P 500 16.00
Asset Allocation 13.83
Small-Cap 4.89
Bank Loan -0.69
US Agg 5.31
Asset Allocation 13.62
US Agg 6.97
Bank Loan -29.10
Small-Cap 27.17
S&P 500 15.06
Bank Loan 1.52
High Yield 15.81
High Yield 7.44
Asset Allocation 4.28
International -0.81
Bank Loan 4.51
High Yield 11.85
S&P 500 5.49
Small-Cap -33.79
S&P 500 26.46
Asset Allocation 12.91
Asset Allocation -0.35
Asset Allocation 11.91
Bank Loan 5.29
High Yield 2.45
Asset Allocation -2.03
Municipal 4.33
Bank Loan 6.74
Municipal 3.36
Commodities -35.65
Asset Allocation 26.35
Bank Loan 10.13
Small-Cap -4.18
Bank Loan 9.66
US Agg -2.02
Bank Loan 1.60
Small-Cap -4.41
S&P 500 3.84
Municipal 4.84
Bank Loan 2.08
S&P 500 -37.00
Commodities 18.91
International 7.75
International -12.14
Municipal 6.78
Municipal -2.55
Emerging Markets -2.19
High Yield -4.47
Asset Allocation 3.82
US Agg 4.33
High Yield 1.87
International -43.38
Municipal 12.91
US Agg 6.54
Commodities -13.32
US Agg 4.21
Emerging Markets -2.60
International -4.90
Emerging Markets -14.92
Small-Cap 2.22
Commodities 2.07
Small-Cap -1.57
Emerging Markets -53.33
US Agg 5.93
Municipal 2.38
Emerging Markets -18.42
Commodities -1.06
Commodities -9.52
Commodities -17.01
Commodities -24.66
International -4.42
Higher
Lower
32
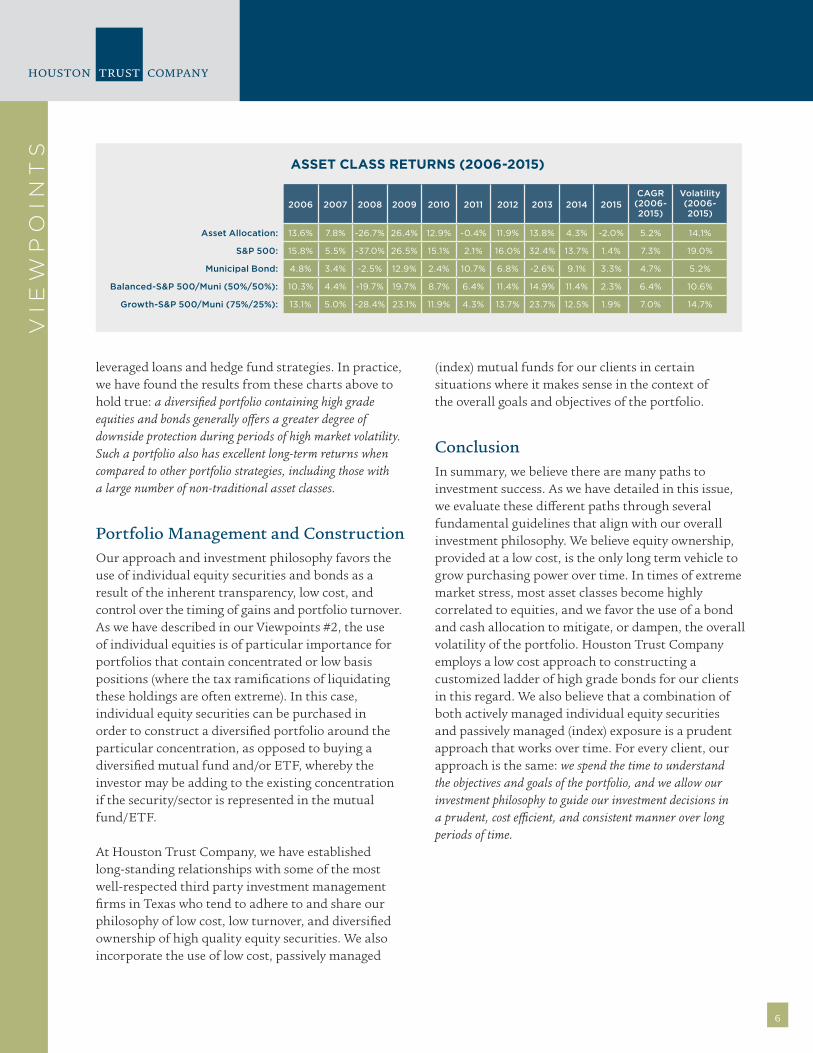
“Balanced” (50% equity/50% fixed income) or “Growth” (75% equity/25% fixed income) portfolios containing large cap equities and investment grade municipal bonds (represented by the S&P 500 Index and Barclays Municipal Bond Index, respectively). Over this ten-year time period, the traditional portfolios containing only equities and municipal bonds outperformed the Asset Allocation portfolio by 1.2% per year with a 25% reduction in annual volatility in the case of the “Balanced” portfolio, and by 1.8% per year with a similar level of annual volatility in the case of the “Growth” portfolio.
At Houston Trust Company, we are able to successfully construct actively managed portfolios consisting of high grade equities and bonds for our clients. We do so generally at a fraction of the cost of portfolios containing more complex asset allocations, which often contain “alternative” asset classes such as
6
VIE
WP
OIN
TS
leveraged loans and hedge fund strategies. In practice, we have found the results from these charts above to hold true: a diversified portfolio containing high grade equities and bonds generally offers a greater degree of downside protection during periods of high market volatility. Such a portfolio also has excellent long-term returns when compared to other portfolio strategies, including those with a large number of non-traditional asset classes.
Portfolio Management and ConstructionOur approach and investment philosophy favors the use of individual equity securities and bonds as a result of the inherent transparency, low cost, and control over the timing of gains and portfolio turnover. As we have described in our Viewpoints #2, the use of individual equities is of particular importance for portfolios that contain concentrated or low basis positions (where the tax ramifications of liquidating these holdings are often extreme). In this case, individual equity securities can be purchased in order to construct a diversified portfolio around the particular concentration, as opposed to buying a diversified mutual fund and/or ETF, whereby the investor may be adding to the existing concentration if the security/sector is represented in the mutual fund/ETF.
At Houston Trust Company, we have established long-standing relationships with some of the most well-respected third party investment management firms in Texas who tend to adhere to and share our philosophy of low cost, low turnover, and diversified ownership of high quality equity securities. We also incorporate the use of low cost, passively managed
ASSET CLASS RETURNS (2006-2015)
2006 2007 2008 2009 2010 2011 2012 2013 2014 2015CAGR
(2006-2015)
Volatility(2006-2015)
Asset Allocation: 13.6% 7.8% -26.7% 26.4% 12.9% -0.4% 11.9% 13.8% 4.3% -2.0% 5.2% 14.1%
S&P 500: 15.8% 5.5% -37.0% 26.5% 15.1% 2.1% 16.0% 32.4% 13.7% 1.4% 7.3% 19.0%
Municipal Bond: 4.8% 3.4% -2.5% 12.9% 2.4% 10.7% 6.8% -2.6% 9.1% 3.3% 4.7% 5.2%
Balanced-S&P 500/Muni (50%/50%): 10.3% 4.4% -19.7% 19.7% 8.7% 6.4% 11.4% 14.9% 11.4% 2.3% 6.4% 10.6%
Growth-S&P 500/Muni (75%/25%): 13.1% 5.0% -28.4% 23.1% 11.9% 4.3% 13.7% 23.7% 12.5% 1.9% 7.0% 14.7%
(index) mutual funds for our clients in certain situations where it makes sense in the context of the overall goals and objectives of the portfolio.
ConclusionIn summary, we believe there are many paths to investment success. As we have detailed in this issue, we evaluate these different paths through several fundamental guidelines that align with our overall investment philosophy. We believe equity ownership, provided at a low cost, is the only long term vehicle to grow purchasing power over time. In times of extreme market stress, most asset classes become highly correlated to equities, and we favor the use of a bond and cash allocation to mitigate, or dampen, the overall volatility of the portfolio. Houston Trust Company employs a low cost approach to constructing a customized ladder of high grade bonds for our clients in this regard. We also believe that a combination of both actively managed individual equity securities and passively managed (index) exposure is a prudent approach that works over time. For every client, our approach is the same: we spend the time to understand the objectives and goals of the portfolio, and we allow our investment philosophy to guide our investment decisions in a prudent, cost efficient, and consistent manner over long periods of time.