16th int'l wind integration workshop | berlin, germany | 25-27 …€¦ · keywords-reactive...
TRANSCRIPT

Improving the Reactive Power Balance between a German MV and HV Grid through Coordinated
Reactive Power Provision by Wind Power Plants
Leonard Hülsmann, Eckehard Tröster Energynautics GmbH Darmstadt, Germany
[email protected] [email protected]
Uwe Ohl, Markus Koch EWR Netz GmbH Worms, Germany
[email protected] [email protected]
Abstract—This paper explores various options for improving the reactive power flows from an MV network with variable renewable energy (VRE) generators, such as wind and photovoltaic power plants. The objective is to keep the reactive power exchange with the HV network at a constant value. Three reactive power management strategies are analyzed: (1) using only VRE generators directly connected to the MV busbar of the HV/MV substation; (2) using all VRE generators connected to the MV grid; and (3) enabling STATCOM capability for the busbar-connected VRE generators. The three strategies are examined by simulations on a real MV network close to Worms, Germany. Their ability is compared to reduce the deviation between reactive power flow at the HV network connection point and the chosen reactive power setpoint. Furthermore, the implications on reactive power flows from VRE plants are analyzed. The results show that a reactive power management of only two busbar-connected wind power plants can already reduce reactive power flows by 40 % to 75 %. Including all MV VRE plants in the control scheme can only lead to significant further improvements when the controlled plants are diversified by additional PV power plants. The proposed STATCOM capability would fulfill the predefined reactive power setpoints during almost all times, enabling the maximum flexibility for reactive power control, although it comes at the cost of extra installation expenses and accelerated equipment aging over time.
Keywords-reactive power management; distribution grid; distributed generators; wind power plants; voltage limitations
I. INTRODUCTION
The recent developments in renewable energy deployment have transformed distribution grids, formerly known to only transfer electricity to the customer, to bidirectionally facilitate power flows due to the increasing influx of distributed variable renewable energy (VRE) sources, namely wind (WPP) and photovoltaic power plants (PVPP). Due to the small size of these new power plants, currently 56 % of wind and 94 % of solar generation
capacity have been installed on the medium and low voltage level for Germany1.
To mitigate the associated voltage rise during power infeed, more and more VRE plants are required to consume reactive power. For example, German grid codes require VRE generators to operate up to a power factor of 0.95 or 0.9 under-/overexcited and to be able to set a cosφ(P) or Q(U) characteristic [1-2]. Consequently, reactive power flows on the upper voltage levels can increase, which causes additional power losses, higher line and transformer loadings and additional demand for reactive power compensation.
Furthermore, substituting the conventional synchronous generation fleet with inverter-based power generation will demand new means of reactive power control in the transmission grid. Various studies show that with increasing VRE penetration additional reactive power compensation may be needed [3-4]. However, providing these increased reactive power needs with distributed generation may offer more economical alternatives compared to conventional compensators like static var compensators (SVC), synchronous condensers and STATCOMs [5].
Hence, in this paper an MV network with very high VRE penetration is analyzed, focusing on its capability to control its reactive power exchange with the HV grid. Reactive power is mostly consumed/provided by wind power plants, while other studies before have focused on PVPPs (e.g. [6]) or assumed reactive power capability also during night/no-wind conditions, also called STATCOM capability or Q@night for PVPPs [5].
II. SIMULATION MODEL
Analyzed is an MV network close to Worms, Germany, operated by EWR Netz GmbH. It is fed by two 45 MVA transformers from the HV grid and the two MV parts are not connected with each other during normal operation. In total, it includes five up to 25 km long distribution feeders with
1 Evaluation of transmission system operator databases (as of the end of 2015), available under: https://www.netztransparenz.de/EEG/Anlagenstammdaten
16th Int'l Wind Integration Workshop | Berlin, Germany | 25-27 October, 2017

loads and generation as well as multiple WPPs directly connected to the two MV busbars. One-year simulations are carried out in 15-minute time resolution and with input data based on the year 2015, using DIgSILENT PowerFactory.
Loads and PV generation in LV grids have been aggregated as singular loads/generators and provided with standard load profiles and PV generation time series from measurements. A power factor of 0.99/0.98 underexcited has been assigned, respectively, and active and reactive power flows have been thoroughly verified through measurements both on LV and MV level.
Some basic information about loads and generators is given in Table 1. The network is highly impacted by VRE, with installed capacity reaching 82.9 MW while maximum demand reaches only 16.7 MW. Therefore, the power balance across the two transformers ranges from -65.5 MW (generation) to 16.5 MW (load).
III. REACTIVE POWER CAPABILITY
Due to the high amount of VRE generation, this can have considerable effects on reactive power flows in the grid. Figure 1 shows the reactive power contribution of the different grid assets, such as lines and transformers, as well as loads and uncontrollable VRE generators (old WPPs and PVPPs connected to the LV grid). Compared to this, the maximum contribution that newly built VRE generators can provide is very significant. However, as the right side of Figure 1 shows the intermittency of these sources strongly
limits this capability, i.e. during 30 % of the time less than 1 Mvar is actually available for reactive power control and during 10 % of the time less than 3 Mvar. On the other hand, uncoordinated reactive power behavior can lead to unnecessarily large reactive power flows when most of the generation is producing at full capacity. Hence, an appropriate reactive power management (Q-management) may successfully compensate the reactive power flows induced by other, non-controllable VRE generators with fixed reactive power controls such as cosφ(P) or Q(U) control for voltage rise mitigation.
Figure 2 shows a PQ scatter diagram of the active and reactive power exchange with the HV network. The blue markers indicate the upper and lower maximum reactive power capability of the grid when all controllable WPPs and PVPPs connected to both MV feeders and MV busbars are participating to their maximum extent in reactive power consumption/provision without violating voltage and thermal limitations. Clearly, during no-generation situations, i.e. the right side of Figure 2, only a limited adjustment range is possible as VRE production is low and limited by a maximum cosφ of 0.95 under-/overexcited. Conversely, during high generation a wide adjustment range is possible, ranging from -14 to +28 Mvar, although only during few occasions such values can be achieved. The lower boundary (overexcited regime) is furthermore limited by voltage constraints, which explains the uptick of the lower blue curve during high VRE infeed.
Table 1: Basic information about the MV grid including loads and VRE generation characteristics
Grid asset Size / installed capacity
HV/MV transformers 2x 45 MVA
Maximum load (2015) 16.7 MW
WPPs (old, uncontrollable) 6.7 MW
PVPP (LV, uncontrollable) 15.1 MW
WPPs (connected to MV busbars) 34.7 MW
WPPs (connected to MV feeders) 19.1 MW
PVPP (connected to MV feeders) 7.3 MW
-20
-15
-10
-5
0
5
10
15
20
MV lines HV/MVtransformer
LV (loads, cables,transformers)
MV industry WPP (old,uncontrollable)
PVPP LVQ /
Mva
r
Low load, high generation High load, zero generation Q range
WPP (new, MV) - maximum Q range PVPP (MV) - maximum Q range
-20
-15
-10
-5
0
5
10
15
20
Q /
Mva
r
30% 10% 0%
Figure 1: (Left) Reactive power range of the different grid assets; (right) Reactive power range of the wind power plants in relation to their availability
Figure 2: Reactive power exchange at the HV connection point under current cosφ(P) settings (orange markers) and with maximum reactive power consumption/production by VRE
generators considering voltage limits (blue markers)
16th Int'l Wind Integration Workshop | Berlin, Germany | 25-27 October, 2017

Under current conditions, VRE generators connected to MV feeders are operating with an underexcited cosφ(P)-characteristic. Meanwhile, VRE generators connected to MV busbars are operating with an overexcited cosφ(P)-characteristic. Due to similar amounts of VRE generation connected to MV feeders and MV busbar and a high coincidence factor, the Q provision on the MV busbar cancels in part the Q consumption in the MV feeders out. However, irradiation and wind intermittency still lead to a large reactive power variability under current conditions in both positive and negative direction, which results in a reactive power range from -12 to +7 Mvar, as depicted by the orange markers in Figure 2.
Furthermore, during no-generation situations the network is overall reactive power producing. This is due to the fact that 80 % of distribution lines are cabled and the network is dominated by household loads, that operate at a power factor close to 1.
IV. STRATEGIES FOR Q-MANAGEMENT
Different strategies exist to implement a reactive power management with VRE generators. In the present case, a number of VRE generators are not controllable. This can be due to age and therefore limited functionality at the respective PVPP or WPP. On the other hand, controlling large numbers of PVPPs in LV networks requires extensive communication infrastructure and is therefore hampered by technical and economic considerations. Therefore, the sole focus in this analysis lies on the controllability of VRE generators connected to the MV network.
The following sections A – C lay out three different strategies for the Q-management. Section D finally proposes different reactive power setpoints that the three Q-management strategies try to fulfill.
A. Reactive power control by largest VRE plants, connected to the MV busbar
If applicable it is advantageous to control large VRE generators, that are directly connected to the MV busbar. Connection cables are usually sized to accommodate the whole reactive power range without violating voltage or thermal limits, which gives maximum flexibility for reactive power operation. Furthermore, this strategy integrates only a limited number of VRE generators in the Q-management. This improves both economics, as fewer communication
links have to be set up, as well as control reliability, due to reduced possibilities of communication failures.
In the simulated network, total VRE capacity connected to the MV busbars comes from two large WPPs. With 34.7 MW of installed capacity, they represent 42 % of total VRE capacity. Controlling these two WPPs requires only a very limited amount of communication and is therefore simple by its approach. In conformity with current grid codes, the WPPs are limited by a power factor of 0.95 under-/overexcited.
Additionally, all VRE generators within MV feeders are equipped with a Q(U) characteristic, as seen in Figure 3. This reduces their reactive power consumption only to times when needed. Hence, also reactive power compensation from VRE generators controlled by the Q-management is minimized.
B. Reactive power control by all MV connected VRE plants
In the second scenario, all VRE plants connected to the MV network are included in the Q-management. This excludes only old VRE plants that would require expensive upgrades to their communication and control setup.
The adjustment range, within which reactive power provision or consumption can be freely controlled, is given by the gray-shaded area in Figure 3. As in the previous scenario, all VRE generators have to comply with a minimum power factor of 0.95 under-/overexcited.
In the simulated example, a total of five controllable WPPs and one PVPP are connected to the MV network. Hence, compared to scenario A, six power plants need to be controlled instead of two. Their combined installed capacity amounts to 61.1 MW, or 74 % of total VRE capacity.
C. Reactive power control by VRE plants with enabled STATCOM capability
The two previous examples are compared to the scenario, where some of the VRE plants are equipped with STATCOM capability. This enables the VRE plant to consume or produce reactive power regardless of active power infeed. However, for this functionality to come into operation, existing VRE plants need to be retrofitted [7] and it results in additional operational costs due to active power losses.
As in strategy A, the STATCOM capability is only applied to the two WPPs connected to the MV busbar, which enables them to shift reactive power by 11.4 Mvar in either direction.
D. Reactive power setpoints at the HV connection point
The overall objective of the previous Q-management strategies is to obtain a constant reactive power value at the HV connection point, that is chosen through a setpoint. Three different reactive power setpoints are analyzed:
- Setpoint 1: Qhv = -3 Mvar - Setpoint 2: Qhv = 0 Mvar - Setpoint 3: Qhv = 3 Mvar
Hence, the VRE plants control their reactive power output in such a way that the difference between Q-setpoint and reactive power value at the HV connection point is minimized. Alternatively, an active power dependent Q-setpoint could be chosen or time-variable Q-setpoints could be given by the transmission system operator to manage reactive power balances in the transmission grid. This analysis provides insights to which degree such
Figure 3: Applied Q(U) characteristic for MV feeder-connected VRE plants in strategy A and C; Q(U) adjustment range for the
same VRE plants in strategy B
16th Int'l Wind Integration Workshop | Berlin, Germany | 25-27 October, 2017
setpoints could be achieved if the setpoints are kept within a reactive power bandwidth of -3 Mvar to 3 Mvar.
V. RESULTS
A. Reactive power control by largest VRE plants, connected to the MV busbar
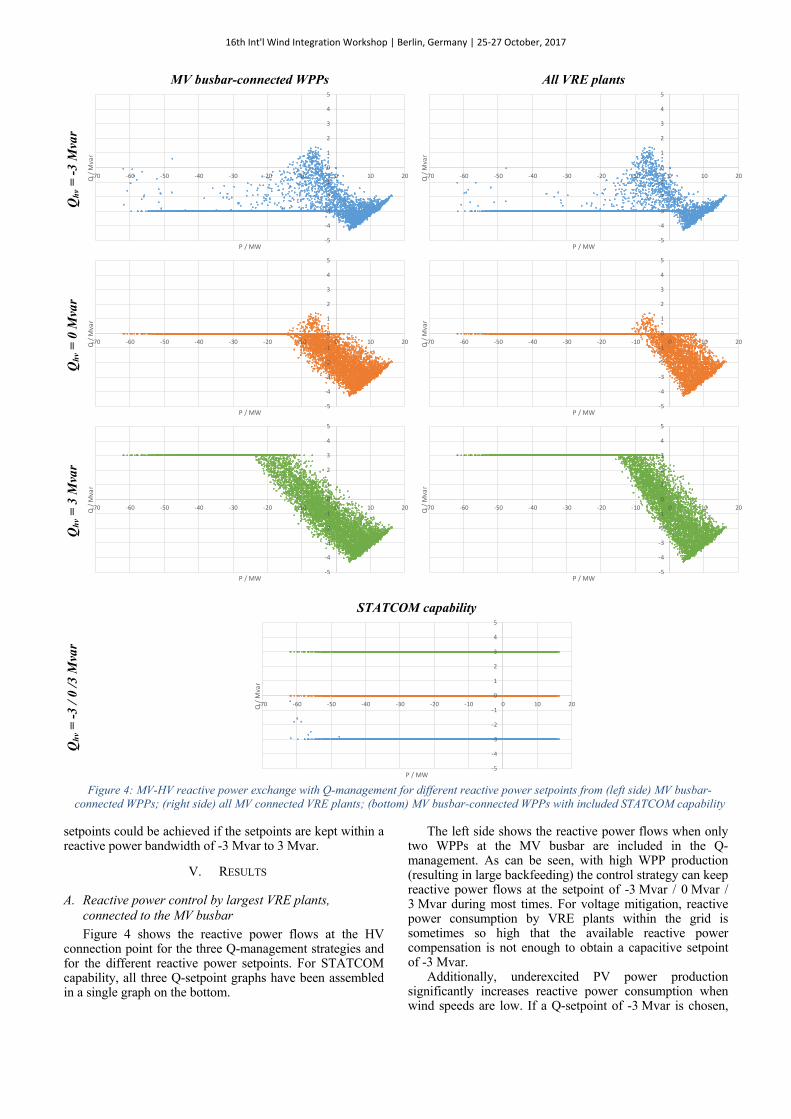
Figure 4 shows the reactive power flows at the HV connection point for the three Q-management strategies and for the different reactive power setpoints. For STATCOM capability, all three Q-setpoint graphs have been assembled in a single graph on the bottom.
The left side shows the reactive power flows when only two WPPs at the MV busbar are included in the Q-management. As can be seen, with high WPP production (resulting in large backfeeding) the control strategy can keep reactive power flows at the setpoint of -3 Mvar / 0 Mvar / 3 Mvar during most times. For voltage mitigation, reactive power consumption by VRE plants within the grid is sometimes so high that the available reactive power compensation is not enough to obtain a capacitive setpoint of -3 Mvar.
Additionally, underexcited PV power production significantly increases reactive power consumption when wind speeds are low. If a Q-setpoint of -3 Mvar is chosen,
Figure 4: MV-HV reactive power exchange with Q-management for different reactive power setpoints from (left side) MV busbar-connected WPPs; (right side) all MV connected VRE plants; (bottom) MV busbar-connected WPPs with included STATCOM capability
MV busbar-connected WPPs All VRE plants Q
hv =
-3
Mva
r
Qh
v = 0
Mva
r
Qh
v = 3
Mva
r
STATCOM capability
Qh
v = -
3 / 0
/3 M
var
-5
-4
-3
-2
-1
0
1
2
3
4
5
-70 -60 -50 -40 -30 -20 -10 0 10 20Q /
Mva
r
P / MW-5
-4
-3
-2
-1
0
1
2
3
4
5
-70 -60 -50 -40 -30 -20 -10 0 10 20Q /
Mva
r
P / MW
-5
-4
-3
-2
-1
0
1
2
3
4
5
-70 -60 -50 -40 -30 -20 -10 0 10 20Q /
Mva
r
P / MW-5
-4
-3
-2
-1
0
1
2
3
4
5
-70 -60 -50 -40 -30 -20 -10 0 10 20Q /
Mva
r
P / MW
-5
-4
-3
-2
-1
0
1
2
3
4
5
-70 -60 -50 -40 -30 -20 -10 0 10 20Q /
Mva
r
P / MW-5
-4
-3
-2
-1
0
1
2
3
4
5
-70 -60 -50 -40 -30 -20 -10 0 10 20Q /
Mva
r
P / MW
-5
-4
-3
-2
-1
0
1
2
3
4
5
-70 -60 -50 -40 -30 -20 -10 0 10 20Q /
Mva
r
P / MW
16th Int'l Wind Integration Workshop | Berlin, Germany | 25-27 October, 2017

this reactive power consumption cannot be compensated while for Q-setpoints of 0 Mvar and 3 Mvar, this actually comes to an advantage since it countervails the capacitive grid behavior.
B. Reactive power control by all MV connected VRE plants
The right side of Figure 4 shows the reactive power flows when all MV connected VRE plants are participating in Q-management. For a Q-setpoint of -3 Mvar, only a modest improvement compared to strategy A can be achieved, even though almost twice as much VRE capacity is used for the control. For a Q-setpoint of 0 Mvar and 3 Mvar, larger improvements can be obtained. These come mostly from the PVPP as it maximizes reactive power consumption during daylight times with low wind speeds to compensate the capacitive grid behavior. As a result, the offset to 0 Mvar and 3 Mvar is closed earlier.
For example, the Q-setpoint of 3 Mvar can always be fulfilled for reverse power flows above -15 MW while for strategy A this is only the case for reverse power flows above -25 MW.
C. Reactive power control by VRE plants with enabled STATCOM capability
Enabling STATCOM behavior for the two WPPs at the MV busbar allows the reactive power at the HV connection point also to be controlled during load conditions. As the bottom graph in Figure 4 shows, the setpoints are kept in almost all load and generation conditions. There are only very few exceptions for a Q-setpoint of -3 Mvar and high backfeeding, when the 11.4 Mvar of reactive power provision by the two WPPs is not enough to compensate the reactive power consumption by the non-controllable VRE generators and the additional reactive power consumed by lines and transformers due to high power flows.
Still, by only equipping two WPPs with STATCOM capability, representing 42 % of total VRE capacity, it would be possible to fully keep the MV network at the
predefined reactive power setpoints. Therefore, this strategy would be very suitable to be integrated into a control scheme where reactive power setpoints are sent by the transmission operator in regular intervals.
D. Summary of different Q-management strategies
Figure 5 summarizes the ability of the VRE plants to improve the reactive power balance with the HV network and gives additional information on the amount of reactive power provided by the VRE plants. Under current cosφ(P) settings, the amount of reactive power deviating from Qhv = -3 Mvar accumulates to a total of 10.7 Gvarh throughout a whole year. Due to the capacitive grid behavior, the deviation from a Q-setpoint of 0 Mvar and 3 Mvar is usually larger and therefore amounts to a total of 24.2 Gvarh and 48.4 Gvarh, respectively.
By performing Q-management with the MV busbar-connected VRE generators (strategy A), reactive power deviations can be significantly reduced by 75 %, 55 % and 39 % for the -3 Mvar, 0 Mvar and 3 Mvar setpoint, respectively, compared to the current cosφ(P) settings. In addition, total reactive power flows from controllable VRE generators are substantially reduced. Part of this decrease is caused by the switch to a Q(U) characteristic which reduces the reactive power consumption from VRE plants connected to the MV feeders. The other part is caused by reduced reactive power provision by the controllable VRE plants. In the case of a 0 Mvar and 3 Mvar setpoint, however, positive reactive power flows (Q consumption) actually increase as the controllable VRE plants are increasingly used for reactive power consumption.
Including the rest of controllable MV VRE generators for Q-management (strategy B) further reduces the HV reactive power exchange only by a small amount. A larger improvement is seen for the higher reactive power setpoints, as more reactive power is consumed than would be required by the Q(U) control. The resulting improvement is therefore
Figure 5: Accumulated yearly MV-HV reactive power flow deviating from the reactive power setpoint (black markers) and reactive power flows from controllable MV VRE generators (columns). Results are depicted for the three reactive power setpoints -3 Mvar, 0 Mvar and
3 Mvar
0
5
10
15
20
25
30
35
40
45
50
E Q/
Gva
rh
Q_VRE consumed Q_VRE supplied Accumulated deviation from Q-setpoint
Qhv = -3 Mvar Qhv = 0 Mvar Qhv = 3 Mvar
16th Int'l Wind Integration Workshop | Berlin, Germany | 25-27 October, 2017

accompanied by an equivalent increase in reactive power consumption from the VRE plants.
Applying a STATCOM capability to the two WPPs connected to the MV busbar (strategy C) reduces reactive power flows diverging from the Q-setpoints completely. Depending on the setpoint choice, however, reactive power flows from VRE generators can greatly increase. Particularly for the 3 Mvar setpoint case, the two WPPs have to compensate the capacitive grid behavior during load conditions. As a consequence, total reactive power flows more than double compared to the current cosφ(P) settings.
VI. CONCLUSION
Three different strategies have been examined to control the reactive power output from VRE generators with the aim to improve the reactive power flow between an MV and an HV network. Utilizing only VRE generators connected to the MV busbar benefits from its simplicity as only a limited number of VRE generators needs to be controlled. By controlling only 42 % of total VRE generation, reactive power deviations from the reactive power setpoint can be reduced by about 40 % to 75 %, depending on the reactive power setpoint. Utilizing all controllable VRE generators connected to the MV network improves the reactive power balance only by a modest amount. The largest improvements come from the fact that a PV power plant is included in the reactive power management. If applicable a reactive power management should therefore make use of a combined reactive power provision by PV and wind power plants. The best option of reactive power control would be by equipping the MV busbar-connected VRE generators with STATCOM
capability, hereby enabling wind power plants to supply reactive power also during no-wind conditions. While giving maximum flexibility, this option needs to be weighed against costs for the additional functionality and increased reactive power flows from the VRE generators, that may lead to a faster deterioration of the wind power plant’s inverter.
REFERENCES [1] VDE, “VDE-AR-N 4105:2017-07: Technical requirements for the
connection to and parallel operation with low-voltage distribution networks”, 2017.
[2] VDE, “VDE-AR-N 4110:2017-03: Technical requirements for the connection and operation of customer installations to the medium voltage network (TAR medium voltage)”, 2017.
[3] German Energy Agency (dena), “dena Ancillary Services Study 2030. Security and reliability of a power supply with a high percentage of renewable energy.”, 2014.
[4] BMWi, “Future procurement of reactive power and other measures to ensure grid security. Final Report on behalf of the Federal Ministry for Economic Affairs and Energy.”, 2016.
[5] Barth, Heike, et al. "Technical and economical assessment of reactive power provision from distributed generators: Case study area of East Denmark." PowerTech (POWERTECH), 2013 IEEE Grenoble. IEEE, 2013.
[6] Wang, Haonan, et al. "Controlled Reactive Power Provision at the Interface of Medium-and High Voltage Level: First Laboratory Experiences for a Bayernwerk Distribution." International ETG Congress 2015; Die Energiewende-Blueprints for the new energy age; Proceedings of. VDE, 2015.
[7] SMA, “Q at Night: Reactive power outside feed-in operation with the SUNNY CENTRAL series CP XT, CP-JP and CP-US.”, 2011. Available at: http://files.sma.de/dl/18858/Q-at-Night-TI-en-11.pdf
16th Int'l Wind Integration Workshop | Berlin, Germany | 25-27 October, 2017