17 energy intake by wild chimpanzees and orangutans ... · individuals in the party, changing...
TRANSCRIPT
444 Robert W. Mayes
On, A. (1998). The intake of Herbage, Supplementary Feed and Pelformance of growing Ostriches (Struthio camelus) Given two Different Feeding Regimens in North East Scotland. Unpublished M.Sc. thesis, University of Aberdeen.
Rao, S. J., Iason, G. R., Hulbert, 1. A. R., Mayes, R. W., & Racey, P. A. (2003). Estimating diet composition for mountain hares in newly established native woodland: development and application of plant-wax faecal markers. Canadian Journal of Zoology, 81,1047-56.
Remis, M. J. & Dierenfeld, E. S. (2004). Digesta passage, digestibility and behavior in captive gorillas under two dietary regimens. International Journal of Primatology, 25, 825-45.
Salt, C. A., Mayes, R. W., Colgrove, P. M. , & Lamb, C. S. (1994). The effects of season and diet composition on the radiocaesium intake by sheep grazing on heather moorland. Journal of Applied Ecology, 31, 125-36.
Tilley, J. M. A., & Teny, R. A. (1963). A two-stage technique for the in vitro digestion offOl·age crops. Journal of the British Grassland Society, 18, 104-1l.
Tulloch, A. P. (1976). Chemistry of waxes of higher plants. In Chemistry and Biochemistry of Natural Waxes, ed. P. E. Kollattukudy, pp. 235-87. Amsterdam: Elsevier.
Tutin, C. E. G. & Fernandez, M. (1992). Insect-eating by sympatric lowland gorillas (Gorilla gorilla gorilla) and chimpanzees (Pan troglodytes troglodytes) in the Lope Reserve, Gabon. American Journal of Primatology, 28, 29-40.
Wilson, H., Sinclair, A. G., Hovell , F. DeB., Mayes, R. W., & Edwards, S. A. (1999). Validation of the n-alkane technique for measuring herbage intake' in sows. Proceedings of the British Society of Animal Science, 171.
Woolnough, A. P. (1998) . The Feeding Ecology of the Northern Hairy-nosed Wombat, Lasiorhinuskrefftii (Marsupiala: vambatidae). Unpublishep Ph.D. thesis, Australian National University.
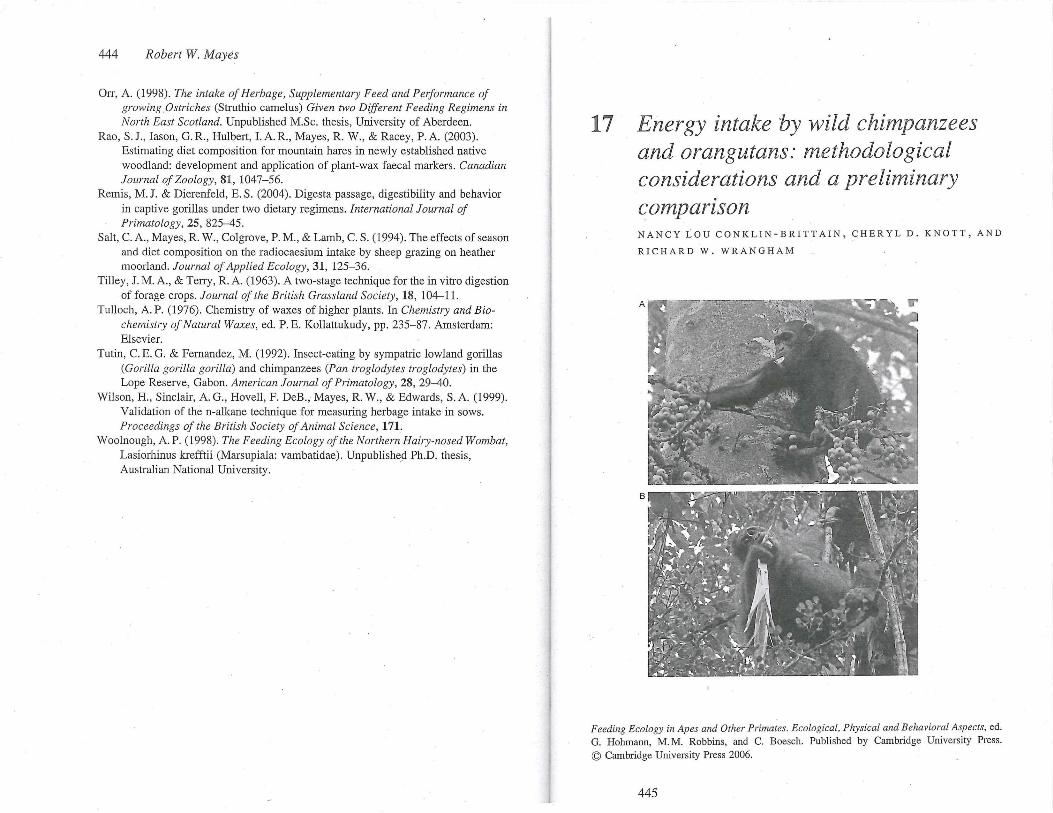
17 Energy intake by wild chimpanzees and orangutans: methodological considerations and a preliminary companson NANCY LOU CONKLIN-BRITTAIN, CHERYL D. KNOTT, AND
RICHARD W. WRANGHAM
Feeding Ecology in Apes and Other Primates. Ecological, Physical and Behavioral Aspects, ed. G. Hohmann, M. M. Robbins, and C. Boesch. Published by Cambridge University Press. © Cambridge University Press 2006.
445
446 Nancy Lou Conklin-Brittain et al.
Introduction
Energy intake and energy balance are critical for successful ovulation and conception in great apes, including humans (Lipson & Ellison, 1996; Knott 1998, 1999,2001; Ellison, 2001). Energy is also the principal currency used in optimal foraging theory (Schoener, 1987). For these.reasons, energy intake is an important variable for research in primate ecology, but it has rarely been estimated in the wild. Even in the controlled conditions of a laboratory, energy intake is difficult to measure accurately, and even more so in the wild (Dasilva, 1992; Nakagawa, 1997,2000; Wasserman & Chapman, 2003).
There are two methods for determining the energy content of a food. The first, and most direct, requires experimental control of feeding; it is also the most timeconsuming and expensive. It begins by using bomb calorimetry to determine the gross energy (GE) value of a food item (see glossary) (Schneider & Flatt, 1975). Since the gross energy value includes calories that are not digestible, the indigestible fraction must then be estimated. This can be done by feeding the food in question to several individuals and using bomb calorimetry to determine the energy content of the resulting feces. Subtraction yields the digestible energy (DE) (gross energy minus fecal energy). A more precise version of energy intake, metabolizable energy (NIE), can be obtained in a similar way, by subtracting the energy in urine. Net energy (NE) subtracts heat and gaseous losses from ME (Schneider & Flatt, 1975), but requires special equipment, and is usually not measured for non-ruminants. While the above procedures are potentially precise, they are not normally practical for the study of wild foods . We therefore used the second method, consisting of calculated estimates, which will be described in the Methods section.
An initial estimate of energy intake can be calculated from two main variables, the amount of time spent feeding on different food items, and the concentration of the macronutrients in those items. One aim of this paper, therefore, is to use such data to do a preliminary t omparison of the daily energy intake of wild chimpanzees (Pan troglodytes schweinfurthii) and orangutans (Pongo pygmaeus abelii). Our data come from 8 and 9 months of observation, respectively, for the two species, including periods of both high and low fruit availability. They include simple activity budgets that allow us to assess energy usage. Following the hypothesis that orangutans are adapted to larger variance in fruit availability than most primates (Knott, 1998, 1999, 2005) we predict that variation in energy intake between months is greater for orangutans than for chimpanzees.
Our second aim is to evaluate the problems associated with energy intalce estimates. In particular, we consider the critical but poorly quantified role of the fermentation of fibe~· in the hindgut. We rely heavily on the fiber digestion
Energy intake by wild chimpanzees and orangutans 447
coefficient determined by Milton & Demment (1988) because there are no others available. Following this we rely on three assumptions: (1) fiber in wild foods chemically resembl'es the fiber in the captive diet fed to the chimpanzees dUling the digestion trial; (2) chimpanzees in captivity have a capacity for fiber fermentation similar to that of those in the wild; and (3) body size differences between chimpanzees and orangutans will not interfere with our use of the same digestion coefficient for both. These and additional sources of error will be fUlther discussed.
We use only neutral-detergent fiber (NDF) in our calculations rather than acid-detergent fiber (ADF) or crude fiber (see glossary). This is because NDF is the only one of these fiber measures that includes hemicellulose (van Soest, 1994; N. R. C., 2003). Since hemicellulose is partially fermentable by chimpanzees (and presumably by orangutans) (Milton & Demment, 1988), NDF is the best index of total insoluble fiber and of energy available from fiber. We do not recommend the use of ADF or crude fiber.
Methods
Field methods
Chimpanzees Methods for observing chimpanzees were described by Wrangham et al. (1998). Briefly, chimpanzees were studied in the Kanyawara sector of Kibale National Park, Uganda in 1992 and 1993. They were habituated sufficiently to allow uninterrupted observation when they were in trees. When on the ground, most adult males allowed observers to sit about 5 m away, but even so, thick vegetation made viewing of terrestrial foods difficult at times. Chimpanzees could not always be located and followed predictably. Therefore, chimpanzees were observed whenever they could be found.
Feeding observations were recorded by instantaneous, focal-animal sampling (Wrangham et aI., 1998). Focal observations were rotated among all available individuals in the party, changing targets every 10 minutes. At the end of a lO-mi~ute focal-animal session, the observer located a new target individual whose behavior had not been recorded for at least 20 minutes. After a target was selected, it was observed for 60 s, at the end of which its instantaneous behavior was recorded. DUling those 60 s, a feeding rate of bites/minute was recorded whenever possible. The monthly number of 10-minute plant-feeding observations was 271 ± 106 (mean ± sid per month) for the 8 months considered in this study, i.e., an average of 45.2 plant-feeding hours per month.
448 Nancy Lou Conklin-Brittain et al.
Orangutans Methods for recording orangutan data were described in Knott (1998). The orangutans were studied in the Cabang Panti Research Site in Gunung Palung National Park, West Kalimantan, Indonesia between 1994 and 1996. They were also well habituated, but could not always predictably be located and followed, and so were also observed whenever they could be found.
Feeding observations were recorded by a combination of continuous recording of a focal-animal throughout the day imd instantaneous, focalanimal sampling within each feeding bout. The start of a feeding bout was recorded and then every 2 minutes, when possible, the observer counted the number of fruits or leaves, etc. the individual put in its mouth during 60 s (feeding rate), for a total of 3 minutes per record. When possible, five feeding rates were collected for each bout and if the bout lasted long~r than 10 minutes, subsequent feeding rates were collected every 5 minutes until the bout ended. The monthly number of plant-feeding minutes was 7459 ± 3331 (mean ± standard deviation per month) for the 9 months included in this study, an average of 124.3 plant-feeding hours per month.
Definition of feeding
For both the chimpanzees and orangutans, feeding was defined as reaching, picking, handling, or chewing a food item, and these actions were included in the feeding rate. Plant food items were categorized as: fruit (ripe or urn-ipe; pulp, husk, or skin), seed (ripe or urn-ipe; with or without seed coat), leaf (young or mature; petiole, bud, or blade), flower (age and part, e.g., sepal, petal, buds), pith, root, bark, cambium, and wood.
We characterized food items by the average weight eaten per minute. For small items, we estimated intake rate using the number of bites per minute and the size of bites, e.g., one fruit per bite, 10 leaflets Ber bite, half a leaf per bite, etc. Some fruits eaten by orangutans required more than 1 mInute to . consume. For those large items, we calculated intake rate using the period between picking one fruit, eating it, and picking the next.
Sample processing
We determined the fresh weights of individual items eaten as soon as possible after harvesting them. The fresh weights of 5-20 individual specimens per
Energy intake by wild chimpanzees and orangutans 449
food type were recorded to determine the average wet (fresh) and dry weights for a food. To process ~chimpanzee fruits, we weighed the whole fruit, then cut the pulp off the seed or seeds and weighed the individual seed or group of seeds. The weight of the fresh fruit pulp was determined by difference (whole fruit weight minus seed(s) weight, less other undigested parts such as skins). For orangutan fruits , each plant part was weighed separately after weighing the whole fruit. Fruits were dissected within the weighing dishes to avoid loss of pulp liquid while processing. We recorded the number of seeds per fruit. In addition, for nutrient analysis, about 100 g of fresh weight of the same food was collected, weighed, and processed in bulk. We reconstructed pith or bark quantities by examining feeding remains and determining how many centimeters of pith within a plant'S stem or bark had been eaten and harvesting similar sized pieces to determine the fresh and dry weights consumed over a measured amount of time.
The plant samples were then air-dried in the shade. Analyses necessary for the calculation of energy content are not compromised by air-drying. For a description of the chimpanzee food dryer, see Conklin-Brittain eta!' (1998). We constructed racks with legs and multiple shelves made of wire mesh, which were then set over a heat source (kerosene lamps). The orangutan foods were dried in a large metal, kerosene drying oven with wire racks inside the oven. In both cases, trays or dishes made of aluminum foil worked well to conduct heat and allow fast drying.
The most important charactelistic of a drying arrangement, in addition to maintaining a 30-40 QC temperature, is to dry samples quickly to prevent both fermentation and molding, which can change the chemical composition of a sample (Harborne, 1984). The critical period in drying is the first several hours, when the water content is the highest and the samples are sitting in a warm environment. To facilitate the escape of water we initially reduced large items of pulp or pith to pieces, sometimes as small as 5-10 mm2 in area. We stirred the drying samples frequently , and examined them several times daily for mold. Samples that became moldy (yellow or grey fuzz) or fermented (blackened) were discarded; we re-collected that sample, sliced it more thinly and dried it at a higher temperature (maximum 50 QC). In a few cases, the new samples also turned black; nevertheless we accepted such items in our analyses. We recorded the dry weights as the "field-dried" weight.
In Kibale, a comparatively dry environment, we stored the dried samples in paper envelopes in a large, covered basket suspended from the ceiling in the drying room. In Gunung Palung, we stored dried samples in heat-sealed plastic bags, and then placed these bags in a larger bag containing silica gel to prevent humid air from rehydrating the samples.
450 Nancy Lou Conklin-Brittain et al.
Lab methods
We assayed nutrient composition of each food using standard chemical methods, and used conventional estimates of the energy content of different nutrients to assess total energy content (Atwater physiological fuel values: see glossary) (Watt & Merrill, 1963; N. R. c., 1981, 2003). Chemical values are reported as a percentage of organic matter instead of dry matter (see below and glossary).
Protein and fat For chemical analysis we ground the field-dried samples through a #20-mesh screen in a Wiley Mill. We determined crude protein (CP) by using the Kjeldahl procedure for total nitrogen and mUltiplying by 6.25 (Pierce & Haenisch, 1947). The digestion mix contained Na2S04 and CUS04' The distillate was collected in 4% boric acid and titrated with O.lN HCl. We measured lipid content using petroleum ether extraction for four days at room temperature, a modification of the method of the Association of Official Analytical Chemists (A.O.A.C., 1984).
Fiber and carbohydrates ' We used the Detergent System of Fiber Analysis (Goering & van Soest, 1970) as modified by Robertson & van Soest (1980) to determine the neutraldetergent fraction (NDF), also referred to as the insoluble, structural, plant cell-wall fiber fraction (see glossary). We determined total nonstructural carbohydrates (TNC), i.e., the digestible carbohydrates, by difference (see glossary):
%TNC = 100 - %lipid - %crude protein - %total ash - %NDF (17.1)
This fraction (TNC) is sometimes referred to as the ~ltrogen-free extract (NFE).
As stated in the introduction, if the acid-detergent fiber (ADF) was used in this equation instead of NDF, the hemicellulose fraction would be included in the TNC and subsequently treated as if it were a highly digestible carbohydrate, which it is not. Hemicellulose is an insoluble fiber (see glossary) and insoluble fibers are not digested, except to a limited extent by fermentation, e.g., in the hindgut. Likewise, the hemicellulose and lignin that the crude fiber extraction misses would be included in the TNC and mistakenly treated as though they were both digestible (van Soest, 1994).
Energy intake by wild chimpanzees and orangutans 451
Dry matter, total ash, and organic matter We determined the final dry matter (DM) correction coefficient (AO.A.C., 1984) by drying a small subs ample of the field-dried sample at 100°C for 8 h and weighing it hot (= g 100°C DM/g field-dried sample). Total ash (g ash/g field-dried sample) was measured by ashing (burning) the same DM subsample at 520°C for 8 h and then weighing it at 100°C. We calculated the organic matter (OM) correction coefficient of the sample as:
OM correction coefficient(g aMI g field-dried sample) = (1 - total ash) x DM correction coefficient (17.2)
These DM and OM correction coefficients are applied to the field-dried DM value to determine the grams of OM in the fresh food:
g aMI g fresh food = field DM coefficient x final DM correction coefficient x OM correction coefficient
The ash values for the foods analyzed he~e varied between 3% and 20%, which are probably typical values for wild plants. Since ash (total inorganic minerals, see glossary) does not contribute energy to a food, and since dry matter (DM) includes the ash, we express nutrient values as a percentage of OM instead of DM.
Physiological fuel values
Following conventional practice, we calculated energy content using standard conversion factors (i.e., physiological fuel values): 4 kcal/g (16 kJ/g) carbohydrate (TNC), 4 kcal/g (17 kJ/g) crude protein (CP) and 9 kcal/g (37 kI/g) lipid (N. R. c., 1980, 1981, 1989,2003). We also included a fourth conversion factor for the potentially available energy in NDF. A fiber digestion coefficient for chimpanzees (see glossary) has been published by Milton & Demment (1988), and in that study, chimpanzees digested 54.3% of the NDF fed to them in the form of a primate biscuit containing 34% NDF (meaning the digestion coefficient is 0.543). Conveniently, reported wild diets consumed by both the chimpanzees and the orangutans averaged about 34% NDF (Conklin-Brittain et al., 1998; Knott, 1999).
The second consideration in the fiber conversion factor is as follows: since the fibers hemicellulose and cellulose are carbohydrates, the conversion factor of 4 kcal/g (16 kI/g) could theoretically be applied to them, except that the anaerobic microbes doing the digestion/fermentation keep about 1 kcal/g (4 kI/g) of fiber for their own growth (of the 36 moles ATP in
452 Nancy Lou Conklin-Brittain et al.
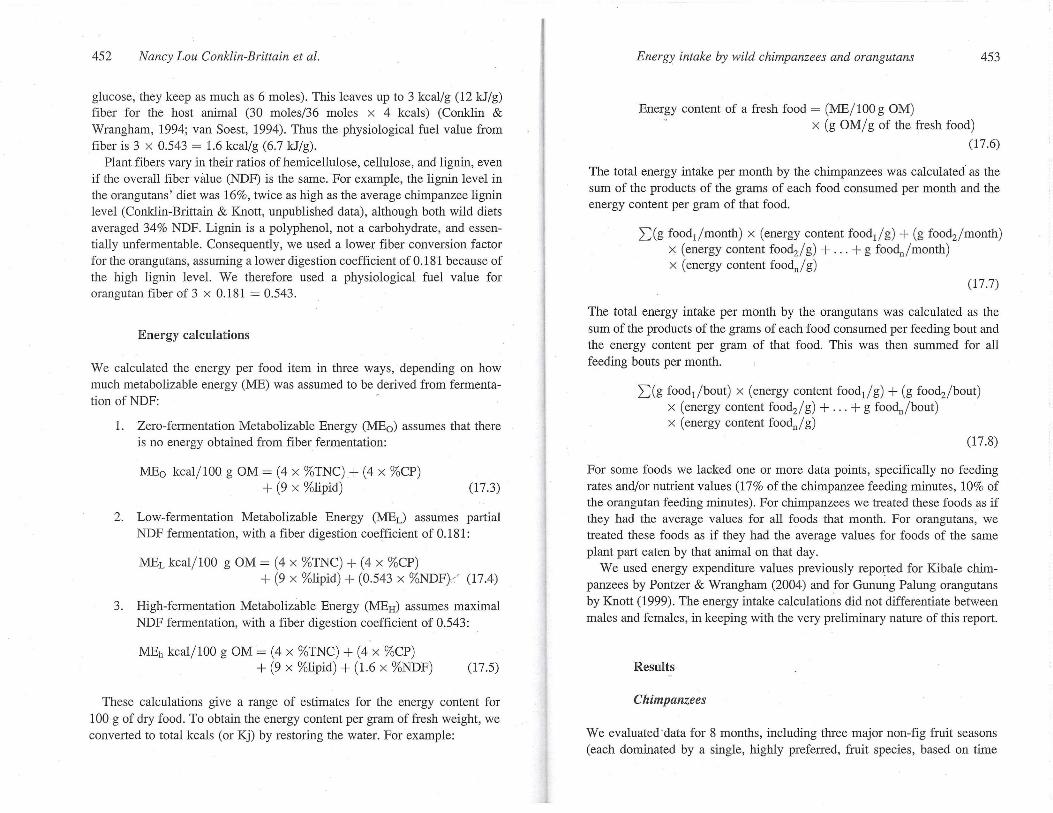
glucose, they keep as much as 6 moles). This leaves up to 3 kcal/g (12 kI/g) fiber for the host animal (30 moles/36 moles x 4 kcals) (Conklin & Wrangham, 1994; van Soest, 1994). Thus the physiological fuel value from fiber is 3 x 0.543 = 1.6 kcal/g (6.7 kI/g).
Plant fibers vary in their ratios of hemicellulose, cellulose, and lignin, even if the overall fiber value (NDF) is the same. For example, the lignin level in the orangutans ' diet was 16%, twice as high as the average chimpanzee lignin level (Conklin-Blittain & Knott, unpublished data), although both wild diets averaged 34% NDF. Lignin is a polyphenol, not a carbohydrate, and essentially unfermentable. Consequently, we used a lower fiber conversion factor for the orangutans, assuming a lower digestion coefficient of 0.181 because of the high lignin level. We therefore used a physiological fuel value for orangutan fiber of 3 x 0.181 = 0.543.
Energy calculations
We calculated the energy per food item in three ways, depending on how much metabolizable energy (ME) was assumed to be derived from fermenta-tion of NDF: "
1. Zero-fermentation Metabolizable Energy (MEa) assumes that there is no energy obtained from fiber fermentation:
MEa kcai/ IOO g OM = (4 x %TNC) + (4 x %CP) + (9 x %lipid) (17.3)
2. Low-fermentation Metabolizable Energy (MEd assumes partial NDF fermentation, with a fiber digestion coefficient of 0.181:
MEL kcai/ IOO g OM = (4 x %TNC) + (4 x %CP) + (9 x %lipid) + (0.543 x %NDF)<' (17.4)
3. High-fermentation Metabolizable Energy (MEH) assumes maximal NDF fermentation, with a fiber digestion coefficient of 0.543:
MEh kcai/IOO g OM = (4 x %TNC) + (4 x %CP) + (9 x %lipid) + (1.6 x %NDF) (17.5)
These calculations give a range of estimates for the energy content for 100 g of dry food. To obtain the energy content per gram of fresh weight, we converted to total kcals (or Kj) by restoring the water. For example:
Energy intake by wild chimpanzees and orangutans 453
Energy content of a fresh food = (ME/ IOO g OM) o x (g OM/ g of the fresh food)
(17.6)
The total energy intake per month by the chimpanzees was calculated as the sum of the products of the grams of each food consumed per month and the energy content per gram of that food.
I:(g foodd month) x (energy content foodd g) + (g food2/ month) x (energy content food2 / g) + ... + g foodn / month) x (energy content foo~/ g)
(17.7)
The total energy intake per month by the orangutans was calculated as the sum of the products of the grams of each food consumed per feeding bout and the energy content per gram of that food. This was then summed for all feeding bouts per month.
I:(g fooddbout) x (energy content foodl / g) + (g food2 / bout) x (energy content food2/ g) + .. . + g foodn / bout) x (energy content foodn/ g)
(17.8)
For some foods we lacked one or more data points, specifically no feeding rates and/or nutrient values (17% of the chimpanzee feeding minutes, 10% of the orangutan feeding minutes) . For chimpanzees we treated these foods as if they had the average values for all foods that month. For orangutans, we treated these foods as if they had the average values for foods of the same plant part eaten by that animal on that day.
We used energy expenditure values previously repOlted for Kibale chimpanzees by Pontzer & Wrangham (2004) and for Gunung Palung orangutans by Knott (1999). The energy intake calculations did not differentiate between males and females, in keeping with the very preliminary nature of this report.
Results
Chimpanzees
We evaluated data for 8 months, including three major non-fig fruit seasons (each dominated by a single, highly preferred, fruit species, based on time

454 Nancy Lou Conklin-Brittain et al.
spent feeding), one minor non-fig fruit season (dominated by several, lesspreferred fruits) and one fig season (Table 17.1). Figs were eaten throughout the year but the fig season comprised about eight different fig species, and was a 3-month period when very few non-fig fruit species were eaten. Table 17.2 shows the energy values calculated for the adult and sub-adult chimpanzees of both sexes combined, using Equations 1 and 3 described in the Methods.
Using the energy expenditures by males and lactating female chimpanzees, as estimated by Pontzer & Wrangham (2004), and examining the differences between the two different methods of energy intake calculation (Figure 17.1), the data in Tables 17.1 and 17.2 suggest that without including the potential contribution from fiber, the energy from MEa was enough to satisfy maintenance, walking, and climbing energy expenditures for only a few months.
As can be seen in Figure 17.1, if the energy from fiber felmentation were not included, lactating chimpanzees would frequently experience inadequate energy intake. However, if they could ferment fiber at the rate that captive chimpanzees can (Milton & Demment, 1988), both males and females would have surplus energy. For the eight months of this study, although there appeared to be fairly dramatic differences between MEa and MER energy intake (Figure 17.1), energy intake was not significantly con-elated with fruit availability, as measured by monthly phenological observations (Wrangham et al., 1998) (r2 = 0.12 for MEa, NS; r2 = 0.05 for MER; NS). The same was
Table 17.l. Feeding ecology summary: source of data and sample sizes for
chimpanzee feeding observations
No.obsv's No. food
Total no. used in % of No. food types
Dominant fruit feeding energy obsv's types used
available obsv's calc. included eaten in calc.
Month September 92 Pseudospondias 267 213 80 25 12
October 92 Misc. fruit 205 176 86 13 7
January 93 Mimusops 73 64 89 10 4
February 93 Mimusops 277 238 87 29 14
March 93 Figs 332 277 83 40 19
April 93 Figs 242 193 80 35 13
May 93 Figs 424 311 73 44 15
June 93 Uvariopsis 351 302 90 28 7
Total/mean 2171 1774 83 28 11
Total number of feeding observations comes from 10-minute samples. Food types are a combination of plant species and plant part. Season refers to tbe dominant fruit species eaten. Obsv's = observations; calc.= calculation.
Energy intake by wild chimpanzees and orangutans 455
Table 17.2. Estimated daily energy intake by chimpanzees
MEH MEa %MEH
Month Dominant fruit Kcal kJ Kcal kJ from fiber
September 92 P seudospondias 1806 7558 1206 5046 33.2 October 92 Misc. fruit 1955 8179 1540 6443 21.2 January 93 Mimusops 2603 10892 2002 8376 23.1 February 93 Mimusops '3333 13947 2535 10606 23.9 MaTch 93 Figs 2009 8406 1381 5778 31.3 April 93 Figs 2116 8853 1456 6092 31.2 May 93 Figs 2286 9563 1601 6699 30.0 June 93 Uvariopsis 2616 10947 1912 8000 26.9
Season refers to tbe dominant fruit species eaten. MEH = the total estimated metabolic energy intake in kilocalories (kilojoules) assuming a high level of fiber fermentation. MEa = the total estimated metabolic energy intake in kilocalories (kilojou1es) assuming no fiber fermentation.
C/)
ill S 0 § SZ
16000
14000
12000
10000
8000
6000
4000
2000
=kJ/ma MEa intake _kJ/ma MEh intake - ... - kJ expended/day - males ---- kJ expended/day - lactating females
I o~~~~I~£m~Lp~~~~ -~~~~~-~~~~~-~~~
Month
Figure 17.1. Chimpanzee energy intake compared to energy expenditure. Female chimpanzees,were lactating. There was no measure available for monthly variation in energy expenditure.

456 Nancy Lou Conklin-Brittain et al.
true for the percentage of energy derived from fiber (correlation with fruit availability, r2 = 0.08, NS.).
Orangutans
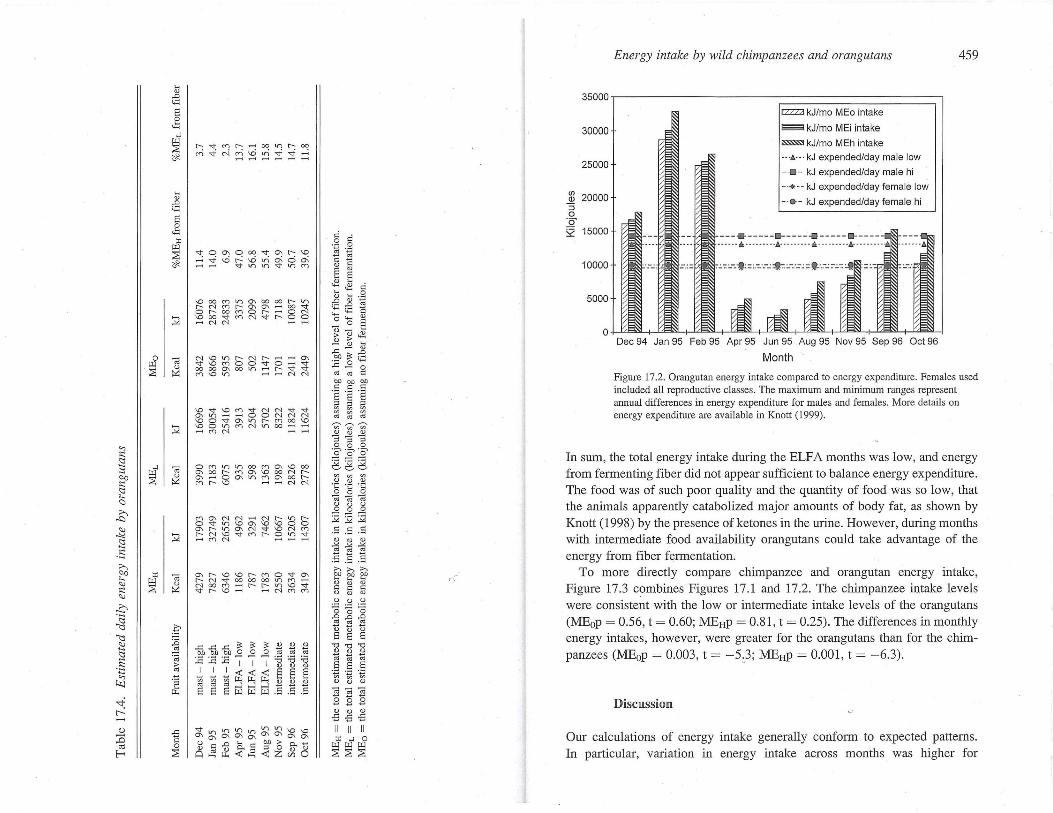
We evaluated data from 9 months, including 3 months of a mast (a superabundant fruiting season that occurs on an unpredictable basis every few years), and 3 months of extremely low fruit availability (ELFA), which frequently follows a mast period. We also included 3 months of intermediate fruit availability (Table 17.3). Table 17.4 presents energy values calculated using Equations 1, 2, and 3 for the orangutans and includes both adults and sub-adults of both sexes combined.
Using the maximum ' and minimum energy expenditures by male and female orangutans, as calculated by Knott (1999), averaged for the year, we graphed energy intake with energy expenditure (Figure 17.2). As can be seen in Figure 17.2, during the mast it does not matter which energy conversion factor is used; both males and females are more than adequately fed. Likewise, dUling ELFA, it does not matter which calculation is used because food is so scarce and of such low quality (high fiber) that energy intake is inadequate. During the intermediate fruit availability months, however, our preliminary conclusion is that the fiber digestion coefficient becomes important for the accurate estimate of energy obtained from fiber.
Using ANOVA, we compared energy intake in the three periods. The mast months were, as expected, significantly higher in e~ergy intalce than both the intermediate months (p < 0.01), and the ELFA months (p < 0.02) regardless of the method used to calculate energy intake. The intermediate months were not quite significantly higher in energy intake than the ELFA months (p 2: 0.1).
To compare the relative importance of energy from fiber we summarized the values obtained with MEL (Table 17.4). The statistical results were simi).ar for MEH. Comparing the percentage of kcals derived from fiber to food availability, the mast months' energy intake contained significantly less energy from fiber than either the intermediate or the ELF A months (mean 3.5%, 15 .2%, and 13.7%, respectively, p <0.001), but the intermediate and ELFA months were not significantly different (p = 0.21). However, when comparing the actual energy derived from fiber, the reverse was true. The mast months and the ELF A months were not significantly different (mean 202 kcal vs. 147 kcal respectively, p = 0.42). The mast months and the intermediate months were almost significantly different (mean 202 kcals vs. 344 kcals respectively, p = 0.07). The intermediate and ELFA months were significantly different (mean 344 kcals vs. 147 kcals, respectively, p = 0.02).
'" > "'-0 .0 " 0-0 4-< ::> 0'0 tf .5
o
~
I-<
'" ..0 <.;:::
r--.:;j-("")r- .... OOLr')t-oo c.-i~MM"Ov)-.:i~.....; .... ,......; ,......; ............ ,......;
,,"00\000,,"0\['-\0 .....;~0c-:0v-iO\oo\ ........ ~1.()V)'¢V")('f)
Energy intake by wild chimpanzees and orangutans 459
35000 1 ------------;::=========:::;-] 30000
25000
~ 20000 "S o "0 ~ 15000
10000
5000
o
= kJ/mo MEo intake
~ kJ/mo MEi intake
= kJ/mo MEh intake • •• .0\ ••. kJ expended/day male low
- .. - kJ expended/day male hi
_ .. * ... kJ expended/day female low
-' GI- - kJ expended/day female hi
--- ... -----. ----_ ... ----- . ---•••••••• ••••••.. /1. .......•••...••• • •• /1. .•. • •. ••
Dec 94 Jan 95 Feb 95 Apr 95 Jun 95 .Aug 95 Nov 95 Sep 96 Oct 96
Month
Figure 17.2. Orangutan energy intake compared to energy expenditure. Females used included all reproductive classes. The maximum and minimum ranges represent annual differences in energy expenditure for males and females. More details on energy expenditw·e are available in Knott (1999).
In sum, the total energy intake during the ELFA months was low, and energy from fermenting fiber did not appear sufficient to balance energy expenditure. The food was of such poor quality and the quantity of food was so low, that the animals apparently catabolized major amounts of body fat, as shown by Knott (1998) by the presence of ketones in the urine. However, during months with intermediate food availability orangutans could take advantage of the energy from fiber fermentation.
To more directly compare chimpanzee and orangutan energy intake, Figure 17.3 combines Figures 17.1 and 17.2. The chimpanzee intake levels were consistent with the low or intermediate intake levels of the orangutans (MEop = 0.56, t = 0.60; MEHP = 0.81, t = 0.25). The differences in monthly energy intakes, however, were greater for the orangutans than for the chimpanzees (MEop = 0.003, t = -5); MEHP = 0.001, t = - 6.3) .
Discussion
Our calculations of energy intake generally conform to expected patterns. In particular, variation in energy intake across months . was higher for

460
35000
30000
25000
'" 2 ii1 20000 c.- ::> >.0
~g c -'" 15000 w
10000
5000
o
Nancy Lou Conklin-Brittain et a!.
I: kJ/mo MEo int ake kJ/mo MEi inta ke kJ/mo MEh int ake
Orangutans Chimpanzees
II dll I I 1 Dec Jan Feb Apr Jun Aug Nov Sep Oct . Sep Oct Jan Feb Mar Apr May Jun
Month
Figure 17.3. The chimpanzee energy intake range compared to the orangutan energy intake range.
orangutans than chimpanzees. The lack of correlation between energy intake and fruit availability for the chimpanzees was contrary to expectation. The energy intake estimates for the low fruit availability months were perhaps overestimates, a result of difficulties collecting pith intake data.
There are many aspects that need further refinement in the energy calculation process. We will address four of the major points. First, the captive primate diet used to obtain the 0.543 digestion coefficient had a very low lignin content (about 2.5%), even though it was 34% neutral-detergent fiber (NDF). Lignin is one of the three principal insoluble fibers (together with hemicellulose and cellulose, see glossary), but is virtually unfermentable compared with the other two. As a result, fiber in the captive diet would have contained a felmentable NDF value of 34 - 2.5 = 31.5%. Meanwhile, the lignin content of wild chimpanzee foods can range from 1% to 38% lignin. The wild chimpanzee diet averaged about 8% lignin annually (ConklinBrittain et al., 1998) so the average fermentable NDF would have been 34 - 8 = 26%. Consequently, wild foods probably had lower digestion coefficients than the captive diet. This problem can be investigated by determining digestibility coefficients for fiber in wild foods in vitro, using fresh fecal microbes from adults consuming wild foods. The protocols for this procedure have been worked out for humans (Barry et al. , 1995).
Energy intake by wild chimpanzees and orangutans 461
The second caveat for wild foods is that the 4, 4, 9 conversion factors are average metabolizable energy values for low-fiber mixed human diets of meat, vegetables, grains etc. (Watt & Merrill, 1963; N.R.C. , 1980). They are undoubtedly overestimates for the availability of these nutrients in a high-fiber, wild diet (Miles et al., 1988). This problem can in theory be investigated by in vitro determination of enzymatic digestion coefficients for TNC, CP, and lipid in high fiber diets of varying NDF levels, using commercially available enzymes. These protocols have been reviewed (Moughan, 1999), but in vivo values for primates are needed to calibrate the in vitro results.
The third point refers specifically to the carbohydrate value of 4 kcal (16 kJ)/g, which may be too high because we did not differentiate between starch (the only complex carbohydrate directly digestible by mammalian enzymes) and all of the nonstarch polysaccharides, also known as soluble fiber (see glossary). Soluble fiber is fermented and can be given the conversion factor of 3 kcal (12 kJ)/g, in conjunction with a digestion coefficient, which is often fairly high (Bourquin et a!., 1996; Livesey, 2001). We used 4 kcal (16 kJ)/g in our calculation because the Detergent System of Fiber analysis (see glossary) only measures insoluble rather than soluble fiber. This problem can be ameliorated by determining the soluble fiber content (Lee et al. , 1992), a procedure commonly used in human nutrition. . Broadly speaking, resolving these three issues would lower all the energy
intake values in Figures 17.1 and 17.2 somewhat. Whether the corrections would lower the lines uniformly, leaving the statistical relationships intact, needs to be further investigated (Charrondiere etal., 2004) .
The question of which conversion factor to use for fiber leads us to discuss a fourth caveat, that concerning passage rate. One might argue that male orangutans should have a higher digestion coefficient than male chimpanzees simply because of their larger body size and the increased gut capacity that size probably provides (Demment & van Soest, 1985). However, during times of high-food abundance, the passage rate of food through the gut will probably be faster than usual because of the extreme increase in food intake. During the mast, orangutans consume approximately 4.5 times as many grams of food dry matter compared with the ELFA months (Knott, 1999). This large difference in total food intake results in a fiber dry matter intake that is 2.5 times as many grams in the mast compared with the ELFA months , in spite of the fact that the ELFA foods are individually higher in fiber. Faster passage rates lower digestion coefficients of fiber and of all the nutrients (Milton & Demment, 1988; van Soest, 1994). During times of-extremely low fruit availability, when orangutans eat leaves and bark, the lignin content of

462 Nancy Lou Conklin-Brittain et al.
the fiber increases, as already mentioned, which would lower the digestion coefficient of fiber even further. Overall, there is reason to use a lower conversion factor, perhaps a range of 0.5 to 1.0 kcal (2-4 kJ)/g, for both the orangutans and the chimpanzees. Determining passage times and digestion coefficients for fiber at varying intake levels would assist in resolving this fourth problem. The marker used for passage time of the fiber fraction should be one that chemically bonds to the food fiber, e.g., chromium-mordanted fiber; plastic pellets do not work well (van Soest et al., 1983).
A small number of other researchers have also reported preliminary energy intake values (Dasilva, 1992; Nakagawa, 1997, 2000; Knott, 1998, 1999; Wasserman & Chapman, 2003). The caveats described here apply to these studies as well. In addition, Wasserman & Chapman (2003) and Dasilva (1992) used a single digestion coefficient from Watkins et al. (1985), just as we used a single one from Milton & Demment (1988). Ideally we should have all used a different digestion coefficient unique for each and every food item eaten. Nakagawa (1997, 2000) did not include any estimate for fiber digestion. Perhaps the most pragmatic approach at this time is to use maximum/minimum ranges. We suggest a range of 0.5-1.0 kcal (2;:4 kJ)/g, in conjunction with energy expenditure estimates collected simultaneously with energy intake.
As research questions become more detailed and complicated, it is important to improve energy intake determinations. For the moment, we can make progress by calculating approximate energy intakes, especially for questions regarding the maintenance of adults. We strongly recommend that the energy calculation process be refined, as we have outlined, in order to assess energy intake for increasingly sensitive analyses, such as questions regarding growth, reproduction, and optimal foraging.
Acknowledgments
We thank the Uganda National Research Council, Forestry Department, and National Parks Board, for permission to work in the Kibale National Park and study the chimpanzees. Facilities were provided by Makerere University Biological Field Station and the Wildlife Conservation Society. The Department of Zoology, Makerere University also assisted. Funding was from the NSF (DEB-9120960), USAID, and MacArthur Foundation.
We also thank the Indonesian Ministry of Forestry (Direktorat PHKA), the Indonesian Institute of Research Science (LIPI) and the Center for Research and Development in Biology (PPPB) for their sponsorship. Grants from the National Geographic Society, the Leakey Foundation, the US Fish and
Energy intake by wild chimpanzees and orangutans 463
Wildlife Service, the Conservation, Food and Health Foundation, NSF, and the Wenner-Gren Foundation made the orangutan work possible. Thanks~ also, to the many field assistants and managers at both sites who collected data for this study.
References
A. O. A. C. (Association of Official Analytical Chemists) (1984). Official Methods of Analysis of the Association of Official Analytical Chemists, 14th edn., ed. S. S. Williams. Arlington: Association of Official Analytical Chemists.
Barry, J. L., Hoebler, C., Macfarlane, G. T. et al. (1995). Estimation of the fermentability of dietary fiber in-vitro - a European interlaboratory study. British Journal of Nutrition, 74, 303-22.
Bourquin, L. D., Titgemeyer, E. C., & Fahey, Jr., G. C. (1996). Fermentation of various dietary fiber sources by human fecal bacteria. Nutrition Research, 16,1119-31.
Charrondiere, u.R., Chevassus-Agnes, S., Marroni, S., & Burlingame, B. (2004). Impact of different macronutrient definitions and energy conversion factors on energy supply estimations. Journal of Food Composition and Analysis, 17, 339-60.
Conklin, N. L., & Wrangham, R. W. (1994). The value of figs to a hind-gut fermenting frugivore: a nutritional analysis. Biochemical Systematics and Ecology, 22, 137-51.
Conklin-Brittain, N. L., Dierenfeld, E. S., Wrangham, R. W., Norconk, M. , & Silver, S. C. (1999). Chemical protein analysis: a comparison of Kjeldahl crude protein and total ninhydrin protein from wild, tropical vegetation. Journalof Chemical Ecology, 25, 2601-22.
Conklin-Brittain, N. L., Wrangham, R. W., & Hunt, K. D. (1998). Dietary response of chimpanzees and cercopithecines to seasonal variation in fruit abundance. II. Macronutrients. International Journal of Primatology, 19, 971-98.
Dasilva, G. L. (1992). The western black-and-white colobus as a low-energy strategist: activity budgets, energy expenditure and energy intake. Journal of Animal Ecology, 61, 79-91.
Demment, M. W., & van Soest, P. J. (1985). A nutritional explanation for body size patterns of ruminant and nonruminant herbivores. The American Naturalist, 125, 641-72.
Ellison, P. T. (2001). On Fertile Ground. Camblidge, MA: Harvard University Press. Goering, H. K. & van Soest, P. J. (1970). Forage fiber analysis. In Agricultural
Handbook Number 379. Washington, DC: United States Department of Agriculture, Agricultural Research Service.
Harborne, J. B. (1984). Phytochemical Methods: A Guide to Modern Techniques of Plant Analysis, 2nd edn. London: Chapman and Hall.
Knott, C. D. (1998). Changes in orangutan caloric intake, energy balance, and ketones in response to fluctuating fruit availability. International Journal of Prima to logy, 19, 1061-79.
464 Nancy Lou Conklin-Brittain et al.
(1999). Reproductive, Physiological and Behavioral Responses of Orangutans in Borneo to Fluctuations in Food Availability. Unpublished Ph.D. thesis, Harvard
University. (2001). Female reproductive ecology ofthe apes: implications for human evolution.
In Reproductive Ecology and Human Evolution, ed. P. Ellison, pp. 429-63. New York, NY: Aldine de Gruyter.
(2005). Energetic responses to food availability in the great apes: implications for hominin evolution. In Primate Seasonality: Implicationsfor Human Evolution, ed. D. K. Brockman & c. P. van Schaik. Cambridge: Cambridge University Press.
Lee, S. c., Prosky, L., & De Vries, J. W. (1992). Determination of total, soluble, and insoluble dietary fiber in foods - enzymatic - gravimetric method, MESTRIS buffer: collaborative study. Journal of the AOAC International, 75, 395-416.
Lipson, S. F. & Ellison, P. T. (1996). Comparison of salivary steroid profiles in naturally occuning conception and non-conception cycles. Human Reproduction, 11,2090-6.
Livesey, G. (2001). A perspective on food energy standards for nutrition labeling. British Journal of Nutrition, 85, 271-87.
Miles, C. W., Kelsay, J. L., & Wong, N. P. (1988). Effect of dietary fiber onJhe metabolizable energy of human diets . Journal of Nutrition , 118, 1075-8l.
Milton, K. & Demment, M. W. (1988). Chimpanzees fed high and low fiber diets and comparison with human data. Journal of Nutrition , 118, 1082-8.
Milton, K. & Dintzis, F. R. (1981). Nitrogen-to-protein conversion factors for tropical plant samples. Biotropica, 13, 177-8l.
Moughan, P. J. (1999). In vitro techniques for the assessment of the nutritive value of feed grains for pigs: a review. Australian Journal of Agricultural Research, 50, 871-9.
Nakagawa, N. (1997). Determinants of the dramatic seasonal changes in the intake of energy and protein by Japanese monkeys in a cool temperate forest. American Journal of Primatology, 41, 267-88.
(2000) . Foraging energetics in patas monkeys (Erythrocebus patas) anp tantalus monkeys (Cercopithecus aethiops tantalus): implications for reproductive seasonality. American Journal of Primatology, 52, 169- 85.
N. R. C. (National Research Council) (1980). Recommended Dietary Allowances (RDA), 9th edn. Washington, DC: National Academy Press.
(1981). Nutl'itional Energetics of Domestic Animals & Glossary of Energy Terms, 2nd revised edn. Washington, DC: National Academy Press.
(1989). Recommended Dietary Allowances (RDA), 10th edn. Washington, DC: National Academy Press.
(2003). Nutrient Requirements of Nonhuman Primates, 2nd revised edn. Washington, DC: National Academy Press.
Pierce, W . C. & Haenisch, E .L. (1947). Quantitative Analysis, 3rd edn. New York, NY: John Wiley & Sons.
Pontzer, H. & Wrangham, R. W. (2004). Climbing and the daily energy cost of locomotion in wild chimpanzees: implications for hominoid locomotor evolution. Journal of Human Evolution, 46, 317-35.
Energy intake by wild chimpanzees and orangutans 465
Robertson, J. B. & van Soest, P . J. (1980). The detergent system of analysis and its application to human foods. In The Analysis of Dietary Fiber in Food, ed. W. P. T. James & O. Theander, pp. 123-58. New York, NY: Marcel Deld(er.
Schneider, B. H. & Flatt, W. P. (1975). The Evaluation of Feeds through Digestibility Experiments. Athens, GA: The University of Georgia Press.
Schoener, T. (1987). A brief history of optimal foraging ecology. In Foraging Behavior, ed. A. C. Kamil, J. R. Krebs, & H. R. Pulliam, pp. 5-67. New York, NY: Plenum Press.
van Soest, P. J. (1994). Nutritional Ecology of the Ruminant, 2nd edn. Ithaca, NY: Comstock Publishing Associates.
van Soest, P. J., Uden, P., & Wrick, K. F. (1983). Clitique and evaluation of markers for use in nutrition of humans and farm and laboratory animals. Nutrition Reports International, 27, 17-28.
Wasserman, M. D. & Chapman, C. A. (2003). Determinants of colobine monkey abundance: the importance of food energy, protein and fibre content. Journal of Animal Ecology, 72,650-9.
Watkins, B. E., Ullrey, D. E., & Whetter, P. A. (1985). Digestibility of a high-fiber biscuit-based diet by black and white colobus (Colobus guereza). American Journal of Primatology, 9, 137-44.
Watt, B. K. & MelTill, A. L. (1963). Composition of foods: raw, processed, prepared. In Agricultural Handbook 8. Washington, DC: United States Department of Agriculture, Agricultural Research Service.
Wrangham, R. W., Conklin-Brittain, N. L., & Hunt, K. D. (1998). Dietary response of chimpanzees and cercopithecines to seasonal variation in fruit abundance. 1. Antifeedants. International Journal of Primatology, 19, 949-70.